
Abstract
We report regional rates of cerebral protein synthesis (rCPS) measured with the fully quantitative
Introduction
Biosynthesis of proteins is a fundamental process necessary for the physiological maintenance and functioning of organisms. In the central nervous system (CNS), de novo protein synthesis is critical for adaptive responses such as long-term memory formation. Animal studies indicate that the rate of cerebral protein synthesis (rCPS) is altered in models of various clinical conditions including fragile X syndrome (Qin et al, 2005), phenylketonuria (Smith and Kang, 2000), ischemia/stroke (Widmann et al, 1991), CNS tumors (Widmann et al, 1992), epilepsy (Collins et al, 1980), and in certain physiologic states such as slow-wave sleep (Nakanishi et al, 1997). Studies in rodents have demonstrated that rCPS changes during the process of aging (Ingvar et al, 1985) and during brain development (Sun et al, 1995). Activity-dependent protein synthesis is thought to be an integral step in many forms of synaptic plasticity (Nguyen et al, 1994), and, in a study of developmental plasticity in monkeys, we found regionally selective changes in rCPS (Kennedy et al, 1981). Variations in rCPS likely reflect adaptive processes taking place over a longer period of time compared with the acute physiological changes signaled by positron emission tomography (PET) measurements of regional cerebral metabolic rate for glucose or cerebral blood flow. Thus, changes in rCPS are expected to provide complementary information to existing PET radiotracers on elucidating CNS processes. On the basis of the findings in rodents and monkeys, we anticipate that the
With the recently developed and validated
Although the
Materials and methods
Subjects
Eighteen to 24-year-old male volunteers were prospectively evaluated by clinical history, physical examination, and a structured clinical interview, which is designed to identify psychiatric diagnoses based on DSM-IV criteria (Ventura et al, 1998). Inclusion criteria were (1) no current or past diagnoses of psychiatric, neurologic, or chronic medical condition; (2) no history of neurologic trauma; (3) no family history of genetically transmissible neurologic syndrome; and (4) HIV negative. Subjects were excluded if they did not meet all inclusion criteria. A total of 10 right-handed subjects (mean age: 22 years, range: 21 to 24 years) were included in the study. Each subject underwent two
Brain MRI
All subjects underwent a noncontrast T1-weighted MRI of the brain for region of interest (ROI) placement and to exclude structural brain abnormalities. Magnetic resonance imaging examinations were performed using a head coil on either a 1.5-T Signa (GE Medical Systems, Milwaukee, WI, USA) (eight subjects), or a 3-T unit (Phillips, Cleveland, OH, USA) (two subjects). Typical imaging parameters were three-dimensional fast spin gradient echo, echo time/repetition time: 9 ms/2 ms, 20° flip angle, 1 net excitation, in plane field of view: 240 mm, 256 × 256 matrix, 1 mm slice thickness without interleaved slices. Images were reconstructed to voxel dimensions of 0.94 × 0.94 × 1 to 1.3 mm, and interpolated to voxel dimensions of 0.94 mm3. Magnetic resonance imaging in one subject was reconstructed to voxel dimensions of 1 mm3. Regions of interest were placed on each MRI by visually identifying anatomic landmarks, and manually outlining the individual regions and whole brain.
l -1-11C]Leucine Synthesis
Positron Emission Tomography Studies
Subjects were instructed to consume a high protein snack and then fast for 8 h before each PET study. On the morning of the study, arterial and intravenous lines were placed in the radial artery of the nondominant hand and contralateral antecubital fossa, respectively. Subjects were also fitted with a headband to which targets for the Polaris® optical tracking system (Northern Digital Inc., Waterloo, ON, Canada) had been attached. Position information was continuously recorded throughout the scanning procedure to allow for motion correction of the emission data during image reconstruction. Positron emission tomography studies were performed on the ECAT high-resolution research tomograph (CPS Innovations, Knoxville, TN, USA). Subjects were positioned in the scanner and a 3-min transmission scan was acquired for optimal subject positioning within the field of view. A 6-min transmission scan was then obtained for attenuation correction. Ninety-minute dynamic emission scans were initiated coincident with the intravenous infusion of 20 to 30 mCi of
Data were acquired in list mode and reconstructed using the motion-compensated three-dimensional ordinary Poisson ordered subset expectation maximum algorithm (30 subsets, 2 iterations). Spatial resolution after reconstruction was approximately 2.6 mm FWHM (full width at half maximum) in the radial and transverse directions (Carson et al, 2003). Three-dimensional frames of data were reconstructed to 207 slices 1.23-mm thick (no interleaved slices) with a pixel size of 1.21 × 1.21 mm. The transverse and axial fields of view are 31.2 and 25.2 cm, respectively (Wienhard et al, 2002). Images were reconstructed as 42 frames of data (16 × 15, 4 × 30, 4 × 60, 4 × 150, and 14 × 300 secs). All activities were decay corrected to the time of radiotracer injection.
[11C]Leucine Blood Sample Analysis
Arterial blood sampling was initiated concurrently with the start of the [11C]leucine infusion to determine the time courses of the concentrations of unlabeled and labeled leucine in plasma and total 11C and 11CO2 activities in whole blood. Timed samples were hand drawn continuously (~one sample/4 to 6 secs) for the first 2 to 4 mins, and at increasing intervals thereafter for a total of ~40 samples per study.
The procedure apportioned blood samples as follows: (1) approximately 0.2 to 0.3 mL of whole blood was transferred to a preweighed tube containing 1 N NaOH; the tube was immediately reweighed and counted in a gamma counter (Cobra II Auto Gamma; Packard Instrument Co. Inc., Downers Grove, IL, USA) to obtain total activity in whole blood. (2) Approximately 0.5 mL was centrifuged to remove red cells and 0.2 mL of plasma from each sample was diluted in distilled water and deproteinized at 4°C by the addition of a solution of 16% (w/v) sulfosalicylic acid containing
Positron Emission Tomography Data Analysis
For each study, a three-dimensional volume was constructed from the average of the emission data acquired between 30 and 60 mins. This volume was isotropically smoothed with a Gaussian filter (FWHM 3 mm) and aligned to the MRI volume by use of the Flexible Image Registration Toolbox (Fischer and Modersitzki, 2004) with a three-dimensional rigid body transformation. The resliced average 30– to 60-min PET image was visually reviewed for correct alignment with the MRI by use of Vinci software (Volume Imaging in Neurological Research, Co-Registration and ROIs Included, Max Planck Institute for Neurological Research, Cologne, Germany). The transformation parameters were then applied to each frame of the PET study (without prior smoothing) to effect their alignment with the MRI volume. Regions of interest drawn on MRIs were transferred to
Kinetic Model
The model for the behavior of leucine in brain (Schmidt et al, 2005) (Figure 1) includes four rate constants: K1 and k2 for carrier-mediated transport from plasma to brain and back from brain to plasma, respectively; k3 for metabolism of leucine to yield CO2; and k4 for incorporation of leucine into protein. The rate constants are identical for labeled and unlabeled leucine. In light of the long average half-life (> 3 days) of brain protein (Lajtha et al, 1976), we know that the rate constant for the breakdown of unlabeled tissue protein, k5, is very small. In the case of unlabeled protein, k5 acts on the large pool of brain protein producing a significant amount of unlabeled leucine in the tissue. In the case of labeled protein, k5 acts on the very small pool of labeled protein produced during the study duration. We assume, therefore, that there is no significant breakdown of the labeled protein during the experimental interval. We also assume that unlabeled leucine and protein are in a steady state.
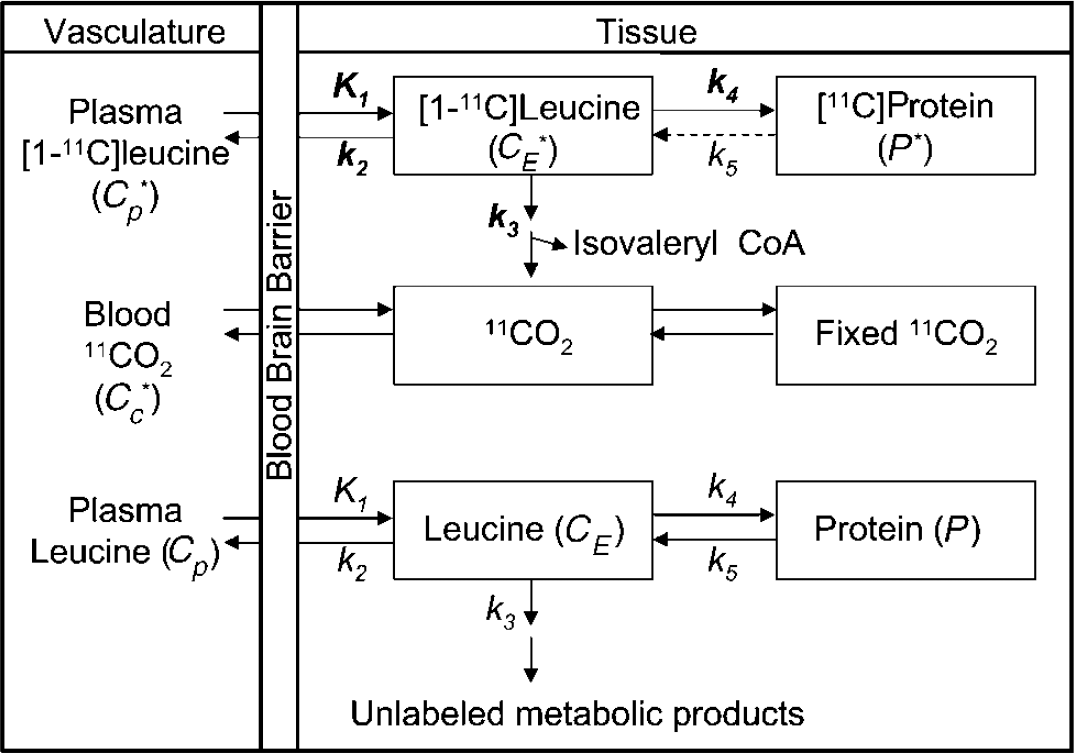
Compartmental model for the
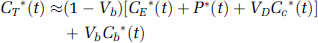
The total concentration of 11C in the field of view of the PET camera (C T *) at time T includes free [11C]leucine and [11C]leucine incorporated into protein in the tissue (C E * and P*, respectively) as well as activity in the blood in the brain (V b C b *, where V b is the fraction of the volume occupied by blood and C b * is the concentration of activity in whole blood). It also includes the labeled products of [11C]leucine metabolism: 11CO2 and products of 11CO2 fixation. We assume negligible fixation of 11CO2 during the experimental period (Buxton et al, 1987; Siesjo and Thompson, 1964), and that diffusible 11CO2 in brain rapidly equilibrates with the arterial blood (Buxton et al, 1987), that is, its concentration can be approximated by V D Cc*, where C c * is the 11CO2 activity in whole blood and V D is the brain/blood equilibrium distribution volume of 11CO2. Therefore
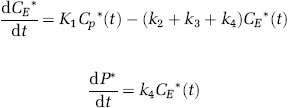
Time courses of C c *, C b *, and plasma [11C]leucine concentration (C p *) are measured from arterial blood samples taken at the time of the PET study. For any set of rate constants, the time courses of C E * and P* can be calculated from C p * by solving the differential equations corresponding to the compartmental model:
Rate constants are estimated by the method described below; rCPS can then be determined by the relationship

where C p is the plasma concentration of unlabeled leucine. In terms of K, the net uptake rate constant for [11C]leucine, rCPS can also be expressed as
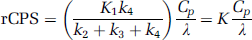
where Λ is the fraction of leucine in the precursor pool for protein synthesis derived from arterial plasma. Although rCPS may be directly calculated from equation 3, the importance of Λ arises from its physiologic relevance. Without knowledge of Λ, it is not possible to distinguish whether changes in rCPS between states/conditions are primary effects or are secondary to changes in Λ or some combination of the two. This was originally elucidated in the development the

Rate Constant Estimation
For each ROI, including whole brain, the rate constants (K1, k2+ k3, and k4) and the blood volume (Vb) were estimated using a weighted, nonlinear least-squares method to fit the model equation for total activity (equation 1) to the measured [11C]leucine activity in plasma, total 11C, and 11CO2 activity in blood, and total activity in the ROI. The equilibrium brain/blood distribution ratio for 11CO2 was fixed at the value measured in rhesus monkeys (V D = 0.41; Smith et al, 2005), a value in agreement with the mean whole brain/plasma distribution volume determined from 11CO2 studies in humans (Brooks et al, 1984). (The blood/plasma equilibrium distribution ratio for 11CO2 in human subjects is close to unity; Gunn et al, 2000). Weights were inversely proportional to the standard deviation of the decay-corrected activity in each frame of data. Assuming Poisson statistics that the counts originate only in the region itself and that there are no other noise effects such as randoms or deadtime, the standard deviation was modeled as:

where γ is the decay constant for 11C, t i is the midpoint of Frame i, Δt i is the length of Frame i, and N is a coefficient of proportionality. The difference between the tracer arrival time in the brain and the arterial sampling site was estimated by shifting the blood curves from 0 to 20 secs, fitting the whole brain time-activity curve, and selecting the delay time that produced the best fit of the data. Tracer appearance times in various parts of the brain differ from the mean of the brain as a whole by ± 2 secs (Iida et al, 1988); therefore, in each study the whole brain tracer arrival delay value was used for all regions.
After estimation of the rate constants, Λ and rCPS were calculated from the estimated rate constants and the measured plasma leucine concentration by equations 3 and 5.
Statistical Analyses
Differences between studies in baseline plasma leucine concentration, regional estimates of the kinetic model parameters K1 k2 + k3, k4, V b , estimates of tracer arrival delay, and regional values of Λ and rCPS were tested for statistical significance by means of paired two-tailed Student's t-tests. Bonferroni corrections for comparisons in 18 regions and whole brain were made, and corrected P-values are reported.
Results
Baseline physiologic variables obtained immediately before each PET study were within normal limits and were similar between studies (Table 1). Time courses of the plasma [11C]leucine, whole blood total 11C, and whole blood 11CO2 concentrations from a typical study are shown in Figure 2. Plasma [11C]leucine and whole blood total activities generally peaked in the first or second sample after the end of tracer infusion. Plasma [11C]leucine then cleared at a progressively decreasing rate during the 90-min study interval. After the initial peak, whole blood total activity decreased until 35 to 40 mins and gradually increased thereafter. Blood 11CO2 concentrations were low throughout the study, peaking at 25 to 30 mins to ~13% of total blood activity and gradually decreasing thereafter (Figure 2). Baseline plasma unlabeled leucine concentrations (C p ) were similar for Study 1 (intersubject mean 103; range: 60 to 137 nmol/mL) and Study 2 (intersubject mean 110; range: 67 to 150 nmol/mL); concentrations remained relatively constant in all studies. To quantify deviation from the mean C p in each individual study, the coefficient of variation (CV) was calculated for the 90-min study period. Coefficients of variation were low in all studies, and did not differ between Study 1 (mean 3.2%, range: 0.8% to 6.4%) and Study 2 (mean 4.4%, range: 0.6% to 10%). The concentrations of other large neutral amino acids that compete with leucine for entry into brain (methionine, valine, isoleucine, tyrosine, and phenylalanine) were also measured and found to be relatively constant within a study and did not differ significantly between Study 1 and Study 2.
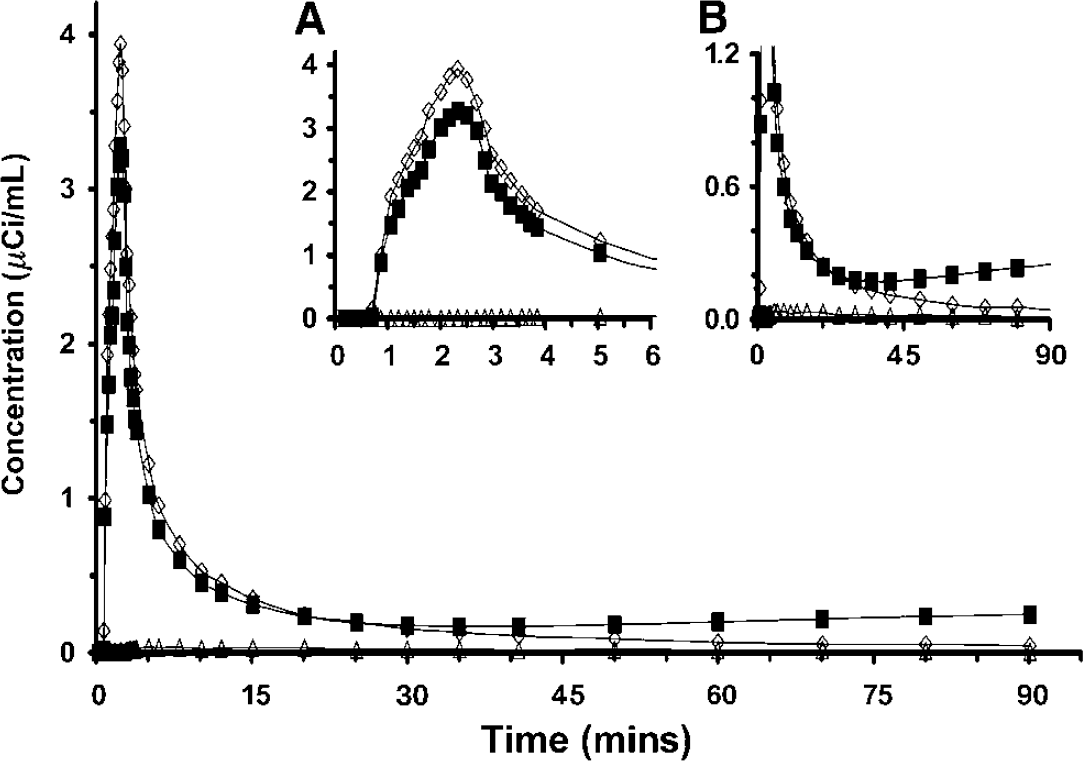
Arterial clearance curves from one study. Open diamonds (◊) represent plasma [11C]leucine concentration, solid squares (■) represent whole blood total 11C concentration, and open triangles (δ) represent whole blood 11CIO2 concentration. (Inset
Physiologic variables
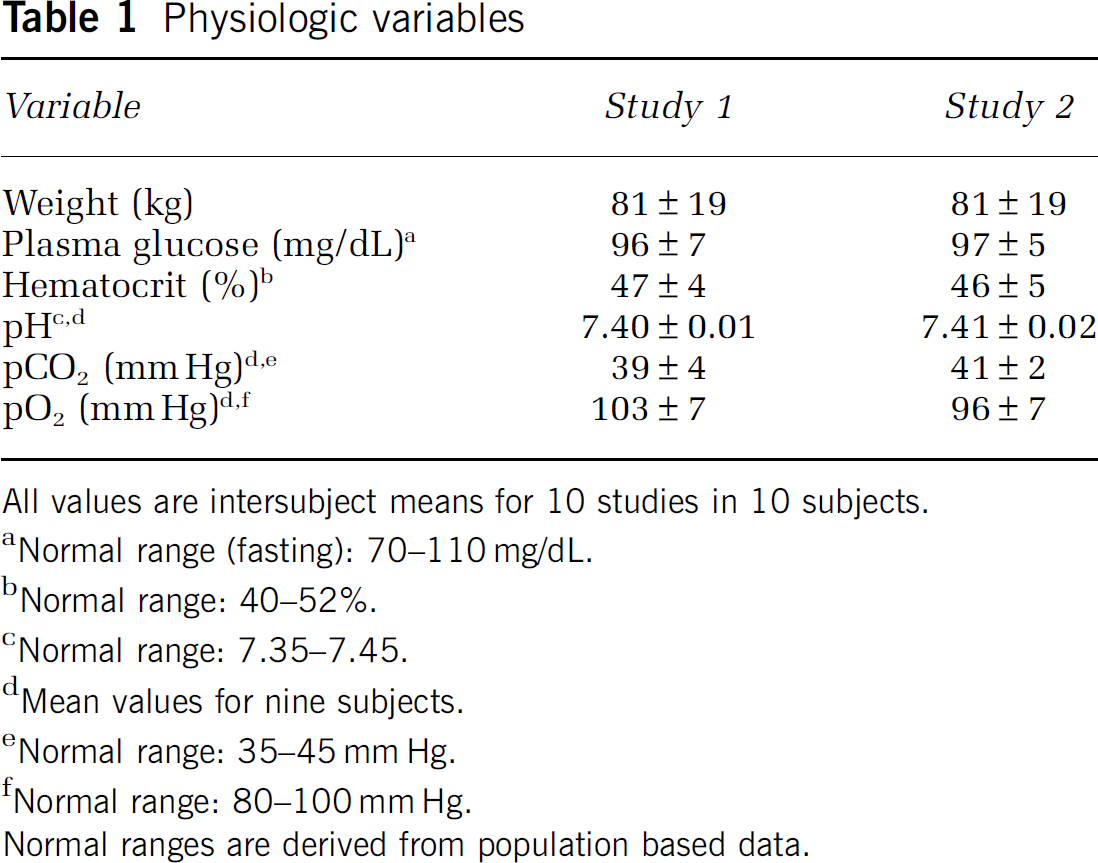
All values are intersubject means for 10 studies in 10 subjects.
Normal range (fasting): 70–110 mg/dL.
Normal range: 40–52%.
Normal range: 7.35–7.45.
Mean values for nine subjects.
Normal range: 35–45 mm Hg.
Normal range: 80–100 mm Hg.
Normal ranges are derived from population based data.
Measured time—activity curves for a cortical and white matter region in one study are shown in Figures 3A and 3B, respectively. Total activity peaked at 5 to 7 mins in most regions, with some regions demonstrating an additional earlier smaller peak, which corresponded in time to the peak in the whole blood total 11C activity. Measured activity in most ROIs then decreased reaching a nadir at 30 to 40 mins, reflecting clearance of free [11C]leucine that was more rapid than the accumulation of labeled protein. Thereafter, activity either increased slowly through the end of the experimental interval or remained relatively constant, reflecting a rate of accumulation of labeled protein greater than or equal to the rate of clearance of free [11C]leucine from the precursor pool.

Time courses of activity in (
Regional estimates of rate constants and V b (Table 2) were used to calculate model-predicted time courses of 11C activity in tissue distributed among the blood, free [11C]leucine, 11CO2, and [11C]protein pools (Figure 3). Model-predicted activity in the free [11C]leucine pool steadily rises for 5 to 7 mins and then begins to clear, whereas activity in the [11C]protein pool increases throughout the study. Model-predicted activity in the blood in brain initially comprises a significant fraction of total activity in the ROI, but decreases to < 10% by 10 mins and remains low for the balance of the study. In the present study, model-predicted values of [11C]protein, [11C]leucine, and 11CO2 in brain were typically 90%, 5% to 8%, and 1% to 2%, respectively, of measured total 11C activity in an ROI at 90 mins. The remaining 4% to 5% of the total activity in the ROI was intravascular.
Estimated kinetic model parameters
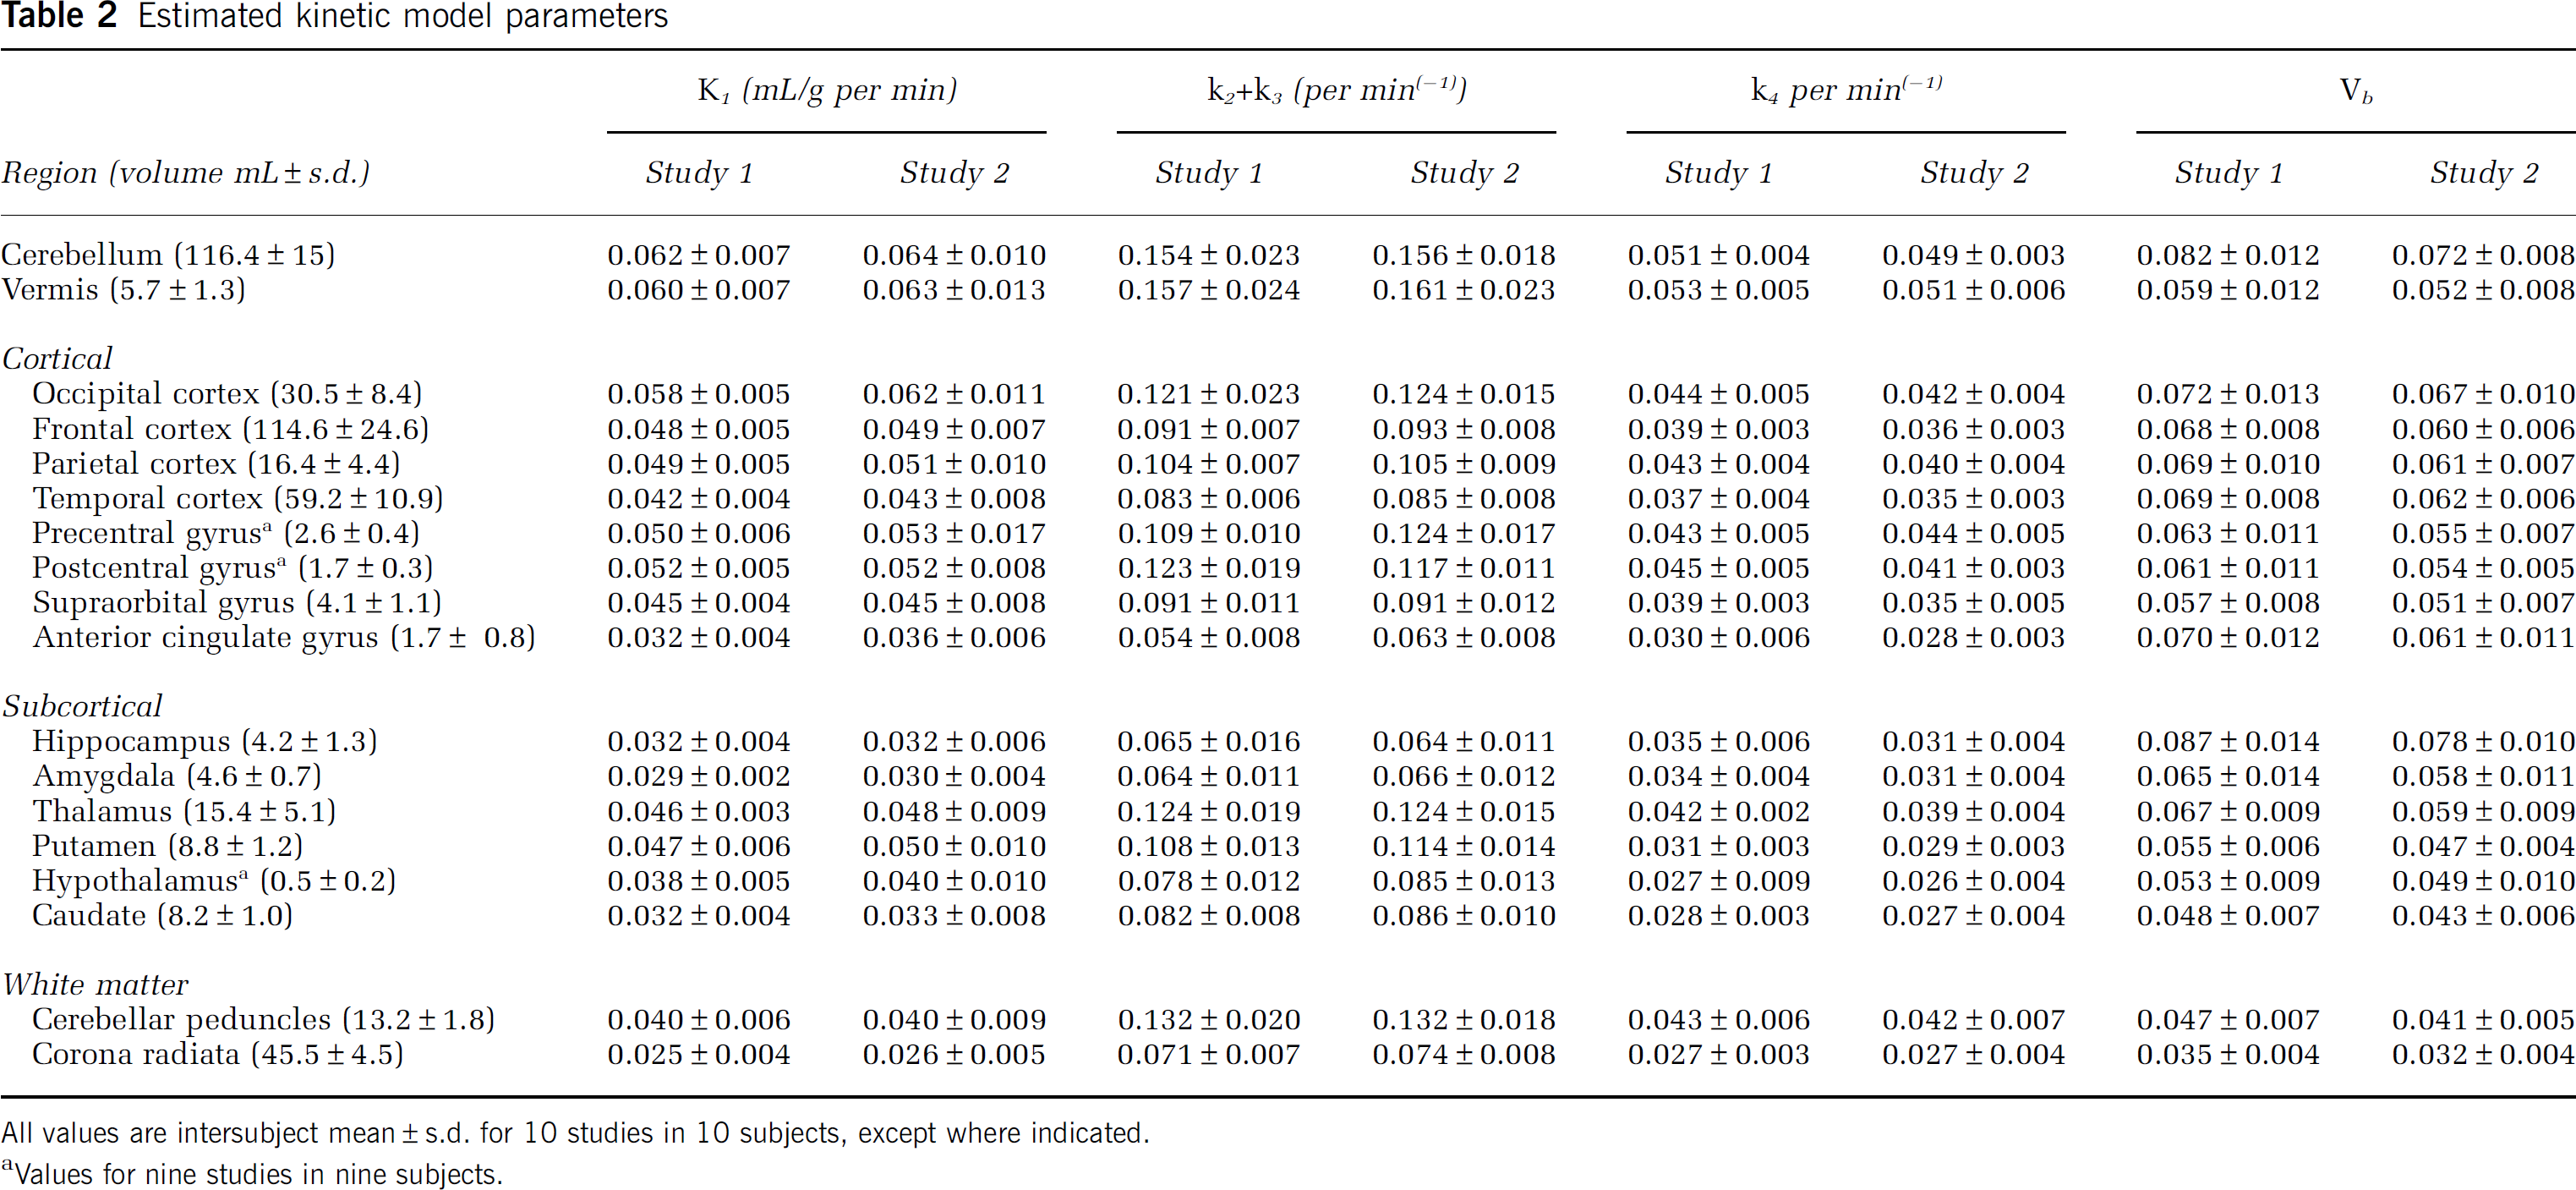
All values are intersubject mean ± s.d. for 10 studies in 10 subjects, except where indicated.
Values for nine studies in nine subjects.
Estimates of rate constants varied regionally and tended to be highest in cerebellum and vermis followed by cortical regions. They were typically lowest in the corona radiata. Intersubject variability in the estimates of the rate constants was generally low, and we found good agreement between estimates in Study 1 and Study 2. Estimates of tracer arrival delay in whole brain (Study 1: 8.9 ± 4.7 secs; Study 2: 9.8 ± 3.7 secs) were also similar between Study 1 and Study 2. In the brain as a whole in Study 1 and Study 2, estimates of K1 were 0.043 ± 0.004 and 0.045 ± 0.008 mL/g per min, respectively; estimates of k2 + k3 were 0.097 ± 0.008 and 0.099 ± 0.008/min(−1), respectively; estimates of k4 were 0.039 ± 0.003 and 0.037 ± 0.003/min(−1), respectively. Estimates of V b in whole brain were 0.068 ± 0.009 (Study 1) and 0.061 ± 0.006 (Study 2). We found no statistically significant differences in the estimated parameters between Study 1 and Study 2 in whole brain. Mean whole brain volume was 1454 ± 168 mL for the 10 subjects.
Mean regional values of Λ ranged from 0.65 to 0.79 (Table 3), with the lowest values in hippocampus and amygdala. Intersubject variability was low, ranging from 3% to 8%. In whole brain, values of Λ were 0.71 ± 0.03 and 0.73 ± 0.02 for Study 1 and Study 2, respectively. Only in the anterior cingulate were differences between studies statistically significant. Values in the anterior cingulate were 8% higher in Study 2.
Fraction of precursor pool derived from arterial plasma (Λ) and regional rates of cerebral protein synthesis

All values are intersubject mean ± s.d. for 10 studies in 10 subjects, except where indicated.
Values for nine studies in nine subjects.
Statistically significantly different from Study 1, P ≤ 0.05, paired t-test.
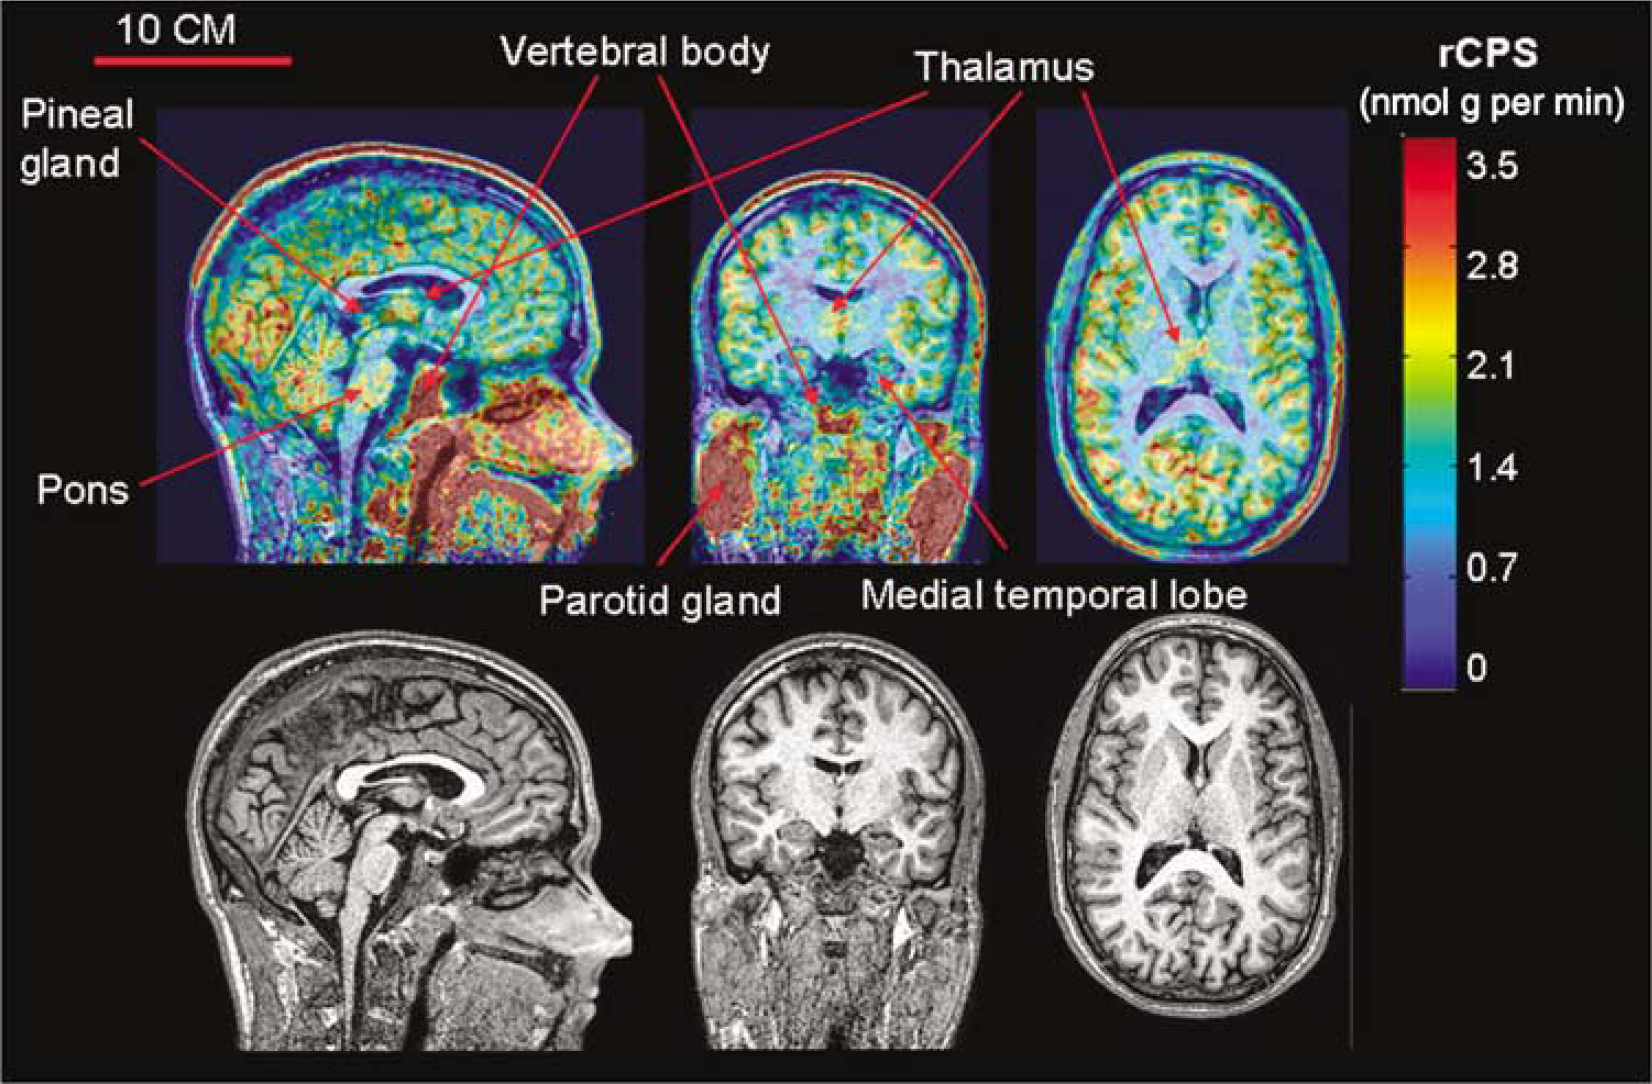
Rates of cerebral protein synthesis (Table 3) ranged from 2.3 nmol/g per min in occipital cortex to 1.0 nmol/g per min in corona radiata. Intersubject variability in rCPS was small: CVs varied regionally with the lowest mean CV in cortical (6%), followed by subcortical (9%) and white matter (12%) regions. Agreement between Study 1 and Study 2 was good; mean percentage differences in rCPS between studies were lowest in the cortical (9%) followed by subcortical (10%) and white matter regions (15%). There were no statistically significant differences in rCPS between Study 1 and Study 2 in any region. Whole brain rates of cerebral protein synthesis were 1.84 ± 0.10 and 1.81 ± 0.12 nmol/g per min in Study 1 and Study 2, respectively. Positron emission tomography images (Figure 4) reveal interesting patterns of high and low rCPS. Clearly areas of white matter tend to have lower rates than gray matter, but within gray matter rCPS is higher in occipital cortex and cerebellum with some focal areas of high activity in the thalamus and pons. The cortex is not uniform in relation to rCPS; for example, rCPS is higher in some frontal gyri compared with adjacent cortical areas. Areas of high activity outside the brain, such as the parotid glands, scalp muscles, and vertebral bodies are apparent in the coronal and sagittal views (Figure 4).
Discussion
Our results show the high reproducibility and low variability of the
The
Estimates of the fractions of 11C activity in the various chemical species in the current study in human subjects are in good agreement with values previously determined in
We scanned subjects for a total of 90 mins after injection of the tracer. This allowed most of the label in brain to be in the form of [11C]protein by the end of the study, thereby potentially allowing greater accuracy in estimating the rate of incorporation of [11C]leucine into [11C]protein and hence rCPS. Because 11C has a half-life of ~20 mins, noise due to low count rates increases substantially at late times and the increased noise may offset the advantage of scanning for 90 mins. It may be possible to obtain good estimates of Λ and rCPS with a shorter scanning interval; this possibility is under investigation in our laboratory.
Kinetic model considerations also affect the optimal scanning time. The kinetic model for
The purpose of the present study was to establish normal values in humans and evaluate the variability of the
In a recent study of rCPS with the
Sundaram et al (2006) studied a group of subjects (males and females) with a wide age range, whereas our study subjects were all males between the ages of 21 and 24 years. Studies in rodents have demonstrated significant decreases in rCPS in whole brain and several regions with increasing age (Qin et al, 2005; Smith et al, 1995; Sun et al, 1995). Inclusion of older subjects in the study may result in lower mean rCPS values and higher variability. The administration of an infusion of glucose before the study, a procedure designed to lower the concentration of circulating amino acids, was used in the study of Sundaram et al (2006). Following this procedure, mean plasma leucine concentration in their male subjects was 64 ± 20 nmol/mL, a value 40% lower than the mean value in our fasted subjects. Whether there are physiological effects in brain of such considerably lower plasma amino acid concentrations is not known. The scanner used by Sundaram et al (2006) had a lower spatial resolution than the high-resolution research tomograph used in the present study, possibly increasing the influence of partial volume effects. Even more important is the fact that in our study, ROIs were identified and drawn on each subject's MRI, whereas in the study of Sundaram et al (2006), ROIs were identified directly on the PET images. It is difficult to identify ROIs precisely on leucine PET images, and inclusion of tissue outside the anatomical boundaries of a region may result in increased variability. There are also other methodological differences between the two studies. In our study, the estimation interval used was 90 mins, whereas Sundaram et al (2006) used a 60-min interval. In addition, we took into consideration the delay in tracer arrival between brain and arterial sampling site. We also measured 11CO2 in arterial blood to evaluate the time course of 11CO2 in the brain. The most significant methodological difference between the two studies is probably in the determination of the input function. In our study, the time course of the arterial concentration of
We have determined rCPS across several species with either the autoradiographic
The
The precision shown in the present study coupled with the accuracy shown in validation experiments in nonhuman primates (Smith et al, 2005, 2008) indicates that the
Footnotes
Acknowledgements
We thank the following members of the PET Department: G Jacobs, S Sestrich, W Kong, M Der, J Divel, C Barker, and S Thada. We thank Dr H Chugani, Department of Pediatrics, Wayne State University School of Medicine for sharing
The authors have no duality of interest to declare.