51. Comparison of two deconvolution methods in a CBF study of lupus patients versus healthy controls with perfusion MRI
U. Sakoglu1, C. Gasparovic1,2, H.J. Bockholt1, C.R. Qualls3, J. Sharrar4, W. Sibbitt5 and C. Roldan4
1The Mind Research Network; 2Department of Neurology; 3Clinical Translational Science Center, GCRC; 4Department of Internal Medicine, Division of Cardiology; 5Department of Internal Medicine, Division of Rheumatology, University of New Mexico Health Sciences Center, Albuquerque, New Mexico, USA
Objectives: To compare an established and a recently developed deconvolution method to estimate cerebral blood flow (CBF) of lupus patients and healthy controls from dynamic susceptibility contrast MRI data.
Introduction: Estimating perfusion reliably in brain diseases reveals important information about the diseases' characteristics. Dynamic susceptibility contrast (DSC) MRI technique based on bolus-pass of contrast agent in the brain vasculature has proved to be a useful technique to estimate important perfusion parameters, such as the cerebral blood flow (CBF). The mathematical model based on DSC MRI technique that links the perfusion parameters and the MR signal involves a convolution relation,1 and requires the deconvolution of the voxel time-concentration curves by an arterial input function (AIF) to estimate CBF. Different deconvolution methods have been used to solve the problem within the last two decades. Among these, the circular singular value decomposition-based (oSVD) deconvolution method has been widely accepted.2 In this work, we have applied a recently developed Fourier Transform-based minimum mean-squared error (FT-MMSE) deconvolution method3,4 to estimate CBF in lupus patients and healthy controls and we compared the results of the new method with the established oSVD method.
Methods: Upon approval from institutional ethics review committee, subjects were recruited. In this work, data from 14 patients (ages 26 to 55) and 6 healthy controls (ages 21 to 54) were used. 1.5T Siemens Sonata MRI system was used to collect MRI data. 220 mm × 220 mm FOV, 128 × 128 matrix, 12 axial slices with thickness/gap: 5/5 mm, TR/TE: 1600/78 ms, 50 time-points were used for the T2*-weighted GE-EPI perfusion MRI scan. 0.1 mM/kg Gd-DTPA was administred 10 s after the scan start by 5 mls/s injector, followed by a saline flush. MATLAB-based program5 was used to perform deconvolution and to generate CBF maps with both methods based on the same AIF selection.3 The CBF maps were motion-corrected, coregistered and normalized to MNI EPI template by SPM5,6 and CBF in tissue with lesions (TWL) and normal tissue (NT) were measured.
Results: The preliminary results revealed the following:
CBF is significantly less in patients' TWL, when compared to their NT,
CBF in NT of patients was higher than NT of healthy controls,
significance of the results were more prominent with the FT-MMSE method when compared to the oSVD method.
The research is ongoing and the results need to be confirmed with greater subject population.
Conclusions: The preliminary results based on 14 lupus patients and 6 controls revealed significantly less CBF in lupus lesions but more CBF in their normal tissues when compared to controls. Significance of results were more pronounced by the FT-MMSE deconvolution method than by the oSVD method. The results, especially by FT-MMSE method, support the hypothesis that there is a compensatory flow in lupus patients with lesions.
208. Hemodynamic changes following wingspan stent placement—a quantitative magnetic resonance angiography study
S. Prabhakaran1, K. Wells2, M.D. Jhaveri2 and D.K. Lopes3
1Neurological Sciences; 2Radiology; 3Neurosurgery, Rush University Medical Center, Chicago, Illinois, USA
Background: Quantitative magnetic resonance angiography (QMRA) is a novel non-invasive imaging modality that combines time-of-flight MRA and phase-contrast imaging to provide anatomic visualization as well as blood flow measurements within arteries. No published data exists on the use of QMRA to assess hemodynamic changes following Wingspan stent placement for intracranial stenosis.
Methods: We retrospectively identified all patients at our institution who met the following criteria:
Wingspan stent placement for symptomatic >50% intracranial arterial stenosis;
baseline QMRA scan performed within 6 months prior to stent placement;
follow-up QMRA scan performed within 1 week following stent placement; and
high-quality QMRA images without motion artifact or technical errors.
Other socio-demographic, clinical, and imaging data were abstracted from medical charts. We compared volumetric flow rates (mL/min) pre- and post-stenting using paired t-tests. P<0.05 was considered significant.
Results: Among 9 patients who met above criteria (mean age 65.8 years), lesions were located in the supraclinoid internal carotid arteries in 3 patients, the middle cerebral arteries in 3, and intracranial vertebrobasilar arteries in 3. The mean pre-treatment stenosis was 71.0%+13.3%. The mean pre-treatment QMRA volumetric flow rate in the stenotic artery was 81.2+59.6 mL/min and increased to a mean of 133.3+21.5 mL/min (P = 0.020) or 64.2% after stenting. There was a strong positive correlation between change in volumetric flow rate and degree of stenosis prior to stenting (r = 0.705, P = 0.034). No correlation was seen between post-stent degree of stenosis and post-stent VFR or change in VFR. Total CBF, flow in non-stented vessels, and collateral flow in circle of Willis vessels did not significantly change.
Conclusion: We found that QMRA is a promising new non-invasive method for the measurement of cerebral hemodynamics following intracranial Wingspan stent placement. Larger prospective studies are needed to confirm our findings and increase our understanding of flow changes following endovascular interventions for intracranial stenosis.
215. Mapping the hemodynamic response function in the primary auditory cortex under normo- and hypercapnia
K.C. Mazzetto-Betti1, R.F. Leoni2,3, O.M. Pontes-Neto1, A.C. Santos1, A.C. Silva3 and D.B. De Araujo1,2
1Department of Neurology, Psychiatry and Medical Psycology, FMRP—University of São Paulo; 2Department of Physics and Mathematics, FFCLRP—University of São Paulo, Ribeirão Preto, Brazil; 3Laboratory of Functional and Molecular Imaging, National Institute of Neurological Disorders and Stroke, National Institutes of Health, Bethesda, Maryland, USA
Introduction: The cerebrovascular coupling forms the basis of modern functional neuroimaging techniques, such as functional MRI (fMRI). However, it is not fully understood how fMRI maps obtained during focal cognitive studies of the brain depend on the baseline cerebral blood flow. The purpose of this study is to quantify the amplitude and temporal characteristics of the blood oxygenation-level-dependence (BOLD) response to an auditory stimulus during normo- and hypercapnia in healthy subjects.
Methods: 20 healthy volunteers participated of this study (mean age: 23,6 year, 13 women). The protocol was composed by five intervals of a scrambled auditory stimulus (3 secs each) intercalated by six intervals of rest (21 secs each). Hypercapnia was achieved by a combination of air and CO2, delivered via a valve device controlled by a computer software. End-tidal CO2 (ETCO2) was measured by a MR-compatible device (Veris MR, Medrad, Pittsburgh, PA, USA). Hypercapnic challenge was measured in three levels of ETCO2 with respect to the basal condition of each subject: 5, 7, 10 mm Hg. MR images were acquired in a 3T scanner (Philips Achieva, The Netherlands). For each condition a series of 141 EPI volumes were acquired with the following parameters: TR = 1000 ms, TE = 30 ms, FA = 90°, resolution = 128 × 128, FOV = 230 mm, 21 slices, slice thickness = 4 mm. Image preprocessing consisted of slice time correction, temporal and spatial filtering (4 mm), and motion artifact correction, using the Brain Voyager™QX (Brain Innovation, Maatrich, The Netherlands). An autoregressive method was applied to analyze four parameters of the HRF: onset, time-to-peak, full-width-at-half-maximum (FWHM) and amplitude. Statistical analysis was conducted in GraphPad Prism, and consisted of an ANOVA followed by a Bonferroni correction.
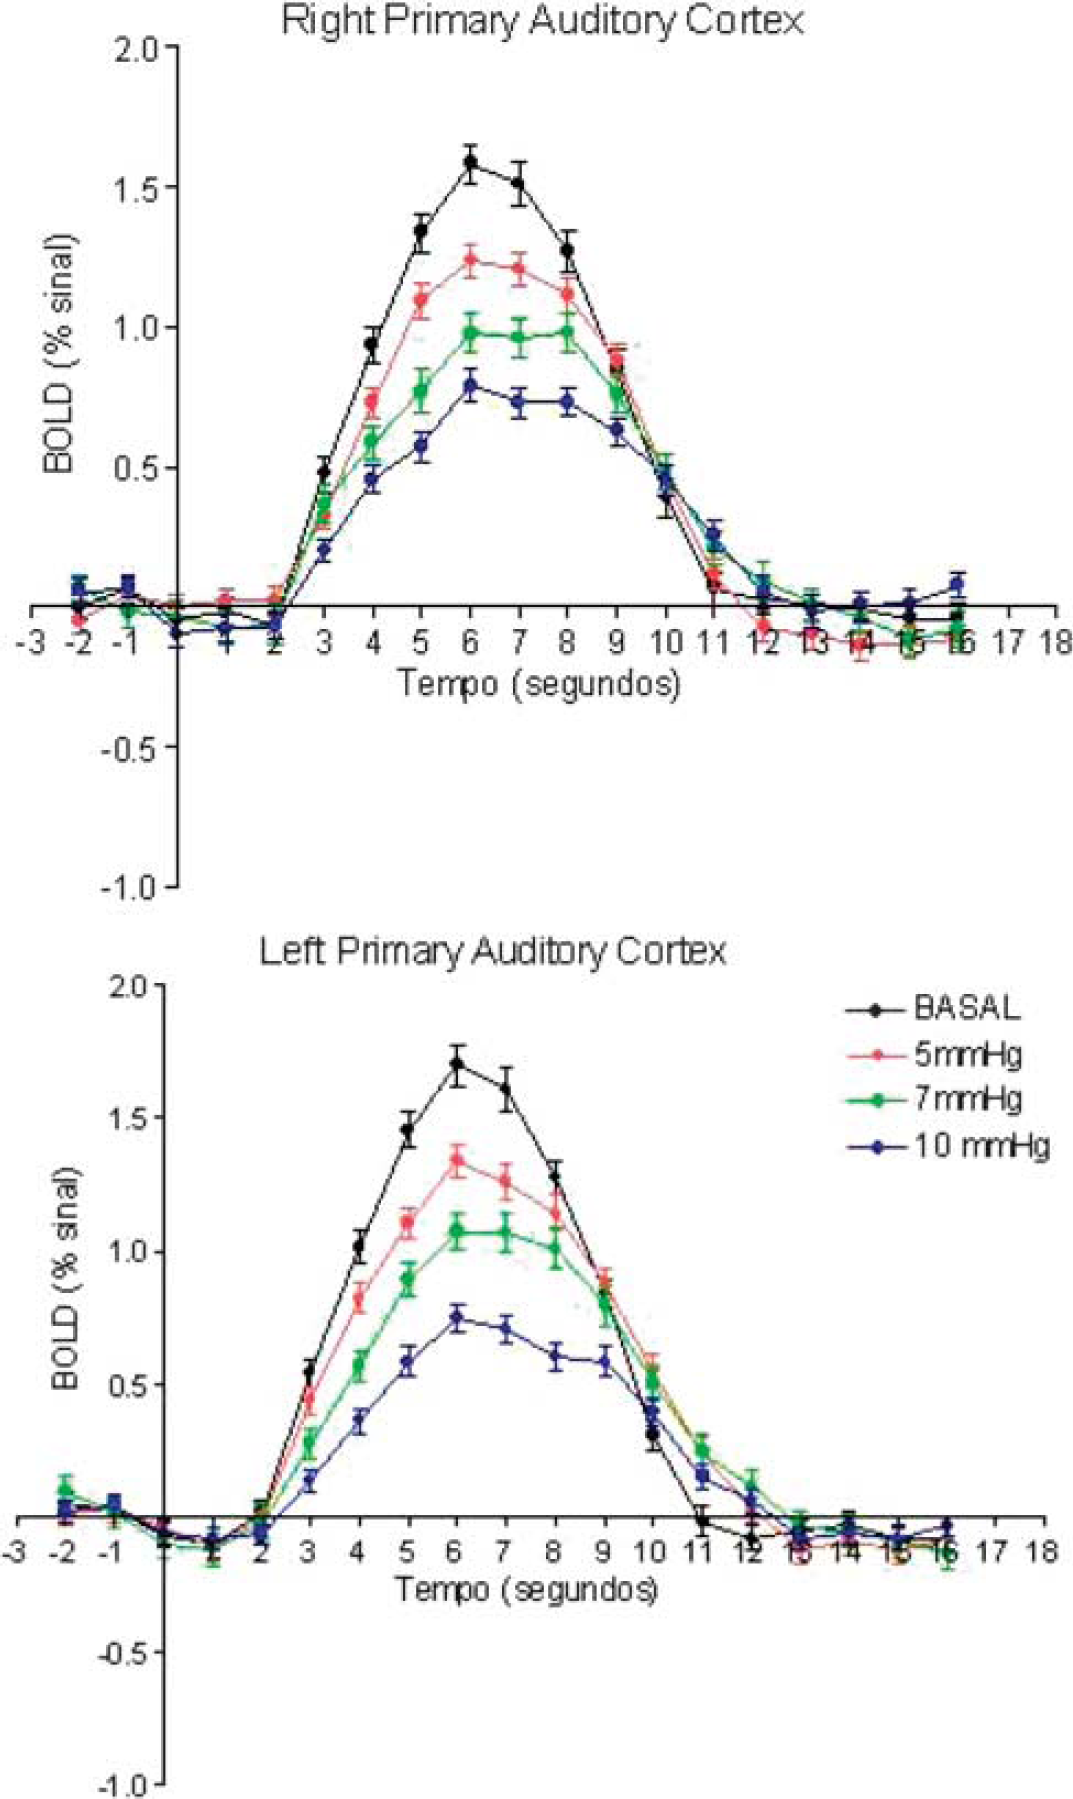
Results and discussion:Figure 1 shows the mean BOLD time-courses obtained at different CO2 levels from all subjects. In agreement with previous work in the visual cortex,1 the amplitude of the BOLD presented a significant decrease with increasing ETCO2 (P<0.001), presumably due a task-induced increase in CBF that is independent and additive to a CO2-induced increase in resting CBF.2 In addition, BOLD onset were longer for higher ETCO2 (P<0.001).1 However, the other temporal parameters FWHM and time-to-peak were not significantly different between normocapnia and hypercapnia. This could be either due to the short stimuli (3 s) employed here, which elicited brief BOLD responses in all cases, or due to a different cerebrovascular reactivity in auditory cortex relative to other areas of the brain.
Conclusion: The amplitude and onset time of the BOLD response to brief auditory stimuli were significantly modulated by hypercapnia, providing useful information about the cerebrovascular reactivity of the auditory cortex in healthy volunteers, and opening up the possibility of using fMRI and hypercapnia to evaluate patients of different cerebrovascular diseases.
253. Hypoperfusion in Parkinson's disease assessed by arterial spin labeling perfusion MRI
M. Fernández-Seara, M. Aznárez-Sanado, F. Loayza, F. Villagra and M. Pastor
Neuroscience, CIMA, University of Navarra, Pamplona, Spain
Objectives: Previous studies of cerebral perfusion in Parkinson's disease (PD) without dementia have yielded conflicting findings, with some reporting no deficits, others describing hypoperfusion and others reporting hyperperfusion.1 Arterial spin labeling (ASL) is an excellent tool to obtain quantitative maps of cerebral blood flow (CBF) non-invasively. The objective of our study was to assess resting CBF abnormalities in a group of PD patients using ASL and statistical parametric mapping (SPM).
Methods: Twelve medicated patients without dementia (3 females, age range (46 to 76), UPDRS range (6 to 21), 10 with predominant right side affectation) and 11 healthy age-matched controls were scanned on a 3T Trio after signing written informed consent. ASL images were acquired using a technique that combined pulsed continuous ASL2 with a background suppressed 3D GRASE sequence, modified to achieve late inflow delay,3 with parameters: labeling time = 1.6 s and post-labeling delay = 1.5 s. Scan time = 6 min. An anatomical dataset was also acquired. All data were analyzed using SPM5 and Matlab. Raw ASL images were realigned and co-registered to the anatomical dataset. Mean CBF maps were computed after subtraction of label and control images, based on a modified single compartment model,4 normalized to the MNI template and smoothed. Perfusion differences between patients and controls were assessed in a voxel-wise statistical analysis using two-sample t-test. Grand mean scaling to 50 ml/100g per min was included in the model. The significance level was set at P<0.05 uncorrected for multiple comparisons, cluster size >50.
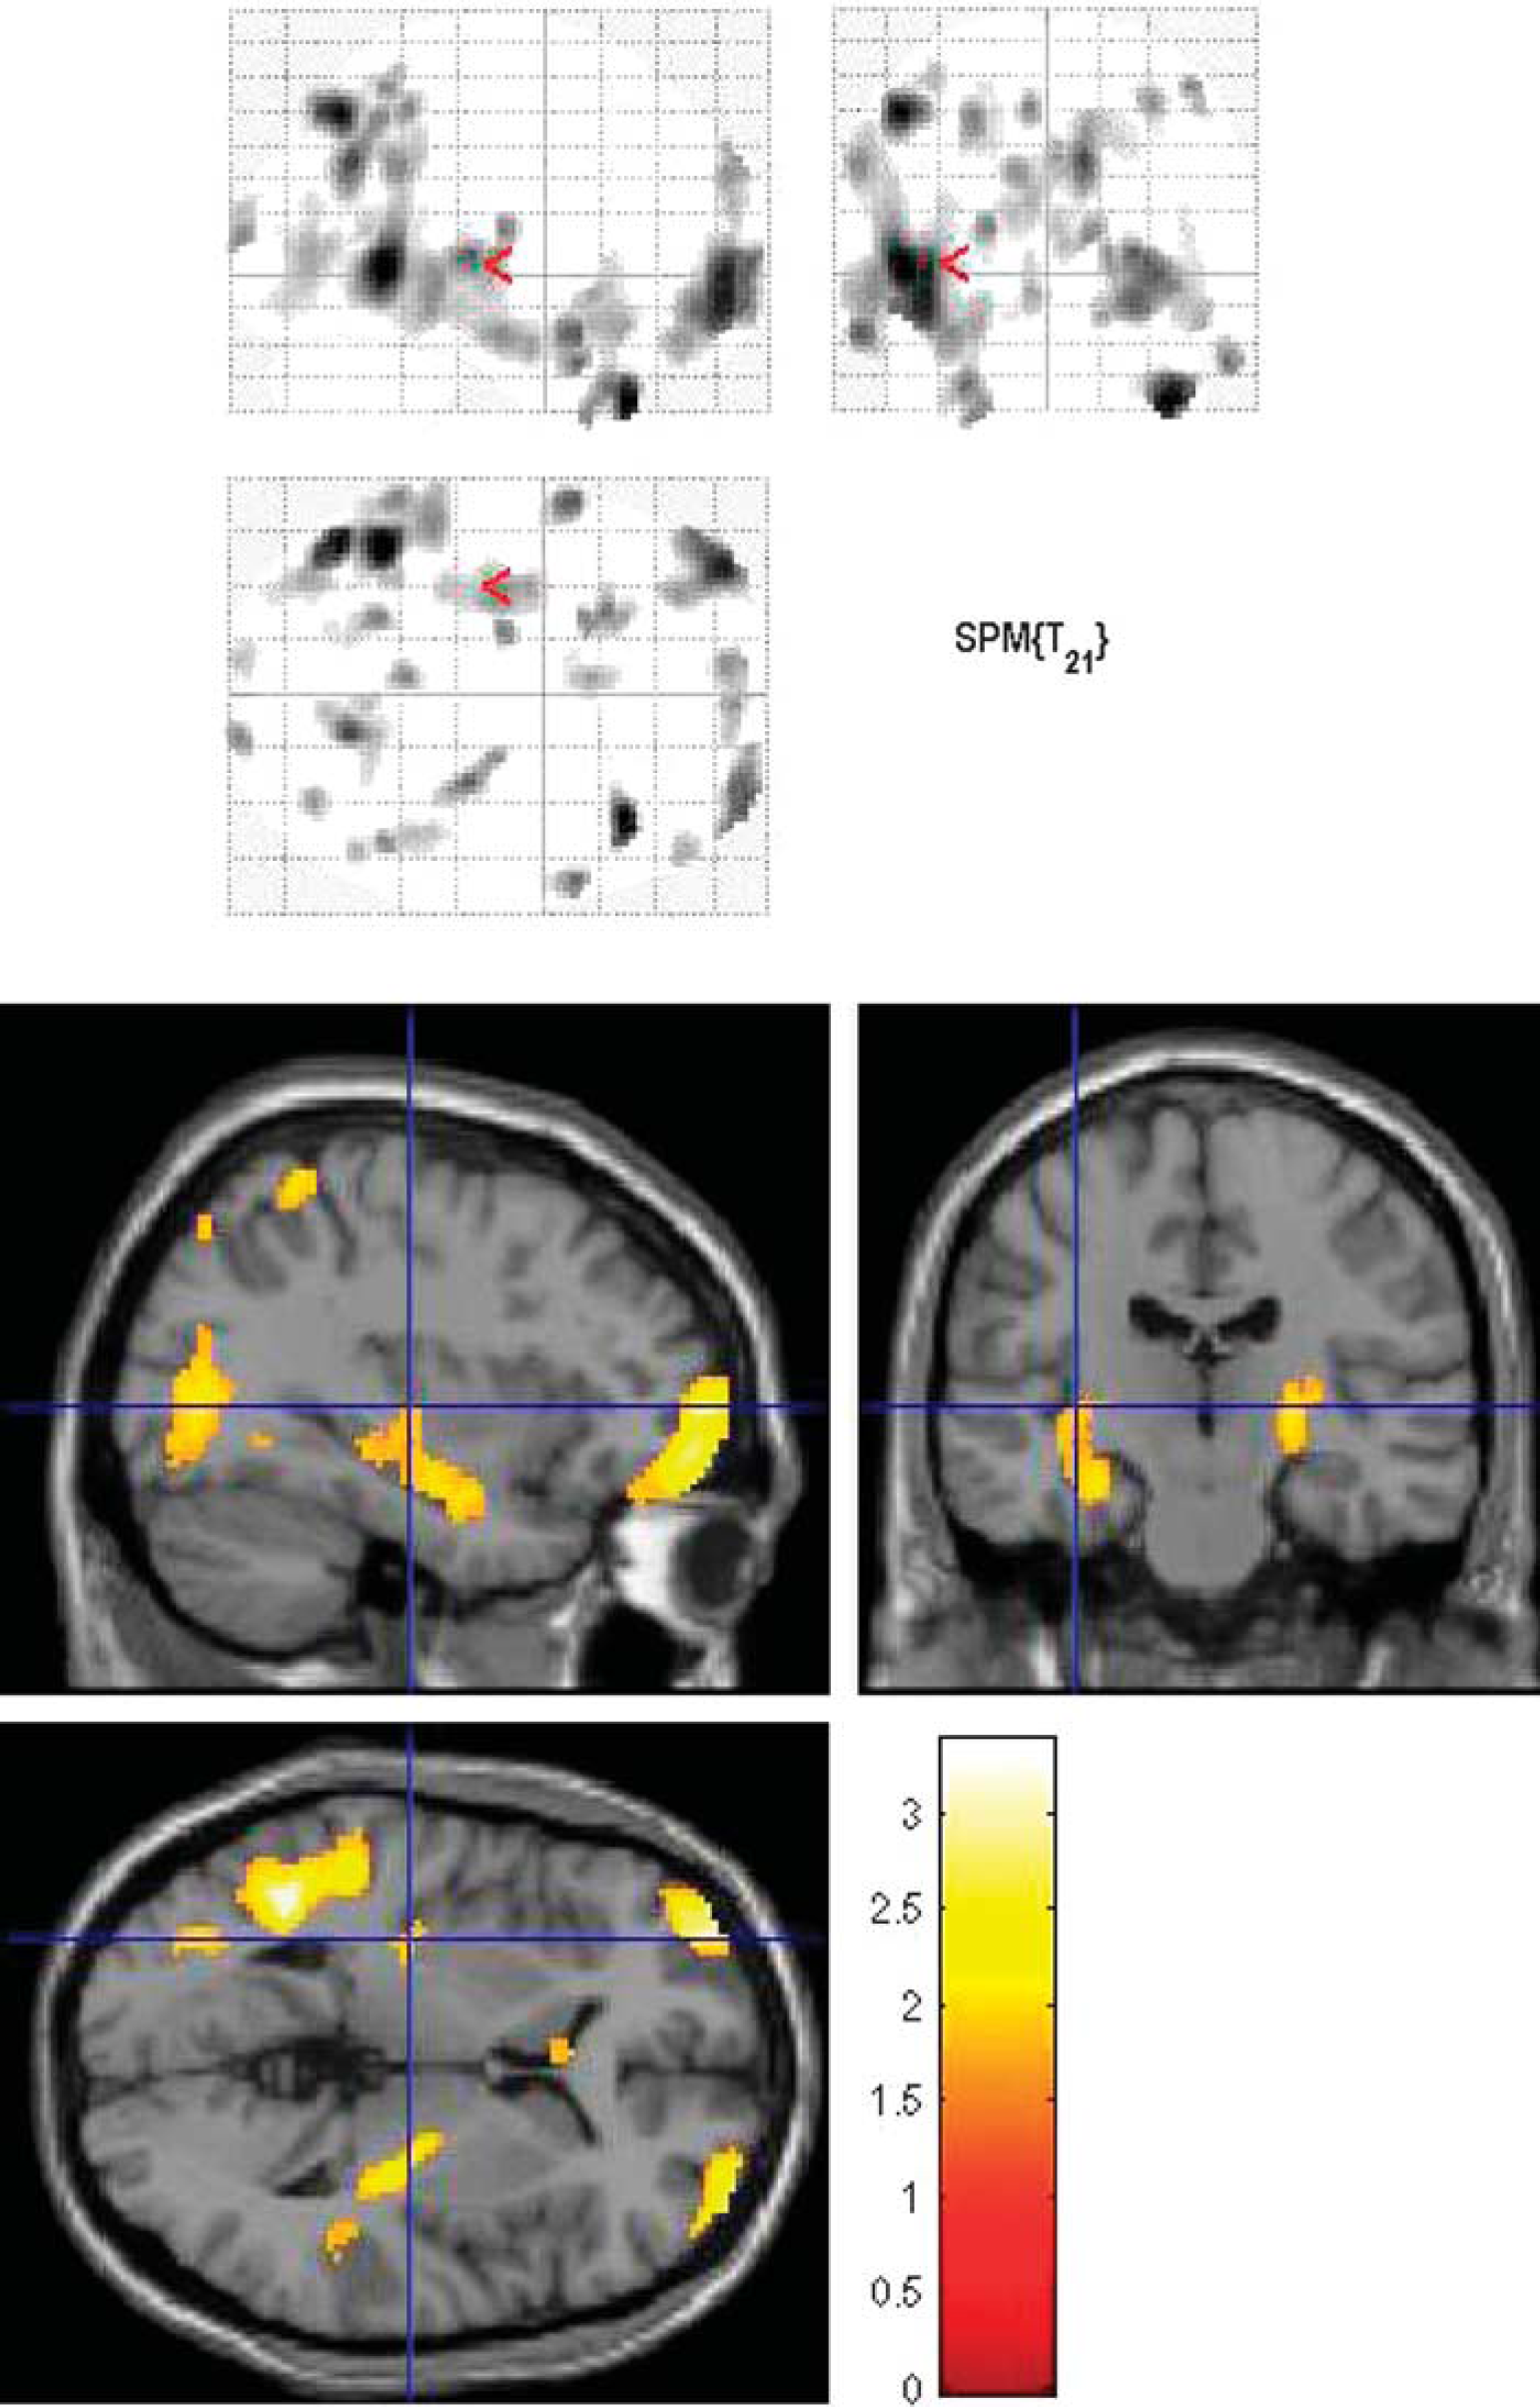
Results: Areas of hypoperfusion in the patients were (Figure 1): in the frontal lobes, bilaterally anterior prefrontal cortex and superior frontal gyrus; in the parietal lobe, right precuneus, bilaterally superior parietal lobules, left middle cingulate and posterior insula; in the temporal lobe, bilaterally middle temporal gyri with the larger cluster on left, the hippocampi, temporal poles and middle anterior temporal gyri; in the occipital lobe, left middle occipital gyrus; in the basal ganglia, right and left thalamus, left putamen tail and caudate nucleus, consistent with the predominantly right hemiparkinsonian affectation of our patient population. No regions of hyperperfusion were found.
Conclusions: The main areas of hypoperfusion found in the PD patients are known to be affected early during the disease course, such as the basal ganglia and their dopaminergic output, the prefrontal cortex. Other areas such as the middle temporal lobes surprisingly appear to be affected at a functional level before clinical manifestations are observed. Perfusion patterns in these areas could correlate with symptoms, especially cognitive changes that may be subclinical.
263. The reproducibility of the calibrated BOLD in health and disease
B. Ances1, F. Vaida2 and R. Buxton3
1Neurology, Washington University in St Louis, Saint Louis, Missouri; 2Medicine; 3Radiology, University of California at San Diego, San Diego, California, USA
Background and aims: Reproducibility studies of blood oxygen level dependent (BOLD) functional magnetic resonance imaging (fMRI) are needed to understand basic physiology of neurovascular coupling as a single scan may be affected by a subject's performance, variations in scanner hardware, or biological factors. We assessed the reproducibility of calibrated BOLD fMRI in both HIV infected subjects (HIV+) and healthy controls (HIV−).
Methods: BOLD and cerebral blood flow (CBF) responses were obtained from 8 HIV+ subjects and 10 HIV− controls, from 20 to 45 years old, on a 3 Tesla General Electric scanner at two separate scanning sessions separated by at least 3 months. All subjects underwent calibrated BOLD studies consisting of both mild hypercapnia and functional activation experiments. Mild hypercapnia provided a calibration method for calculating functional CMRO2 changes. Functional activation consisted of a black and white radial checkerboard flickering at 8 Hz. Clusters of CBF activated voxels within the visual cortex (VC) were assessed. The coefficient of variation (CV), a normalized measure of dispersion of a probability distribution, was determined for each calibrated BOLD measures outcome (functional changes in CBF, BOLD, and cerebral metabolic rate of oxygen consumption (CMRO2)) within both HIV+ and HIV− subjects. A variance components random effects model was used for each fMRI variable.
Results: The median age for HIV+ subjects and HIV− controls was similar with no significant differences observed for either sex or education. For HIV− controls the intrasubject CV values for functional BOLD, CBF, and CMRO2 were 8.8%, 10%, and 10.5% respectively. For these individuals total variability was greatest for functional CMRO2 (47.3%) compared to either CBF (30.1%) or BOLD (16%). For HIV+ subjects, intrasubject variability was greater for each of the functional measures—38.8% for CBF, 69.8% for BOLD, and 11.2% for CMRO2. Total variability was also increased for HIV+ subjects for each of these fMRI measures (61% for CBF, 74.6% for BOLD, and 17% for CMRO2).
Conclusions: HIV+ subjects have greater total variability than HIV− controls for measured functional changes in CBF and BOLD. In contrast, calculated functional CMRO2 changes were less variable for HIV+ subjects compared to HIV− controls. A possible breakdown in neurovascular coupling may occur in HIV+ subjects.
368. Evaluation of fMRI markers in mild cognitive impairment
B. Zhu1, B. Zhang1, Y. Xu2,3, M. Li1 and Z.-Z. Sun2
1Department of Radiology; 2Department of Neurology, The Affiliated Drum Tower Hospital of Nanjing University Medical School; 3Jiangsu Key Laboratory for Molecular Medicine, Nanjing, China
Objectives: To investigate alterations of advanced functional MRI such as proton magnetic resonance spectroscopy (1H MRS) and apparent diffusion coefficient (ADC) value of diffusion weighted imaging (DWI) in mild cognitive impairment (MCI).
Methods: All experiments were conducted with a 1.5-T clinical MR image scanner (Philips Intera Master Medical Systems, Netherlands) with a standard quadrature head coil. MRS and DWI-ADC were administered to 13 patients with AD, 9 patients with MCI, and 13 controls(NINCDS/ADRDA criteria1,2). 1H-MRS were acquired with proton regional imaging of metabolites (PRIME) sequence. EPI sequence of DWI was adopted and b value was set to bmin (0 mm2/s) and bmax (1000 mm2/s). Alterations of NAA/Cr, mI/Cr and ADC value in hippocampus and temporoparietal region among groups were compared.
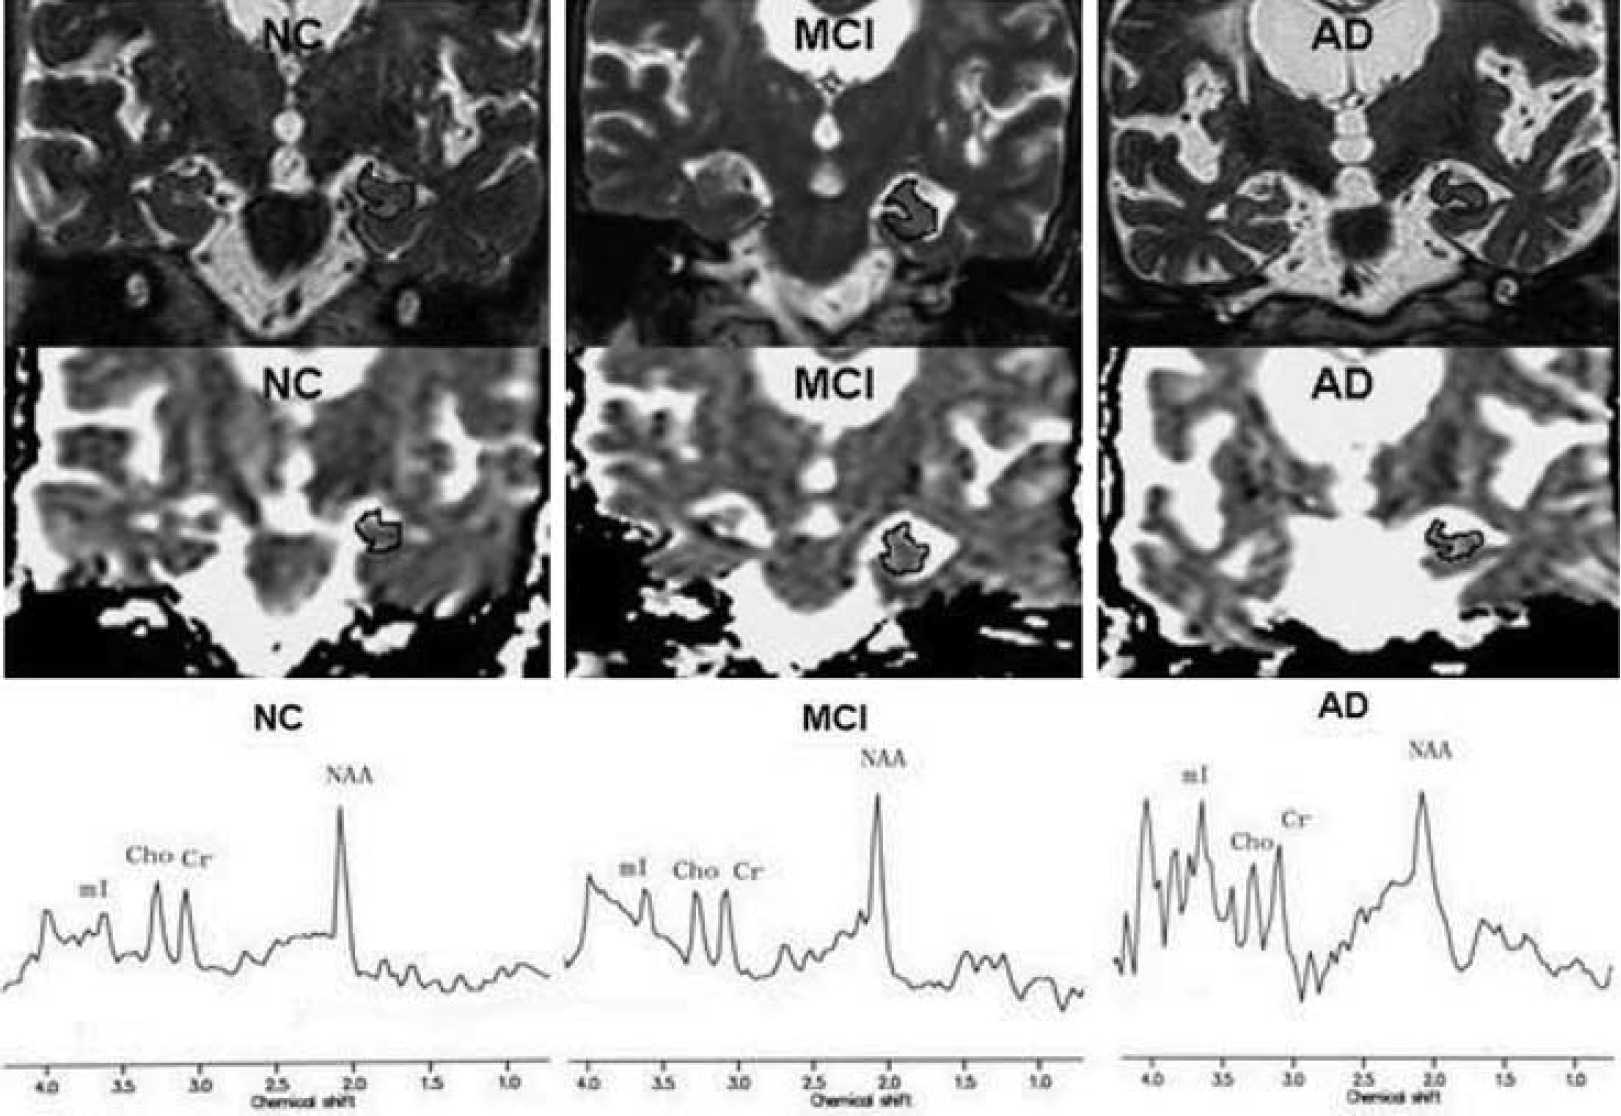
Results: NAA/Cr, mI/Cr and ADC value in hippocampus among AD, MCI patients and controls were significantly different (P<0.05) (Figure 1). AT a fixed specificity of 84.6%, the high sensitivity of 100% and 92.9% in differential AD and MCI from controls were concluded by combining the three indicators. The ROC plots illustrated the area under the curve of multi markers was biggest among the all four curves and the sensitivity of multi markers was highest.
Coronal T2WI and ADC map demonstrate tracings of the hippocampus and parahippocampal gyrus in a 73-year-old female control subject (left), a 76-year-old female with MCI (middle) and a 71-year-old female with AD (right).
Conclusion: New findings in this study were listed as follows:
The significant alterations of MRS-NAA, mI as well as DWI-ADC markers were found in MCI patients;1,3,4
The changing extent of NAA and mI as well as DWI-ADC markers could be quantified;
The multi MRS and DWI markers in combination could improve the diagnostic value of fMRI in distinguishing MCI from the controls.4
Alterations of NAA/Cr, mI/Cr and ADC in the hippocampus and the temporoparietal regions were helpful to clinical diagnosis in MCI. Furthermore, it had potential in predicting the progression of MCI to AD if we combined above multi indicators.
375. Evaluation of apparent diffusion coefficient (ADC) map by using image analysis software in mild cognitive impairment (MCI)
B. Zhang1, Y. Xu2,3, B. Zhu1, W.-H. Guo4 and J.-G. Zhang4
1Department of Radiology; 2Department of Neurology, The Affiliated Drum Tower Hospital of Nanjing University Medical School; 3Jiangsu Key Laboratory for Molecular Medicine; 4Department of PET, The Affiliated Drum Tower Hospital of Nanjing University Medical School, Nanjing, China
Objectives: Measures of ADC can quantify the alterations in water diffusivity resulting from microscopic brain structural changes1 in MCI and Alzheimer's disease (AD) patients. In this study, we investigated alterations on ADC values in MCI and AD patients and analyzed ADC maps by using Statistical Parametric Mapping (SPM). Furthermore we try to verify the accuracy of Brain Search (BS) software for ADC maps, designed by authors of this article, based on brain functional area automatic extraction method.
Methods: Scans were made on a 1.5-T clinical MRI scanner (Philips Intera Master Medical Systems, Netherlands) with a standard quadrature head coil. Conventional MRI and diffusion weighted imaging (DWI)-ADC was administered to 13 patients with AD, 9 with MCI, and 13 normal controls (NC) (NINCDS/ADRDA criteria2). The b values in DWI sequence were set at 0 mm2/s and 1000 mm2/s. The independent ADC map was analyzed by using BS and SPM, respectively. The significantly different functional brain areas among groups were recognized automatically as colorized coded areas by the software.
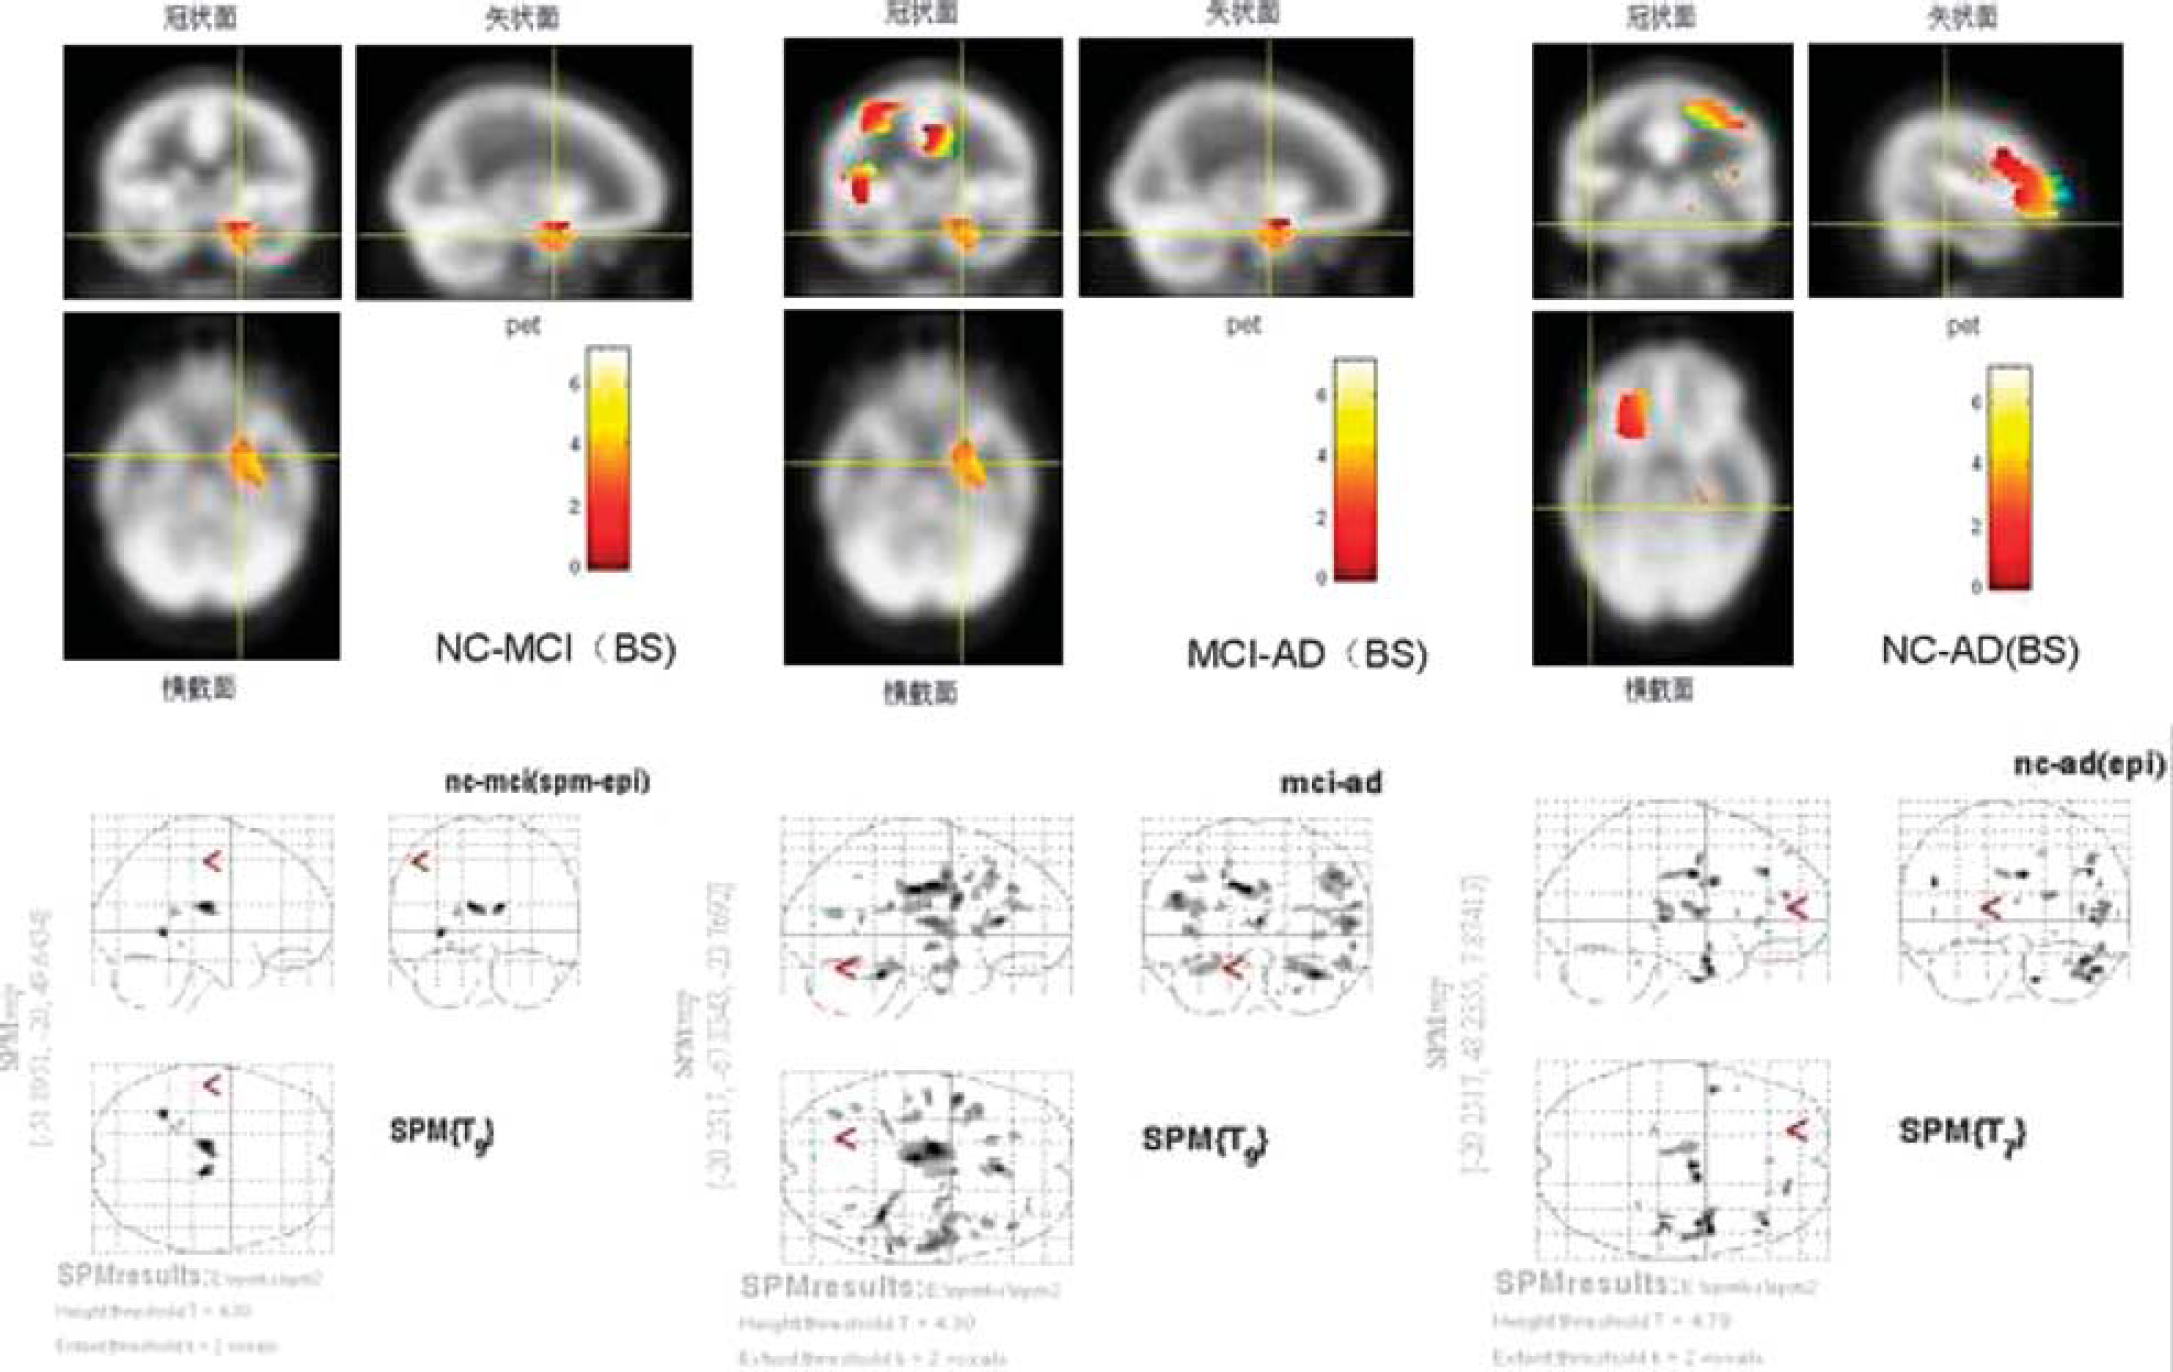
Results: ADC value in hippocampus among groups was significantly different (P<0.05). The number of areas shown on the maps analyzed by using SPM was more than that identified by using BS. However, bigger areas and brightener color were found on the maps analyzed by using BS rather than by using SPM (Figure 1). ADC values in the left limbic system were found significantly different among all groups when using both BS and SPM. Besides the left limbic system, other brain areas mapped are: the right Rectal Gyrus etc. between NC and MCI group; the right frontal lobe etc. between MCI and AD group; the right Inferior Frontal Gyrus etc. between NC and AD group.
Significantly different brain areas among AD, MCI patients and NC were shown, which were analyzed by BS (upper) and by SPM (lower), respectively.
Conclusion:
Alterations of ADC in the hippocampus are helpful to clinical diagnosis in MCI.1,3
Significantly different brain areas of ADC value are only located in the left limbic system, not in the right. And ADC values in the left limbic system and the right frontal lobe are significantly different among groups, which might be initial involvement in MCI.4
Significantly different areas of ADC value, shown in an intuitive way, analyzed by using BS are helpful to find more obvious areas than SPM. We hope these new insights will take the analytic mapping of ADC value into diagnostic assessment in MCI and AD.
482. A comparison of grey matter density in restless legs syndrome patients and matched controls, using FSL-VBM
R. Comley1, S. Cervenka2, S. Palhagen3, G. Panagiotidis4, J. Matthews5, R. Lai6, C. Halldin2, L. Farde2, T. Nichols1 and B. Whitcher1
1Clinical Imaging Centre, Glaxosmithkline, London, UK; 2Department of Clinical Neuroscience, Karolinska Institutet; 3Department of Neurology; 4Department of Laboratory Medicine, Karolinska University Hospital Huddinge, Stockholm, Sweden; 5School of Cancer and Imaging Sciences, the University of Manchester, Manchester, 6Discovery Medicine, Glaxosmithkline, Harlow, UK
Objectives: Restless legs syndrome (RLS) is a common neurological disorder where the pathophysiology is incompletely understood. To date two studies have used voxel-based morphometry (VBM) to examine grey matter density (GMD) in RLS. Increased GMD in medicated RLS patients compared to controls was reported in the pulvinar (Etgen, 2005;1n = 51), but was not replicated in unmedicated patients (Hornyak, 2007;2n = 14), instead slightly increased GMD in the ventral hippocampus and orbitofrontal gyrus was observed. We performed VBM on data from 16 unmedicated RLS patients and 16 matched controls using FSL-VBM.3
Methods: 16 RLS patients naïve to dopaminergic drugs and 16 age and sex matched controls received structural T1 weighted MR scans (mean age 55 s.d.±7 and 56±8 years respectively; symptom duration 27±12 years; IRLS score 18.5±3.9). Images were acquired using a 1.5T GE Signa system with a T1 and T2-weighted protocol. T1 images were reconstructed using a 256 × 256 × 156 matrix with an original resolution of 1.02 × 1.02 × 1 mm. For 3 subjects the original z-axis resolution was 1.2 mm and in one case 1.5 mm. Structural data was analysed using FSL 4.1. Briefly, brain-extraction (with optic nerve and eye clean up) was performed; images were segmented and GM partial volume images aligned to the MNI152 template (affine registration, followed by nonlinear registration); images were then averaged to create a study-specific GM template; native GM images were then non-linearly re-registered to that template; images were then modulated (to correct for local expansion or contraction) by dividing by the Jacobian determinant of the warp field and smoothed with an isotropic Gaussian kernel (σ = 4 mm). Voxelwise GLM was applied using permutation-based non-parametric testing, correcting for multiple comparisons across space, using age and gender as covariates.
Results: Data quality checks with performed and no anatomical pathologies or data processing outliers were discovered. We could not reject the null hypothesis of no difference in GMD between the two groups (voxel-wise significance: no significant voxels at P<0.05 (FDR corrected); P = 0.89 (FWE corrected)). Further the distribution of t-values was found to be symmetric and centred about zero, evidence against false negatives due to data anomalies.
Conclusions: We found no evidence of differences in GMD between healthy controls and unmedicated RLS sufferers using a sample size similar to previous literature. This further raises the possibility that previous differences seen by Etgen et al were either spurious, or related to treatment induced effects. We saw no suggestion of the increases in GMD (ventral hippocampus and orbitofrontal gyrus) seen by Hornyak et al,2 in a similar patient population (although only 11 of those patients were drug naïve). In the present study a well controlled data set was analysed with an advanced automated image analysis technique, we have found no structural correlate of RLS.
517. Neurobiological effects of atypical antipsychotics and cognitive remediation therapy in first episode schizophrenia
J.J. Furtner, A.O. Pintsov, G. Kasprian, G. Sachs and D. Prayer
Medical University of Vienna, Vienna, Austria
Background and aims: Cognitive deficits contribute to the disability of schizophrenic patients. These deficits, especially related to working memory tasks seem to be correlated with a dysfunction of the prefrontal cortex. The aim of this study is to examine whether the cognitive dysfunction of schizophrenics may be detected using f-MRI (n-back test) and whether an improvement may be shown after atypical antipsychotics in combination with cognitive therapy.
Methods: f-MRI was used during performance of the n-back working memory task (one-back test) to assess working memory in a total of 8 cases. A baseline fMRI examination was performed in 6 drug-naïve patients who met the DSM-IV criteria for schizophrenia and in 2 healthy controls. After the baseline fMRI examination patients were randomly assigned into different cohorts. To date there has been 1 patient in the first cohort who received only atypical antipsychotics while 2 patients in the second cohort received atypical antipsychotics in combination with cognitive therapy.
The f-MRI examination was repeated after 4 weeks of therapy in 3 patients. MR-imaging was performed on a 1.5 Tesla superconducting unit in conjunction with an 8-element Sense Head-Coil. Data was processed by using the standardized analyzing software package Brainvoyager (Brain Innovation, Netherlands).
Purpose: Purpose of this study is to examine the cognitive dysfunction of schizophrenic patients using a working memory task (n-back test) during f-MRI examination and to investigate if atypical antipsychotics in combination with cognitive therapy are more beneficial than medication only.
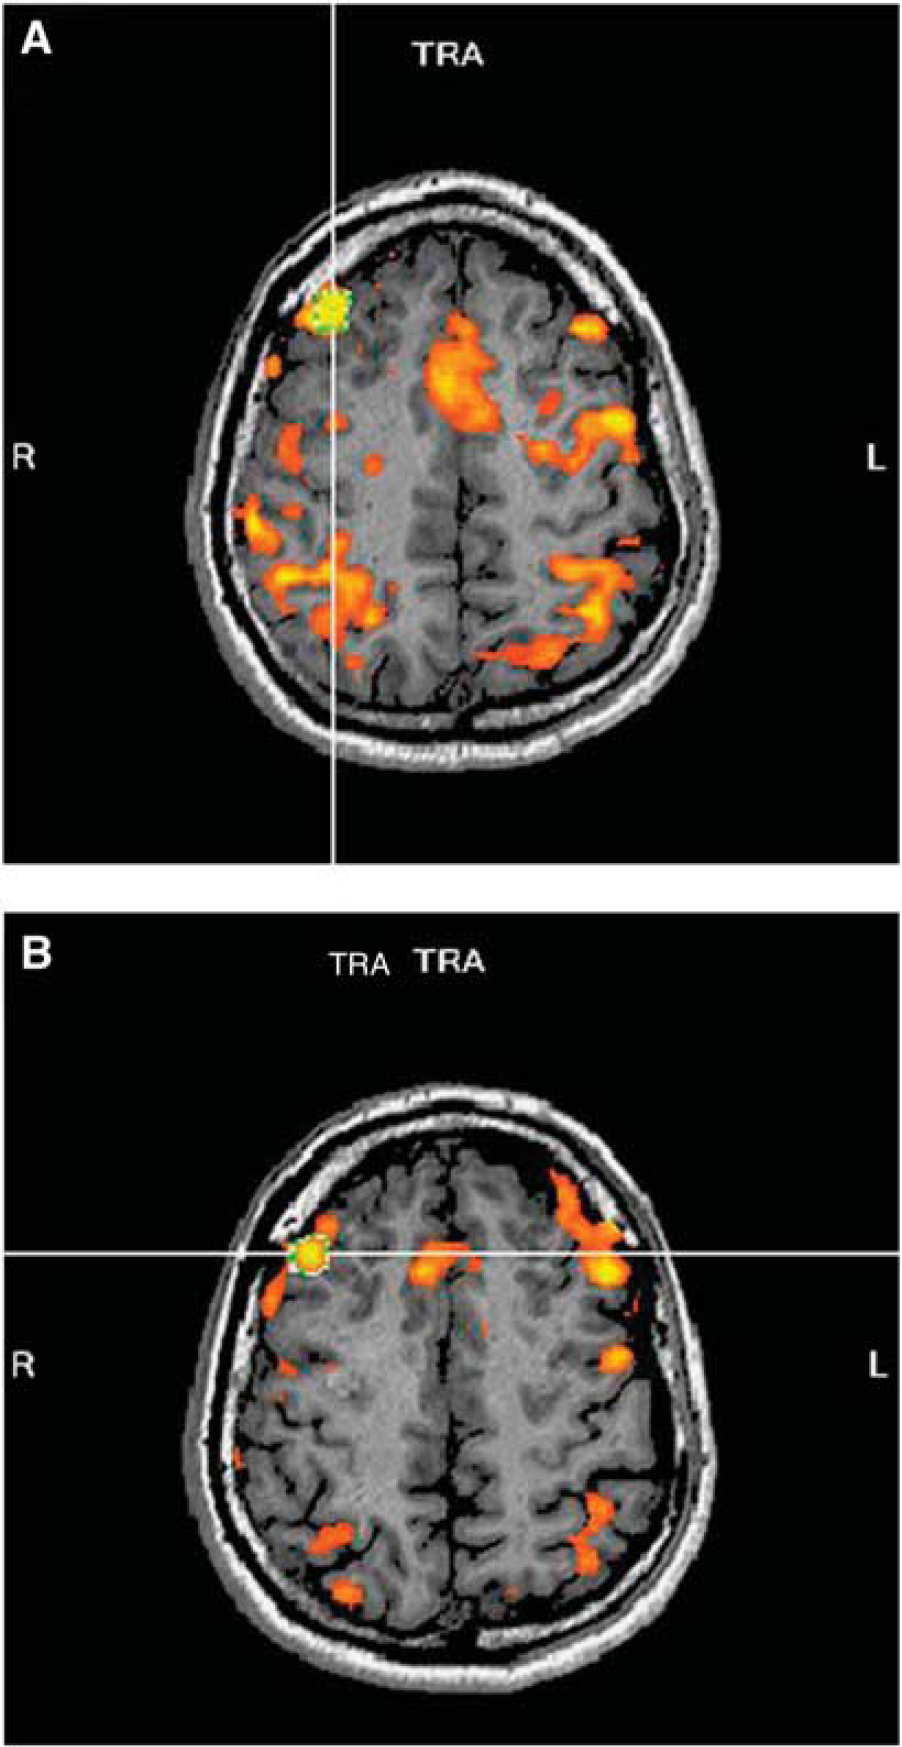
Results: In the baseline f-MRI examination all schizophrenics showed an exaggerated physiological response, especially in the right dorsolateral prefrontal cortex in comparison with the healthy controls. This hyperactivational state can be interpreted as a prefrontal dysfunction in terms of a greater effort being required to perform a one-back working memory task.
Those patients, who received atypical antipsychotics in combination with cognitive therapy showed a greater reduction of activation after 4 weeks (Figure 1) than the patient who received antipsychotics only. Thus one might expect that cognitive therapy in schizophrenic patients may improve prefrontal cortex dysfunction.
Conclusions: Once proved in a larger number of patients, these results might help deciding which therapy (pharmacological/psychotherapeutical/combined) will be beneficial. Furthermore, cognitive outcome might be a predictor for social performance and fMRI data might be used as a marker for certain aspects of the disease.
f-MRI results during performance of the n-back working memory task of a) a drug naïve schizophrenic patient and b) the same patient 4 weeks later after a combinated therapy of atypical antipsychotics and cognitive therapy. The picture shows the hyperactivation in the right dorsolateral prefrontal cortex in a drug naïve schizophrenic patient and the decrease of activation in the same cortical area after therapy.
736. Need and opportunities for imaging investigation of metabolism and perfusion abnormalities in autism spectrum disorders and their relationship
N. Shetty1,2, E. Ratai2,3 and M. Herbert2,4
1Neurology; 2TRANSCEND Research Program; 3Radiology; 4Pediatric Neurology, Massachusetts General Hospital/Harvard Medical School, Boston, Massachusetts, USA
Objectives: Autism Spectrum Disorders (ASD) are a highly heritable set of conditions defined by deficits in three behavioral domains (communication, social interaction, repetitive/restricted range of behaviors) with onset before the age of 3 years and are commonly considered to be due to genetically caused perturbations of early brain development. High prevalence of immune dysfunction and metabolic disturbances (prominently oxidative stress) suggests that chronic pathophysiology is also present, which are known to impact cerebral perfusion and metabolism. There is much PET and SPECT documentation of reduced cerebral perfusion in ASD and much documentation of altered cerebral metabolism; there are no published studies yet to our knowledge utilizing ASL (arterial spin labeling). Overall atypically rapid brain growth in the first few years of life has been documented. This enlargement appears to occur most prominently in the outer (radiate) white matter, and neuropathological studies looking at the presence of activated glial cells has noted microgliosis in the cerebral cortex and astrogliosis in the radiate but not the deeper white matter. Overall, while there is developing an overall sense that perfusion and metabolism (as well as altered functional connectivity) may be altered for reasons that are related at an underlying level, investigations of these dimensions of altered brain function in ASD is poorly coordinated. Given the growing prevalence of ASD there is a great public health and medical need to gain clarity regarding its underlying mechanisms.
Given the difficulties involved in studying this population, the invasiveness constraining PET and SPECT studies; the low SNR of ASL and the impracticality of whole brain MRS acquisitions, as well as a paucity of practical non-invasive assessments of blood-brain barrier integrity, it is particularly important to formulate a well chosen set of measures and a strategically targeted research strategy. We therefore present a review of the evidence.
Methods: We will present the results of a PubMed literature search and the review of PET, SPECT and MRI papers related to perfusion, cerebral blood flow and metabolite quantification. We will show a tabulation of relevant papers based on regions of interest, metabolite/perfusion quantification, correlation with function (if done), modality, subject characteristics and objectives.
Results: The literature contains a large divergence of regions of interest, regions identified as abnormal, specific acquisition protocols, age ranges and subject characterization. Within this great heterogeneity a few common themes begin to emerge, such as the prominence of hypo- rather than hyper-perfusion, alterations in metabolites related to energetics, and reductions of N-acetylaspartate rather than the increases that might be expected if failure of pruning/high neuronal density were the reason for brain growth. The literature does not yet allow us to systematically evaluate perfusion-metabolism relationships.
Conclusions: Understanding the interplay between perfusion and metabolite quantification is crucial to explore the affected pathways in autism. Designing studies based on multi-modal imaging combining 31P MRS, ASL, Proton-MRS, BBB imaging could help contribute to clearer understanding of underlying pathophysiology which is vital for seeking treatment targets.
776. Correlation of hypointensities in susceptibility weighted magnetic resonance images to tissue histology in dementia patients with cerebral amyloid angiopathy
M. Schrag1, G. Mcauley1, J. Pomakian2, H. Vinters2, C. Mueller1, W. Kirsch1 and W.J. Pearce3
1Loma Linda University School of Medicine, Loma Linda; 2University of California Los Angeles, Los Angeles; 3Center for Perinatal Biology, Division of Physiology, Loma Linda University, Loma Linda, California, USA
Objectives: Recent neuroimaging studies of the Alzheimer's disease (AD) brain using susceptibility weighted (SWI) or conventional gradient echo T2* magnetic resonance have noted focal hypointensities distributed in a lobar pattern. The presence of these hypointensities has been shown to correlate with reduced global cognitive function and a significant risk for the progression of mild cognitive impairment to outright dementia. Because these imaging protocols are sensitive to iron, these findings were interpreted as small hemorrhages which have been termed ‘brain microbleeds.’ This study undertakes a systematic correlation of SWI hypointensities to tissue pathology in post mortem AD and cerebral amyloid angiopathic (CAA) brain to evaluate whether they are in fact related to hemorrhages.
Methods: Eight cases were imaged by susceptibility weighted imaging in a 3T MR scanner. Each was found to contain hypointensities and the corresponding foci in the tissue were carefully dissected.
Results: Post-hemorrhagic sites in various stages of resolution were detected in all but one specimen which was found to contain a thrombus enclosed within a vessel. The lesions measured between 1 and 7 mm in diameter. When the ruptured vessel was still present, beta-amyloid immunohistochemistry confirmed the presence of amyloid in the vessel wall. Significant cellular apoptosis was noted in the perifocal region of recent bleeds along with heme oxygenase 1 activity and late complement activation.
Conclusions: Correlation of imaging findings to tissue pathology is time-consuming, but is a necessary validation of these techniques which will potentially offer AD patients and their families diagnostic and prognostic information which will guide therapy.
The hypointensities in SYO of the left temporal lobe shown in image A are localized in the tissue as shown in image B. Under microscopy it is clear that the lesion is closely associated with a vessel, which is stained a briliant yellow by hemotoiden, an endogenous pigment produced by heme degradation.
869. Cerebellar volume ratio to total intracranial in central causes of vertigo: a stereological study
N. Gocmen-Mas1, S. Karabekir2, O. Kusbeci Yilmaz3, B. Sahin4, T. Ertekin5, O. Bas6, A.C. Yazici7 and S. Senan8
1Anatomy; 2Neurosurgery; 3Neurology, Kocatepe University School of Medicine, Afyon; 4Anatomy, Ondokuz Mayis Universityt, Samsun; 5Anatomy, Kocatepe University Ataturk Vocational School of Health Services, Afyon; 6Anatomy, Rize University, Rize; 7Biostatistics, Baskent University School of Medicine, Ankara; 8Anatomy, Istanbul, Turkey
Objectives: The volume of organs or structures can be obtained using the Cavalieri principle of stereological approaches. Several investigations focused on defination of brain structures and tried to find out MR imaging detectable discriminators of healthy aging and pathological cases in neurological diseases. The normal relation between cerebellar volume and total intracranial volume is fixed. This proportion is significant in determining maybe a result of a cerebellar developmental malformation or atrophy. Proportional relations of the volume of neural structures may have a constant value of the size of the subject. The volume and volume fraction approach of stereological methods provides information about volumetric relations of the components of structures. The central cause of vertigo is often prolonged, permanent and chronic duration. Signs and symptoms of dysfunction of neighboring structures include the central brainstem and cerebellar structures. In literature, we have not able to find adequate data about volume relation between cerebella and total intracranial in central causes of vertigo. So, in this study, we aimed to evaluate the relevant methods of magnetic resonance and stereology to define cerebellar volume ratio to total intracranial volume according to gender in central causes of vertigo cases.
Material and methods: The study included 14 (7 men, 7 women) healthy adult subjects aged between 25 and 54; and 15 (7men, 8 women) cases with vertigo aged between 26 and 55. The volumes of cerebellum and total intracranial were determined on MR images using the point-counting approach of stereological methods.
Results: The TIV volumes in control group were 1082.49±71.01 in males; 1067.76±80.41 in females on sagittal plane. The TIV volumes in vertigo group were 1043.13±27.43 in males; 1011.14±60.76 in females on sagittal plane. The cerebella volumes in control group were 106.64±5.23 in males; 100.81±12.25 in females on sagittal plane. The cerebella volumes in vertigo group were 98.06±7.46 in males; 100.49±5.83 in females on sagittal plane. There was not a difference the volumes of TIV between control group and the cases with vertigo both males and females (P>0.05). The cerebellar volume in the cases with vertigo were significantly smaller than the control subjects in male subject (P = 0.028). While, cerebellar volumes were small in females with vertigo (P<0.05), but volume difference between two groups were not statistically significant. The volume fraction of the cerebella to TIV in control group were 0.099±0.008, in vertigo were 0.094±0.007 in male subjects. The volume fraction of the cerebella to TIV in control group were 0.095±0.012, in vertigo were 0.099±0.009 in female subjects. The cases of vertigo showed lower cerebella to TIV fraction than the control subjects in both male subjects (P = 0.018) and female subjects (P>0.05). The proportion of cerebellum to TIV the cases with vertigo showed significantly lower cerebellar volume proportion to TIV than the control subjects (P<0.05). No significant statistically difference was found in both groups with regard to the gender (P>0.05).
Conclusion: As a result, estimating the cerebella and TIV volumes proportion using the stereological method may be significant tool in defining brain anatomy and pathological changes in central causes of vertigo.
1008. Prospective targeting and control of end—tidal PCO2 and PO2 during FMRI scanning in healthy subjects and patients
J. Han1,2, S. Dorner3, M. Slessarev1, A. Mardimae1, D. Mikulis4 and J. Fisher1,2
1Anesthesia, University Health Network, University of Toronto; 2Physiology, University of Toronto; 3Respiratory Therapy; 4Medical Imaging, University Health Network, University of Toronto, Toronto, ON, Canada
Objectives: Cerebrovascular reactivity (CVR) is defined as change in cerebral blood flow (CBF) for a given vasoactive stimulus. Blood oxygen dependent (BOLD) MRI signal can be used as the surrogate for CBF, and changes in end-tidal PCO2 (PetCO2) as the stimulus-if end-tidal PO2 (PetO2) can be kept constant. We set out to develop and test a system that, for the first time, will provide a repeatable PetCO2 stimulus to both healthy subjects and patients in an MR environment.
Methods: We used a custom gas blender (RespirAct™, TRI, Toronto Canada) and a sequential rebreathing circuit to study CVR in a 3T MRI unit (GE Healthcare, Milwalkee, Wisconsin) in 10 healthy subjects (ages 20–50) and 24 patients (ages 20–70) being investigated for neurological symptoms. The target end-tidal values consisted of normoxic (100 mm Hg) quasi-square wave changes in target PetCO2's between 40 and 50 mm Hg of 45–130 s durations. We analyzed the PetCO2's of the last 30 sec of each stage and the PetO2 for the entire test.
Results: In healthy subjects the PetCO2's in mm Hg (m±SD) at each stage were: stage 1−(40.3±0.8), 2−(49.6±1.0), 3−(40.3±1.0), 4−(50.0±0.67), 5−(40.6±1.2). In patients: stage 1−(40.2±0.7), 2−(48.9±2.2), 3−(40.8±1.2), 4−(49.5±1.1), 5−(41.2±1.6). PetO2 was 103.0±2.7 in subjects and 103.5±2.0 in patients. There were no differences at any stage in PetCO2 or PetO2 between healthy subjects and patients.
Conclusions: We conclude that the prospective targeting of PetCO2 and PetO2 provides a highly repeatable stimulus to both healthy subjects and patients during MRI scanning.
1065. Correlation of cognitive deficits, ICP, and CBF in hydrocephalus using noninvasive MRI based measurement (MR-ICP)
N. Alperin1, R. Glick2, S. Lee1 and T. Lichtor3
1Radiology, UIC; 2Neurosurgery, Mount Sinai Hospital Hospital, Rush University, UIC; 3Neurosurgery, Rush University Medical Center, Chicago, Illinois, USA
Objective: We previously reported the clinical utility of a noninvasive MRI-based measurement of intracranial pressure (MR-ICP) in hydrocephalic patients. We found that MR-ICP has a strong negative predictive i.e. patients with normal MR-ICP did not require surgical intervention. We now investigated this large group of hydrocephalic patients to determine if MR-ICP and tCBF, measured non-invasively, correlates with cognitive dysfunction.
Methods: 36 hydrocephalic patients underwent brain MRI study with measurements of CSF and CBF to and from the cranial vault, from which measurements of ICP and tCBF were derived, using a previously described algorithm. In addition, tCBF was normalized for brain volume. Neurologic exam with assessment of cognitive function and/or formal neuropsychological testing, was performed. Patients were divided into 2 groups: mild delay/cognitive deficits, or normal MS, and were compared to normal controls.
Results: MR-ICP values spanned a much wider range than normal controls, although the majority of MR-ICP values were within the normal range. Similarly, tCBF in these patients did not follow the ‘normal’ distribution but spanned a much wider range. 12/36 patients had mental status (MS) changes on neurologic evaluation or neuropsych testing. Overall, tCBF in the hydrocephalic patients, whether they had normal MS or mild deficits, was lower than normal controls. However, when corrected for volume, only the patients with MS changes or cognitive deficits had a significant difference in tCBF versus normal controls. There was no difference in tCBF between the ‘normal MS’ hydrocephalic patients versus normal controls.
Conclusion: MR-ICP and tCBF values in hydrocephalic patients did not follow the ‘normal’ distribution but spanned a much wider range, suggesting possible dysautoregulation. Despite normal ICP and tCBF, many patients exhibited MS changes/cognitive deficits, which correlated with changes in tCBF, measured noninvasively. We are now attempting to correlate ICP, tCBF, gray versus white matter volumetric changes and cognitive function in these cases.
KantarciK. DWI predicts future progression to Alzheimer disease in amnestic mild cognitive impairment. Neurology2005;64(5):902–4.
16.
KantarciK. Comparative diagnostic utility of different MR modalities in mild cognitive impairment and Alzheimer's disease. Dement Geriatr Cogn Disord,2002;14(4):198–207.
17.
KantarciK. DWI predicts future progression to Alzheimer disease in amnestic mild cognitive impairment. Neurology2005;64(5):902–4.
18.
BlennowKde LeonMJ and ZetterbergH. Alzheimer's disease. Lancet2006;368(9533):387–403.
19.
AcklN. Hippocampal metabolic abnormalities in mild cognitive impairment and Alzheimer's disease. Neuroscience Letters384(1–2):23–8.
20.
WangL. Changes in hippocampal connectivity in the early stages of Alzheimer's disease: Evidence from resting state fMRI. Neuroimage2006;31(2):496–504.
21.
EtgenT. Bilateral thalamic gray matter changes in patients with restless legs syndrome. Neuroimage2005;24(4):1242–7.
22.
HornyakM. Voxel-based morphometry in unmedicated patients with restless legs syndrome. Sleep Med2007;9(1):22–6.