
Abstract
Compartmental modeling and spectral analysis are often used for tracer kinetic modeling in positron emission tomography (PET). The concentrations in kinetic equations are usually considered to be instantaneous, whereas PET data are inherently integrated over time, which leads to uncertainties in the results. A new formalism for kinetic analysis that uses cumulative tracer concentrations and avoids approximating the image-derived input function and PET measurements with midframe instantanous values was developed. We assessed the improvements of the new formalism over the midframe approximation methods for three commonly used radiopharmaceuticals: [11C]raclopride, 2′-deoxy-2′-[18F]fluoro-
Introduction
Compartmental models are frequently used to analyze dynamic positron emission tomography (PET) images for the kinetics of radiotracer tissue uptake. There exists several well-established linear compartmental models for the quantification of blood flow (Kety, 1951), neuroreceptor ligand binding (Lammertsma et al, 1996; Mintun et al, 1984), metabolic rate of glucose (Huang et al, 1980; Phelps et al, 1979; Sokoloff et al, 1977), and thymidine analog uptake and phosphorylation (Muzi et al, 2005a, b, 2006; Shields et al, 2002). Similarly, spectral analysis can also be used for the same purpose (Cunningham and Jones, 1993; Murase, 2003). Although it differs from compartmental modeling conceptually, it does not differ much technically, because in both cases, the solution for the tissue time activity curve (tTAC) consists of a linear combination of exponential functions and possibly a constant term, convolved with the input function (IF) (Gunn et al, 2001; Schmidt, 1999).
Unlike conventional physiological sampling, PET scanning does not allow measurement of instantaneous concentrations, because it measures them indirectly, through imaging tracer activity over a predefined time period. That issue was fully solved for the graphical methods (Buchert et al, 2003), but no general solution for compartmental models and spectral analysis has been proposed. A popular kinetic analysis software package, SAAM II (Barrett et al, 1998; Berneis et al, 2004) simply ignores that issue and assumes all concentration measurements as instantaneous. That approximation is often called midframe approximation; that is, the TAC in the middle of the time frame is equalized to the TAC averaged over that time frame. Other popular kinetic analysis software packages, including COMKAT (Muzic and Cornelius, 2001) and KMZ (Burger and Buck, 1997), now called PMOD (PMOD Technologies Ltd., Zürich, Switzerland), explicitly integrate instantaneous model output over the corresponding time period, which is appropriate for the blood sampling IF but does not represent the PET image-derived IF correctly.
We have developed a cumulative concentration IF approach that is especially suited for the kinetic models with cumulative IF measurements like PET, but also useful for instantaneous measurements. We have investigated the potential improvements of the parameter estimation accuracy compared with the midframe approximations for several well-established PET compartmental models.
Theoretical Background
The general linear compartmental system with n compartments is described by the state equation (equation 1).
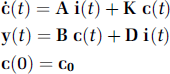
In equation 1,


The term e

In equation 5, we exchange the order of integration. By rewriting equation 4 and imposing cumulative IF vector

Comparing equation 5 to equation 3, we notice that the relation for cumulative vector of observed outputs

Positron Emission Tomography Compartmental Modeling
In the PET compartmental modeling case, there is one observed output and one or more inputs. The observed output z(tj–1, t j ) is always time averaged over time frame [tj–1, t j ], but a kinetic model can easily take this into account by explicit integration of the instantaneous model output. Input functions are instantaneous in the case of blood sampling and time averaged over time frames when they are image derived. Exact conversion from instantaneous to time-averaged IF is possible, whereas the opposite is impossible. Depending on the available experimental data, we can apply three types of midframe approximations:
A. correct IF, approximated tTAC,
B. approximated IF, correct tTAC,
C. approximated IF and approximated tTAC.
Improvement of parameter estimation accuracy when using the new method instead of the A, B, or C approximations could be quantified by finding most probable parameter estimations for the approximate methods and calculating the difference between these estimations and correct parameters. Most probable parameter estimations for the approximate methods are found by minimizing the differences between correct model output representation z(tj–1, t
j
, θ), with correct parameters θ and approximate model output representation Z(tj–1, t
j
,

Weights w i in equation 7 must be the same as we would use for parameter estimation with weighted least squares method.
Materials and methods
The improvement in parameter estimation with the new method, compared with all three possible approximations A, B, and C, was quantified for three common radiopharmaceuticals; [11C]raclopride, 2′-deoxy-2′-[18F]fluoro-
Accuracy improvements for the [11C]raclopride

Table shows the correct parameter values, the parameters we would estimate with all three possible approximations, according to our methodology and the absolute and relative improvements with new method. BPND is the most relevant clinical parameter and our method demonstrates the improvement in estimation accuracy in the range of 5% to 25%. Alternative calculation of this parameter uses the volume of distribution in striatum and cerebellum. Therefore, we list also the improvement in estimation accuracy for volume of distribution (Vd), which is well below 1%.
Accuracy improvements for the FDG

While the proposed method does not substantially change macroparameter K i estimation, microparameters estimation such as Vb may show more substantial change.
Accuracy improvements for the FLT

Like the FDG case, the proposed method does not substantially change macroparameter K i estimation. However, also the microparameter estimation changes less than they change in the FDG case, although still much more than the macroparameter K i estimation.
For [11C]raclopride, the improvement of the new method was estimated for the two-compartment four-parameter model with the plasma IF and the following kinetic parameters K1, k2, k3, BPND = k3/k4, and Vb. This model is used for the estimation of the binding potential, a measure of fNDBavail/Kd, of [11C]raclopride in human striatum. Alternative calculation of binding potential uses the volume of distribution Vd = k1/k2(1 + k3/k4) in striatum and cerebellum. Therefore, we calculate also the improvement in estimation accuracy for the volume of distribution. We obtained IF and striatal TAC (shown in Figure 1), as well as scanning protocol from Lammertsma et al (1996).

Input function and tissue time activity curve (tTAC) for the [11C]raclopride simulation.
For FDG and FLT, the improvement of the new method was estimated for the two-compartment four-parameter kinetic model with the plasma IF and the following microparameters K1, k2, k3, k4, and Vb. Improvement in estimation of macroparameter K i = K1k3/(k2 + k3), which defines metabolic rate of glucose in case of FDG PET and thymidine blood-tissue transfer constant in case of FLT PET, was also quantified. We obtained IF and scanning protocol for FDG from Schroeder et al (2007) and for FLT from Muzi et al (2005a).
Results
Figure 2 shows the differences between the correct tTAC and approximate tTACs that are calculated with correct parameters or with the most probable approximate method parameter estimations, according to equation 7 for all three approximations A, B, and C. Differences between the correct tTAC, calculated with correct parameters, and approximate tTACs, calculated with the most probable approximate method parameter estimation, are considerable only shortly after injection, when IF and tTAC changes rapidly, and only for approximation A. These differences are lower for the approximation B and almost negligible for the approximation C. They are also negligible for all three approximations at a later time after injection. Differences between the correct tTAC, calculated with correct parameters, and approximate tTACs, calculated with the most probable approximate method parameter estimation, are also considerable for approximation A shortly after injection. They are lower for the approximation B and almost negligible for the approximation C. At later time after injection, these differences are the highest for the approximation C and lowest for the approximation A. They are considerably higher than the differences between the correct tTAC, calculated with correct parameters, and approximate tTACs, calculated with the most probable approximate method parameter estimation. This observation implies that minimizing objective function in equation 7 was successful and alignment between correct model output and approximate model output was improved.

The assessment of the new method improvements—data for the [11C]raclopride. Graphs show the differences between correct tissue time activity curve (tTAC) and the tTACs that are calculated with one of the approximation methods, either with the correct parameters (dashed line) or with the parameters that maximizes alignment with the correct tTAC (solid line). (
Table 1 shows the results for [11C]raclopride simulation. Absolute and relative differences are recognized as an improvement of new method, compared with approximations. Improvements in microparameter estimation accuracy are moderate for approximation A, ranging from 1% for K1 to 8% for k3, whereas improvement in volume of distribution estimation accuracy is only 0.04%. Estimation accuracy for the most relevant clinical parameter BPND = k3/k4 is improved for 5%. Considerable higher improvements are for the methods B and C. Improvements are well above 1% for all parameters, whereas BPND= k3/k4 estimation accuracy is improved for 20% to 25%. Alternative calculation of this parameter is by using the formula BPND = (Vt–Vref)/Vref, where Vt is the volume of distribution in striatum and Vref is the volume of distribution in cerebellum. Improvement in estimation accuracy for volume of distribution is well below 1% also for methods B and C.
Tables 2 and 3 show the results for FDG and FLT simulation. Unlike the [11C]raclopride case, where the approximation A was more accurate, for FDG and FLT the accuracy of all three approximations is similar. One exception might be approximation B for the FDG case, which is noticeably less accurate than others. Estimation of macroparameter K i is fairly accurate with all three approximations. New method improves estimation accuracy above 1% only in the approximation B for FDG case. Estimation of microparameters is slightly less accurate and new method improves parameter estimation accuracy often above 1%. Improvements in Vb estimation reaches 27% in the approximation B for FDG case.
Discussion
A brief check of the results in tables reveals that significance of the new method improvement is case dependent. The [11C]raclopride case shows that the new method can lead to significant parameter estimation accuracy improvement, compared with the midframe approximations. The [11C]raclopride is used for the estimation of the binding potential, a measure of fNDBavail/Kd, in human striatum. Therefore, the most interesting kinetic parameter is BPND = k3/k4. It is evident from Table 1 that the improvement in BPND estimation accuracy when using new method was in the range of 5% to 25%. Alignment plots in Figure 2 show that the most probable approximate method parameter estimation improves the alignment between approximate and correct tTAC, although the alignment is still not perfect. Therefore, image noise and other sources of errors could also have the significant effect on the estimation of binding potential in human striatum. Another scanning protocol, IF shape, and parameter values set would probably lead to different values, but this example alone indicates that potential improvement in BPND estimation accuracy when using our new method can be very high.
Binding potential can be calculated also by using the formula BPND = (Vt—Vref)/Vref. It is interesting that the improvement in volume of distribution estimation accuracy is almost negligible (well below 1%), which indicates that improvement in alternative binding potential estimation accuracy is small.
In FDG and FLT kinetic analysis, we are usually interested in parameter K i , which is a macroparameter and generally much more stable than microparameters. We found that the new method improves its estimation accuracy only slightly—below 2% in our case. Parameter estimation accuracy improvements for other FDG or FLT cases with different scanning protocols, IF shapes, and parameter values set might differ from our case. However, because FDG or FLT uptake dynamics are quite linear after a certain time, the midframe approximation is expected not to have a major effect. On the other hand, as shown in the case [11C]raclopride, the further from linear the uptake dynamics is, the more significant effects one can expect. From the results in Tables 2 and 3, it is also evident that the possible improvement in microparameter estimation accuracy is > 25%, which is much higher than the K i estimation accuracy improvements. It is interesting that we got significantly different results for FDG and FLT case, although compartmental model is the same. Differences in results are attributed to different IF, scanning protocol, and simulated parameters.
We should be aware that these improvements in parameter estimation accuracy may be affected with some other factors, including model inadequacy and noise in PET measurements. These two factors impose some intrinsic parameter estimation inaccuracy, which interferes with the inaccuracy, arising from the midframe model approximations. As these sources of errors in parameter estimation method are uncorrelated, these errors add in quadrature, which decreases the effect of one source of error to the whole error.
Conclusion
One of three possible types of midframe approximation is typically applied in kinetic analysis, without being justified with error analysis or considered as a possible source of error. In this article, we proposed an algorithm that avoids the midframe approximation for cases when data are partially or fully in cumulative form. We also developed a method that quantifies the improvement in parameter estimation when avoiding midframe approximations, and applied it on three common radiopharmaceuticals; [11C]raclopride, FDG, and FLT.
We found that the improvement in parameter estimation when avoiding midframe approximations is strongly case dependent and could be significant. If the midframe approximation is applied, it has to be justified. However, our newly developed algorithm is general, and it can be applied to various linear compartmental models with constant coefficients, with plasma IF or reference region IF, as well as to spectral analysis. The implementation of proposed algorithm does not increase computational complexity but rather decreases it. Therefore, we consider the proposed algorithm as a necessary improvement in implementation of any kinetic analysis software that relies on midframe approximations.
Footnotes
The authors declare no conflict of interest.