
Abstract
Assessment of serotonin release in the living brain with positron emission tomography (PET) may have been hampered by the lack of suitable radioligands. We previously reported that fenfluramine caused a dose-dependent reduction in specific binding in monkeys using a classical displacement paradigm with bolus administration of [11C]AZ10419369. The aim of this study was to confirm our previous findings using an equilibrium approach in monkey. A total of 24 PET measurements were conducted using a bolus infusion protocol of [11C]AZ10419369 in three cynomolgus monkeys. Initial PET measurements were performed to assess suitable Kbol values. The fenfluramine effect on [11C]AZ10419369 binding was evaluated in a displacement and pretreatment paradigm. The effect of fenfluramine on [11C]AZ10419369 binding potential (BPND) was dose-dependent in the displacement paradigm and confirmed in the pretreatment paradigm. After pretreatment administration of fenfluramine (5.0 mg/kg), the mean BPND of the occipital cortex decreased by 39%, from 1.38 ± 0.04 to 0.84 ± 0.09. This study confirms that the new 5-HT1B receptor radioligand [11C]AZ10419369 is sensitive to fenfluramine-induced changes in endogenous serotonin levels in vivo. The more advanced methodology is suitable for exploring the sensitivity limit to serotonin release as measured using [11C]AZ10419369 and PET.
Introduction
Positron emission tomography (PET) can be used to assess alterations in neurotransmitter levels in vivo in a noninvasive manner. Using PET the most widely investigated neurotransmitter has been dopamine, and numerous studies have shown significant effect of drug challenges (Volkow, 1994) or physiological stimulation (Koepp et al, 1998) on radioligand binding. Clinical relevance of such measurements is found in studies with schizophrenia patients, who have shown greater response following dopamine manipulation (Breier et al, 1997; Laruelle et al, 1996). The dopamine release studies confirm the utility of PET to measure neurotransmitter release in vivo.
Positron emission tomography imaging of endogenous serotonin (5-HT) release has been attempted, but may have been hampered by the lack of suitable radioligands (Paterson et al, 2010). The so far most promising radioligands for imaging of serotonin release are targeting the 5-HT1A receptor, and though initial animal studies were encouraging for the antagonist [18F]MPPF, the results have not been consistent across brain regions and species (Udo de Haes et al, 2002, 2006; Zimmer et al, 2002). The 5-HT1A receptor agonist [11C]CUMI-101 has recently been shown suitable for the study of serotonin release in nonhuman primates (Milak et al, 2010). However, due to the lack of a reference region, the quantification is relatively elaborate and may limit its applicability in the clinical setting.
In a recent radioligand discovery program, we developed the selective 5-HT1B receptor antagonist radioligand [11C]AZ10419369 (Andersson et al, 2010; Pierson et al, 2008). Previously, we reported that [11C]AZ10419369 is suitable for in vivo quantification of 5-HT1B receptors in the brain of monkey and man (Pierson et al, 2008; Varnäs et al, 2011a). Of the 14 serotonin receptors, the 5-HT1A and the 5-HT1B receptor are the two receptors located presynaptically (Barnes and Sharp, 1999). The 5-HT1B receptor is predominantly localized on axon terminals (Sari et al, 1999) and has been shown to inhibit the synaptic release of serotonin and other neurotransmitters (Engel et al, 1986; Göthert et al, 1987; Maura et al, 1986; Sarhan et al, 2000). [11C]AZ10419369 was therefore considered to have potential for the measurement of alterations in serotonin levels.
In an initial study using the potent serotonin releaser fenfluramine, we showed a reduction in specific binding of [11C]AZ10419369 in monkey (Finnema et al, 2010). Fenfluramine decreased [11C]AZ10419369 binding in a dose-dependent manner with a regional average of 27% after 1.0 mg/kg and 50% after 5.0 mg/kg. This study showed for the first time a major decrease in radioligand receptor binding measured with PET in the primate brain after administration of a strong serotonin releasing agent. Importantly, our observations have recently been confirmed by two other PET centers using the 5-HT1B receptor antagonist [11C]P943 (Cosgrove et al, 2011; Ridler et al, 2011). These three PET studies indicate that 5-HT1B receptor radioligands are promising tools for measurement of endogenous serotonin release and provide good reason for further development of this methodology.
In our initial work (Finnema et al, 2010), we used a fenfluramine displacement paradigm with bolus injections of [11C]AZ10419369. A displacement paradigm is attractive for quantification of neurotransmitter release because it allows for direct observation of changes in neuronal activity during pharmacological or physiological stimulation, which are reflected in modified radioligand binding. However, one possible limitation of our initial fenfluramine study was the quantification of [11C]AZ10419369 binding by the late time method approach (Ito et al, 1998). A methodology considered more suitable for quantification of neurotransmitter release, when using a displacement paradigm, is the equilibrium approach, which uses the administration of radioactivity by a bolus and constant infusion (BI protocol; Carson et al, 1993; Lassen, 1992).
The aim of the present PET study was to confirm the effect of fenfluramine on [11C]AZ10419369 5-HT1B receptor binding using an equilibrium approach in monkey.
Materials and methods
PET Measurements in Nonhuman Primates
Three female cynomolgus monkeys (Macaca fascicularis), weighing 3.0 to 5.2 kg, were included in the study. The study was approved by the Animal Ethics Committee of the Swedish Animal Welfare Agency (Dnr 260/07) and was performed according to ‘Guidelines for planning, conducting and documenting experimental research' (Dnr 4820/06-600) of the Karolinska Institutet as well as the ‘Guide for the Care and Use of Laboratory Animals' (Clark et al, 1996). The monkeys are housed in the Astrid Fagraeus Laboratory of the Swedish Institute for Infectious Disease Control, Solna, Sweden.
Radiochemistry
[11C]AZ10419369 was prepared by N-methylation of the desmethyl precursor (AstraZeneca R&D, Wilmington, DE, USA) using [11C]methyl triflate, as described earlier (Pierson et al, 2008). The mean combined amount of radioactivity administered in the bolus and infusion (not decay corrected) was 308 MBq and ranged from 225 to 350 MBq. The mean specific radioactivity value at the start of the radioligand administration was 364 GBq/μmol, with a minimum of 84 GBq/μmol, corresponding to a mean administered mass of 0.82 μg with a maximum of 1.77 μg.
PET System
Positron emission tomography measurements were conducted using the High Resolution Research Tomograph (Siemens Molecular Imaging, Knoxville, TN, USA). List-mode data were reconstructed using the ordinary Poisson-3D-ordered subset expectation maximization algorithm, with 10 iterations and 16 subsets including modeling of the point spread function. The corresponding in-plane resolution with ordinary Poisson-3D-ordered subset expectation maximization point spread function was 1.5 mm in the center of the field of view and 2.4 mm at 10-cm off-center directions (Varrone et al, 2009).
PET Experimental Procedure
Anesthesia was initiated by intramuscular injection of ketamine hydrochloride (~10 mg/kg, Ketaminol, Intervet AB, Boxmeer, The Netherlands) and maintained by a mixture of sevoflurane (1.5% to 8%; Abbott Scandinavia AB, Solna, Sweden), oxygen (~30%), and medical air after endotracheal intubation. In all PET measurements the head was immobilized with a fixation device (Karlsson et al, 1993). Body temperature was maintained by Bair Hugger Model 505 (Arizant Healthcare, Eden Prairie, MN, USA) and continuously monitored by an oral thermometer. Electrocardiogram, heart rate, and respiratory rate were continuously monitored throughout the experiments, and blood pressure was monitored at least every 15 minutes.
On a typical experimental day, the monkey was intubated ~ 1 hour before the first PET measurement. A saline infusion (10 mL/h) was also started at the same time to ensure a continuous fluid administration during the day, but was stopped during the BI protocol of the radioligand. The radioligand was intravenously administrated in a sural vein of the monkey using a BI protocol, consisting of a bolus administration of [11C]AZ10419369 (in 4 mL saline) over ~ 5 seconds, and a continuous infusion of radioligand with a pump at a flow rate of ~10 mL/h initialized at the same time as the bolus injection. Attenuation correction data were acquired with a 6-minute transmission measurement using a single 137Cs source. List-mode data were acquired continuously for 125 or 155 minutes starting at the injection of [11C]AZ10419369. Positron emission tomography images were then reconstructed with a series of 26 or 31 frames of increasing duration (60 seconds × 3, 180 seconds × 6, 360 seconds × 17, or 360 seconds × 22).
Study Design
To obtain the most suitable BI protocol, six preparatory PET experiments were conducted in one monkey, which included Kbol values of 45, 60, 120, 180, 240, and 300 minutes, whereby a Kbol of 60 minutes indicates a bolus injection of the amount of radioactivity similar as infused over 1 hour. On three experimental days, two PET measurements, with duration of 123 minutes, were conducted 3 hours apart.
In the second part of the study, we examined the three monkeys each two times with [11C]AZ10419369 on two experimental days. On each day, a baseline measurement was followed by a displacement measurement with fenfluramine 1.0 or 5.0 mg/kg. Positron emission tomography measurements were conducted for 153 minutes and were initiated three and a half hours apart. A sterile solution of (±)-fenfluramine. HCl in saline was intravenously infused over 5 minutes, starting 80 minutes after the start of the BI protocol of [11C]AZ10419369. The doses of fenfluramine (1.0 and 5.0 mg/kg) are expressed as relative to the free base.
In the third part of the study, we examined the three monkeys each two times on one experimental day. A baseline measurement was followed by a pretreatment measurement with fenfluramine 5.0 mg/kg. PET measurements were conducted for 123 minutes and were initiated three and a half hours apart (Figure 1). A sterile solution of fenfluramine in saline was intravenously infused over 5 minutes, starting 30 minutes before the start of the BI protocol of [11C]AZ10419369. To minimize confounding carryover effects between experiments a minimum of 1 month elapsed between all experimental days.
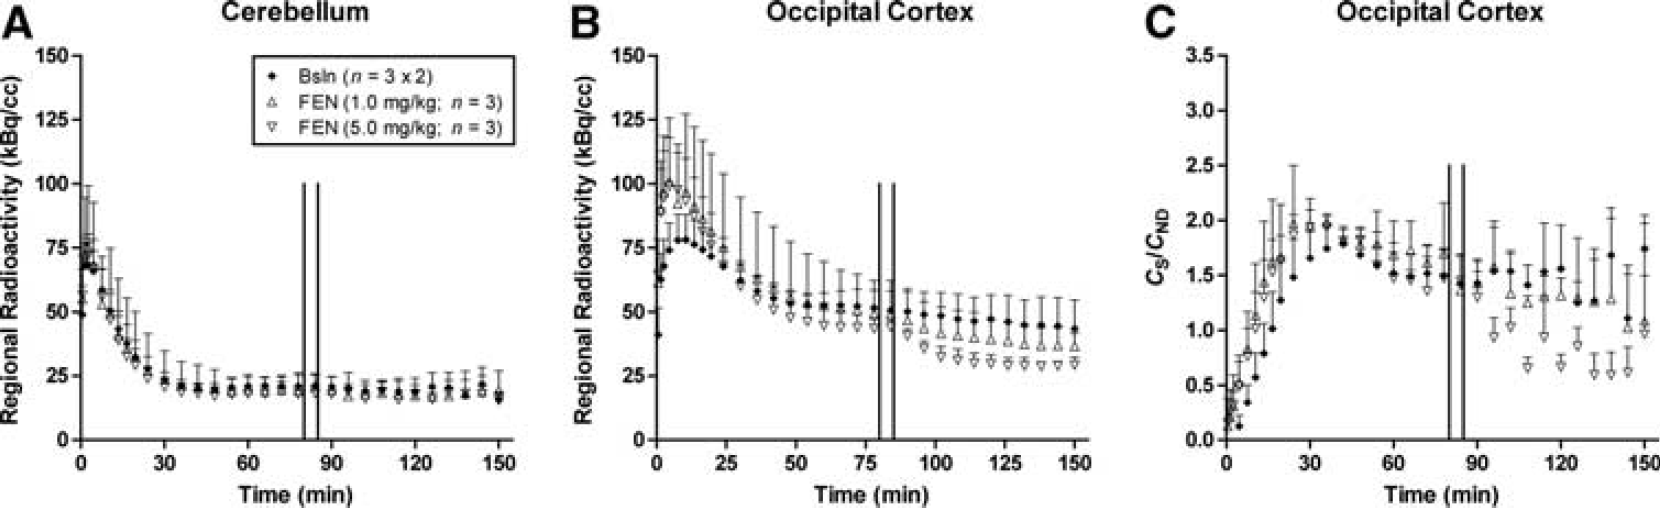
Mean time activity courses of radioactivity in cerebellum (
Regions of interest Definition
Brain magnetic resonance imaging was performed in a 1.5-T GE Signa system (General Electric, Milwaukee, WI, USA). AT1-weighted image was obtained for coregistration with PET and delineation of anatomic brain regions. The T1 sequence was a 3D spoiled gradient recalled protocol with the following settings: repetition time 21ms, flip angle 35°; field of view 12.8; matrix 256 × 256 × 128; 128 × 1.0 mm slices; and 2 number of excitations (NEX). The sequence was optimized for trade-off between a minimum of scanning time and a maximum of spatial resolution and contrast between gray and white matter.
Before delineation of regions of interests, the orientation of the brain was spatially normalized by having the high-resolution T1-weighted magnetic resonance images reoriented according to the line defined by the anterior and posterior commissures being parallel to the horizontal plane and the interhemispheric plane being parallel to the sagittal plane. The T1-weighted magnetic resonance images were then resliced to the resolution of the High Resolution Research Tomograph PET system, 1.219 × 1.219 × 1.219mm. The standardized T1-weighted magnetic resonance images were used as an individual anatomical template for each monkey. Regions of interests were defined manually on the reoriented magnetic resonance images. Regions of interests were drawn in the horizontal projection for the caudate nucleus (0.49 ± 0.05 cm3), cerebellum (CB, 0.91 ± 0.09 cm3), dorsal lateral prefrontal cortex (0.88 ± 0.12 cm3), globus pallidus (0.24 ± 0.02 cm3), midbrain (0.52 ± 0.08 cm3), occipital cortex (OC, 6.79 ± 1.09 cm3), putamen (0.70 ± 0.11 cm3), thalamus (0.69 ± 0.08 cm3), whole brain (62.77 ± 3.46 cm3), and in the coronal projection for the hippocampus (0.28 ± 0.07 cm3).
Mean PET images representing mean radioactivity between 0 to 57 minutes of the baseline PET measurement were coregistered to the magnetic resonance images using the normalized mutual information algorithm in PMOD (PMOD Technologies, Zurich, Switzerland). The generated transformation matrices were then applied to the dynamic emission data set of both PET measurements obtained on the same day.
Positron Emission Tomography Quantification
All calculations were based on the assumption that radioactivity in brain represents unchanged radioligand. Regional radioactivity concentrations were decay-corrected and expressed in kBq/mL. The CB is a region with negligible density of 5-HT1B receptors (Varnäs et al, 2001, 2004) and was used as an approximate for the sum of free (CFT) and nonspecifically bound (CNS) radioligand concentration in brain (CND). Specific binding (CS) to 5-HT1B receptors was defined as the difference between the total radioactivity concentration in high-density regions (CT) and CB (CND). During equilibrium conditions the binding potential (BPND; Innis et al, 2007) can be calculated according the equation (1) (Carson et al, 1993; Lassen, 1992):
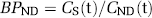
Data for a time interval when CT(t) and CND(t) were at a constant level were used for the calculation of BPND.
For illustrative purposes, BPND maps were generated of data originating from one experimental day using Vinci (Max-Planck-Institute, Cologne, Germany). BPND maps were derived for a baseline measurement and for a pretreatment measurement (5.0 mg/kg fenfluramine) using the time interval of 63 to 123 minutes.
Statistical Analysis
The measurements performed with the displacement paradigm allow for estimation of the reproducibility of regional BPND values between two PET measurements performed on the same day. The test-retest data were evaluated by using repeated measures analysis of variance, with the outcome measure (BPND) as the dependent variable, the test-retest as the repeated condition, and the day (n = 2) and region (n = 8) as cofactors. The significance level of the condition, day, region, and their respective interactions are reported. The relative reproducibility of regional BPND values was further examined by using the percent changes in BPND (%ΔBP) and the relative test-retest variability (%TRV). The %ΔBP was calculated as: [(BPND RETEST–BPND TEST)/BPND TEST] × 100% and %TRV was calculated as: [BPND TEST–BPND RETEST]/[(BPND TEST + BPND RETEST)/2] × 100%.
The effect of fenfluramine on the outcome measure (BPND) was evaluated by using repeated measures analysis of variance, with BPND as the dependent variable, the baseline and post-fenfluramine condition as the repeated condition, and the region (n = 8) as cofactor. The significance level of the condition, region, and the condition × region interaction are reported. When applicable, regional [11C]AZ10419369 BPND values obtained during baseline and postfenfluramine conditions were evaluated using paired t-tests. The minimum level of significance was designated as P < 0.05, and all statistical analyses were performed in STATISTICA (StatSoft, Tulsa, OK, USA).
Results
Selection of Kbol, Equilibrium Conditions, and Test-Retest Reproducibility
Initially, six different Kbol values (45, 60, 120, 180, 240, and 300 minutes) were tested in one monkey (M1). The obtained regional brain time activity curves showed that a Kbol value between 180 and 240 minutes was most suitable to achieve rapid equilibrium in brain regions containing varying 5-HT1B receptor densities (Supplementary Materials). Subsequent fenfluramine challenge studies were therefore performed using a Kbol value of 180 (M3) or 240 (M1 and M2) minutes.
The time course for mean radioactivity in the OC and CB obtained during constant infusion of [11C]AZ10419369 are shown in Figures 1A and 1B. The time courses for the mean ratio of the specific binding (CS) to the CB (CND) are shown in Figure 1C. Assuming that the equilibrium conditions were achieved during the time interval of 123 to 153 minutes, the radioactivity integrated over this time interval was compared with earlier time intervals to evaluate if equilibrium conditions were satisfied at earlier time. The integrated total radioactivity concentration (CT) and derivated specific binding ratio (CS/CND) of three consecutive 30-minute intervals during constant infusion of [11C]AZ10419369 in baseline conditions are given in Table 1 for three regions with a high 5-HT1B receptor density (globus pallidus, OC, and midbrain), for one region with a medium 5-HT1B receptor density (dorsal lateral prefrontal cortex), and for one region with a negligible 5-HT1B receptor density (CB). For the time interval of 63 to 93 and of 93 to 123 minutes, the regional radioactivity (CT) was across regions, respectively, 110% to 118% and 101% to 107%, than that of the time interval of 123 to 153 minutes. The CS/CND ratio was for the time interval of 63 to 93 and of 93 to 123 minutes, respectively, 98% to 110% and 105% to 113%, than that of the time interval of 123 to 153 minutes. Thus, the time interval of 63 to 93 minutes overestimated the CT values by 10% to 18%, resulting in no more than 10% deviation of the CS/CND ratio at the end of the PET measurement. BPND values were therefore calculated between 51 to 81 minutes (equilibrium before fenfluramine) and between 123 to 153 minutes (equilibrium after fenfluramine) in the displacement studies, and between 63 to 123 minutes in the pretreatment studies.
Integrated total radioactivity concentration (CT) and derivated specific binding ratio (CS/CND) of three consecutive 30-minute intervals during continuous infusion of [11C]AZ10419369 in baseline conditions (n = 3 × 2)
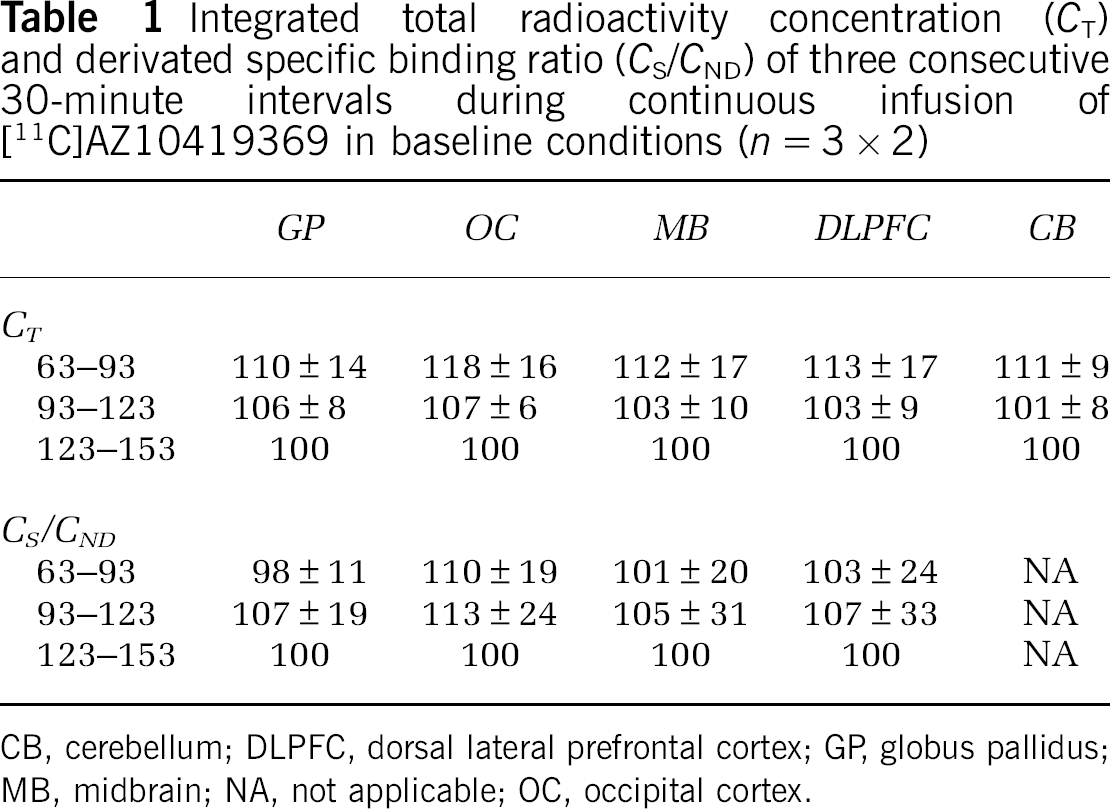
CB, cerebellum; DLPFC, dorsal lateral prefrontal cortex; GP, globus pallidus; MB, midbrain; NA, not applicable; OC, occipital cortex.
The displacement studies with fenfluramine allowed for evaluation of test-retest reproducibility of BPND values estimated using the time interval of 51 to 81 minutes of the baseline (BPND TEST) and displacement measurements (BPND RETEST). The mean BPND values obtained during the test and retest study using constant infusion of [11C]AZ10419369 are presented in Table 2 (n = 3 × 2, for each condition). Statistical analysis showed no significant effect of condition (P = 0.9974) and day (P = 0.1928), but a significant effect of region (P < 0.001) on [11C]AZ10419369 BPND values. No significant interaction was found between condition, day and region effects on regional [11C]AZ10419369 BPND values (condition × day, P = 0.9019; condition × region, P = 0.9402; day × region, P = 0.1948; and condition × day × region, P = 0.2840; Table 2). Across eight brain regions, the mean percentage change in BPND (%ΔBP) ranged from −6% to 4% and the mean test-retest variability (%TRV) ranged from 3% to 14%, thus demonstrating good test-retest variability.
Test-retest reproducibility of [11C]AZ10419369 BPND (EM 51′ to 81′, n = 3 × 2, for each condition)
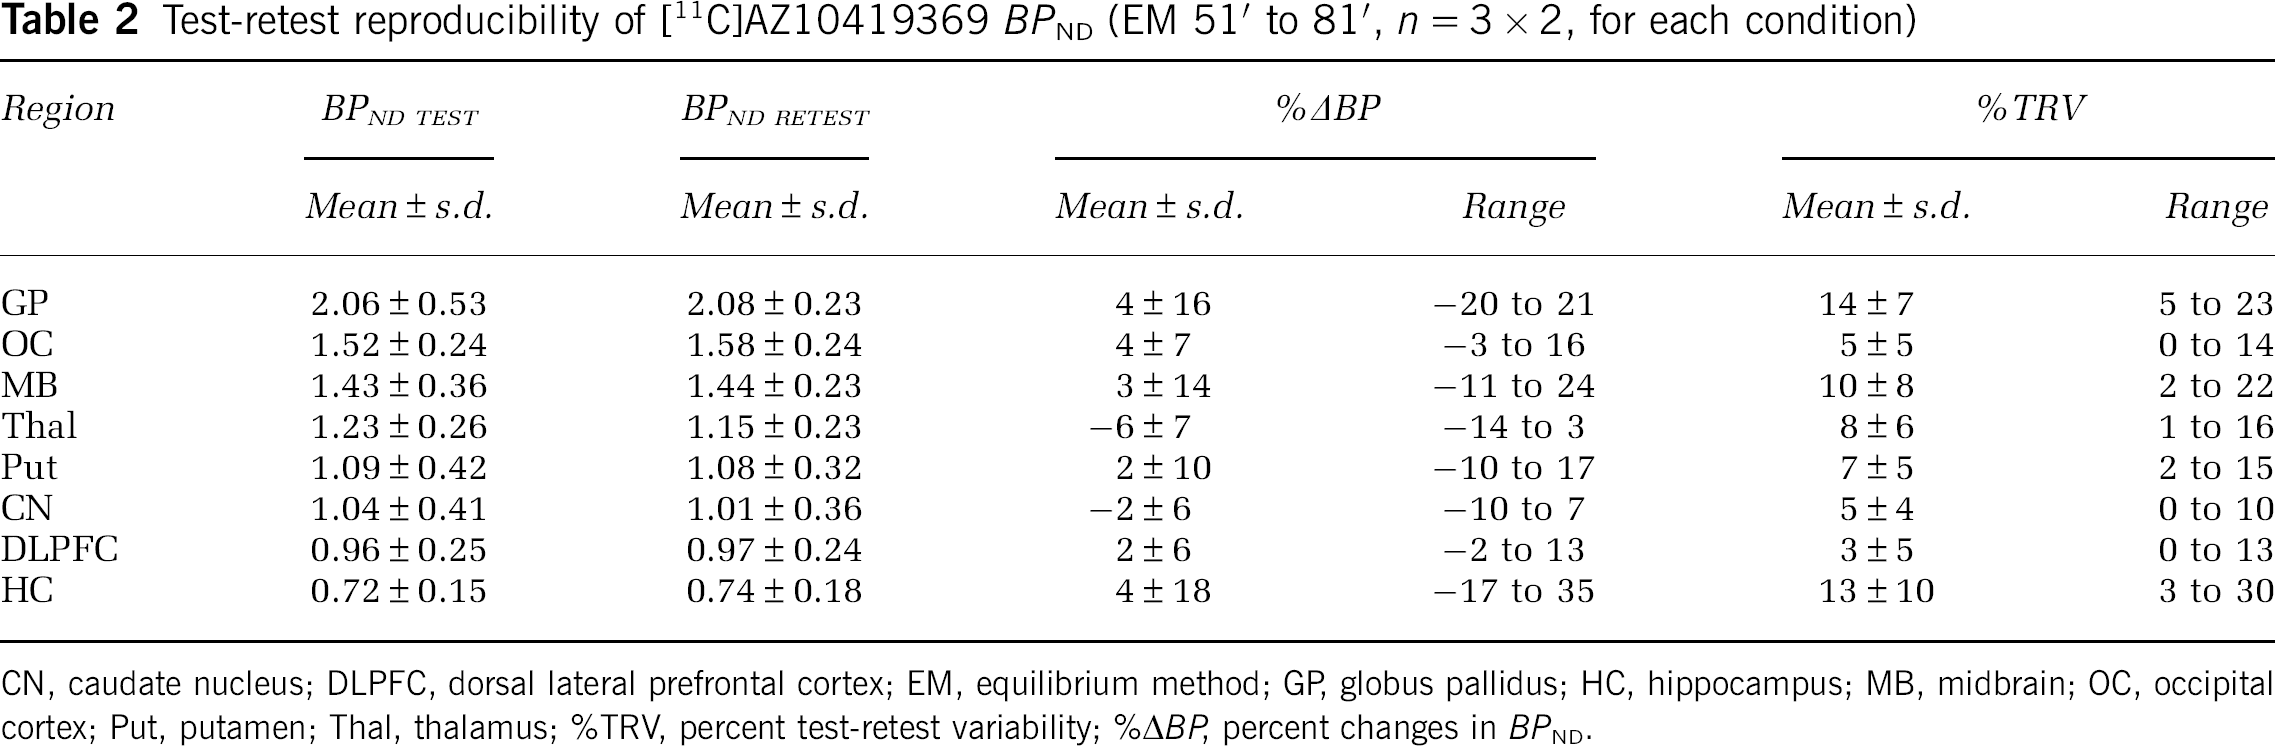
CN, caudate nucleus; DLPFC, dorsal lateral prefrontal cortex; EM, equilibrium method; GP, globus pallidus; HC, hippocampus; MB, midbrain; OC, occipital cortex; Put, putamen; Thal, thalamus; %TRV, percent test-retest variability; %ΔBP, percent changes in BPND.
Fenfluramine Effect
In both the displacement and pretreatment studies, fenfluramine caused an evident, dose-dependent, decrease in [11C]AZ10419369 binding in all 5-HT1B receptor containing regions (Figures 1–4, Table 3).
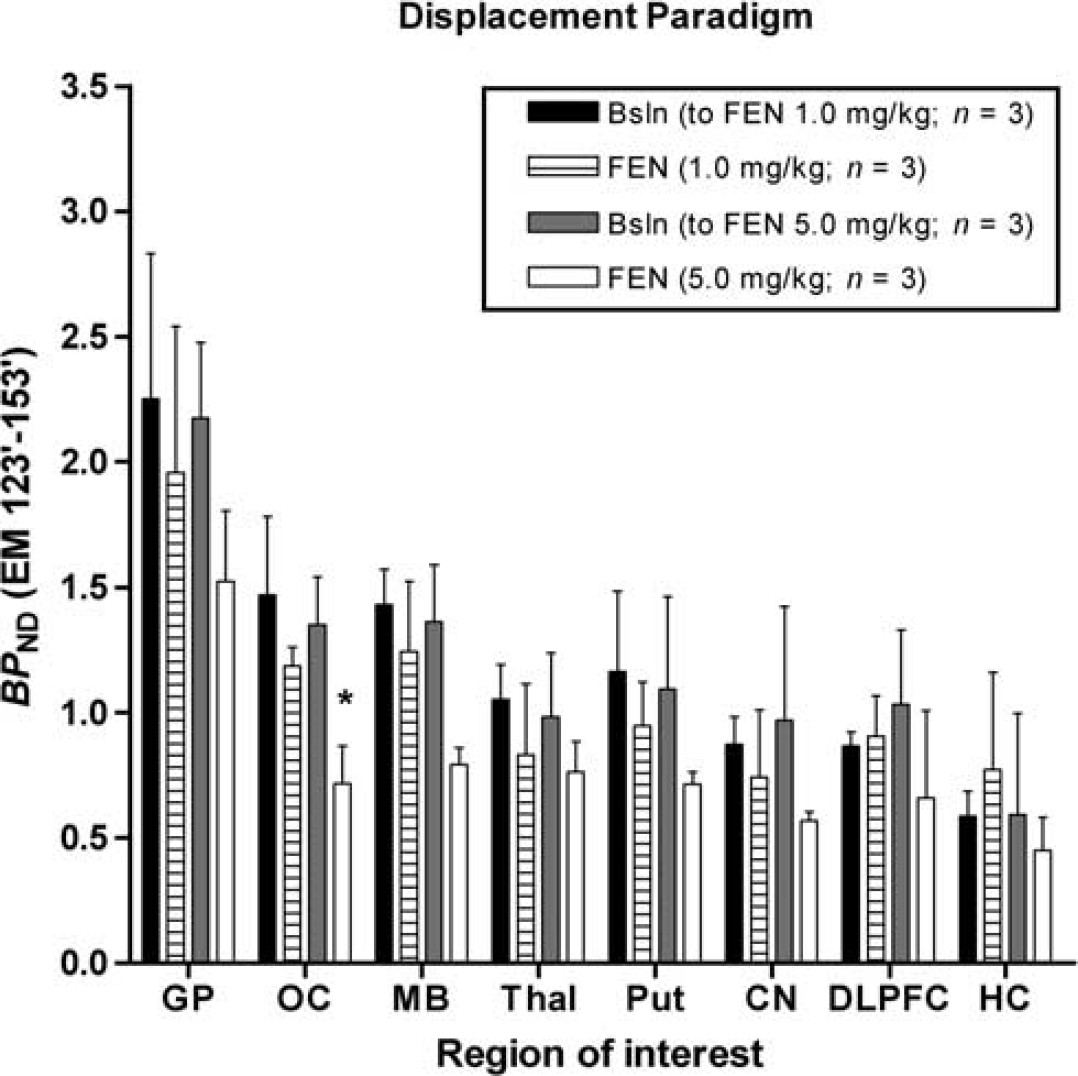
Mean binding potential (BPND) values obtained after intravenous administration of [11C]AZ10419369 using a bolus infusion (BI) protocol in three monkeys during baseline and displacement conditions with fenfluramine (FEN, 1.0 and 5.0 mg/kg). All values represent the mean and standard deviation of three measurements. In the displacement studies FEN was administered during the time period of 80 to 85 minutes after the start of BI protocol. *Indicates significant difference compared with BPND of corresponding baseline (Bsln, P < 0.05). CN, caudate nucleus; DLPFC, dorsal lateral prefrontal cortex; EM, equilibrium method; GP, globus pallidus; HC, hippocampus; MB, midbrain; OC, occipital cortex; Put, putamen; Thal, thalamus.
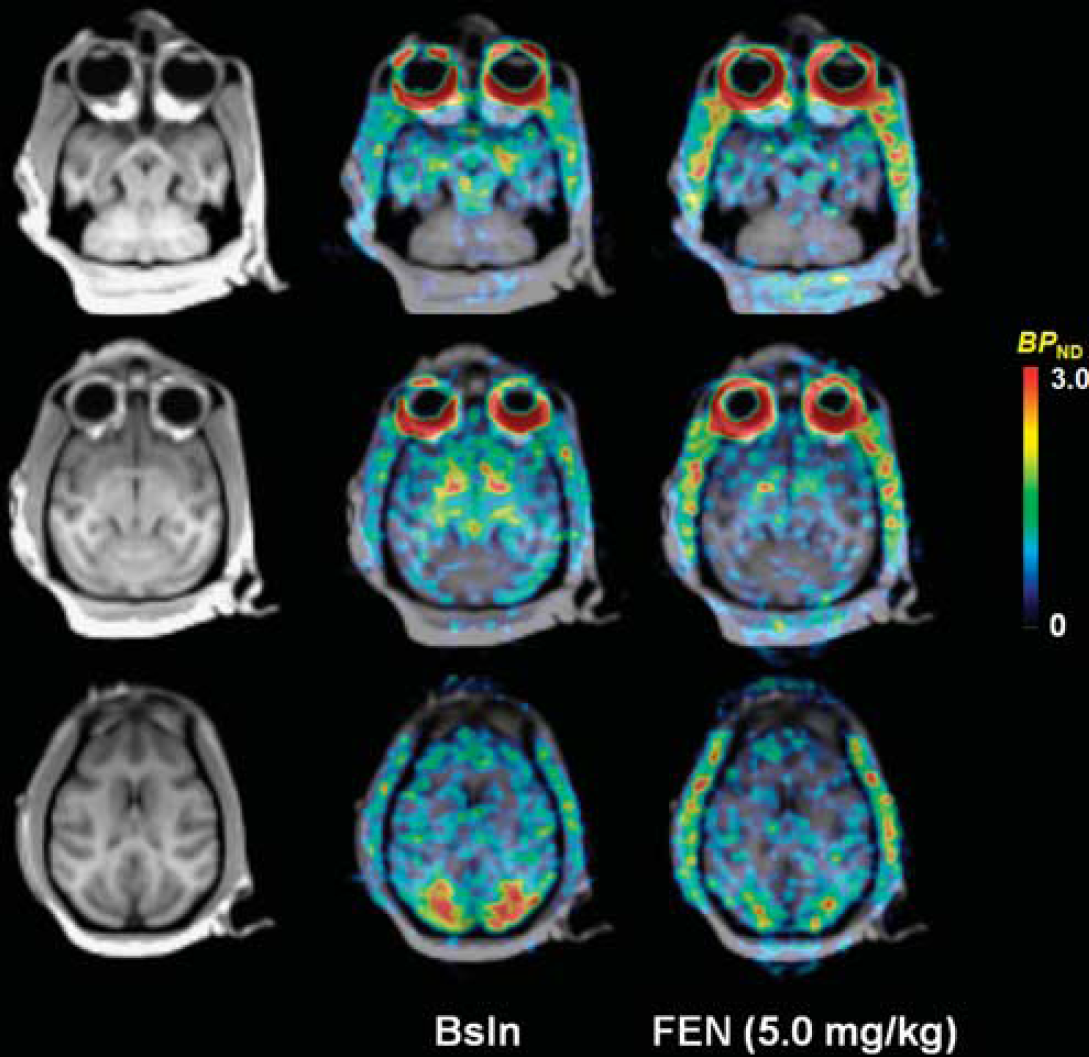
Magnetic resonance images and corresponding overlaid BPND maps (EM 63′ to 123′) obtained after intravenous administration of [11C]AZ10419369 in cynomolgus monkey (M1) and presented for three transaxial planes corresponding to the level of the midbrain (top), globus pallidus (middle), and occipital cortex (bottom). BPND maps are presented for the baseline condition (Bsln, middle) and after pretreatment with 5.0 mg/kg fenfluramine (FEN, right).

Time activity courses of mean CS/CND values for the occipital cortex after intravenous administration of [11C]AZ10419369 using a bolus infusion protocol in three monkeys during baseline (Bsln) and pretreatment conditions with fenfluramine (FEN, 5.0 mg/kg,
Comparison of fenfluramine (1.0 and 5.0 mg/kg) effect on [11C]AZ10419369 binding potential (BPND) measured with a displacement and pretreatment paradigm in three cynomolgus monkeys (M1 to M3)

CN, caudate nucleus; CV, coefficient of variation; DLPFC, dorsal lateral prefrontal cortex; EM, equilibrium method; GP, globus pallidus; HC, hippocampus; MB, midbrain; OC, occipital cortex; Put, putamen; s.d., standard deviation; Thal, thalamus.
In the displacement paradigm, fenfluramine (1.0 mg/kg) did not significantly reduce [11C]AZ10419369 BPND (FEN equilibrium method (EM) 123′ to 153′) when compared with control BPND (FEN EM 51′ to 81′; condition, P = 0.2575). The effect of region on [11C]AZ10419369 BPND was significant (P < 0.001), but the condition × region interaction was not significant (P = 0.0576; Figure 2, Table 3).
In the displacement paradigm, fenfluramine (5.0 mg/kg) did not significantly reduce [11C]AZ10419369 BPND (FEN EM 123′ to 153′) when compared with control BPND (FEN EM 51′ to 81′; condition, P = 0.1369). The effect of region on [11C]AZ10419369 BPND was significant (P < 0.001), as well as the condition × region interaction (P < 0.05; Figure 2, Table 3). Paired t-test analyses showed a significant effect of 5.0 mg/kg fenfluramine on [11C]AZ10419369 BPND (FEN EM 123′ to 153′) in the OC when compared with control BPND, (FEN EM 51′ to 81′; Figure 2, Table 3).
In the pretreatment paradigm, fenfluramine (5.0 mg/kg) significantly reduced [11C]AZ10419369 BPND (FEN EM 63′ to 123′) when compared with baseline BPND (Bsln EM 63′ to 123′; condition, P = 0.029). The effect of region on [11C]AZ10419369 BPND was significant (P < 0.001), as well as the condition × region interaction (P < 0.001; Figure 4, Table 3). Paired t-test analyses showed a significant effect of 5.0 mg/kg fenfluramine on [11C]AZ10419369 BPND (FEN EM 63′ to 123′) in four brain regions (globus pallidus, OC, midbrain, and thalamus) when compared with baseline BPND (Bsln EM 63′ to 123′; Figure 4, Table 3).
Discussion
We previously showed that administration of the potent serotonin releasing agent fenfluramine decreased [11C]AZ10419369 receptor binding in nonhuman primates using PET (Finnema et al, 2010). The aim of the present PET study was to confirm the effect of fenfluramine on [11C]AZ10419369 5-HT1B receptor binding during equilibrium conditions in monkey. First, a BI protocol for administration of [11C]AZ10419369 was developed for in vivo quantification of radioligand receptor binding during equilibrium conditions. Second, we showed that fenfluramine administration caused a decrease in [11C]AZ10419369 binding in all 5-HT1B receptor-rich regions using either a displacement or pretreatment paradigm. The current study confirms that administration of fenfluramine causes a reduction in [11C]AZ10419369 receptor binding, and provides an improved methodology for measurement of serotonin release using [11C]AZ10419369 and PET.
Development of a BI protocol is facilitated by a priori selection of a Kbol value, which is suitable for rapid achievement of equilibrium in regional brain radioactivity concentrations. Typically, a suitable Kbol value can be estimated from regional brain time activity curves that were obtained during a previous PET study, which applied a bolus injection of the radioligand (see appendix B of Carson et al, 1993). We estimated suitable Kbol values using regional brain time activity curves of two PET measurements, in which [11C]AZ10419369 was administered as a bolus injection to a single monkey (M1). Predicted suitable Kbol values varied per region between 45 to 90 minutes, and are similar to reported Kbol values used for [11C]raclopride (52 to 91 minutes), another radioligand with rapid brain kinetics (Carson et al, 1997; Ito et al, 1998). In initial PET measurements, conducted for assessment of a suitable Kbol value, we however found that a relative high Kbol value of 180 to 240 minutes was required for [11C]AZ10419369 to rapidly achieve equilibrium.
During four of the initial Kbol selection measurements [11C]AZ10419369 concentration in plasma was determined to examine whether steady-state conditions between plasma and brain regions were achieved. The observed brain radioactivity concentrations followed the [11C]AZ10419369 plasma concentration. This observation confirms the relative high Kbol value required for rapid achievement of equilibrium (Supplementary Materials). The discrepancy between the suitable Kbol values estimated and experimentally determined requires further evaluation of the experimental conditions, such as in a recent observation that the radioactivity concentration provided by the syringe pump system during the initial time interval of the infusion sometimes may deviate from the expected concentration. Although the optimal Kbol value can therefore be further developed, the nonoptimal methodology should however not affect the main objective of this study, as the effect of fenfluramine on [11C]AZ10419369 binding could still be measured under equilibrium conditions.
When applying the BI approach, an important criterion for proper quantification is to achieve a true equilibrium for [11C]AZ10419369 in brain regions. One approach to examine the achievement of a true binding equilibrium for [11C]AZ10419369 is to compare CT and CS/CND values between early time frames and the last time frames of the same PET measurement. In this study, the changes found in CT and in CS/CND values over time were close to the typically well-accepted range of 5% to 10%. Further confirmation of achievement of equilibrium conditions was obtained by comparing BPND values estimated with the EM and a kinetic modeling approach (Tomasi et al, 2008). BPND values estimated with the simplified reference tissue model (SRTM) and the EM (EM 63 to 123 minutes) correlated well during baseline (BPND (EM) = 1.077 × BPND (SRTM)–0.061; R2 = 0.9639) and pretreatment conditions (BPND (EM) = 1.004 × BPND (SRTM)–0.026; R2 = 0.9781). We conclude that a suitable equilibrium was achieved from 63 minutes after start of administration of radioligand and that the EM is suitable for quantification of the fenfluramine effect in the pretreatment paradigm. For quantification of the fenfluramine effect in the displacement paradigm, an initial time frame of the fenfluramine displacement study can be used for derivation of control BPND values. Acquisition of one PET measurement may therefore be sufficient for determination of the fenfluramine effect.
To further validate the methodology for measurement of drug-induced changes in radioligand binding, we also made a small test-retest analysis in the current displacement study. Comparison of BPND values obtained for the initial time frame of two PET measurements, performed on the same day (Bsln EM 51′ to 81′ versus FEN EM 51′ to 81′), yielded no statistical significant differences for the test-retest variability. We can therefore exclude a significant role of potential confounders such as differences in anesthesia effects during the experimental day and carryover effects of injected radioligand mass between the two consecutive PET measurements.
The test compound fenfluramine is generally considered a substrate for the serotonin transporter protein (SERT) and may increase extracellular serotonin levels by SERT inhibition and by promotion of carrier-mediated exchange (Garattini et al, 1986; Rudnick and Clark, 1993). Microdialysis studies in unanesthetized monkeys have shown that an intravenous dose of 5 mg/kg fenfluramine increases serotonin levels by 20-fold (Udo de Haes et al, 2006). The observed fenfluramine-induced decrease in [11C]AZ10419369 binding, in both displacement and pretreatment studies, is therefore likely related to elevated serotonin levels.
The here reported mean fenfluramine effect on [11C]AZ10419369 binding across eight brain regions (–12% at 1.0 mg/kg; −33% and −34% at 5.0 mg/kg) is in line with our previous study, in which [11C]AZ10419369 was administered as a bolus injection (–27% at 1.0 mg/kg; −50% at 5.0 mg/kg; Finnema et al, 2010). A comparable effect of fenfluramine on radioligand binding has more recently also been showed using the 5-HT1A receptor radioligand [11C]CUMI-101 (Milak et al, 2010) and the 5-HT1B receptor radioligand [11C]P943 (Cosgrove et al, 2011; Ridler et al, 2011). Importantly, the extent of the displacement effect of the three radioligands has been shown to be comparable, at equivalent (±)-fenfluramine doses (approximately −25% at 1.0 mg/kg; −40% at 5.0 mg/kg). Although the three radioligands provide similar results in the fenfluramine challenge, the methodology used for quantification has been different across the radioligands. Only for [11C]AZ10419369 the reference region approach has so far been validated. This simplified quantitative approach is an advantage when advancing to clinical studies, as no blood sampling is required.
The CB has been considered suitable for estimation of nondisplaceable binding of [11C]AZ10419369, based on several previous findings. First, postmortem autoradiography studies have showed that the 5-HT1B receptor density is negligible in the CB of the primate brain (Varnäs et al, 2001, 2004). Second, pretreatment studies with 5-HT1B receptor antagonists have shown no evident effect on [11C]AZ10419369 binding in the CB of guinea-pig and monkey (Maier et al, 2009; Pierson et al, 2008). Third, the cerebellar distribution volume (VND) did not decrease after oral administration of the 5-HT1B receptor antagonist AZD3783 in man (Varnäs et al, 2011b). All together, the literature supports that the CB can be considered a suitable reference region for quantification of [11C]AZ10419369 receptor binding in the brain.
A classical displacement paradigm is typically applied to show reversibility of radioligand binding. In our previous study we showed a fenfluramine displacement effect on [11C]AZ10419369 binding using bolus injection of the radioligand (Finnema et al, 2010). A limitation of such a design is that a separate PET measurement is required to obtain baseline BPND, values. In the current study we show that one PET measurement is sufficient for estimation of changes in serotonin levels when using the BI approach. Moreover, the fenfluramine-induced displacement of [11C]AZ10419369 binding confirms the reversibility of the radioligand binding. This observation adds to the previous literature on the validation of [11C]AZ10419369 (Finnema et al, 2010; Maier et al, 2009; Pierson et al, 2008; Varnäs et al, 2011a b ) and confirms that the koff value is sufficient for measurement of changes in serotonin levels.
Microdialysis studies have previously shown that serotonin levels are very dynamic after intravenous administration of fenfluramine. In monkey, a rapid intravenous bolus injection of fenfluramine has been shown to induce a peak in serotonin levels ~ 15 minutes after administration, followed by a rapid decrease in serotonin levels over time. One hour after administration, serotonin levels were less than half of the peak value, with recovery to baseline levels ~ 4 hours after fenfluramine administration (Udo de Haes et al, 2006). The time effect in the fenfluramine-induced decreases in [11C]AZ10419369 BPND values can be evaluated when comparing the results measured in the displacement and the pretreatment paradigm. After 5.0 mg/kg fenfluramine administration, the mean BPND, of the eight reported regions was decreased by 33% during the displacement, and by 35% and 32% during the respective time periods of 63 to 93 and 93 to 123 minutes of the pretreatment paradigm. These results suggest that the changes in BPND values do not directly reflect the time dynamics of the serotonin levels, as previously measured in the extracellular fluid when using microdialysis. This difference could partly be related to the fenfluramine administration. The current study applied a 5-minute infusion of fenfluramine, thereby likely to cause a blunter peak in the serotonin levels, when compared with the microdialysis studies using a rapid bolus injection of fenfluramine. A contribution of receptor internalization and desensitization is another possible explanation for the prolonged decrease in [11C]AZ10419369 receptor binding. Such mechanisms have previously been shown relevant for endogenous neurotransmitter release studies using PET radioligands binding to other G-protein-coupled receptors, such as dopamine (Laruelle, 2000).
Examination of regional differences in fenfluramine effect is of interest to further understand the applied methodology. A number of biological aspects should however be considered when comparing regional changes in [11C]AZ10419369 BPND, values. 5-HT1B receptors are known to be located on terminals of serotonergic (autoreceptors) and non-serotonergic neurons (heteroreceptors; Engel et al, 1986; Göthert et al, 1987; Maura et al, 1986; Sari et al, 1999). Regional differences in the ratio of auto- and heteroreceptors may potentially have impact on differences in regional changes in [11C]AZ10419369 binding (Sarhan and Fillion, 1999). In addition, the regional differences in fenfluramine effect on [11C]AZ10419369 binding can be anticipated based on the regional distribution of SERT and based on regional differences in baseline serotonin levels (Hume et al, 2001). In the current study, the effect of fenfluramine on [11C]AZ10419369 BPND values was evaluated for eight different regions, but no evident differences were observed. Further studies, with an increased number of subjects, are required to further explore regional differences of the fenfluramine effect on [11C]AZ10419369 binding.
One alternative interpretation we recognized is that fenfluramine has a direct competitive effect on [11C]AZ10419369 receptor binding. The in the literature reported 5-HT1A and 5-HT1B receptor affinity of fenfluramine are, however, in the micro molar range (Mennini et al, 1991). In addition, fenfluramine was reported not to influence the 5-HT1A receptor binding of the antagonist radioligand [18F]MPPF (Udo de Haes et al, 2006). We therefore argue that the observed effect of fenfluramine on radioligand binding is most likely due to elevated serotonin levels, but further confirmation with other serotonin level modifying agents is required to fully exclude direct competitive effects of fenfluramine and its metabolites. First results of this approach have very recently shown that administration of the stimulant D-amphetamine and the SERT inhibitor citalopram both decreased [11C]P943 binding (Ridler et al, 2011). These results further support that the observed changes in radioligand binding are not fenfluramine specific, but are related to changes in serotonin levels.
Follow up studies, applying the here evaluated methodology and other serotonin level modifying drugs, are currently ongoing to further explore the limit of sensitivity toward modified serotonin levels in nonhuman primates. Ultimately, human studies are required to fully assess the utility of [11C]AZ10419369 and PET to determine serotonin release in the living brain of humans. When using the mean plasma input function and regional brain time activity curves obtained after bolus injection of [11C]AZ10419369 in human subjects from a previous reported study, we estimate that a Kbol value of 180 to 240 minutes may be suitable in humans. Such approach may ultimately be applied to study the pathophysiology and treatment of common central nervous system disorders, such as mood, anxiety, sleep, and eating disorders.
In summary, the current PET study confirms that fenfluramine decreases [11C]AZ10419369 receptor binding in nonhuman primates. The displacement studies confirm the reversibility of [11C]AZ10419369 binding and show that the koff value is sufficient for measurement of changes in serotonin levels. The more advanced methodology is suitable for exploring the sensitivity limit to serotonin release as measured using [11C]AZ10419369 and PET.
Footnotes
Acknowledgements
We thank AstraZeneca for providing the radioligand precursor and H Lundbeck A/S (Dr Benny Bang-Andersen) for providing (±)-fenfluramine. We also gratefully acknowledge the Karolinska PET group, including special thanks to Gudrun Nylen, for excellent technical assistance.
Lars Farde is a shareholder with AstraZeneca. All other authors declare no conflict of interest.
References
Supplementary Material
Please find the following supplemental material available below.
For Open Access articles published under a Creative Commons License, all supplemental material carries the same license as the article it is associated with.
For non-Open Access articles published, all supplemental material carries a non-exclusive license, and permission requests for re-use of supplemental material or any part of supplemental material shall be sent directly to the copyright owner as specified in the copyright notice associated with the article.