




Abstract
Evaluation of cortical reorganization in chronic stroke patients requires methods to accurately localize regions of neuronal activity. Blood oxygenation level-dependent (BOLD) functional magnetic resonance imaging (fMRI) is frequently employed; however, BOLD contrast depends on specific coupling relationships between the cerebral metabolic rate of oxygen (CMRO2), cerebral blood flow (CBF), and volume (CBV), which may not exist following stroke. The aim of this study was to understand whether CSF-weighted (CBFw) and CSV-weighted (CBVw) fMRI could be used in sequence with BOLD to characterize neurovascular coupling mechanisms poststroke. Chronic stroke patients (n = 11) with motor impairment and age-matched controls (n = 11) performed four sets of unilateral motor tasks (60 seconds/30 seconds off/on) during CBFw, CBVw, and BOLD fMRI acquisition. While control participants elicited mean BOLD, CBFw, and CBVw responses in motor cortex (P < 0.01), patients showed only mean changes in CBF (P < 0.01) and CBV (P < 0.01), but absent mean BOLD responses (P = 0.20). BOLD intersubject variability was consistent with differing coupling indices between CBF, CBV, and CMRO2. Thus, CBFw and/or CBVw fMRI may provide crucial information not apparent from BOLD in these patients. A table is provided outlining distinct vascular and metabolic uncoupling possibilities that elicit different BOLD responses, and the strengths and limitations of the multimodal protocol are summarized.
Keywords
Introduction
Improved management of cerebrovascular disease has reduced stroke-related mortality over the past several decades (Langhorne et al, 1993). However, many stroke survivors remain impaired with <25% able to perform prestroke equivalent levels of physical activity 6 months poststroke (Duncan et al, 2000). The development and evaluation of novel rehabilitation strategies may be accelerated by improving our understanding of positive cortical reorganization, or cerebral plasticity.
Physiological neuroimaging studies have greatly increased our understanding of cerebral plasticity and learning in the healthy brain. Nevertheless, important challenges must be overcome to translate this knowledge into new treatments (Cheeran et al, 2009). Specifically, in stroke recovery research, novel training regimens and/or pharmacological facilitation require a means to evaluate how interventions modulate plasticity related to functional recovery. Neuronal and hemodynamic reorganization occur over different anatomical scales during motor recovery: local rearrangement within primary motor cortex, increased activity in ipsilesional nonprimary sensorimotor areas, and increased activity in the uninjured hemisphere (Johansen-Berg, 2007). To date, neuroimaging techniques such as magnetic resonance imaging (MRI) and positron emission tomography have not consistently demonstrated a clear relationship between radiological findings, rehabilitation, and long-term prognosis (Buma et al, 2010).
Functional MRI (fMRI), most frequently utilizing blood oxygenation level-dependent (BOLD) contrast, represents the most popular avenue for evaluating recovery, as it can be performed in patients without the use of exogenous contrast agents or ionizing radiation (Ogawa et al, 1990). The BOLD fMRI response depends on the net change in capillary and venous blood oxygenation that result from disproportionate changes in cerebral blood flow (CBF), cerebral blood volume (CBV), and the cerebral metabolic rate of oxygen consumption (CMRO2). Under conditions of healthy brain function, a positive BOLD signal arises due to a larger increase in CBF relative to CMRO2, leading to a reduction in relative concentration of paramagnetic deoxy-hemoglobin in capillaries and veins. Neurovascular coupling, however, is known to be altered in stroke, hypertension, and atherosclerosis, possibly disturbing the coupling of CBF and CBV to CMRO2, and lowering cerebrovascular reserve capacity (Derdeyn et al, 2002; Girouard and Iadecola, 2006; Roc et al, 2006). In some cases, this leads to no measurable BOLD signal despite evidence of neuronal activity (Rossini et al, 2004). Consequently, there is a need to critically evaluate the BOLD fMRI methodology in chronic stroke patients, and possibly develop more specific noninvasive imaging techniques.
It has been hypothesized that less widely utilized noninvasive fMRI techniques, for example, arterial spin labeling (ASL) (Williams et al, 1992), which is sensitive to changes in CBF, and vascular-space-occupancy (VASO) (Lu et al, 2003), which is sensitive to changes in CBV, might more accurately quantify details of cortical hemodynamics in chronic stroke (Donahue et al, 2012). Clinically, ASL has been used to show perfusion deficits in acute (Macintosh et al, 2010b) and chronic (Brumm et al, 2010) stroke and VASO has been successfully applied in studies of ischemic steno-occlusive disease (Donahue et al, 2009c, 2010). However, no fMRI activation studies have directly compared BOLD with these new fMRI techniques, nor evaluated their feasibility or added value in chronic stroke. Here, we systematically evaluated CBF-weighted (CBFw), CBV-weighted (CBVw), and BOLD responses associated with a motor task in chronic stroke patients and age-matched controls. Our primary hypothesis was that BOLD fMRI would underestimate the area of cortical activity in stroke patients relative to separate weighted measures of CBF (as quantified using ASL) and CBV (using VASO). A secondary hypothesis was that differences between fMRI techniques would be more prevalent in patients with large-vessel disease, as these patients lack the ability to regulate CBF to the same extent as healthy subjects. Results establish the feasibility of performing multimodal fMRI in chronic stroke patients, demonstrate discord in hemodynamic coupling in patients, and outline the strengths and limitations of multimodal investigations in chronic stroke.
Materials and methods
All participants (n = 22) provided informed, written consent, and the study was carried out in accordance with local Research Ethics Committee approval (Oxfordshire Research Ethics Committee A Ref: 06/Q1604/2). Stroke patients (n = 11; age = 61 years ± 13) with motor impairment (Table 1) and age-matched controls (n = 11; age = 61 years ± 8, 6 males) with no history of cerebrovascular disease were enrolled. Stroke patients with residual hand paralysis, identified from discharge letters from a local rehabilitation clinic, were considered for participation if they had no prior history of neurological disease, but excluded if they had persistent complete paralysis of the hand or MRI contraindications. Based on hospital discharge letters and prior clinical imaging, evidence of atherosclerosis was documented. Patient motor deficits at enrollment were recorded using the upper extremity section from the Fugl-Meyer score scale (range 0 to 66) (Fugl-Meyer et al, 1975).
Patient characteristics
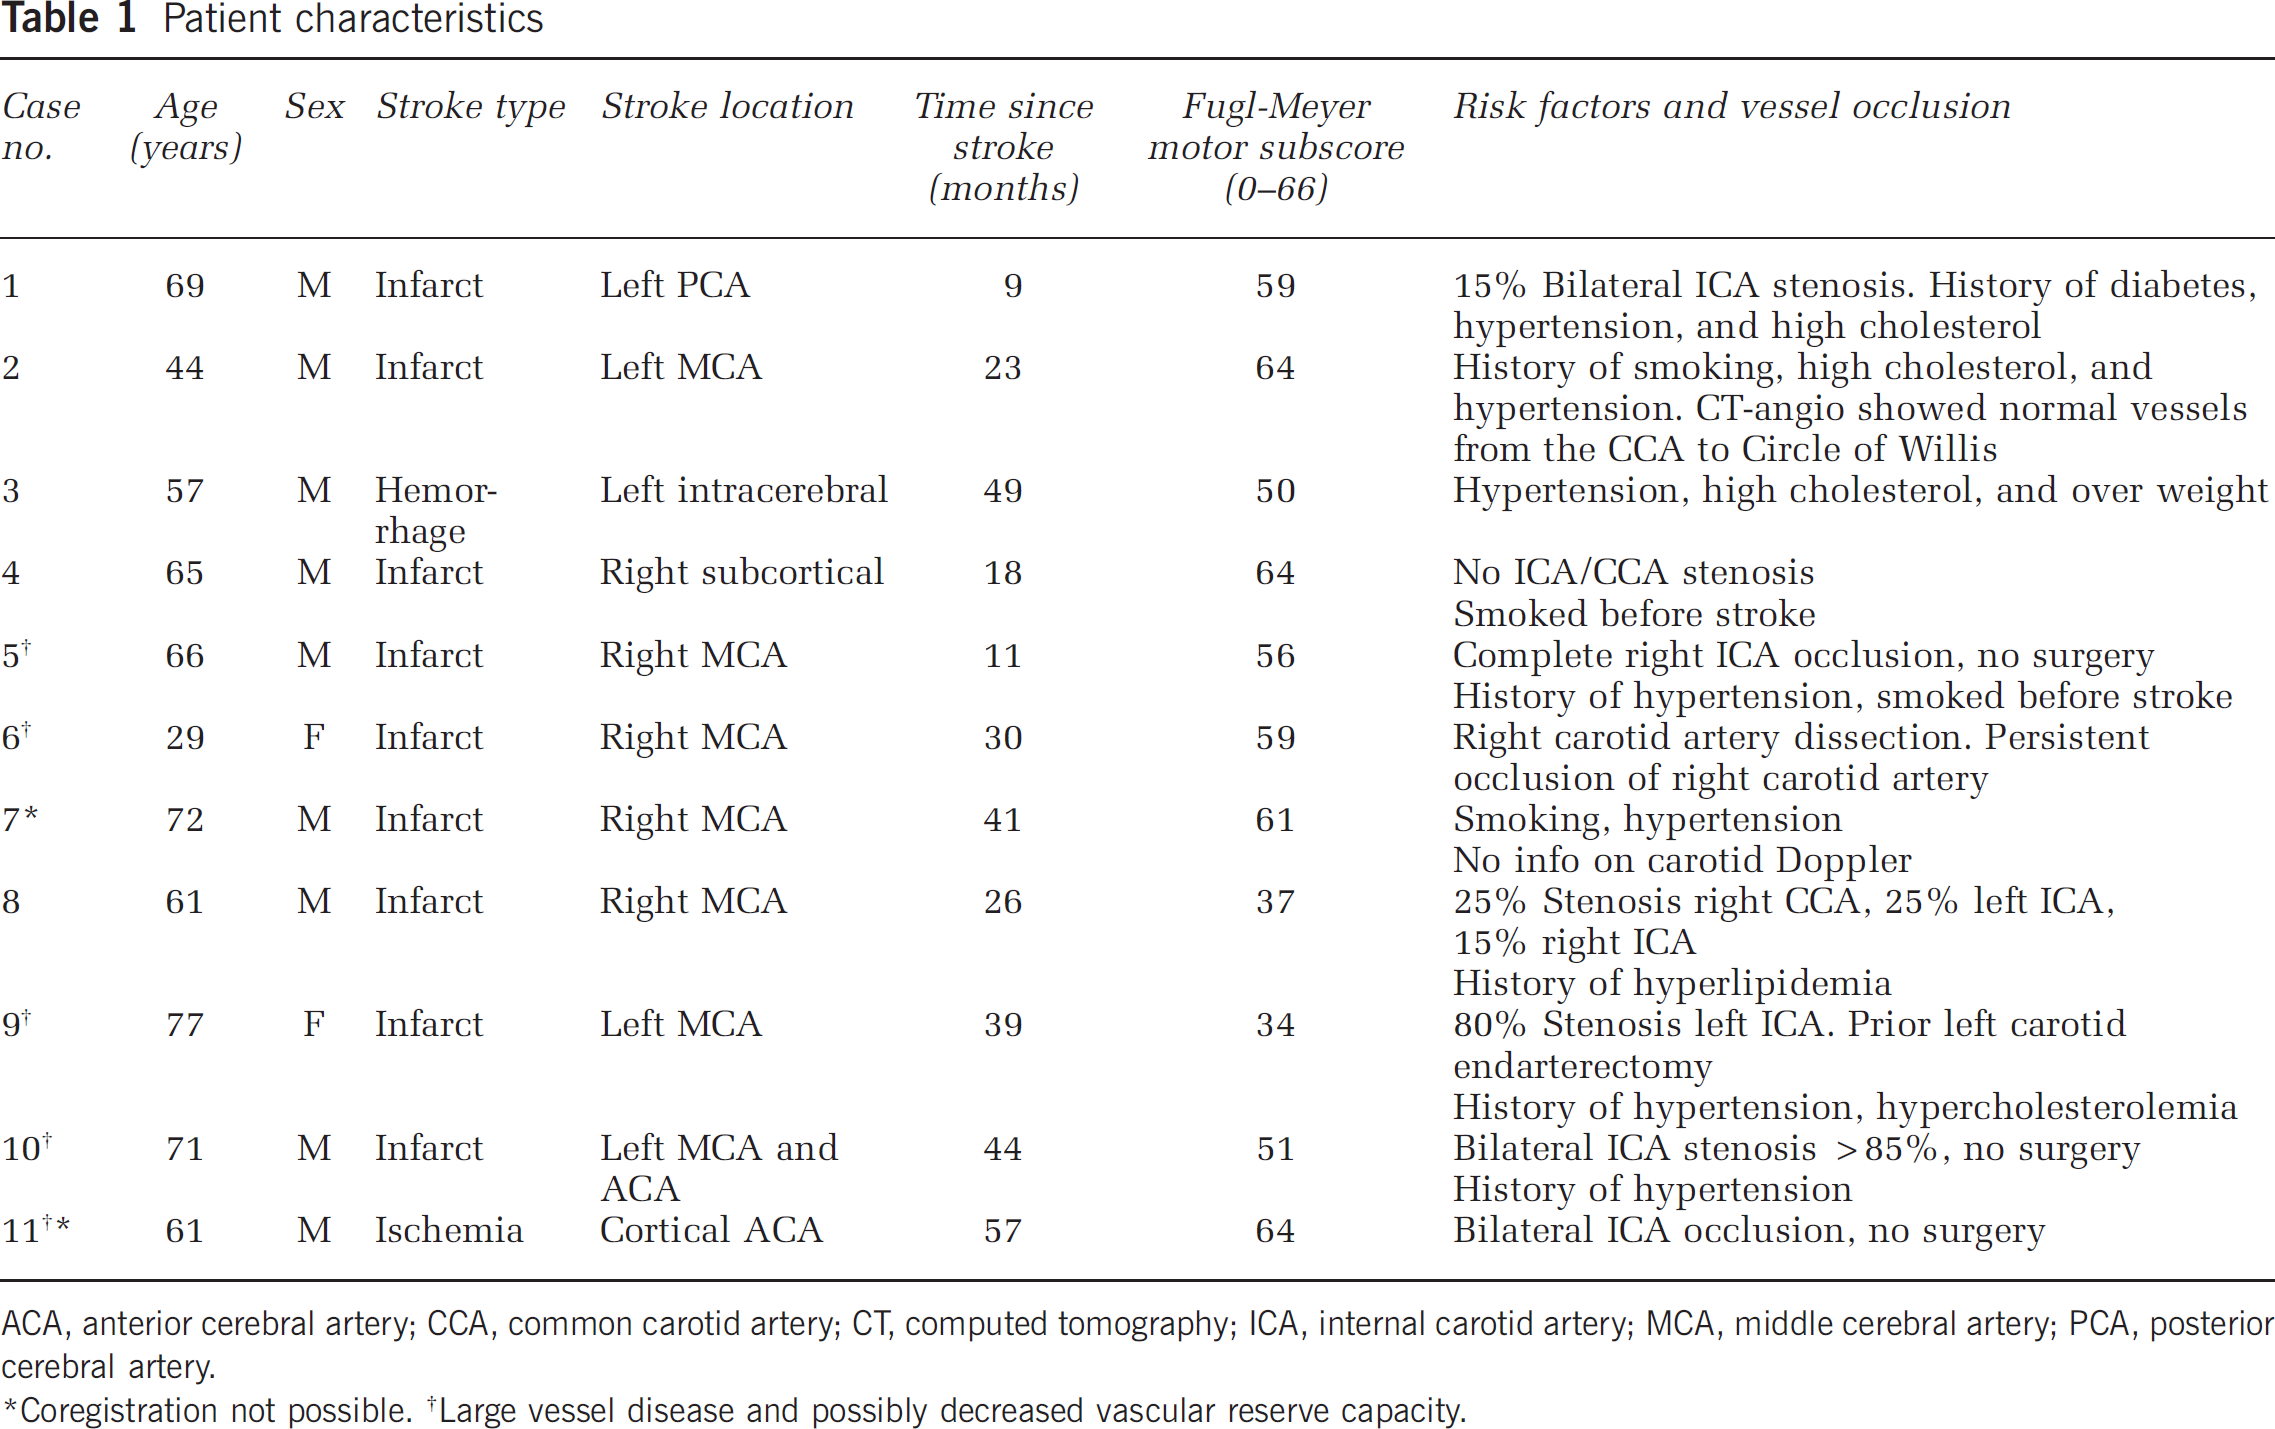
ACA, anterior cerebral artery; CCA, common carotid artery; CT, computed tomography; ICA, internal carotid artery; MCA, middle cerebral artery; PCA, posterior cerebral artery.
Coregistration not possible.
Large vessel disease and possibly decreased vascular reserve capacity.
Magnetic Resonance Imaging
All participants were scanned at 3.0T (Siemens, Erlangen, Germany). BOLD-fMRI: Gradient-echo (TE = 40/TR = 3,000 milliseconds) with single-shot 2D echo planar imaging readout; spatial resolution = 3.8 × 3.8 × 3.8 mm3. ASL and VASO: To assess CBFw and CBVw changes, ASL and VASO with FLuid Attenuated Inversion Recovery (VASO-FLAIR) were used, respectively (Donahue et al, 2009a; Gunther et al, 2005). Briefly, ASL measures CBF by magnetically tagging the longitudinal magnetization of blood water in inflowing arteries with a radiofrequency pulse and collecting an image after the tagged blood water reaches the capillaries. A control image without tagging is also collected and a subtraction of control—tag yields a CBFw image. The VASO sequence is sensitive to changes in CBV. This is achieved by adiabatically inverting all water magnetization within the body coil and collecting an image at an inversion time (TI) when the longitudinal magnetization of the blood water is zero. As water in blood and tissue have different recovery times (T1), detectable tissue water signal is available at the time of blood water nulling. Thus, the VASO contrast is effectively extravascular. Reductions in the extravascular water signal associated with vasodilation can be measured, thus providing CBVw contrast from which CBV changes can be inferred. Cerebrospinal fluid fluctuations additionally contribute to the VASO contrast, and therefore a second inversion pulse was added to allow for simultaneous nulling of blood and cerebrospinal fluid water, an approach called VASO-FLAIR. A 3D GRadient And Spin Echo (GRASE) readout was used to collect whole-brain ASL and VASO-FLAIR images. The benefit of the single-shot 3D GRASE readout is constant ASL and VASO-FLAIR 77 across slices, leading to equivalent transit time sensitivity (ASL) and blood water nulling (VASO-FLAIR) across the imaging volume (Donahue et al, 2009a).
Sequence-specific parameters were ASL 3D GRASE: pulsed ASL with background suppression, TR/TI = 2,500/1,600; VASO-FLAIR 3D GRASE: TR/TI1/TI2 = 5,000/2,256/737 milliseconds. Note that the effective TR of the ASL difference images was therefore 5,000 milliseconds. All scans used a matched spatial resolution=3.8 × 3.8 × 3.8 mm3. TV-weighted structural images (1 × 1 × 1 mm3) were acquired for coregistration purposes.
Functional Paradigm
During fMRI (BOLD, VASO-FLAIR, and ASL) a custom-made wooden joystick was used, which allowed for isolated wrist extension–flexion movement. Scan order was randomized and participants performed 1 Hz wrist extension/flexion in four blocks of 60 seconds/30 seconds rest/movement, followed by an additional 60 seconds of baseline rest at the end of the experiment. Movements were visually cued by an asterisk moving laterally at 1 Hz. Patients performed the movement using the affected hand (contralateral to affected brain hemisphere) and healthy subjects used their dominant hand.
Postprocessing
Functional MRI data were corrected for motion and baseline drift and linear coregistration to T1-weighted images and subsequently to 2 mm MNI (Montreal Neurological Institute) standard space was performed (Jenkinson and Smith, 2001). In two subjects with large existing infarcts as well as noticeable bulk head motion (Pts 7, 11), coregistration was not possible and these volunteers were excluded from analysis. Whole-brain fMRI time series data were analyzed using custom Matlab scripts. Unthresholded positive mean subject z-statistic maps for the contrast of movement versus baseline were recorded. Individual subject signal change and reactivity values, and signal time courses, were extracted from an anatomical region of interest (ROI). Primary motor cortex M1 was chosen as an ROI (Brodmann area 4) in the hemisphere contralateral to the moved hand, as defined by the Jülich Histological Atlas, which was linearly transformed in the same MNI space as the coregistered fMRI data (Eickhoff et al, 2005). Within the ROI, the mean BOLD, CBFw, and CBVw reactivity were calculated separately for healthy subjects and patients. This procedure of using an anatomical ROI was chosen so as not to bias the signal change calculations by different statistical reactivity from any one of the fMRI scans.
Statistical Analysis
As the BOLD, CBFw ASL, and CBVw VASO-FLAIR signal changes were calculated within an anatomical ROI rather than from statistical activation maps, we formally evaluated the statistical significance of the activation on both a subject-specific basis and using the group averaged time courses from each fMRI modality. The first three time points (9 seconds; BOLD) or one time point (5 seconds; ASL and VASO-FLAIR) of the activated period were not included to allow for the signal to plateau; these numbers differ slightly owing to the difference in TR between BOLD (TR = 3 seconds) and ASL and VASO-FLAIR (TR = 5 seconds) and knowledge that changes in CBF and CBV slightly precede BOLD changes. For baseline, 30 seconds (BOLD, ASL, and VASO-FLAIR) after the end of the joystick movement were excluded to allow for CBF and CBV, and a possible BOLD poststimulus undershoot, to return to baseline. The first 33 seconds (BOLD) and 35 seconds (ASL and VASO-FLAIR) of data were also not used for baseline correction, to allow for signal to reach steady state. This resulted in the baseline (BOLD: n2 = 49; ASL and VASO-FLAIR: n1 = 29) and activated (BOLD: n2 = 28; ASL and VASO-FLAIR: n2 = 20) time points being unequal. The sample size using the above time points was determined to be large enough to support a normal distribution approximation, and the difference between epochs is reported with the z-statistic and corresponding two-tailed P value. Owing to the relatively sparse temporal sampling, which also differed between BOLD (TR = 3 seconds) and ASL/VASO-FLAIR (TR = 5 seconds), it was determined that the data were not sufficient to reliably report additional metrics such as onset time and time-to-peak and therefore the focus of this study was on mean signal changes.
Interpreting Cerebral Blood Flow-Weighted Arterial Spin Labeling and Cerebral Blood Volume-Weighted Vascular-Space-Occupancy FLuid Attenuated Inversion Recovery Contrast
It is possible to estimate changes in CBF from the relative ASL signal changes (Donahue et al, 2009a; Kim et al, 2012); however, it is frequently assumed in functional ASL experiments that the ASL signal change is a direct indicator of changes in CBF. This assumption is an oversimplification as both CBF and arterial transit time (ATT) change with activation, which collectively influence the ASL contrast in a manner that depends on postlabeling delay (TI). In principle, one can quantify both the CBF and ATT by performing an ASL experiment at multiple postlabeling delays. Using this approach with a comparable motor stimulus, it has been demonstrated that the ATT reduction is approximately equal to the CBF increase (Gonzalez-At et al, 2000). In clinical studies, multiple postlabeling delay acquisitions lead to long scan times and poor task compliance from the patients, and therefore assumptions are generally made regarding how the ATT and absolute CBF changes can be interpreted, ideally within a range of possible scenarios. To understand this, we simulated ASL kinetic curves using the solution to the single-compartment flow-modified Bloch equation (Zhou and van Zijl, 1999) accounting for different physiologically plausible changes in CBF and ATT.
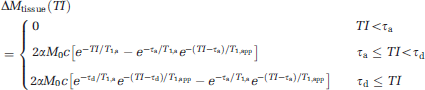
For VASO-FLAIR, the CBV quantification procedure has been outlined previously (Donahue et al, 2006); however, the salient aspects of this procedure and required assumptions are briefly reproduced here. The signal in the VASO-FLAIR experiment can be written,




Results
When the average fMRI responses were considered, all three fMRI modalities showed significant changes within the M1 ROI of healthy subjects (P < 0.01) (Table 2). Signal changes corresponded to a relative increase in BOLD = 0.3% ± 0.1%, CBFw = 20% ± 4%, and CBVw = 16% ± 5%. The VASO-FLAIR data were determined to be least robust on a single-subject basis, with several subjects eliciting nonstatistically significant changes (see Supplementary Material). In stroke patients, BOLD fMRI yielded no significant changes on average (BOLD = 0.1% ± 0.4%) within M1 (P = 0.20), despite significant changes in CBFw = 15% ± 7% (P < 0.01) and CBVw = 14% ± 9% (P < 0.01). Although larger average increases in CBFw and CBVw were seen in controls relative to patients, these differences were not significant (Figure 1B; CBFw, P = 0.36; CBVw, P = 0.25).
Control and patient mean reactivity
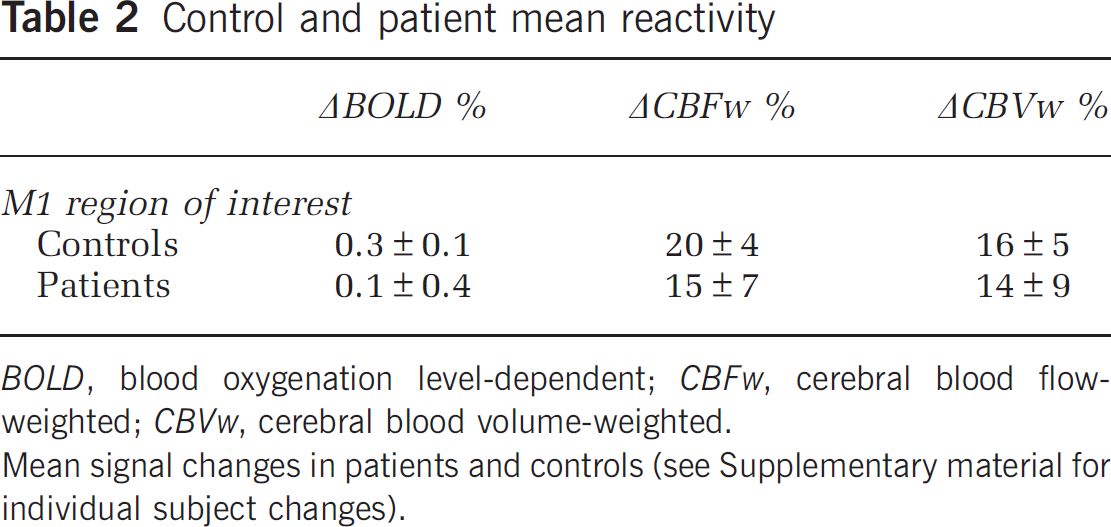
BOLD, blood oxygenation level-dependent; CBFw, cerebral blood flow-weighted; CBVw, cerebral blood volume-weighted.
Mean signal changes in patients and controls (see Supplementary material for individual subject changes).
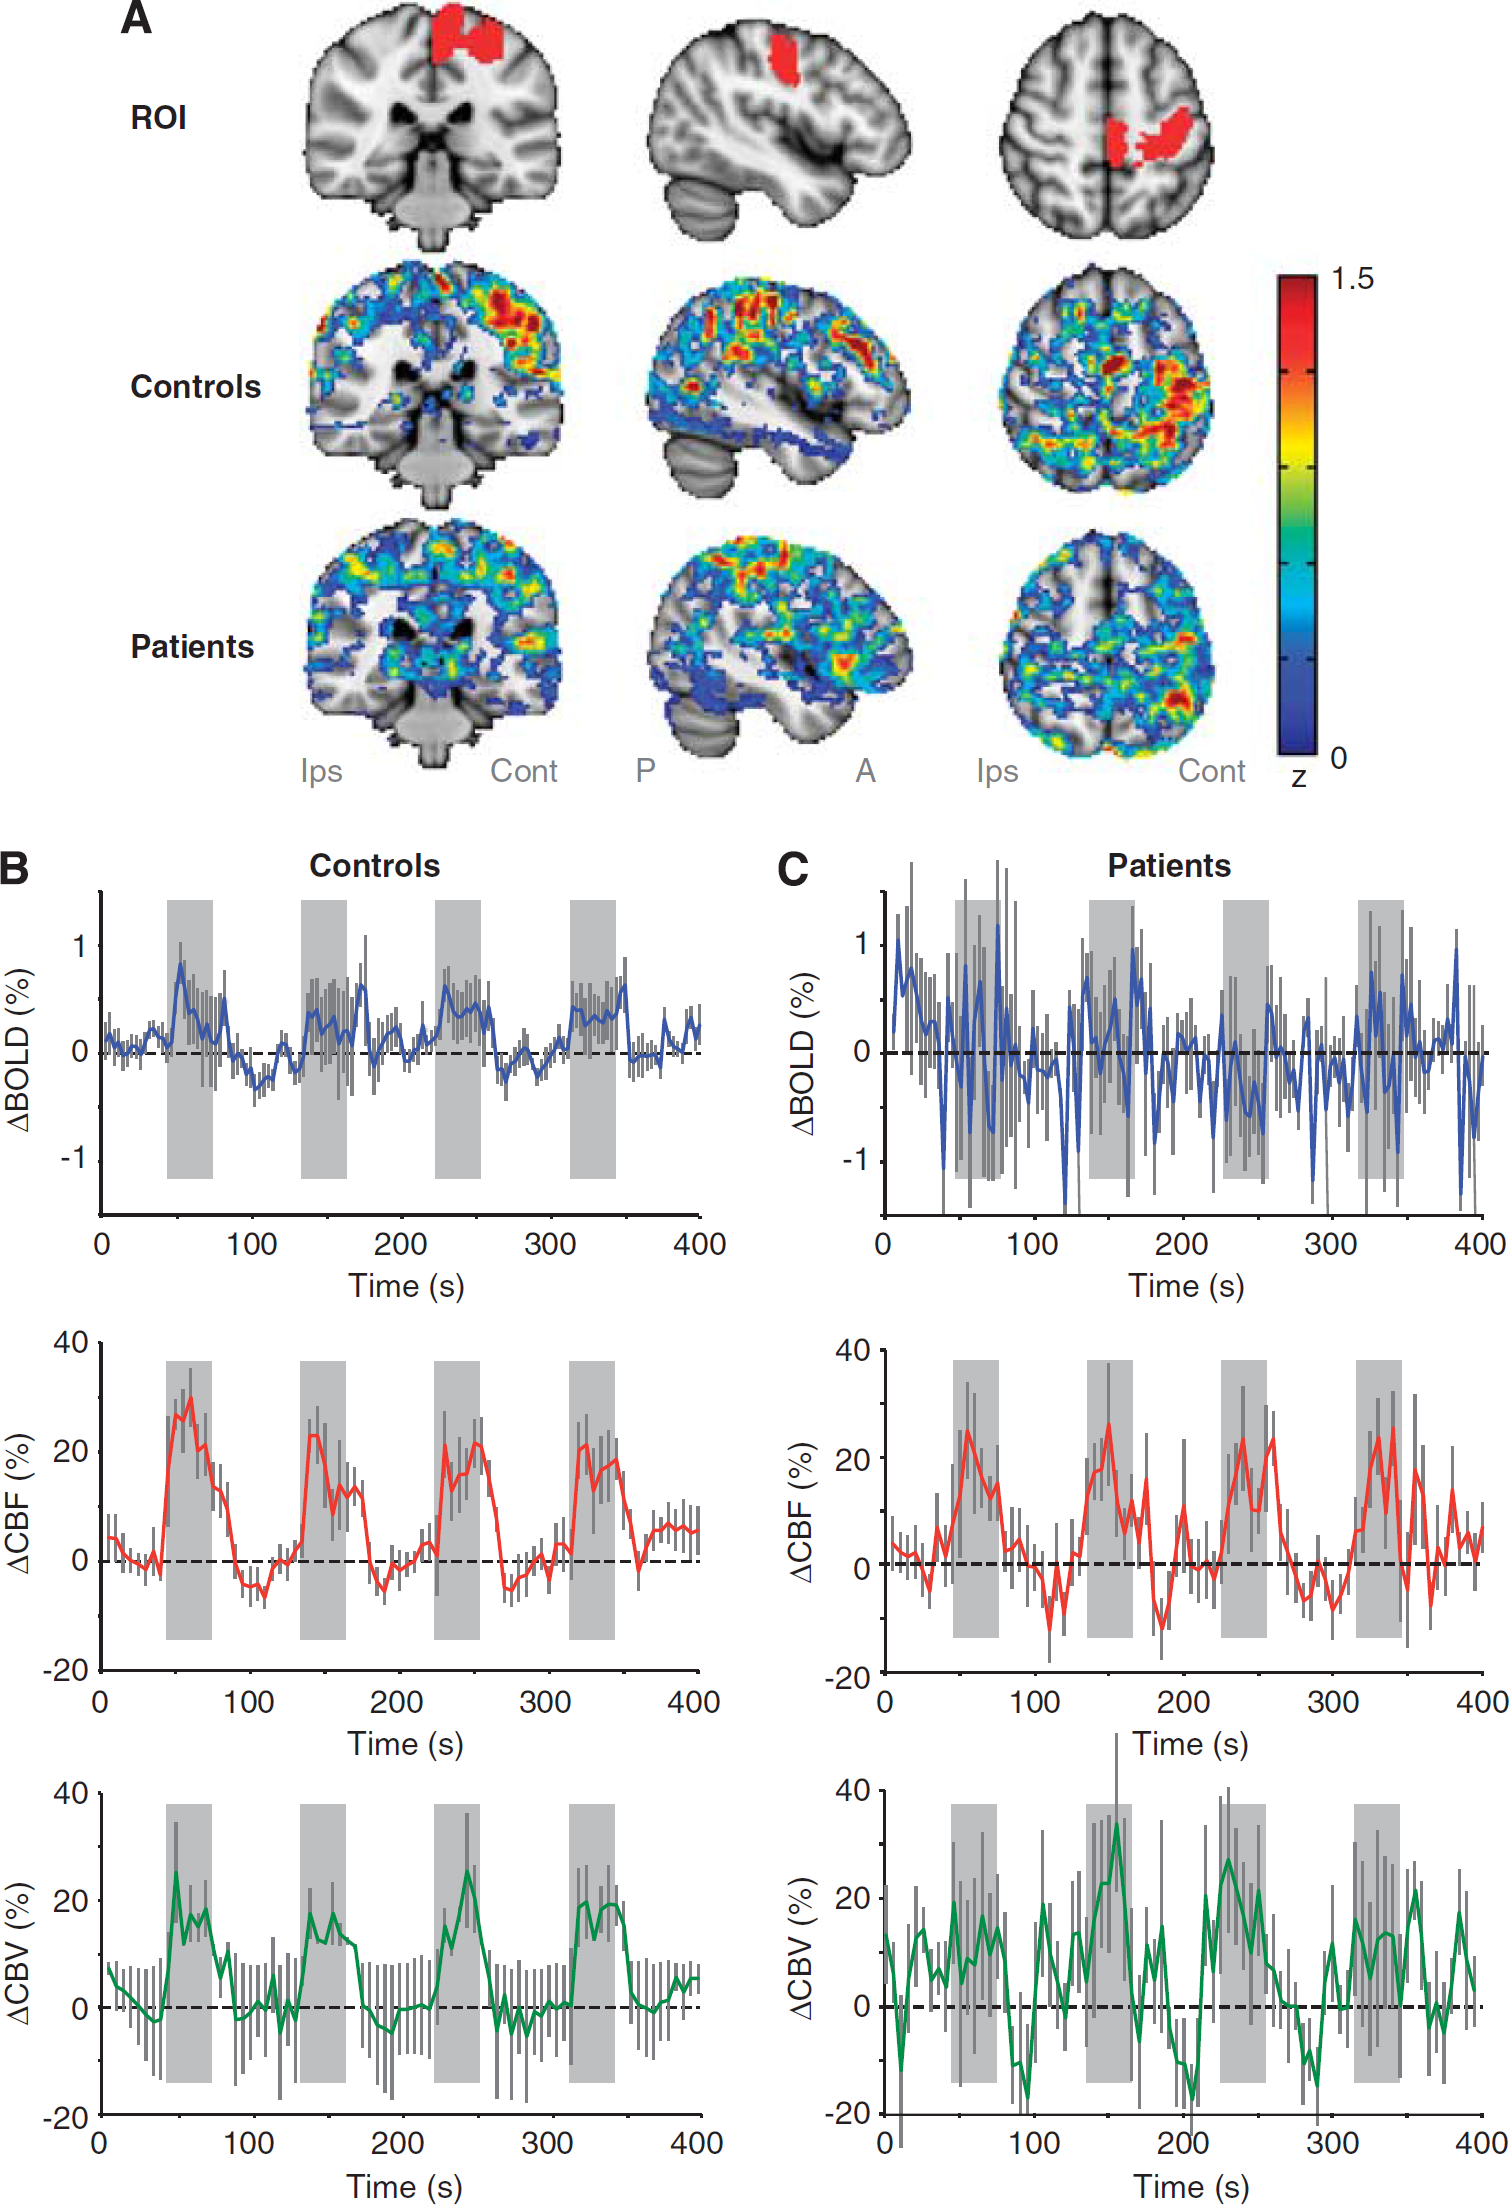
(
Inspection of individual volunteer data revealed additional information regarding underlying patterns of change. For instance, Figure 2 shows reactivity from a representative control volunteer (Figure 2A). By contrast, a range of patterns was observed in patients, including positive (Figure 2B), negative (Figure 2C), and absent (Figure 2D) BOLD changes. The BOLD dynamics are directionally consistent with the corresponding changes in CBF and CBV (Table 3). Inspection of the BOLD time course of each patient demonstrated positive BOLD signal in patients 2, 3, 4, 5, 6, and 9, a negative BOLD signal in patient 8, and undetectable BOLD change in the remaining patients (see Supplementary Material). Thus, joystick-related BOLD signal changes were absent in patients with and without known large-vessel disease (Table 1). Motor Fugl-Meyer scores were comparable between patients with a positive BOLD signal and patients with no or negative BOLD responses (mean 54.5 versus 54.4; P > 0.05; see Table 1).
Different possibilities for observing positive (above) and negative (below) BOLD responses
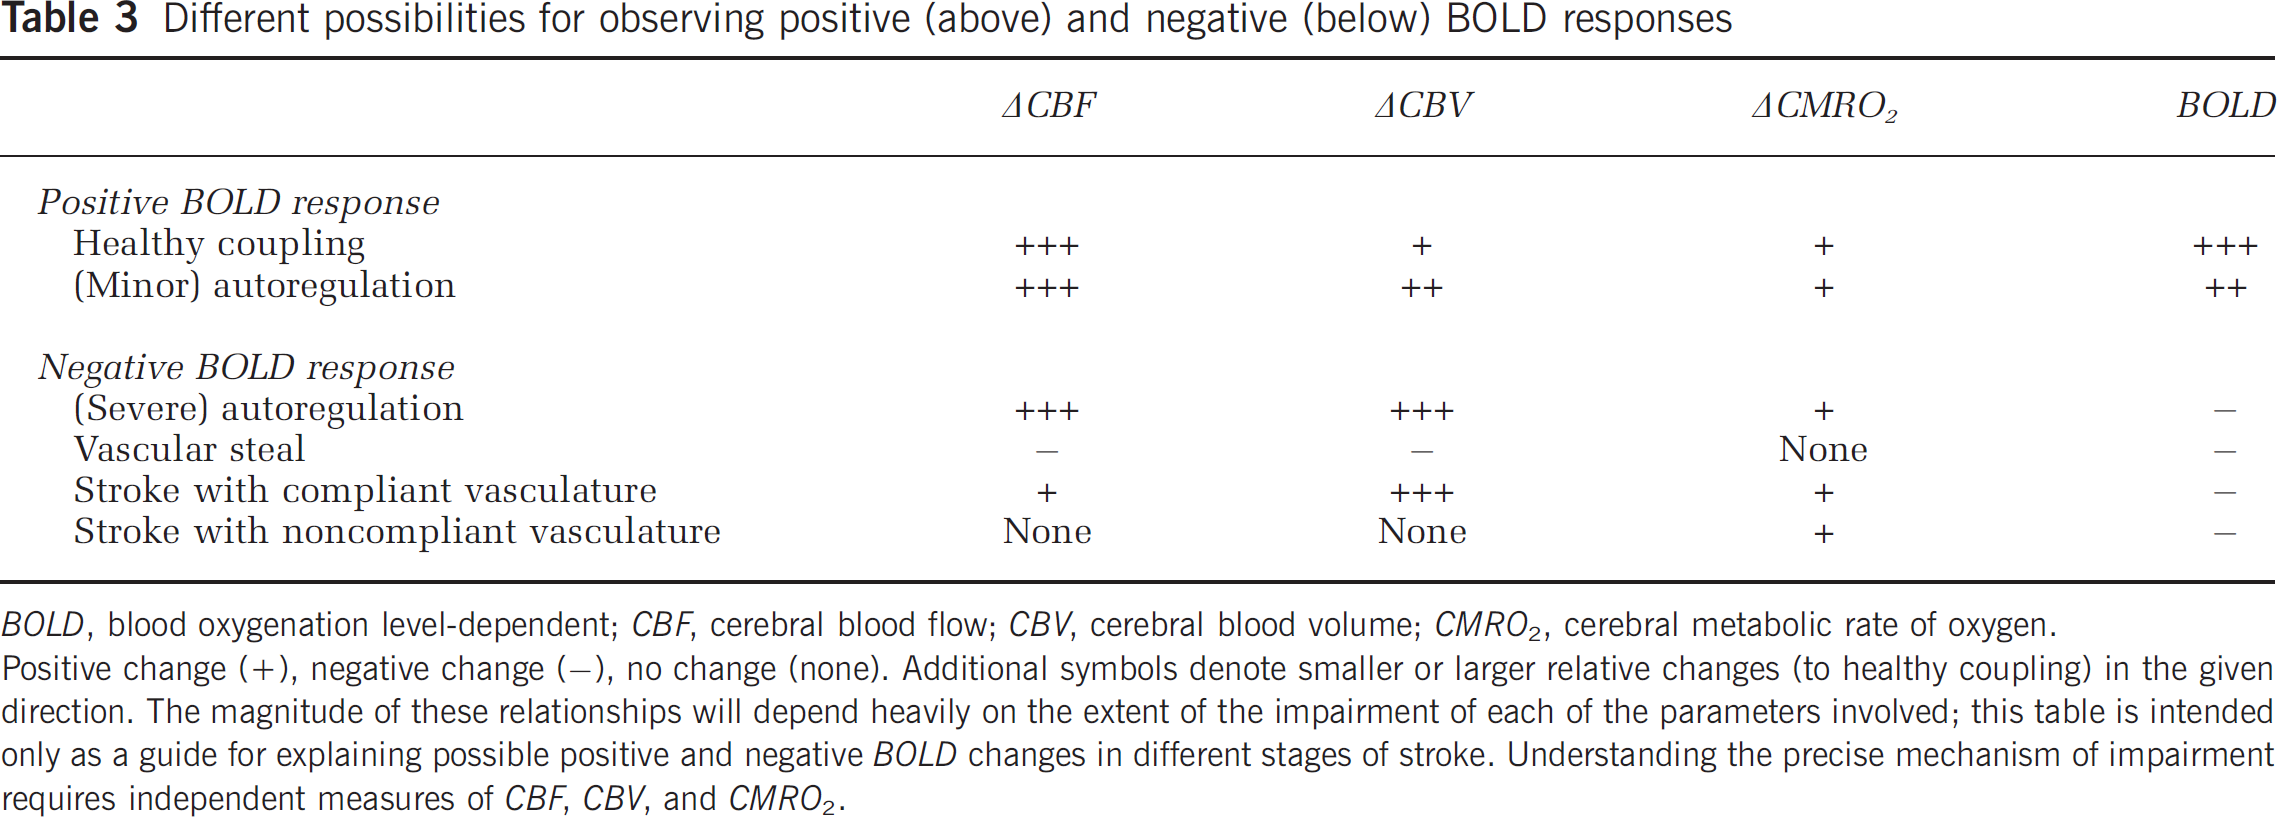
BOLD, blood oxygenation level-dependent; CBF, cerebral blood flow; CBV, cerebral blood volume; CMRO2, cerebral metabolic rate of oxygen.
Positive change (+), negative change (−), no change (none). Additional symbols denote smaller or larger relative changes (to healthy coupling) in the given direction. The magnitude of these relationships will depend heavily on the extent of the impairment of each of the parameters involved; this table is intended only as a guide for explaining possible positive and negative BOLD changes in different stages of stroke. Understanding the precise mechanism of impairment requires independent measures of CBF, CBV, and CMRO2.
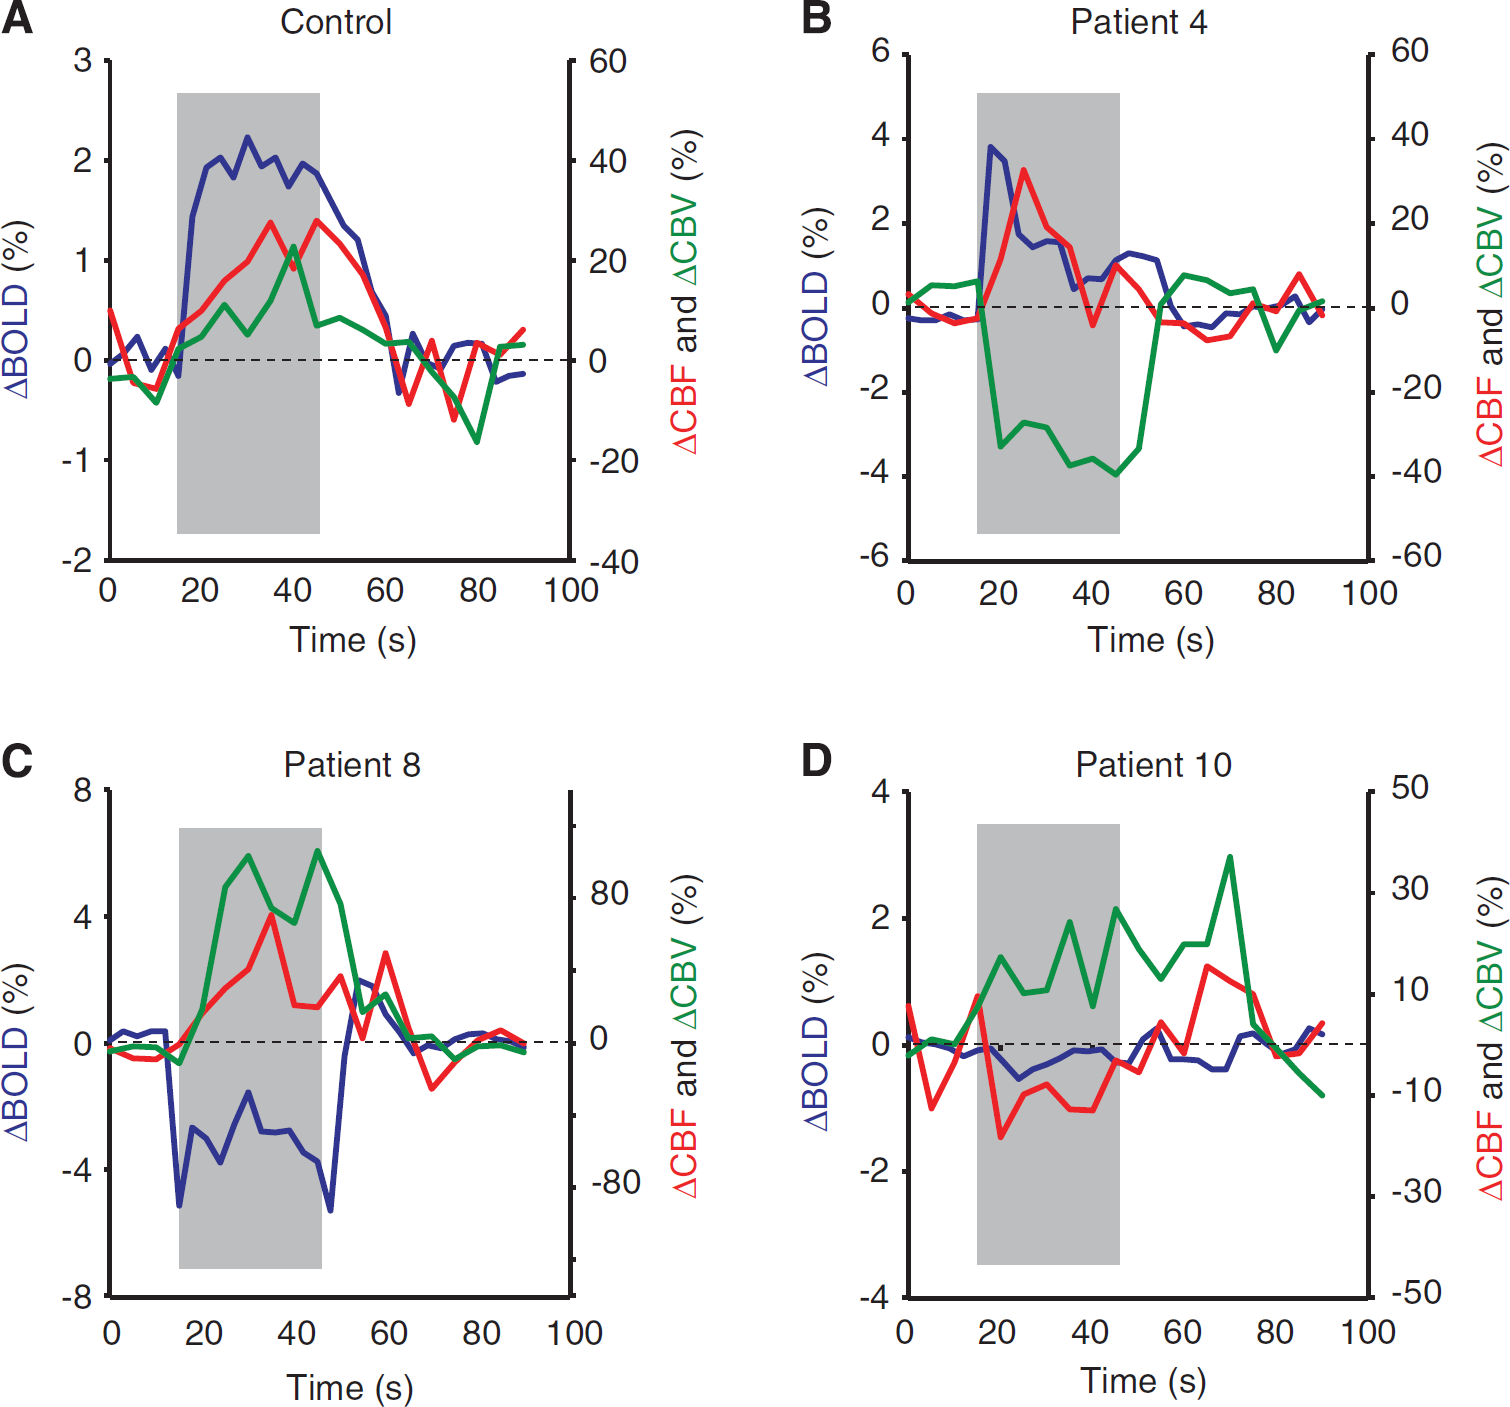
Representative block-averaged time courses for (
Additionally, we evaluated reactivity measures in the contralateral hemisphere to impairment (ipsilateral to joystick movement). As can be seen from the unthresholded positive z-maps in Figure 1A, the patient BOLD reactivity is much more homogeneous across right and left hemispheres than is the control reactivity. When the anatomical ROI (Figure 1A) is mirrored to the opposite hemisphere, the following signal changes were found for controls: BOLD = 0.16% ± 0.15%, CBFw = 19% ± 3% and CBVw = 8% ± 3%; and for patients: BOLD = −0.04% ± 0.3%, CBFw = 13% ± 5% and CBVw = 22% ± 6%. However, these responses were at or below the noise level in the majority of subjects.
The CBFw signal can be interpreted in the context of different physiological changes in CBF and ATT, as outlined in Figure 3. As can be seen, for long postlabeling delay > 1,500 milliseconds, the ASL contrast is less sensitive to ATT. In this regime, where our experiments are performed, normalized changes in ΔM/Mo are shown for CBF and ATT changes of 15%, 24%, and 33%. The mean change in ASL signal observed here (~20%) is roughly consistent with a slightly larger increase in CBF (~24%) and a reduction in ATT (~ −24%) with stimulation, however, as described above the precise values will depend on the magnitude of the change in ATT.
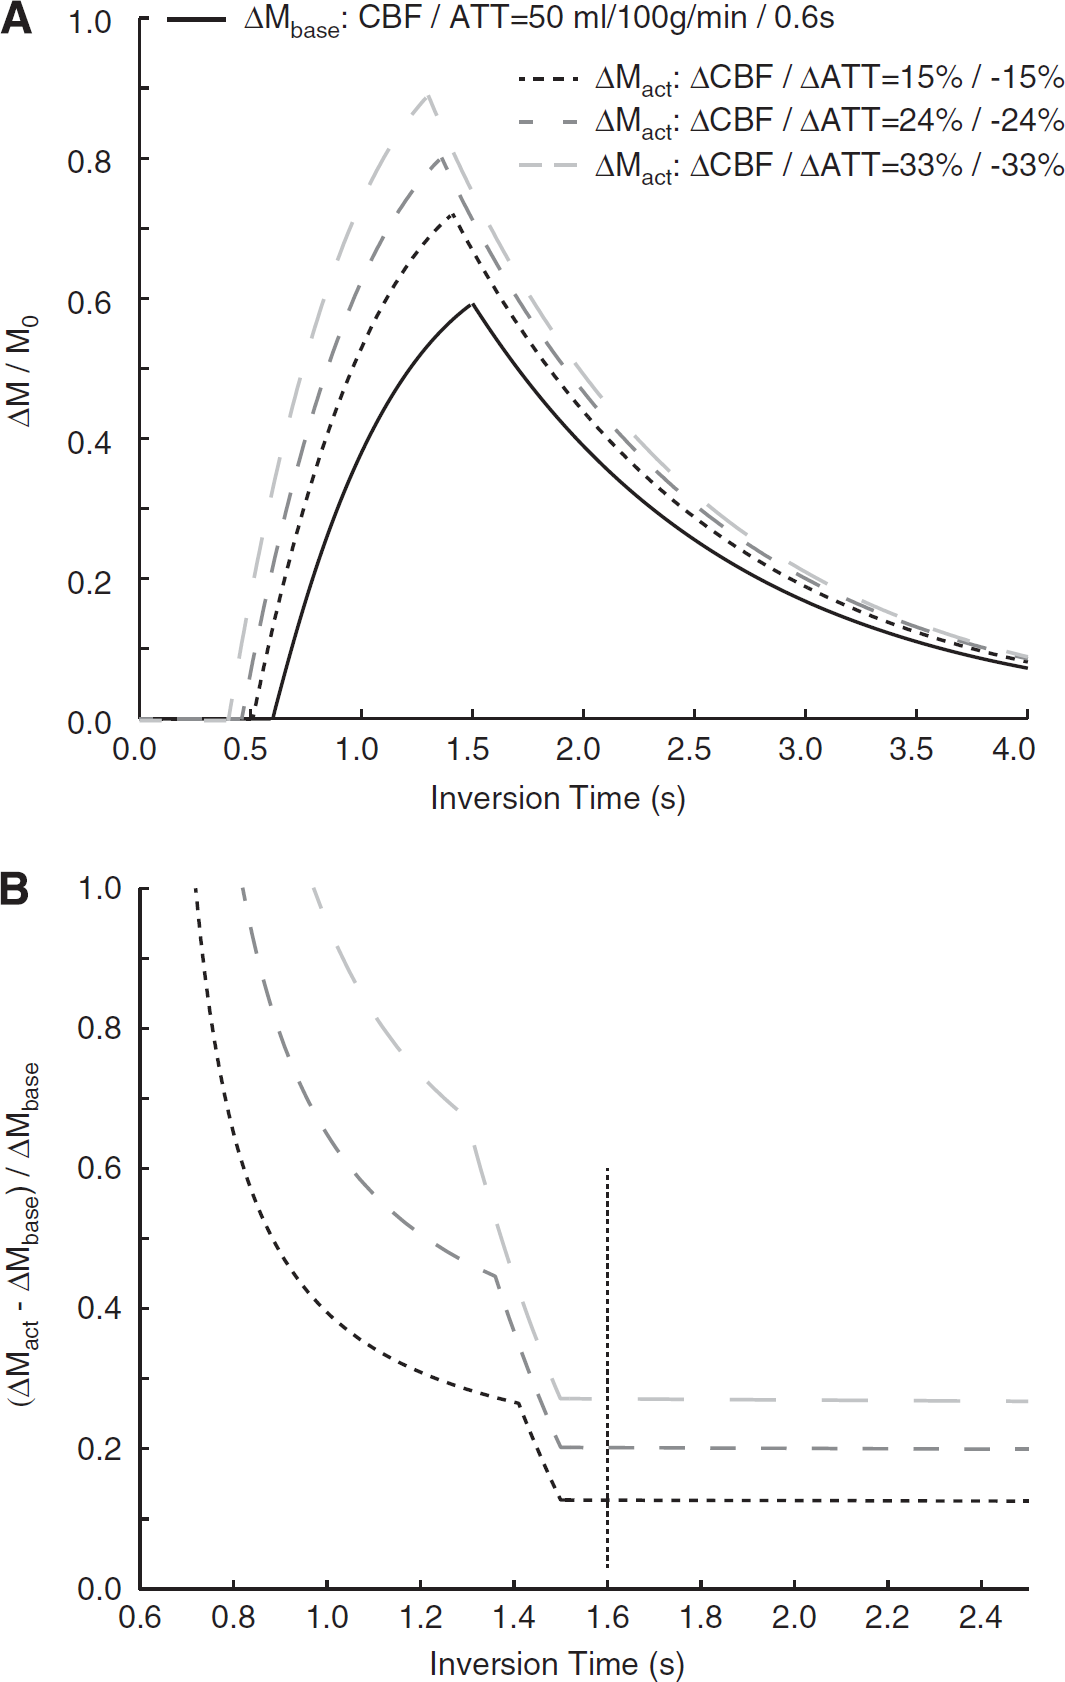
(
Discussion
This study demonstrates that in chronic stroke, motor activity was associated with increases in CBF and CBV in primary motor cortex despite no measurable BOLD fMRI response. Blood oxygenation level-dependent fMRI may therefore be of limited value as a surrogate measure of cortical activation patterns in the course of rehabilitation. While this has been hypothesized in earlier studies, to our knowledge this is the first demonstration that alternative fMRI approaches provide interpretable hemodynamic information in the absence of BOLD changes in chronic stroke patients. This could indicate that ASL- and possibly VASO-based fMRI may be superior to BOLD fMRI when investigating poststroke cortical activation patterns. Importantly, when averaging reactivity across patients there is no coherent group behavior, yet trends on an individual subject basis are apparent, thereby suggesting that such multimodal imaging may be useful for understanding stages of impairment.
Hemometabolic Uncoupling
Blood oxygenation level-dependent fMRI is sensitive to changes in the amount of deoxygenated hemoglobin in the brain. Consequently, changes in CBF, CBV, and CMRO2 all affect the BOLD signal. In healthy subjects, the change in BOLD signal during functional hyperemia relies on a decrease in oxygen extraction fraction (Raichle and Mintun, 2006), and thus a decrease in the amount of paramagnetic (BOLD-weighted MR signal reducing) deoxygenated hemoglobin. In stroke patients, however, baseline CBF and CBV and impaired vascular reserve capacity may alter these hemodynamic changes (Mandell et al, 2008). Underlying atherosclerosis, which causes ~25% of all ischemic strokes (Mustanoja et al, 2011), has been shown to decrease both baseline CBF (Brumm et al, 2010) and vascular reserve capacity (Mandell et al, 2008), while increasing baseline CBV (Derdeyn et al, 2002). As a consequence of these changes in hemodynamics, neuronal activity is not necessarily coupled to regional CBF and CBV changes to the same degree as in healthy subjects. Rossini et al (2004) performed a combined
BOLD fMRI and MEG study, in which they showed that, although electrical stimulation of the median nerve led to clear MEG signals in stroke patients, some patients showed no measurable BOLD fMRI signal. Previous BOLD fMRI stroke studies have found transiently missing BOLD signal (Binkofski and Seitz, 2004), a lower BOLD signal change compared with healthy subjects in both affected (Newton et al, 2002) and unaffected (Pineiro et al, 2002) hemispheres, and patterns of persistent recruitment of ipsilateral activity or slow recovery to more localized contralateral BOLD activity (Feydy et al, 2002). However, a recent review failed to find a consistent correlation between imaging findings and clinical improvement during poststroke recovery (Buma et al, 2010).
The current study expands on literature findings by demonstrating that novel fMRI techniques sensitive to CBF and CBV changes are feasible in this patient group and may be more sensitive than the BOLD technique in patients with abnormal neurovascular coupling (CMRO2 changes relative to those of CBF and CBV). These results show that regional activity-induced CBF and CBV increases tended to be lower in patients than in healthy subjects and that this coincides with the absence of significant BOLD signal increase. This could be explained by a partially occluded vessel delivering exactly the amount of oxygen needed to satisfy the increase in CMRO2 (due to no change in deoxygenated hemoglobin). However, patients without significant large-vessel disease (e.g., Patient 1) also showed impaired BOLD signal, and patients with persistent ICA occlusion (e.g., Patient 6) or previous ICA surgery due to known large-vessel disease (e.g., Patient 9) showed a positive BOLD signal. Previous studies have also shown impaired vascular reserve capacity in patients with suspected small-vessel disease due to hypertension (Ficzere et al, 1997), as well as lower BOLD response in patients with lacunar strokes (Pineiro et al, 2002) and/or white matter degeneration (Hund-Georgiadis et al, 2003), arguing in favor of an impairment of BOLD reactivity in both large- and small-vessel disease.
Experimental Limitations and Concerns of Multimodal Functional Magnetic Resonance Imaging in Stroke Patients
In the interest of time, we used an ASL technique with a single identical labeling delay for all participants as is commonly performed in functional ASL studies. This may have biased the quantitative CBF since some patients may have had prolonged ATT. Also, while patient performance was monitored, variability in performance and possible mirror movements could confound results.
Motion is always a concern in fMRI experiments, especially when patients are involved, and we took precautions to reduce the effect of this possible complication. First, extensive padding and hook and loop fastners were used to secure the head within the coil and all volunteers were reminded of the importance of remaining still throughout the experiment. Second, affine motion correction routines were applied as outlined. Subsequently, all data were inspected to determine if poor coregistration and/or excessive motion precluded further analysis and this was found to be the case in two of the 11 patients (18% of patients or 9% of all volunteers). We critically reviewed all data to understand the role that motion may play in the analysis. We found two types of motion that are of potential interest. First, bulk head motion was largely minimal in the volunteers included in the study (omitting the two described above). This bulk head motion is potentially most relevant as a complicating issue as it could coincide with the movement of the joystick. However, we did not observe this to be any more prevalent in patients than controls, nor between previous fMRI studies conducted in our research center (Donahue et al, 2009a). The second type of motion was motion of the tissue within the skull, which we believe is derived from small changes in tissue position during pulsations of blood through vasculature. This sort of motion appeared to be more pronounced in the patients relative to the controls, likely owing to increased tissue atrophy and reduced tissue rigidity. These fluctuations occur at a much higher frequency than bulk head motion, and may provide some explanation for the increased frequency fluctuations in the patients relative to the controls. However, these fluctuations largely appear as relatively constant high-frequency fluctuations and do not correlate with the stimulus epochs. Additionally, the directional relationships of changes in BOLD, CBFw, and CBVw responses are largely consistent in terms of what is expected physiologically and thus we do not believe this motion is the dominant effect seen in our data. Finally, to reduce the confound of differences in coregistration performance between subjects, we chose a relatively large anatomical ROI to analyze our data. Therefore, this approach is less sensitive to coregistration than an approach where a much smaller ROI would be chosen. We cannot rule out the possibility of motion contributing to the time courses, and indeed we believe that there are some confounds related to this as there likely are in most clinical fMRI experiments. However, we took several precautions to reduce complications from motion and coregistration and we believe that the dominant effects reported in the data are not derived from motion. Related to these observations, we do stress that the time of the multimodal experiments (21 minutes total) is at the limit of compliance for many patients, and future experiments would benefit from reducing the duration of the paradigm.
In theory, an absent BOLD response could be due to patients not performing the task as instructed, or due to increased involvement of other cortical areas than M1. However, the fact that ASL and VASO-FLAIR showed significant activation within M1, despite these techniques having lower SNR than BOLD, indicates that M1 is most likely metabolically active during task performance. However, despite the fact that ASL- and VASO-FLAIR fMRI show activation in areas without BOLD response, there is no guarantee that these techniques are of greater value when explaining impairment or recovery. Both ASL and VASO-FLAIR also rely on a coupling between neuronal activity and hemodynamic changes, and thus suffer from some of the same constraints as BOLD, but arguably to a lesser degree. Consequently, techniques more directly sensitive to changes in CMRO2 will be beneficial. Finally, BOLD, ASL, and VASO-FLAIR experiments were performed sequentially, and therefore variations in performance between scans could confound interpretation. However, scan order was randomized between patients and controls, therefore the absence of a BOLD response at the group level is likely not due to a bias from scan order or habituation.
In the present study, we investigated changes in primary motor cortex only. However, previous studies in patients with cerebral microangiopathy or untreated hypertension have shown impaired BOLD/CBF response in the parietal lobe and thalamus, suggesting that neurovascular coupling is disturbed beyond primary motor cortex. For evoked multimodal experiments, strong motor and/or visual stimuli are generally used, owing to the ability to elicit changes in distinct cortical regions in a controlled and robust manner. However, Poser and Norris (2011) have more recently demonstrated that additional brain regions can be studied using ASL and VASO, and we have recently implemented VASO to study CBV changes in hippocampus and fusiform gyrus in patients with memory disorders. Largely owing to contributions from intravascular signal and relatively low SNR, ASL, and VASO remain problematic in very low brain regions such as brainstem and cerebellum; however, we anticipate that other regions of cerebrum could easily be assessed given an appropriate choice of stimuli.
Recently, BOLD MRI in combination with a vascular challenge (i.e., elevated CO2 inhalation) has been suggested as a tool to evaluate cerebrovascular reactivity, and a useful technique in presurgical evaluation of patients with steno-occlusive disease. However, a recent study by Mandell et al (2008) compared BOLD and ASL measures of cerebrovascular reactivity and found only moderate agreement between the techniques, despite the fact that all participating patients had large-vessel stenosis or occlusion. Importantly, hypercarbia will elicit global cortical changes in CBF and CBV, with minimal changes in CMRO2. Therefore, this task could be more specifically used to look at cerebrovascular reactivity rather than vascular and metabolic activity secondary to neuronal stimulation as in the present study. The major limitation of only using BOLD in vascular reactivity measurements is that the BOLD effect will report on ensemble changes in CBF and venous CBV (and to a smaller extent arterial CBV). Application of ASL and VASO will provide a more direct measure of the vascular phenomena underlying the BOLD reactivity and whether CBF and CBV are disproportionately impaired. Additionally, these data could be useful for better understanding ambiguous BOLD effects, such as negative BOLD effects frequently attributed to ‘vascular steal.’ By separately measuring CBFw and CBVw reactivity, it should be possible to more precisely understand the changes that are occurring in vasodilation (or vasoconstriction) and the corresponding flow response.
In conclusion, in patients with cerebrovascular disease it is difficult to infer changes in CBF, CBV, and neuronal activity based on BOLD signal changes alone. We performed multimodal, noninvasive fMRI in chronic stroke patients with motor impairments and demonstrated high variability in patient BOLD responses, yet more consistent and robust CBF, and to a lesser degree, CBV responses. Owing to the large and frequently unknown variability in neurovascular coupling that exists in chronic stroke, such multi-modal fMRI approaches may be better suited than BOLD fMRI performed in isolation when interrogating cortical reorganization.
Disclosure/conflict of interest
JU Blicher and L Østergaard received funding from the Danish Ministry of Science, Technology and Innovation. JU Blicher has served on advisory boards for Allergan. P Jezzard and MJ Donahue received funding from the Dunhill Medical Trust. H Johansen-Berg received funding from the Wellcome Trust. J O'Shea was funded by the Royal Society, UK. MJ Donahue, CJ Stagg, J O'Shea, and H Johansen-Berg received funding from the NIHR Oxford Biomedical Research Centre.
Footnotes

References
Supplementary Material
Please find the following supplemental material available below.
For Open Access articles published under a Creative Commons License, all supplemental material carries the same license as the article it is associated with.
For non-Open Access articles published, all supplemental material carries a non-exclusive license, and permission requests for re-use of supplemental material or any part of supplemental material shall be sent directly to the copyright owner as specified in the copyright notice associated with the article.
