
Abstract
The brain is an organ with high metabolic rate. However, little is known about energy utilization during different activity states of neuronal networks. We addressed this issue in area CA3 of hippocampal slice cultures under well-defined recording conditions using a 20% O2 gas mixture. We combined recordings of local field potential and interstitial partial oxygen pressure (pO2) during three different activity states, namely fast network oscillations in the gamma-frequency band (30 to 100 Hz), spontaneous network activity and absence of spiking (action potentials). Oxygen consumption rates were determined by pO2 depth profiles with high spatial resolution and a mathematical model that considers convective transport, diffusion, and activity-dependent consumption of oxygen. We show that: (1) Relative oxygen consumption rate during cholinergic gamma oscillations was 2.2-fold and 5.3-fold higher compared with spontaneous activity and absence of spiking, respectively. (2) Gamma oscillations were associated with a similar large decrease in pO2 as observed previously with a 95% O2 gas mixture. (3) Sufficient oxygenation during fast network oscillations in vivo is ensured by the calculated critical radius of 30 to 40 μm around a capillary. We conclude that the structural and biophysical features of brain tissue permit variations in local oxygen consumption by a factor of about five.
INTRODUCTION
The brain receives ~15% of the cardiac output and is especially sensitive to hypoxia, which suggests that neuronal activity is associated with high energetic costs and requires intact function of mitochondria. 1 Although the total oxygen consumption of the brain is almost constant, large local variations might occur during different activity states in the respective brain region.2–4 Local changes in oxygen consumption in vivo are commonly inferred from the slope of the decrease in the interstitial partial oxygen pressure (pO2) recorded during stop of oxygen supply or activation of specific brain regions. However, such measurements are strongly influenced by adaptations of the cerebral blood flow accompanying any perturbation of oxygen homeostasis.5–7 Because of this compensatory hemodynamic response, data on activity-dependent oxygen consumption in certain brain regions or even in small neuronal networks by functional magnetic resonance imaging (blood oxygen level-dependent signal) or tissue oxygenation measurements in vivo are difficult to interpret and might misjudge real changes in cerebral oxygen consumption.4,8 For these reasons, brain slice preparations in vitro, in which hemodynamic responses are absent, may be an useful model to quantify the oxygen consumption rates during different activity states.9–11 Slice preparations permit recordings of pO2 and the local field potential (LFP) with microelectrodes. In addition, recordings are performed under well-defined conditions such as constant oxygen supply and experimental induction of specific activity states in a given neuronal network.11–13
In the present study, we determined oxygen consumption rates during three different activity states in hippocampal area CA3 by using slice cultures. As a high activity state, we induced fast neuronal network oscillations in the gamma-frequency band (30 to 100 Hz) by application of acetylcholine, which mimics cholinergic input from the septum in vivo.12,14 Gamma oscillations have been implicated in several higher cognitive functions, such as sensory processing, memory formation, and attentional selection.14,15 The two other activity states were spontaneous network activity, which occurs in hippocampal slice cultures despite the lack of (sub)cortical input,13,16 and the absence of action potentials (spiking) in the network that was induced by application of tetrodotoxin (TTX). To be able to perform the experiments under more physiologic conditions, i.e., applying a 20% O2 gas mixture, we used hippocampal slice cultures on an intact Biopore membrane in a modified interface recording chamber. During the three activity states, we determined pO2 profiles in slice cultures with high spatial resolution. For detailed analysis of the pO2 profiles, we used a mathematical reaction-diffusion model to quantify the contribution of oxygen transport and activity-dependent oxygen consumption rates.
MATERIALS AND METHODS
Organotypic Hippocampal Slice Cultures and Recording Chamber
Animals were housed, cared, and killed in accordance with the recommendations of the European Commission and the Berlin Animal Ethics Committee (LAGeSo, T0032/08). Organotypic hippocampal slice cultures were prepared as described.13,17 In brief, hippocampal slices (400 μm) were cut with a McIlwain tissue chopper (Mickle Laboratory Engineering Company Ltd., Guildford, UK) from 7- to 9-day-old Wistar rats under sterile conditions. Slices were maintained on Biopore membranes (Millicell standing inserts; Millipore, Eschborn, Germany) between culture medium (50% minimal essential medium, 25% Hank's balanced salt solution (Sigma, Taufkirchen, Germany), 25% horse serum (Invitrogen, Life Technologies GmbH, Darmstadt, Germany), and 2 mmol/L L-glutamine at pH 7.3) and humidified normal atmosphere (5% CO2, 36.5°C) in an incubator (Unitherm 150, UniEquip, Martinsried, Germany). Biopore membranes provide high viability and excellent trans-membrane oxygen transport. The culture medium (1 mL) was replaced three times per week. Slice cultures were used after 5 to 9 days in vitro (residual thickness of 331 ± 6 μm, n = 29), when the tissue had recovered from the slice preparation and damaged cut surfaces were reorganized. 10
By contrast to recent reports, in which pieces of Biopore membrane carrying slice cultures had been cut out,13,17 recordings were made in a modified, custom-built recording chamber (workshop in Dr Uwe Heinemann's Laboratory, Institute for Neurophysiology, Charité-Universitätsmedizin Berlin and workshop in the Institute of Physiology and Pathophysiology, University of Heidelberg) that allows the usage of intact Biopore membrane inserts (Figure 1). With this modification, slice cultures were strictly retained in the so-called interface recording condition, i.e., maintaining the slice culture at the interface between recording solution and ambient gas mixture. Intact Biopore membrane inserts ensure constant supply of oxygen and glucose from the recording solution (rate 2 mL/min) that flows underneath the membrane carrying slice cultures; the interface condition allows constant oxygen supply from the ambient gas mixture. With this approach, gassing the recording chamber with a mixture of 20% O2, 75% N2, and 5% CO2 (rate 1.5 L/min) was sufficient to induce persistent gamma oscillations.

Illustration of recording conditions and organotypic hippocampal slice cultures. (
Solutions and Recordings
Slice cultures were constantly supplied with prewarmed (34 ± 1°C) recording solution (artificial cerebrospinal fluid) that contained: 129 mmol/L NaCl, 3 mmol/L KCl, 1.25 mmol/L NaH2PO4, 1.8 mmol/L MgSO4, 1.6 mmol/L CaCl2, 26 mmol/L NaHCO3, and 10 mmol/L glucose. The pH was 7.3, when the recording solution was saturated with the gas mixture (20% O2, 75% N2, 5%CO2). Gamma oscillations were induced by bath application of cholinergic receptor agonist, acetylcholine and acetylcholine-esterase inhibitor, physostigmine. 13 The absence of action potentials (spiking) was induced by bath application of TTX, which blocks fast voltage-gated Na+ channels. Acetylcholine was from Sigma-Aldrich (Taufkirchen, Germany), and physostigmine and TTX were from Tocris (Biotrend, Köln, Germany).
The LFPs were recorded in stratum pyramidale of area CA3 with glass electrodes filled with recording solution. Changes in voltage were digitized at 10 kHz (low-pass filter of 3 kHz; CED 1401 interface; Cambridge Electronic Design, Cambridge, UK). The pO2 was measured at different depths of the CA3 area by using oxygen sensor microelectrodes (O2 sensors), standard OX10 (Unisense, Aarhus, Denmark). This new type of modified polarographic Clark electrode consists of a glass-insulated Ag/AgCl reference anode and a guard cathode with the advantages of low sensitivity to motion artifact, minimal interaction with tissue, and low O2 consumption; it has been successfully used in vitro and in vivo.13,18,19 The standard OX10 has a tip diameter of 8 to 12 μm and a spatial resolution of 1 to 2 times the outside tip diameter; further details are given in manufacturer's homepage (http://www.unisense.com). The drift of the O2 sensors in our set-up was <2 mm Hg/20 min. 17 The O2 sensor was connected to a polarographic amplifier (Chemical Microsensor II; Diamond General Development, AnnArbor, MI, USA) and polarized with −0.8 V overnight. For recordings, the O2 sensor was fixed in a mechanical micromanipulator in an angle of 55° and moved forward in steps of 20 μm (corresponding to a vertical depth of 16 μm per step). Before and after each experiment, O2 sensors were individually calibrated. 13 Changes in voltage were low-pass filtered and digitized at 1 kHz (CED 1401). Converted data (LFPs and pO2) were recorded with a personal computer using Spike2 software (CED).
Cresyl Violet Staining
Slice cultures were fixed in paraformaldehyde (4%, 0.1 mol/L phosphate buffer; Sigma-Aldrich) and, thereafter, incubated with sucrose solution (30%, 0.15 mol/L phosphate buffer; Sigma-Aldrich) for 12 hours. Thin slice sections (30 μm) were cut with a freezing microtome (Leica Microsystems, Wetzlar, Germany). Sections were exposed to an ethanol series (6 steps, 3 minutes each) and rinsed in distilled water. Sections were immersed in cresyl violet solution (0.5% cresyl violet in distilled water; Sigma-Aldrich) for 90 seconds, rinsed in distilled water, and transferred to differentiation solution (200 mL, 50% ethanol, 3 drops of acetic acid). Subsequently, sections were exposed to a series of ethanol (4 steps, 3 minutes each), 2-propanol (two times; Sigma-Aldrich), and xylol (two times; Sigma-Aldrich) and finally embedded with DePeX (Serva Electrophoresis GmbH, Heidelberg, Germany).
Data Analysis
Power spectra were calculated from data segments of 60 seconds with Spike2 software (CED), using Hanning window and a bin resolution of 3.052 Hz. Data are presented as mean ± standard error and were derived from a total of 29 organotypic hippocampal slice cultures, from at least three rats per experimental group. Statistical significance (P < 0.05) was determined by applying one-way ANOVA with Bonferroni's post hoc test comparing multiple groups with normal distribution. Statistical analysis and figures were made using Origin (Microcal Software, Northampton, MA, USA), SPSS for Windows (Version 19, SPSS Inc., Chicago, IL, USA) and CorelDRAW (Corel Corporation, Ottawa, Ontario, Canada).
Mathematical Reaction-Diffusion Model
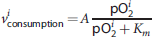
The recorded pO2 profiles were reproduced by a mathematical model that takes into account oxygen transport through neuronal tissue and activity-dependent oxygen consumption rates. We subdivided the space of the slice in N layers, of 1 μm thickness (Δx = 1 μm). Within a single layer, oxygen level and oxygen consumption rate were assumed to be constant. The time-dependent change of pO2 in layer i,

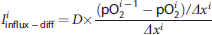
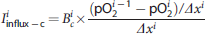
Since all measured pO2 profiles show convex behavior (see below), we modeled the influx term as the sum of two components. One component is oxygen diffusion described by Fick's law:


RESULTS
Three Different Activity States of the Hippocampal CA3 Network
The neuronal network was spontaneously active in stratum pyramidale of area CA3 in organotypic hippocampal slice cultures (Figure 2; SPON, n = 19). Spontaneous activity was of variable degree, perhaps because of the lack of afferent inputs as well as individual differences in rhythm generators and connectivity.13,16 Bath application of TTX (1 μmol/L) led to complete suppression of neuronal spiking and thus spontaneous network activity after ~20 minutes (Figure 2; TTX, n = 8). Bath application of acetylcholine (2 μmol/L) and physostigmine (400 nmol/L) resulted in persistent gamma oscillations after ~30 minutes (Figure 2; GAM). The mean peak frequency of gamma oscillations was 48.7 ± 2.9 Hz (n = 8). In contrast to earlier studies,11,13 the induction of gamma oscillations in a 20% O2 gas mixture was possible because of improved recording conditions (Materials and methods). A detailed analysis of cholinergically induced gamma oscillations in hippocampal slice cultures and acute slices from rat and mouse was published recently. 17 Notably, our experiments in slice cultures were conducted in the absence of any anesthetics that significantly interfere with both neuronal activity and energy metabolism.24,25
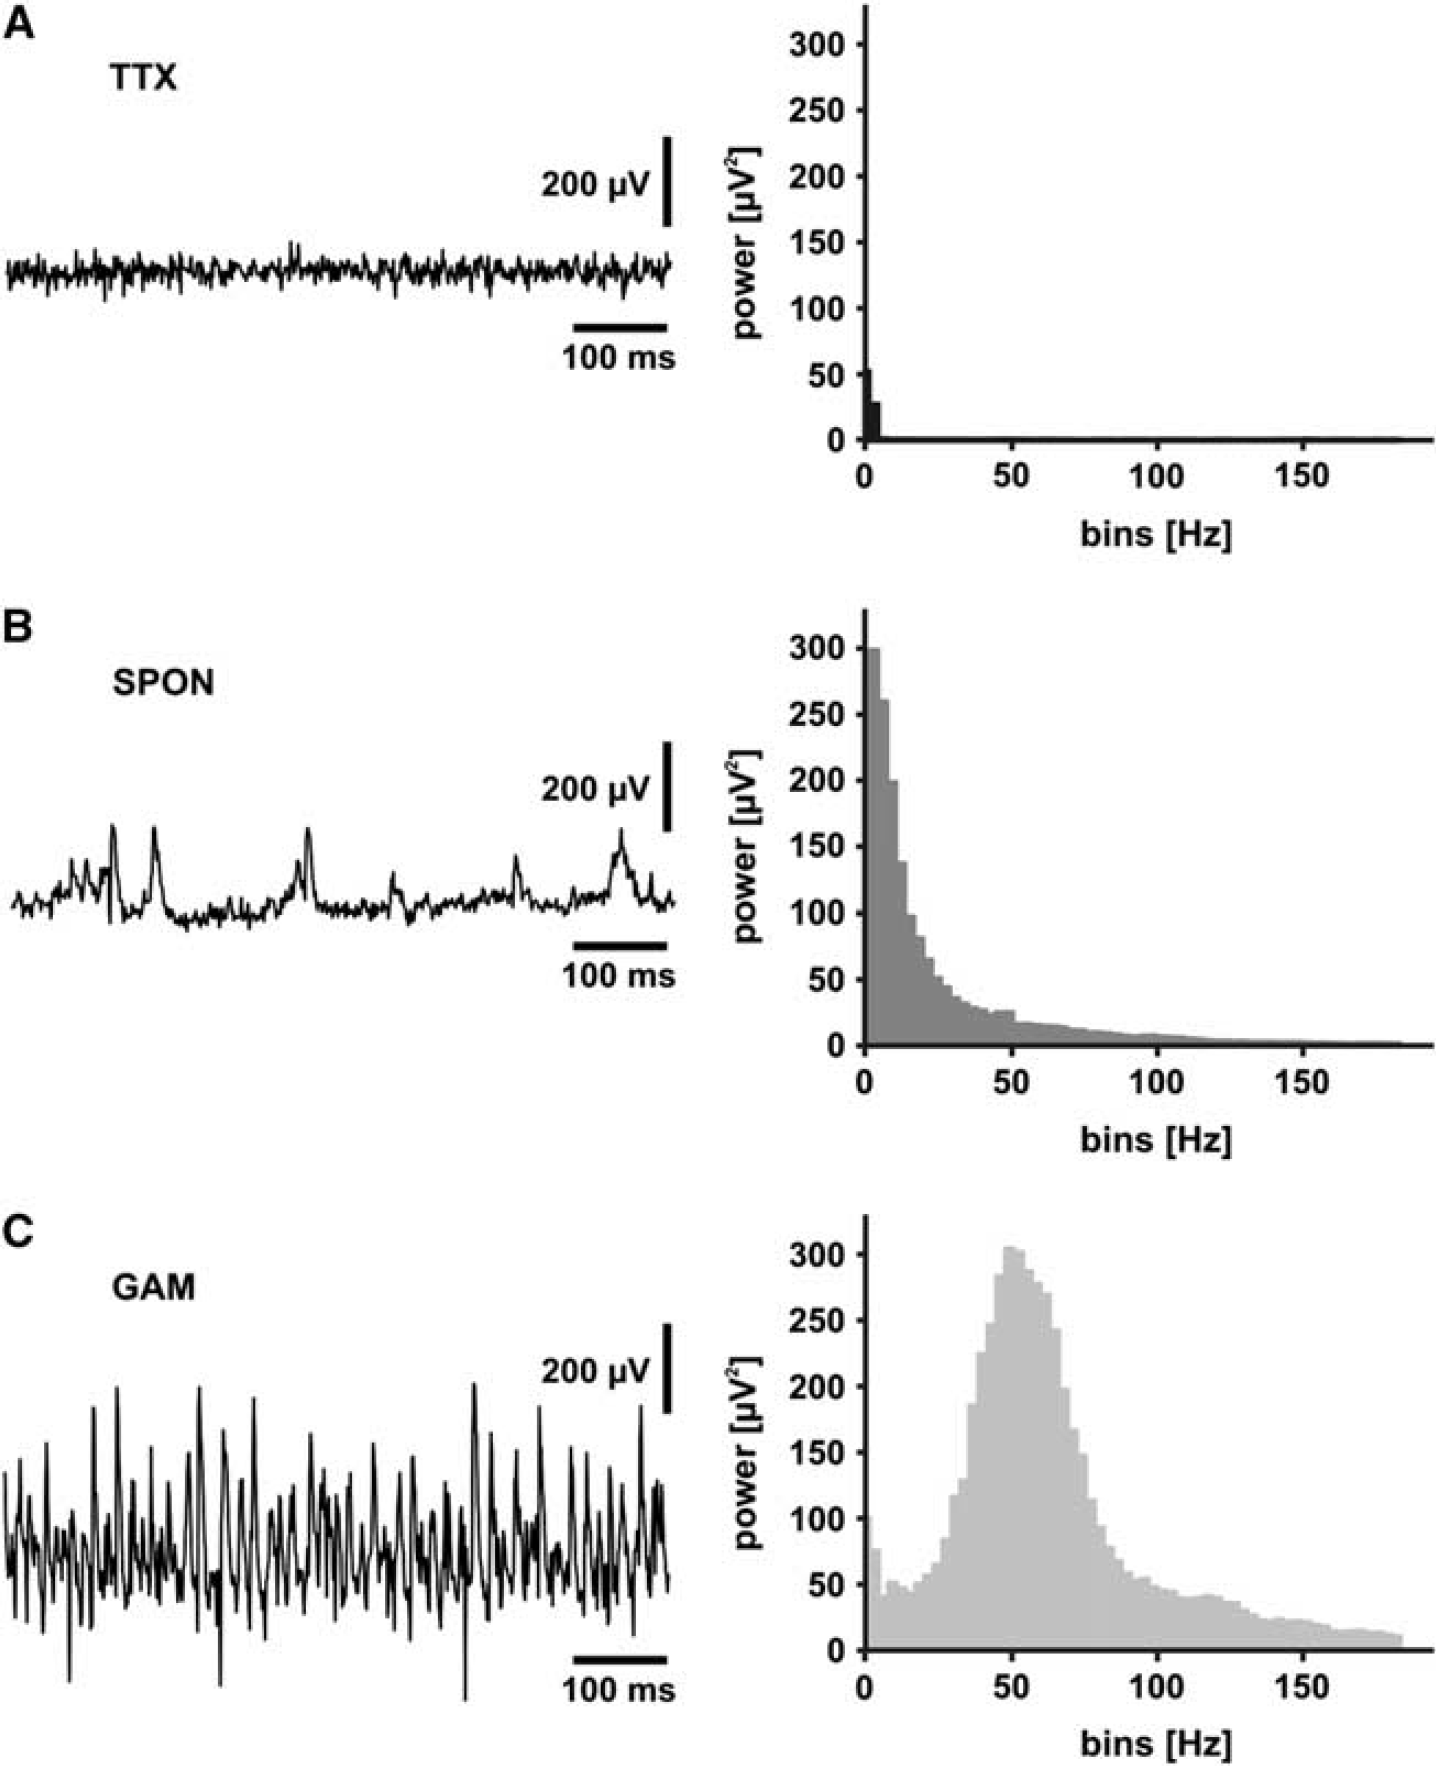
Three different activity states of the hippocampal CA3 network. Recordings of the local field potential (LFP) were conducted in stratum pyramidale of area CA3 in organotypic hippocampal slice cultures. (
Depth Profiles of pO2 During the Activity States
By using oxygen sensor microelectrodes that have been successfully used in vitro and in vivo,13,18,19 we recorded depth profiles of pO2 with vertical steps of 16 μm. Thus, we were able to determine the pO2 in virtually any neuronal cell layer (z axis) of a given slice culture, 26 and with much higher spatial resolution as reported previously.17,27,28 The lowest pO2 values were found below the slice core, indicating a better oxygen supply from the upper slice surface (exposed to ambient gas mixture) compared with the lower slice surface (exposed to recording solution) (Figure 3A). Lowest pO2 values differed significantly when comparing the three activity states (TTX, 90 ± 9 mm Hg; SPON, 47 ± 6 mm Hg; GAM, 18 ± 3 mm Hg; P ≤ 0.01) (Figure 3B). Notably, during gamma oscillations the pO2 never decreased down to 0 mm Hg; the lowest value of 5 mm Hg was determined 16 μm below the slice core in a slice culture of 361 μm thickness.
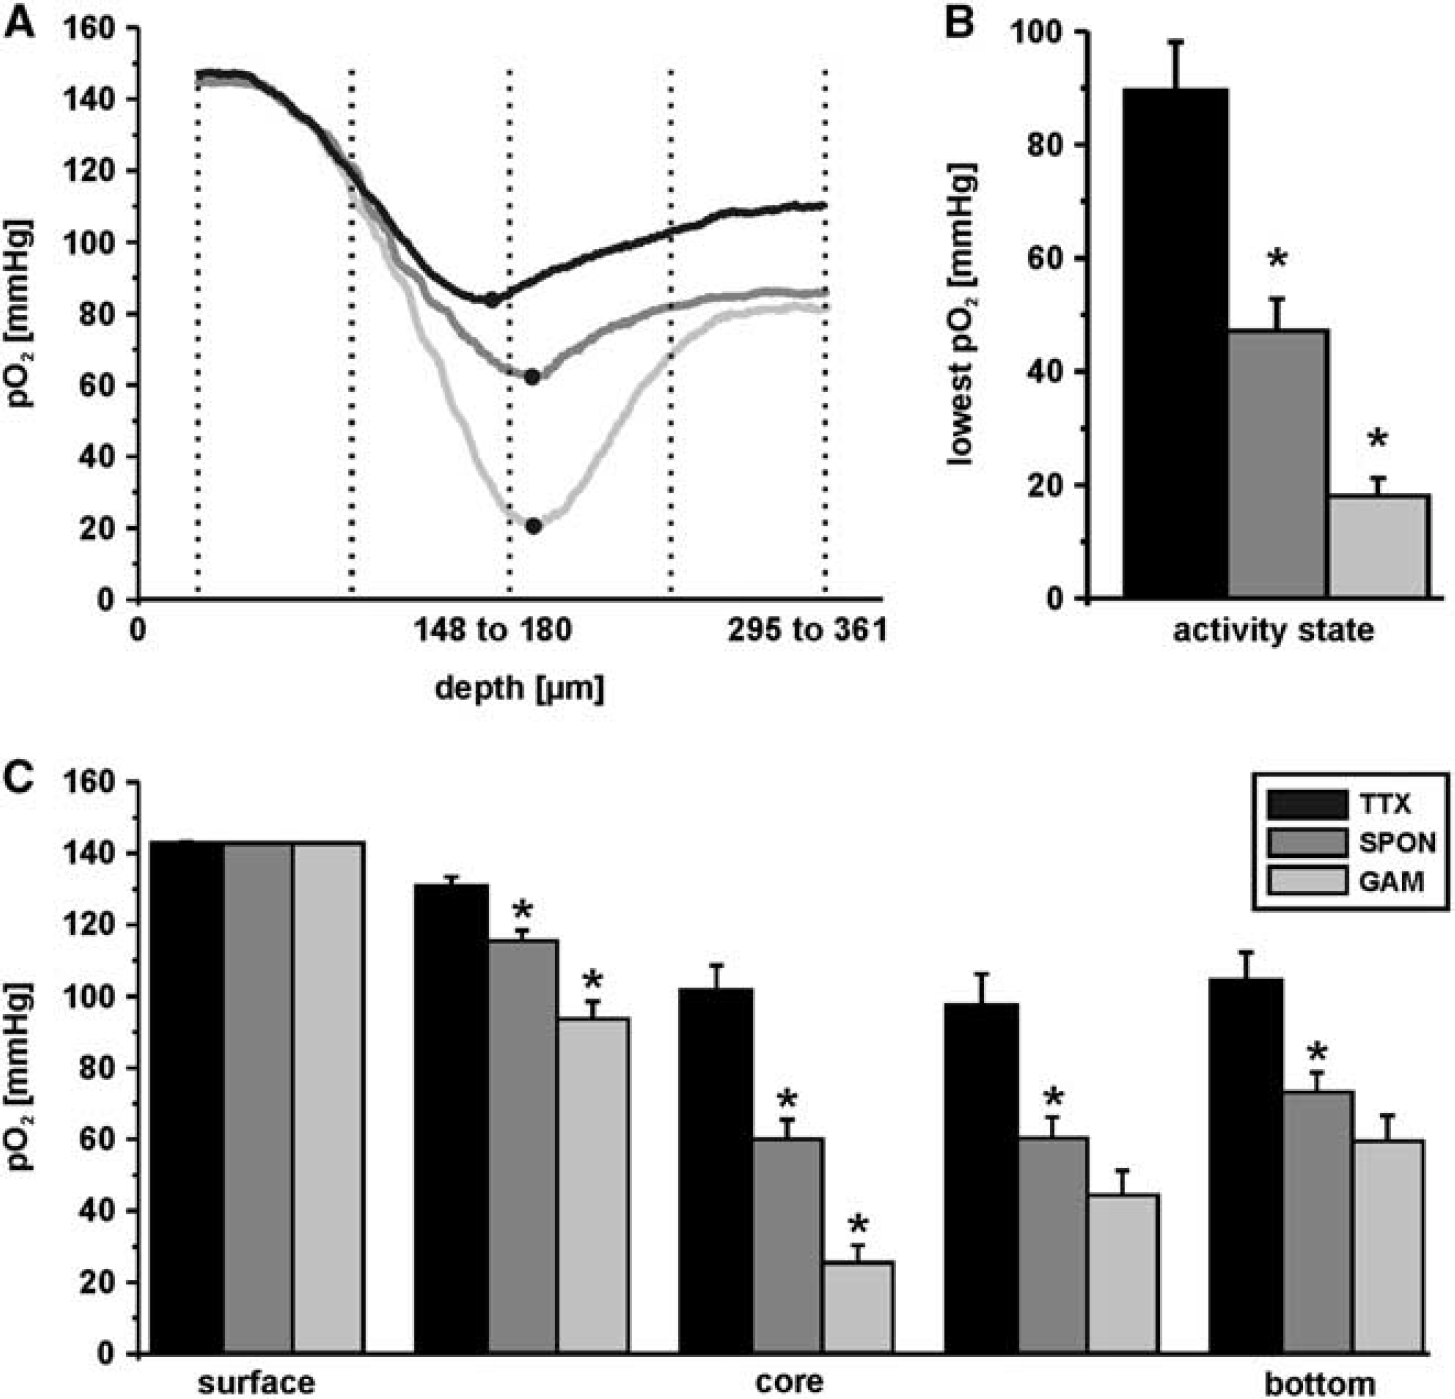
Depth profiles of partial oxygen pressure (pO2) during the three different activity states. The activity states of the hippocampal CA3 network (Figure 2) were verified in each individual slice culture and pO2 depth profiles were recorded with vertical steps of 16 μm. (
For further detailed analysis, we included pO2 values from five defined depth levels of each slice culture in the evaluation: at the upper slice surface (depth level 1), in the middle of upper surface and slice core (depth level 2), in the slice core (depth level 3), in the middle of slice core and lower slice surface (depth level 4), and at the lower slice surface (depth level 5) (Figures 3A and 3C). Compared with spontaneous network activity, gamma oscillations were associated with significantly larger decreases in pO2 in depth levels 2 and 3. Compared with the absence of spiking (TTX), spontaneous network activity (SPON), and gamma oscillations (GAM) were associated with significantly larger decreases in pO2 in all depth levels below the upper slice surface (P < 0.01). Notably, gamma oscillations that were induced under improved recording conditions and using a 20% O2 gas mixture (Materials and methods) were associated with large decreases in pO2, similar to those obtained with a 95% O2 gas mixture in both hippocampal slice cultures and acute slices from rat and mouse. 17
Quantification of Oxygen Consumption Rates
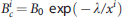
To quantify the oxygen consumption rates during the three activity states in the CA3 network, we used a mathematical reaction-diffusion model (Materials and methods). We fitted all pO2 profiles separately to the model described above. Fit parameters were the decay length λ and the oxygen consumption rate A for each slice culture as well as the pressure component B0 for all slice cultures that was given by the experimental settings rather than being a property of biologic material. This was performed for five different values of D. The optimal value for B0 was 40 × D. The goodness of fits achieved with the model can be appreciated from three representative pO2 profiles that are given in Figures 4A to 4C. Mean r 2 values did not differ between the groups (TTX, 0.982 ± 0.009; SPON, 0.987 ± 0.003; GAM, 0.998 ± 0.001; P > 0.2). All pO2 profiles and respective fits are provided in Supplementary Figures S1 to S4. Inspection of the obtained model parameters showed that the contribution of convective oxygen transport dominates over diffusion in the upper layers of slice cultures where the experimentally determined pO2 profile has a convex shape (see below). This is due to construction and gas exchange in the interface chamber (Figure 1).
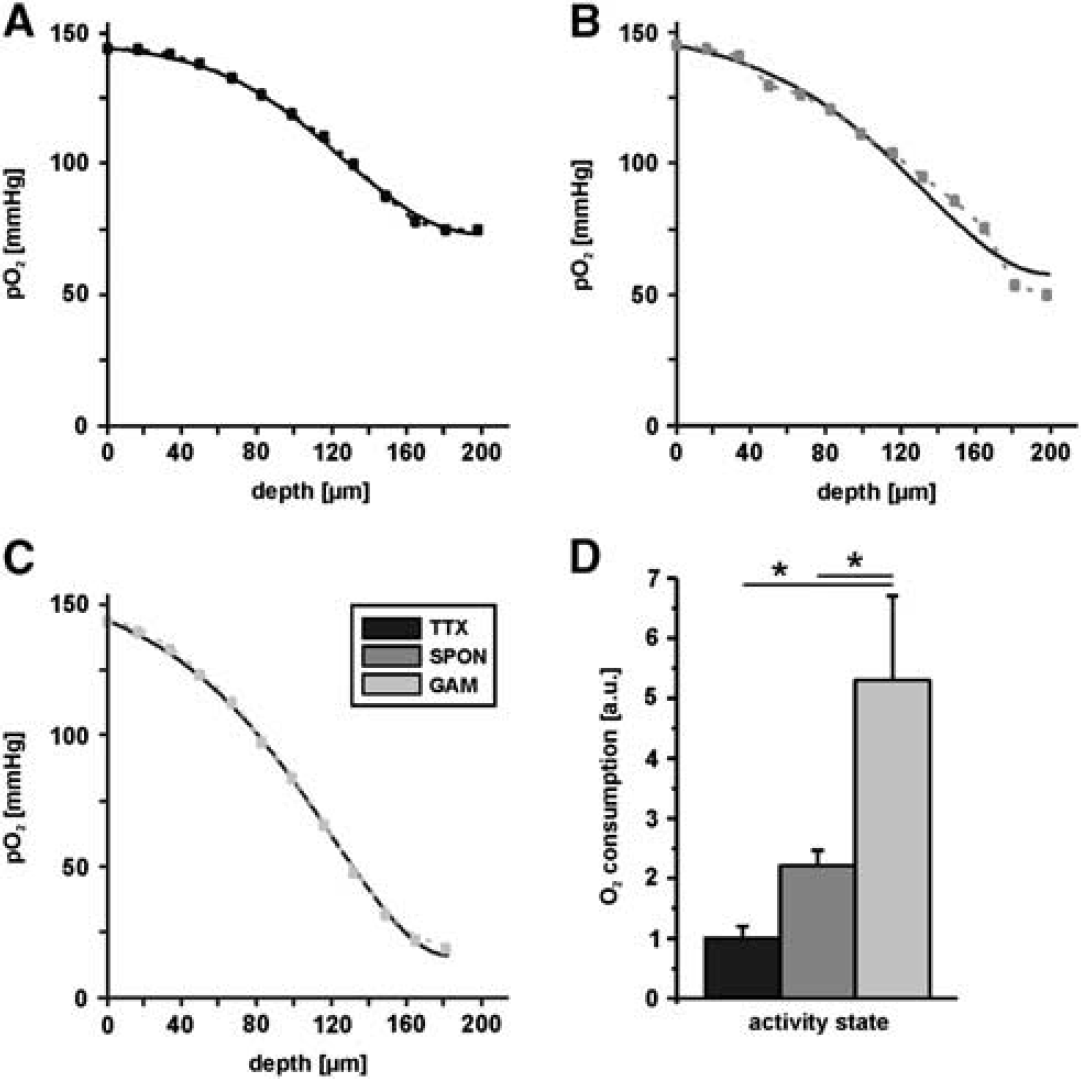
Fittings of partial oxygen pressure (pO2) depth profiles and calculation of oxygen consumption. Fittings (black lines) of representative pO2 depth profiles during the three different activity states of the hippocampal CA3 network, i.e., tetrodotoxin (TTX) (
The comparison of mean values that were obtained during the three activity states in the CA3 network revealed a positive correlation between oxygen consumption and degree of activity in slice cultures (Figure 4D). Importantly, relative oxygen consumption rate during gamma oscillations (GAM) was 2.2-fold higher than during spontaneous network activity (SPON, P = 0.003) and 5.3-fold higher than in the absence of spiking (TTX, P < 0.001). Comparison of the averaged values of TTX and SPON showed a clear trend. However, both values did not differ significantly (P = 0.51). Using a value of 1.6 × 103 μm2/s for D in the calculation, absolute values of oxygen consumption rates (A) for the three conditions were ~2.1 mmol/L per minute (TTX), 4.6 mmol/L per minute (SPON), and 11 mmol/L per minute (GAM). These values are higher than calculated for hippocampal acute slices, 29 which might be primarily due to experimental settings and the (evoked) activity state in the slices; 17 they are closer to values estimated for the gray matter of the conscious albino rat. 30 Different values of D changed the fit values for A in an equivalent manner but left the relative consumption rates unchanged (Table 1).
Absolute values for oxygen consumption
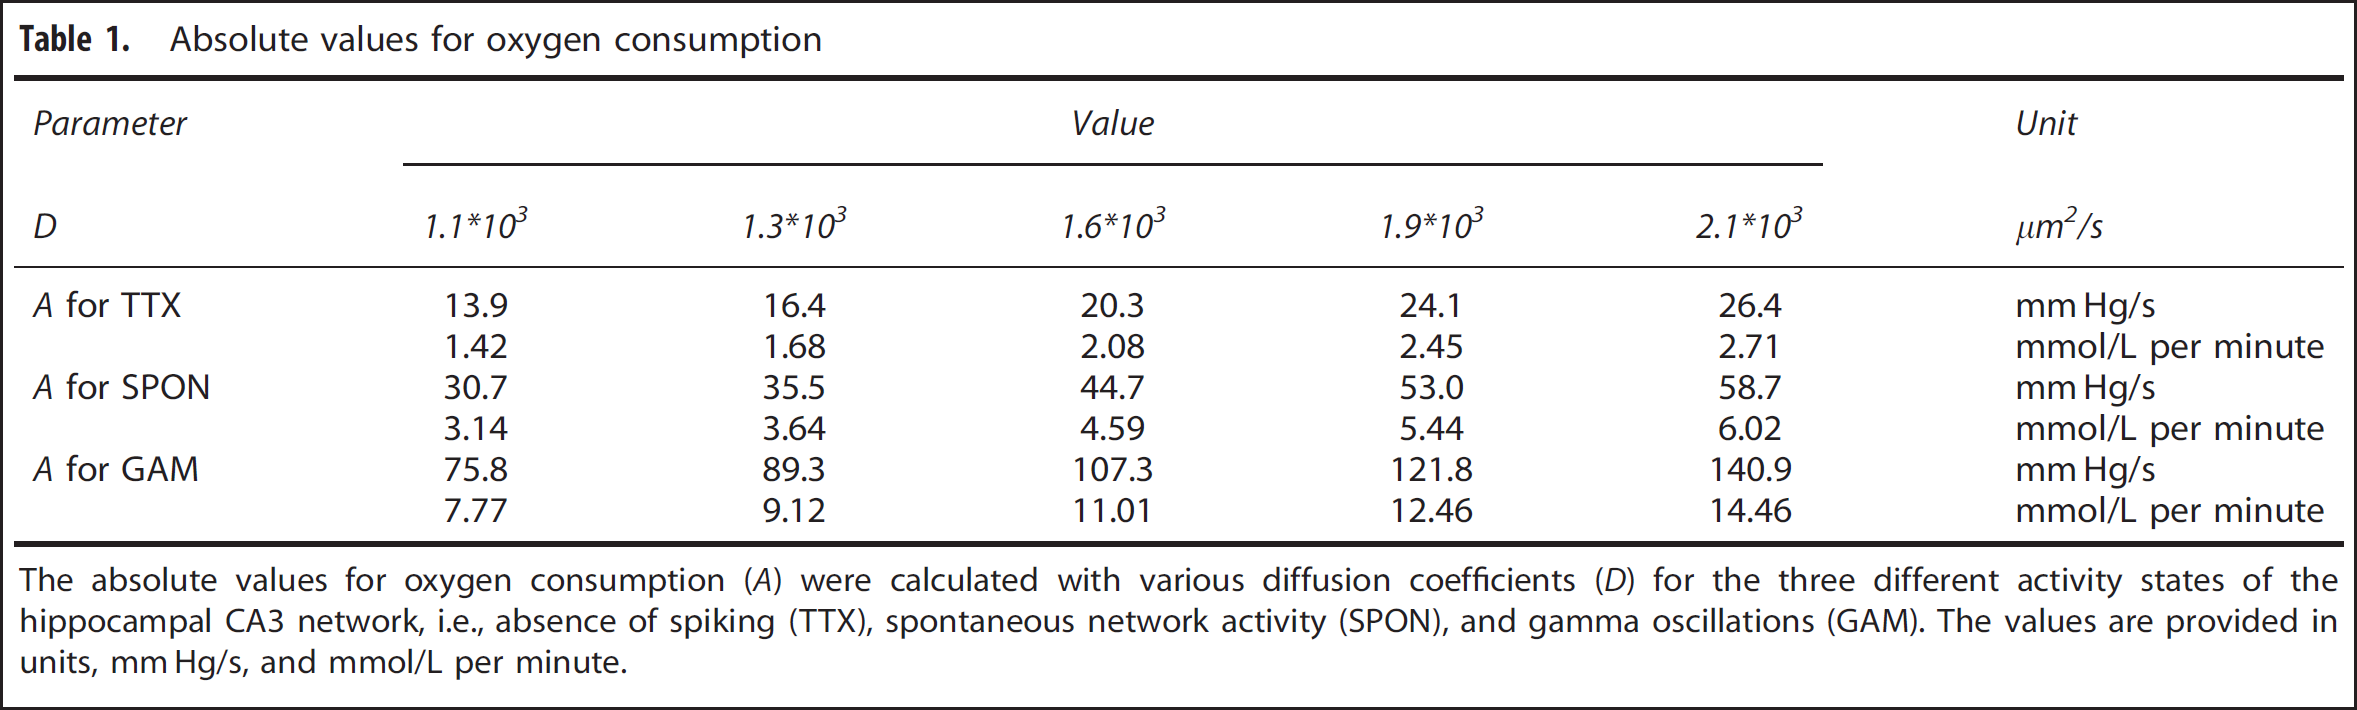
The absolute values for oxygen consumption (A) were calculated with various diffusion coefficients (D) for the three different activity states of the hippocampal CA3 network, i.e., absence of spiking (TTX), spontaneous network activity (SPON), and gamma oscillations (GAM). The values are provided in units, mm Hg/s, and mmol/L per minute.
Implications for Oxygenation of Neuronal Tissue In Vivo
According to our results from mathematical modeling, the contribution of convective oxygen transport dominates over diffusion. The central role of this convective component for sufficient oxygen supply into the depth of the slice is illustrated in Figure 5, where the convective contribution was put to zero. The resulting pO2 profiles reveal that during both spontaneous network activity and gamma oscillations the tissue oxygenation decreases to zero in a distance of <100 and 70 μm, respectively. This finding corresponds to our experimental observation that switching off the gas supply to the interface recording chamber and only retaining the gassing of the recording solution resulted in macroscopic swelling of the slice and necrosis of the neurons. Under these conditions, it was not possible to achieve a steady-state pO2 profile.

Application of the model to estimate in vivo conditions. Experimentally determined values (small boxes) and simulated partial oxygen pressure (pO2) depth profiles for the three different activity states, i.e., tetrodotoxin (TTX) (
To apply the model to the in vivo situation, in which oxygen from capillaries reaches the brain parenchyma only by diffusion, we again neglected the convective oxygen transport in our model and put the pO2 in the capillary to 55 and 28 mm Hg. These values have been reported under physiologic conditions in vivo.7,19,31 These simulations reveal that during both spontaneous network activity and gamma oscillations sufficient oxygenation of the brain parenchyma is only ensured in a radius of ~30 to 60 μm (Figures 5B and 5C). The simulations also show that a vascular pO2 of 40 mm Hg would still ensure maintenance of gamma oscillations in a radius of ~35 μm around capillaries (Figure 5C). Intriguingly, this critical radius is in line with reported distances of 30 to 40 μm between capillaries in the brain.31,32 Lower oxygen boundary conditions would require a hemodynamic response to maintain gamma oscillations. 7
DISCUSSION
Here, we show that (1) oxygen consumption rate during gamma oscillations was 2.2-fold and 5.3-fold higher compared with spontaneous network activity and the absence of spiking, respectively. (2) Gamma oscillations as induced in the 20% O2 gas mixture were associated with large decreases in pO2, similar to the range observed with a hyperoxic 95% O2 gas mixture used in previous experiments. (3) Sufficient oxygenation during fast network oscillations in vivo would be ensured by the computed critical radius of 30 to 40 μm around capillaries.
Gamma Oscillations in the Hippocampus and the Importance of Oxygen Supply
Gamma oscillations have been observed in vivo in virtually any mammalian neocortical structure and in the hippocampus.14,15 Persistent gamma oscillations have been reliably induced in vitro by low concentrations of acetylcholine (carbachol) or kainic acid to activate cholinergic and glutamatergic receptors, respectively.12,33 Such oscillations in hippocampal acute slices and slice cultures share important features with hippocampal gamma oscillations in vivo.17,24 They are associated with an increase in postsynaptic potentials and action potentials; the spiking rates vary between 2 to 4 Hz and >30 Hz, depending on the type of neuron11,34,35 (and references in ref. 13). Gamma oscillations have been observed in the presence and the absence of theta oscillations (6 to 9 Hz), 34 and the human cortex is capable to generate gamma oscillations on the time scale of minutes during mental practice. 36 Therefore, gamma oscillations in vivo and in vitro may be used as a cellular correlate for a high activity brain state.
In slice preparations, oxygen has to diffuse over greater distances into the tissue because active transport by oxygenated blood is missing. Therefore, hyperoxic conditions (95% O2) have been used to provide oxygen in excess.11,12 Conversely, decreased oxygen supply led to the rapid abolishment of gamma oscillations in different models and preparations from rodents, in vitro and in vivo,11,13,33,37 perhaps because of rapid energy failure in fastspiking inhibitory interneurons with unique electrophysiological and biochemical properties.11,13,17 Compared with acute slices, organotypic slice cultures are thinner and have the advantage of intact cell layers on the slice cut surface because of recovery and reorganization during the culture period.10,26 Damaged and densely packed cells are putative barriers for oxygen molecules, thus compromising oxygen supply. 38 Moreover, usage of both interface chamber and intact Biopore membrane inserts improves oxygen diffusion to the tissue, and slice cultures do not contain residual fractions of anesthetics. Thus, we show here that improved recording conditions permit investigations of persistent gamma oscillations in a gas mixture with 20% O2, which cannot be achieved under (semi)submerged recording conditions.11,13 Moreover, we show that decreases in pO2 during gamma oscillations were similar compared with the gas mixture of 95% O2 (ref. 17), suggesting that respiratory uncoupling in hyperoxic slice layers 39 is not a crucial factor for high oxygen consumption rate during gamma oscillations. However, decreases in pO2 might reflect both activity-dependent oxygen consumption and limitation of oxygen transport into the slice. To take both processes into account, we developed a mathematical model to obtain a relative quantification of oxygen consumption rate during spontaneous network activity and gamma oscillations.
Quantification of O2 Consumption Rates by Mathematical Modeling We established a reaction-diffusion model to quantify the oxygen consumption rates in slice cultures during three well-defined activity states in hippocampal area CA3. Since all pO2 profiles showed convex characteristics in the upper part of the slice, we included an exponentially declining convective oxygen transport (decay length ~40 μm), in addition to diffusive oxygen supply. To our knowledge, an initial convex part of the pO2 depth profiles has never been reported, likely because of usage of thicker brain slices (1 to 1.5 mm) and lower spatial resolution (step sizes of ~100 μm). However, the convex part might be appreciated in illustrated pO2 profiles from earlier studies.27,28 By means of the mathematical model, we were able to quantify the oxygen consumption rates during gamma oscillations (GAM) in relation to spontaneous network activity (SPON) and the absence of spiking (TTX). The TTX blocks fast voltage-gated Na+ channels and thus suppresses the generation of action potentials in neuronal tissue. However, TTX leaves several other neuronal processes widely unaffected such as maintenance of resting membrane potentials and quantal release of neurotransmitters, with subsequent occurrence of miniature postsynaptic potentials. Thus, the TTX condition provides a good model for a widely inactive neuronal network. By contrast, hippocampal gamma oscillations in vitro may represent a high activity brain state and primarily reflect averaged synchronized inhibitory postsynaptic potentials in the perisomatic region rather than action potentials and excitatory postsynaptic potentials.12,14 Our experimental data and calculations suggest that gamma oscillations are associated with 2.2-fold and 5.3-fold higher oxygen consumption rate compared with spontaneous network activity and absence of spiking, respectively. Therefore, we conclude that the maximal variation of local oxygen consumption rate in brain tissue is in the order of a factor of about five.
Implications for Oxygen Consumption and Vasculature System In Vivo
As the reference condition, we suppressed spiking in slice cultures by TTX, notably in the absence of any anesthetics. This differs to a certain degree from pO2 measurements in anesthetized animals because anesthetics have been reported to significantly interfere with both neuronal activity and energy metabolism.24,25 However, recently it was shown in anesthetized rats that local oxygen consumption was significantly increased by all aspects of neuronal signaling, i.e., spontaneous and stimulus-induced Purkinje cell spiking and postsynaptic processes in the cerebellar cortex, while a large fraction of basal oxygen consumption was left intact in the presence of TTX (ref. 6). The state of spontaneous network activity in slice cultures may correspond to a brain state where spiking is not suppressed but external afferent input such as optical or visual stimulation is lacking. Spontaneous network activity is variable in slice cultures,13,16 which might correspond to spontaneous fluctuations in the blood oxygen level-dependent signal, observed even in the absence of explicit input or output. 40 Finally, gamma oscillations in slice cultures may represent a high activity brain state that is associated with higher cognitive functions, such as sensory processing, memory formation, and attentional selection.14,15 However, it is important to note that gamma oscillations of high amplitude are generated in the rodent hippocampal CA3 area; and recent evidence suggests that neuronal mitochondria in this area show specific enzymatic properties to match the high energy demand associated with gamma oscillations. 17 Such unique electrophysiological and biochemical features may not necessarily apply to other cortical regions expressing gamma oscillations. 15 However, our estimates of the relative increase in oxygen consumption rates during different activity states in slice cultures are in good agreement with recent in vivo data, according to which the basal energy utilization of the deeply anesthetized brain is ~20% of the conscious brain and that at the threshold of loss of consciousness, the energy utilization decreases by 40% to 50% (ref. 41).
In vivo, oxygen availability is dependent on active transport processes through blood vessels and passive oxygen diffusion through brain tissue. Enhanced neuronal activity is associated with a local rise in blood flow within a few seconds that markedly increases oxygenation at the capillary level.4,5,18 From the capillary, oxygen has to diffuse into the brain parenchyma. Tissue oxygenation by sole oxygen diffusion was mimicked by model simulations where the convective oxygen transport was put to zero and the pO2 at the interphase between the capillary and the tissue was varied between 55 and 28 mm Hg.19,31 The obtained pO2 profile suggests that sufficient oxygenation of brain tissue during gamma oscillations is only possible in a radius of ~30 to 40 μm from the capillary, which is in line with distances of 40 to 70 μm between capillaries in men and rodents.19,21,32,42 Thus, we conclude that the effort spent on the structure of the vasculature system is economized to just match the energy demand that is associated with high activity states such as gamma oscillations. Conversely, higher intercapillary distances might not permit prolonged periods of gamma oscillations, 36 unless compensatory hemodynamic responses occur.7,43 This notion is substantiated by observations that a strong geometrical association exists between vasculature and tissue oxygen availability 19 and that under chronic hypoxic conditions the intercapillary distance shortens because of enhanced angiogenesis. 44
DISCLOSURE/CONFLICT OF INTEREST
The authors declare no conflict of interest.
Footnotes
References
Supplementary Material
Please find the following supplemental material available below.
For Open Access articles published under a Creative Commons License, all supplemental material carries the same license as the article it is associated with.
For non-Open Access articles published, all supplemental material carries a non-exclusive license, and permission requests for re-use of supplemental material or any part of supplemental material shall be sent directly to the copyright owner as specified in the copyright notice associated with the article.