
Abstract
We hereby propose a novel approach to the identification of ischemic stroke (IS) susceptibility genes that involves converging data from several unbiased genetic and genomic tools. We tested the association between IS and genes differentially expressed between cases and controls, then determined which data mapped to previously reported linkage peaks and were nominally associated with stroke in published genome-wide association studies. We first performed gene expression profiling in peripheral blood mononuclear cells of 20 IS cases and 20 controls. Sixteen differentially expressed genes mapped to reported whole-genome linkage peaks, including the TTC7B gene, which has been associated with major cardiovascular disease. At the TTC7B locus, 46 tagging polymorphisms were tested for association in 565 Portuguese IS cases and 520 controls. Markers nominally associated in at least one test and defining associated haplotypes were then examined in 570 IS Spanish cases and 390 controls. Several polymorphisms and haplotypes in the intron 5–intron 6 region of TTC7B were also associated with IS risk in the Spanish and combined data sets. Multiple independent lines of evidence therefore support the role of TTC7B in stroke susceptibility, but further work is warranted to identify the exact risk variant and its pathogenic potential.
Keywords
Introduction
Stroke is the third leading cause of death in the developed world and is even more disabling than lethal; survival results in persistent neurological impairments and physical disabilities with a high socio-economic cost. Stroke is a complex disease, resulting from the interplay of numerous environmental and genetic risk factors. Current knowledge regarding the genetics of stroke is limited and identification of the susceptibility genes represents the clearest path to a better understanding of its etiopathogenic mechanisms.
In the present study, we propose a novel multifactorial approach that combines genomic profiling with linkage and association studies to dissect the genetic underpinnings of stroke. The usefulness of microarray expression analysis is often greatly hampered by the overwhelming amount of information generated combined with the fact that genes with the greatest levels of differential expression or significance are not necessarily the most important to further investigate. The use of intersecting data derived from other powerful and unbiased resources (e.g., linkage screens and genome-wide association studies (GWAS)), represents the first step toward a more efficient method of identifying susceptibility genes.
To our knowledge, there are no published studies investigating gene expression changes in humans that specifically increase the risk for a stroke event. The reported profiling studies in humans were performed either during the acute phase or in the first months after the stroke event (Moore et al, 2005a, 2005b; Tang et al, 2006; Baird, 2007; Xu et al, 2008; Sharp et al, 2011), and thus these studies address the stroke severity and/or recovery mechanisms more than the risk of the stroke event.
To investigate the genetic architecture of familial stroke, three whole-genome linkage screens have previously been performed. The initial linkage peak on chromosome 5q12 was identified in Icelandic families (Gretarsdottir et al, 2002) and was replicated in northern Sweden (Nilsson-Ardnor et al, 2005), with additional linkage evidence for loci on 1p34, 5q13, 7q35, 9q22, 9q34, 13q32, 14q32, 18p11, and 20q13 (Nilsson-Ardnor et al, 2007). Follow-up of two Icelandic studies on stroke (Gretarsdottir et al, 2003; Helgadottir et al, 2004) has sparked intense and on-going investigation and debate regarding whether PDE4D and ALOX5P are true stroke susceptibility genes (Domingues-Montanari et al, 2010a).
The recent advent of GWAS has enabled genome-wide investigations of stroke, mostly in case–control data sets. The first IS GWAS tested the association of over 400,000 single-nucleotide polymorphisms (SNPs) in 249 Caucasian IS cases and 268 controls (Matarín et al, 2007); no SNPs reached genome-wide significance, but the ones with the strongest associations merit further investigation. A second GWAS was performed in 188 Japanese IS cases and 188 controls using 52,608 gene-based tagging SNPs. This study was followed by validation in large Japanese samples and sequencing; an association was identified between lacunar infarction and SNP 1425G/A in the protein kinase C η (PRKCH) gene on chromosome 14q22–q23 (Kubo et al, 2007). However, this SNP has a very small minor allele frequency in Europeans and Africans, suggesting that this association is likely to be Asian-specific (Cheng et al, 2009). In 2008, an IS GWAS performed in Icelandic samples and validated in several large European cohorts, found two neighboring SNPs (rs2200733 and rs10033464) on chromosome 4q25 to be strongly associated with cardioembolic stroke (Gretarsdottir et al, 2008). Single-nucleotide polymorphism rs2200733, which was previously strongly implicated in atrial fibrillation susceptibility, was also associated with all IS types combined. Finally, the latest stroke GWAS was a joint analysis of four large American and European data sets (Ikram et al, 2009); it yielded two intergenic SNPs within 11 kb of NINJ2 (ninjurin 2) that were highly associated with IS and atherothrombotic stroke, as well as with all strokes combined. These findings were not replicated in a study of 8,637 IS cases and 8,733 controls of European ancestry (ISGC and WTCCC2, 2010).
The only family-based genome-wide scan for IS was conducted on 1,345 Framingham Heart Study participants from 310 pedigrees (Larson et al, 2007). Four major cardiovascular disease (CVD) outcomes (e.g., major atherosclerotic CVD, which includes myocardial infarction, coronary heart disease, death, and stroke) were analyzed and several associations reached P<1 × 10⁻⁵.
Given the discrepancies in the findings among GWAS, it is clearly necessary to validate their most significant results (above and below genome-wide significance level) in independent data sets, as well as by other approaches, such as the one proposed here (combination of genetics and genomic profiling), to pinpoint the real genetic players in stroke etiology.
Materials and methods
Study Subjects
The Portuguese and Spanish stroke cases and controls used in this study were ascertained and collected as described previously (Krug et al (2010) for Portuguese samples, Montaner et al (2006) for Spanish cases, and Domingues-Montanari et al (2010c) for Spanish controls). All participants were adults and Caucasian. Spanish patients were classified into causative subtypes according to the Trial of Org 10172 in Acute Stroke Treatment classification (Adams et al, 1993).
More stringent inclusion and exclusion criteria were applied to individuals participating in the genomic expression profiling study; IS patients were required to have suffered only one stroke episode, at least 6 months before the blood collection, and controls could not have a family history of stroke. Participants with severe anemia or active allergies were also excluded.
The study was approved by the ethics committees of the participating institutions. All participants were informed of the study and provided informed consent.
Gene Profiling Studies
Whole blood samples were obtained by venipuncture and collected in BD Vacutainer CPT tubes (BD, Franklin Lakes, NJ, USA). These samples were centrifuged to isolate peripheral blood mononuclear cells (PBMCs), which were then washed twice and their RNA was stabilized using RNAlater (Qiagen, Hilden, Germany) within 3 hours after sample collection. Total RNA was extracted using the RNeasy Mini kit (Qiagen). High-quality total RNA, 3.5 μg from each individual, was hybridized to a GeneChip Human Genome U133 Plus 2.0 microarray (Affymetrix, Santa Clara, CA, USA) at the Instituto Gulbenkian de Ciência's Affymetrix Core Facility following the manufacturer's protocol. Extensive quality control checks were performed in all steps of the process.
The generated intensity array data were analyzed together with their respective CDF file from Affymetrix on the Partek software (Partek Incorporated, St Louis, MO, USA). The imported CEL files were subjected to background correction, normalization, and summarization using the robust multichip average algorithm. Analysis of variance was used to identify the differentially expressed genes among cases and controls, taking into account known experimental (type, sex, and age) and study design (geographic origin and scan date) covariates (P value). The genes with a >1.2-fold change and a Q value (Storey, 2002) 0.05 were considered differentially expressed. All genes with P value 0.05 also had a Q value 0.05. The false discovery rate was determined based on Q values, as these have a higher apparent power when compared with other standard methods (Qian and Huang, 2005).
Gene expression profiling was conducted and reported in accordance with the minimum information about a microarray experiment (MIAME) criteria (Brazma et al, 2001). The Gene Expression Omnibus (GEO) accession number for the data is GSE22255.
With the Partek software, principal component analysis was performed to visualize the relative position of each individual in a low-dimensional space, and hierarchical clustering analyses were used to determine the expression patterns across the samples. As these visualization tools cannot correct for study design batch effects, we removed the effects of the geographic origin of the participants and the scan date of the microarrays using the batch-remove tool implemented in the Partek software before visualization. Principal component analysis was performed with the correlation dispersion matrix and normalized eigenvector scaling, and hierarchical clustering was performed with the correlation distance metric and centroid linkage method.
Gene ontology was executed using the Gene Function Enrichment tool from the dChip 2009 software (http://biosun1.harvard.edu/complab/dchip/), with a gene P threshold of 0.01 and the HG-U133_Plus_2.na28.annot.csv annotation file jointly with the most recent gene ontology structure files.
Quantitative real-time polymerase chain reaction confirmation of some of the microarray results was not performed because of an insufficient amount of RNA still available for several of the controls and patients used in this study.
Genotyping
Tagging SNPs in TTC7B and 10 kb flanking regions were identified in Haploview v4.0 (Mark Daly's Lab at the Broad Institute, Cambridge, MA, USA; Barrett et al, 2005) based on genotypes of 30 European (CEU, CEPH Utah residents with ancestry from northern and western Europe) family trios (HapMap Release 21/phase II Jul06) and using the following options: pairwise mode, r2>0.8, and minor allele frequency >0.1. A total of 61 SNPs were genotyped in the Portuguese data set using Sequenom's iPlex assays (Sequenom, San Diego, CA, USA) following the manufacturer's instructions. The primer sequences were designed using Sequenom's MassArray Assay Design 3.0 software (Sequenom) and are indicated in Supplementary Table 1. All genotype determinations were performed and blinded to affection status, and an extensive quality control was performed (e.g., eight HapMap controls of diverse ethnic affiliation, and sample duplication within and across plates). Single-nucleotide polymorphisms with a <90% call rate and SNPs out of Hardy–Weinberg equilibrium in the control group (P<0.05) were excluded.
For validation purposes, 10 SNPs in TTC7B (rs2343, rs12147413, rs11629065, rs942738, rs12893100, rs1742100, rs1742098, rs1535321, rs13379124, and rs7154098) were genotyped in the Spanish sample at the Spanish National Genotyping Center (CeGen) using Sequenom's iPlex assays.
Association Analyses
For all genotyped SNPs, deviations from Hardy–Weinberg equilibrium (P<0.05) were assessed at each marker in the case and control samples separately, using the SNPassoc v.1.4-9 package (González et al, 2007) implemented in the R freeware (http://cran.r-project.org/). Linkage disequilibrium (LD) plots were constructed with Haploview v4.0. All possible pairwise correlation coefficients (r2) in each gene were calculated, and LD plots were constructed with the r2 color scheme (r2=0: white; 0<r2 <1: shades of gray; r2=1: black).
The associations between IS risk and specific classes of alleles/genotypes/haplotypes were tested using a standard χ2 test. Haplotypes were estimated in Haploview v4.0 using the confidence intervals algorithm. Multivariate logistic regression with backward elimination of risk factors was performed using SNPassoc to adjust the association analyses for confounding covariates. Hypertension, diabetes, and ever smoking were the covariates in the Portuguese sample; hypertension, diabetes, ever smoking, and dyslipidemic status were the covariates in the Spanish data set. In the joint analysis with both data sets, the covariates were hypertension, diabetes, ever smoking, and sample origin. Only a weak interaction (i) was observed among covariates in regression models (−0.2<i<0.2). Results were considered statistically significant below the conventional level of 0.05. Odds ratios (ORs) and their associated 95% confidence intervals (CIs) were calculated to assess the relative disease risk conferred by a particular associated allele/genotype. Since some of the markers were in LD and the haplotype comparisons were not independent, we did not perform corrections for multiple testing; uncorrected P values are reported.
Results
Gene Expression Profiling
To investigate the gene expression differences between IS cases and controls in the nonacute phase of stroke, we compared the genetic profiles of PBMCs from 20 IS cases (from whom the samples were collected at least 6 months after the first and only stroke event) and 20 controls. The principal demographic, clinical, and lifestyle characteristics of the expression profiling study participants are shown in Table 1. The control and case groups were age- and sex-matched, and only the frequency of diabetes was significantly higher in IS patients than in controls (P=0.035). Four patients had diabetes controlled by medication and no controls had diabetes.
Characterization of the samples used in the gene profiling study
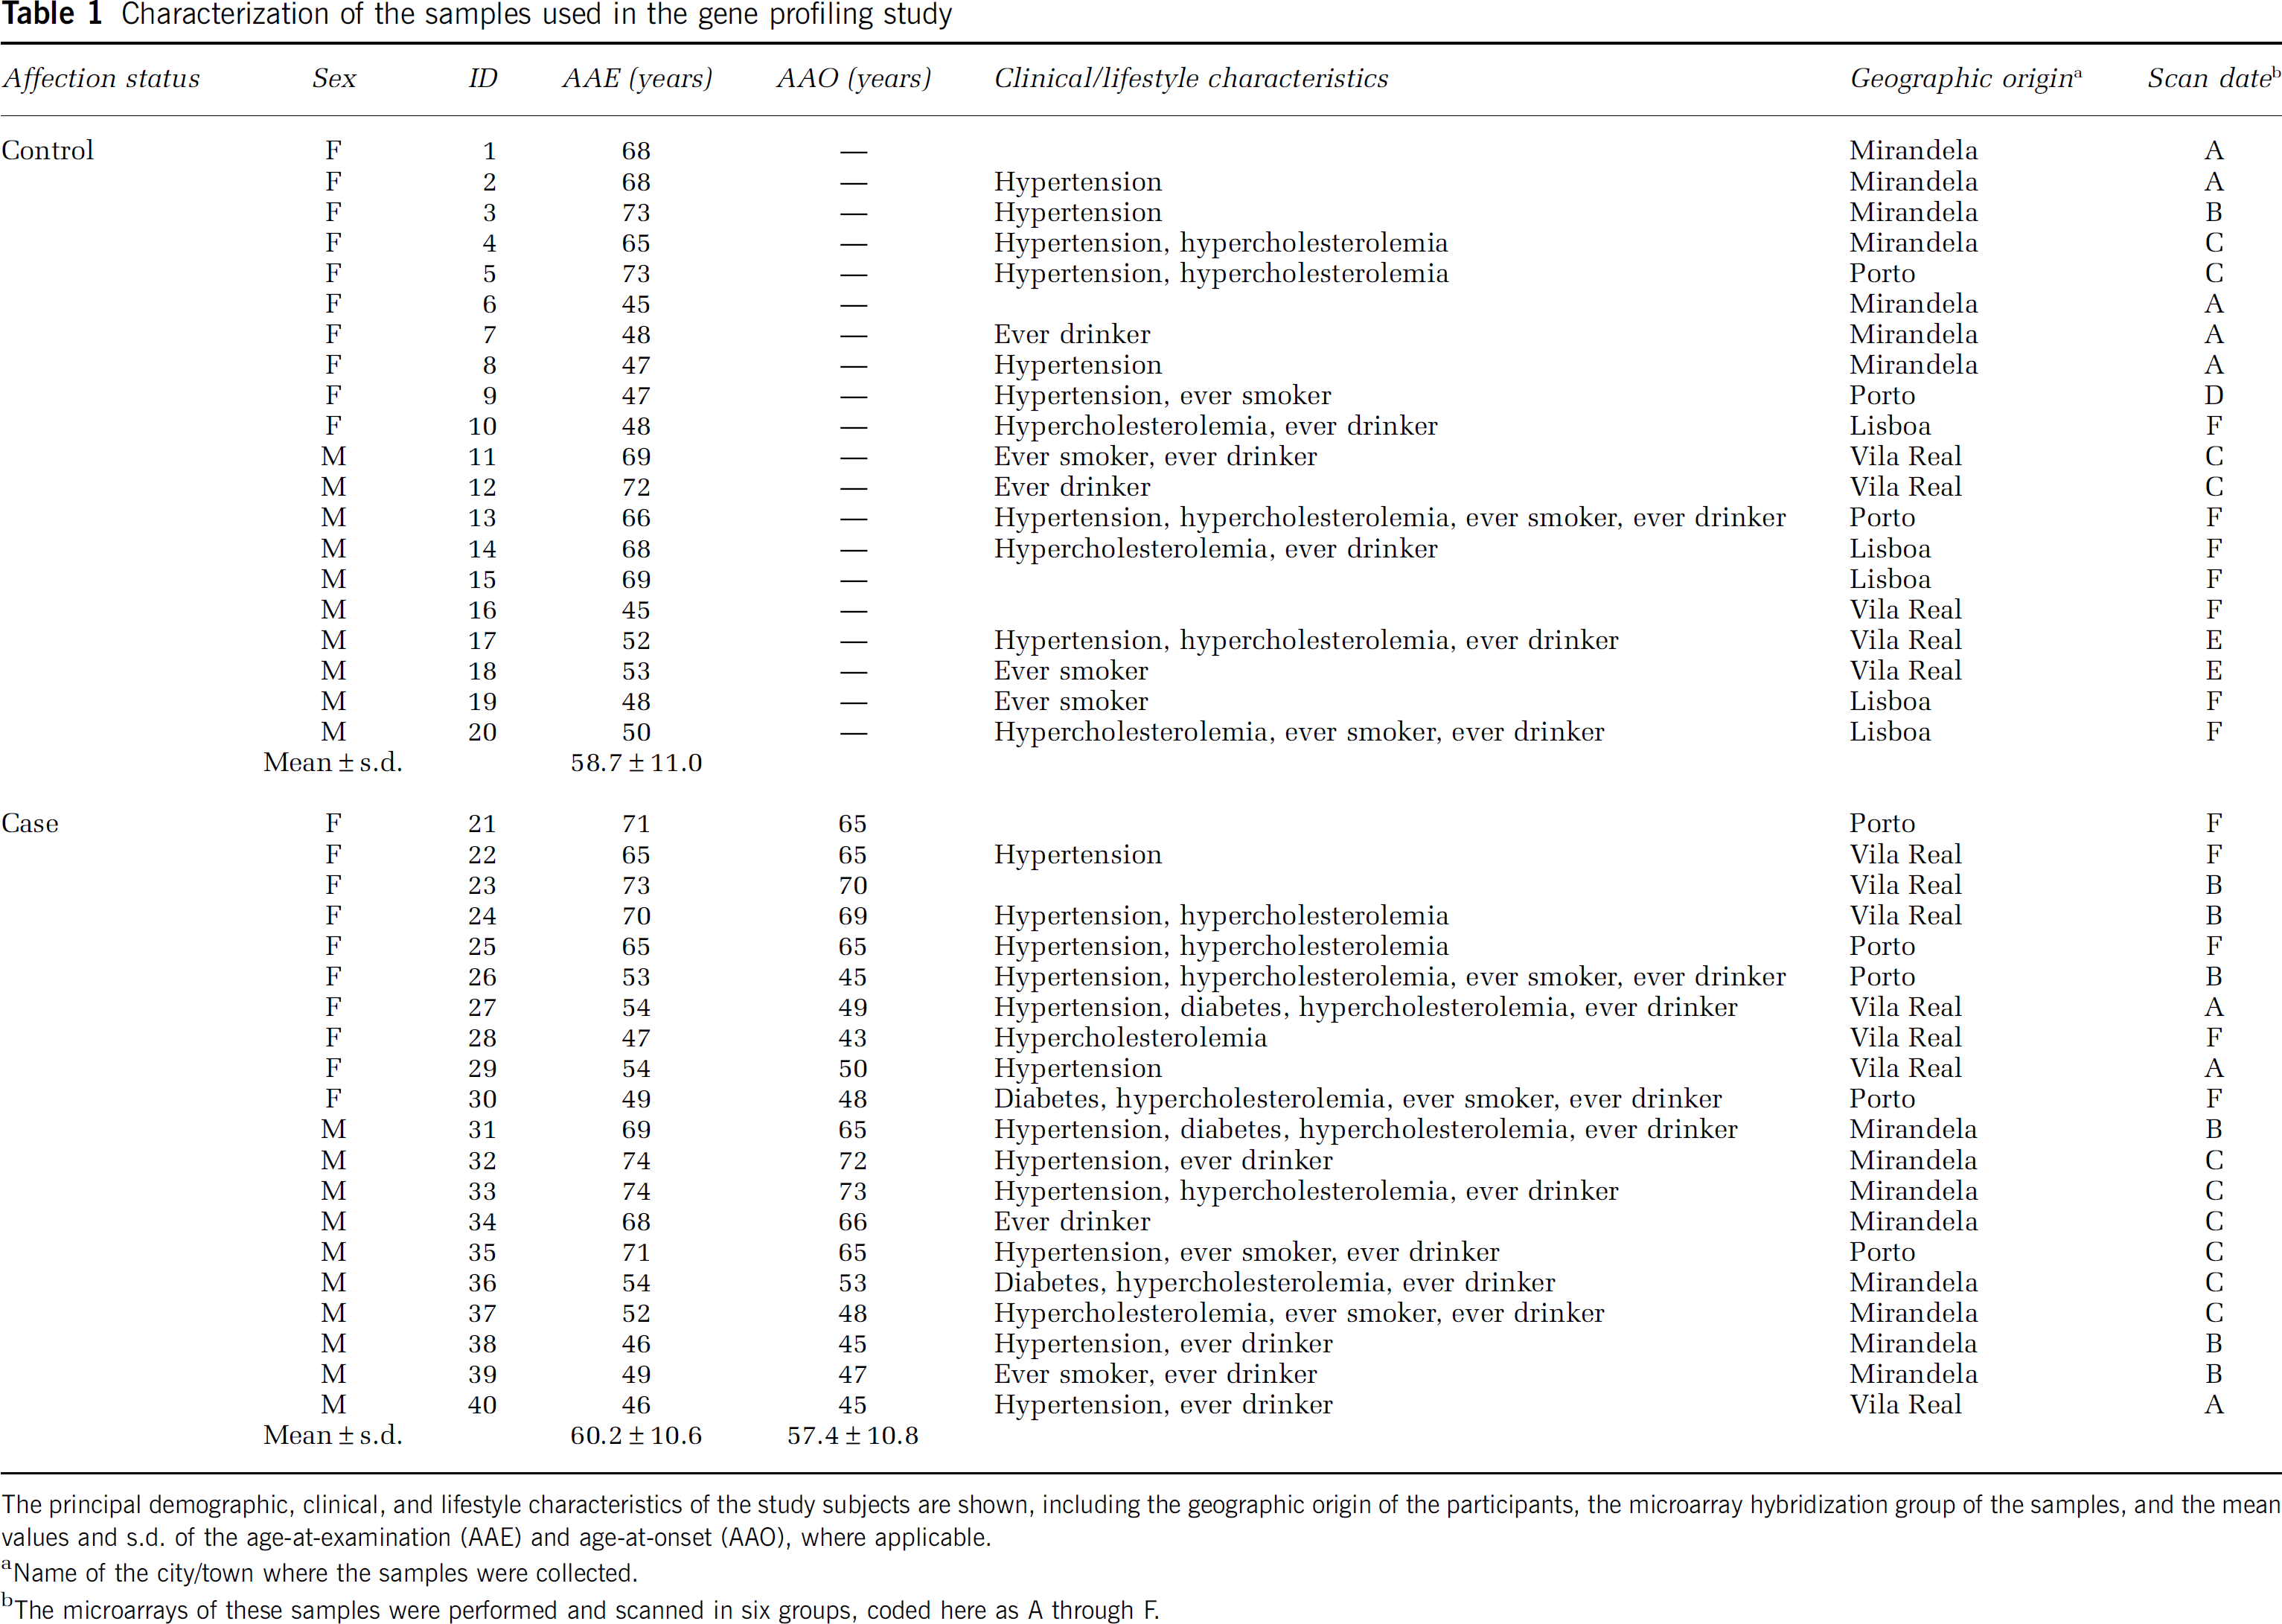
The principal demographic, clinical, and lifestyle characteristics of the study subjects are shown, including the geographic origin of the participants, the microarray hybridization group of the samples, and the mean values and s.d. of the age-at-examination (AAE) and age-at-onset (AAO), where applicable.
Name of the city/town where the samples were collected.
The microarrays of these samples were performed and scanned in six groups, coded here as A through F.
Total RNA from each individual was hybridized to an Affymetrix GeneChip Human Genome U133 Plus 2.0 microarray and all of the hybridized arrays met quality scores. The average±s.d. of present calls and of background for all the arrays were 44.8%±1.6% and 45.3%±5.7%, respectively.
Using analysis of variance on the normalized expression data, 709 probe sets (representing 580 genes) were found to be differentially expressed among IS cases and controls, with a threshold of 1.2-fold change and a Q value 0.05 (Supplementary Table 2). Downregulation was observed in 331 of these probe sets, representing 287 genes. The genes with the greatest and smallest changes are indicated in Supplementary Table 3.
The 3D principal component analysis plot obtained using probe sets with P<0.01 shows a clear separation between cases and controls along the first principal component (Supplementary Figure). The hierarchical clustering diagram using the 709 probe sets discriminates between the patients and unaffected individuals (Figure 1).
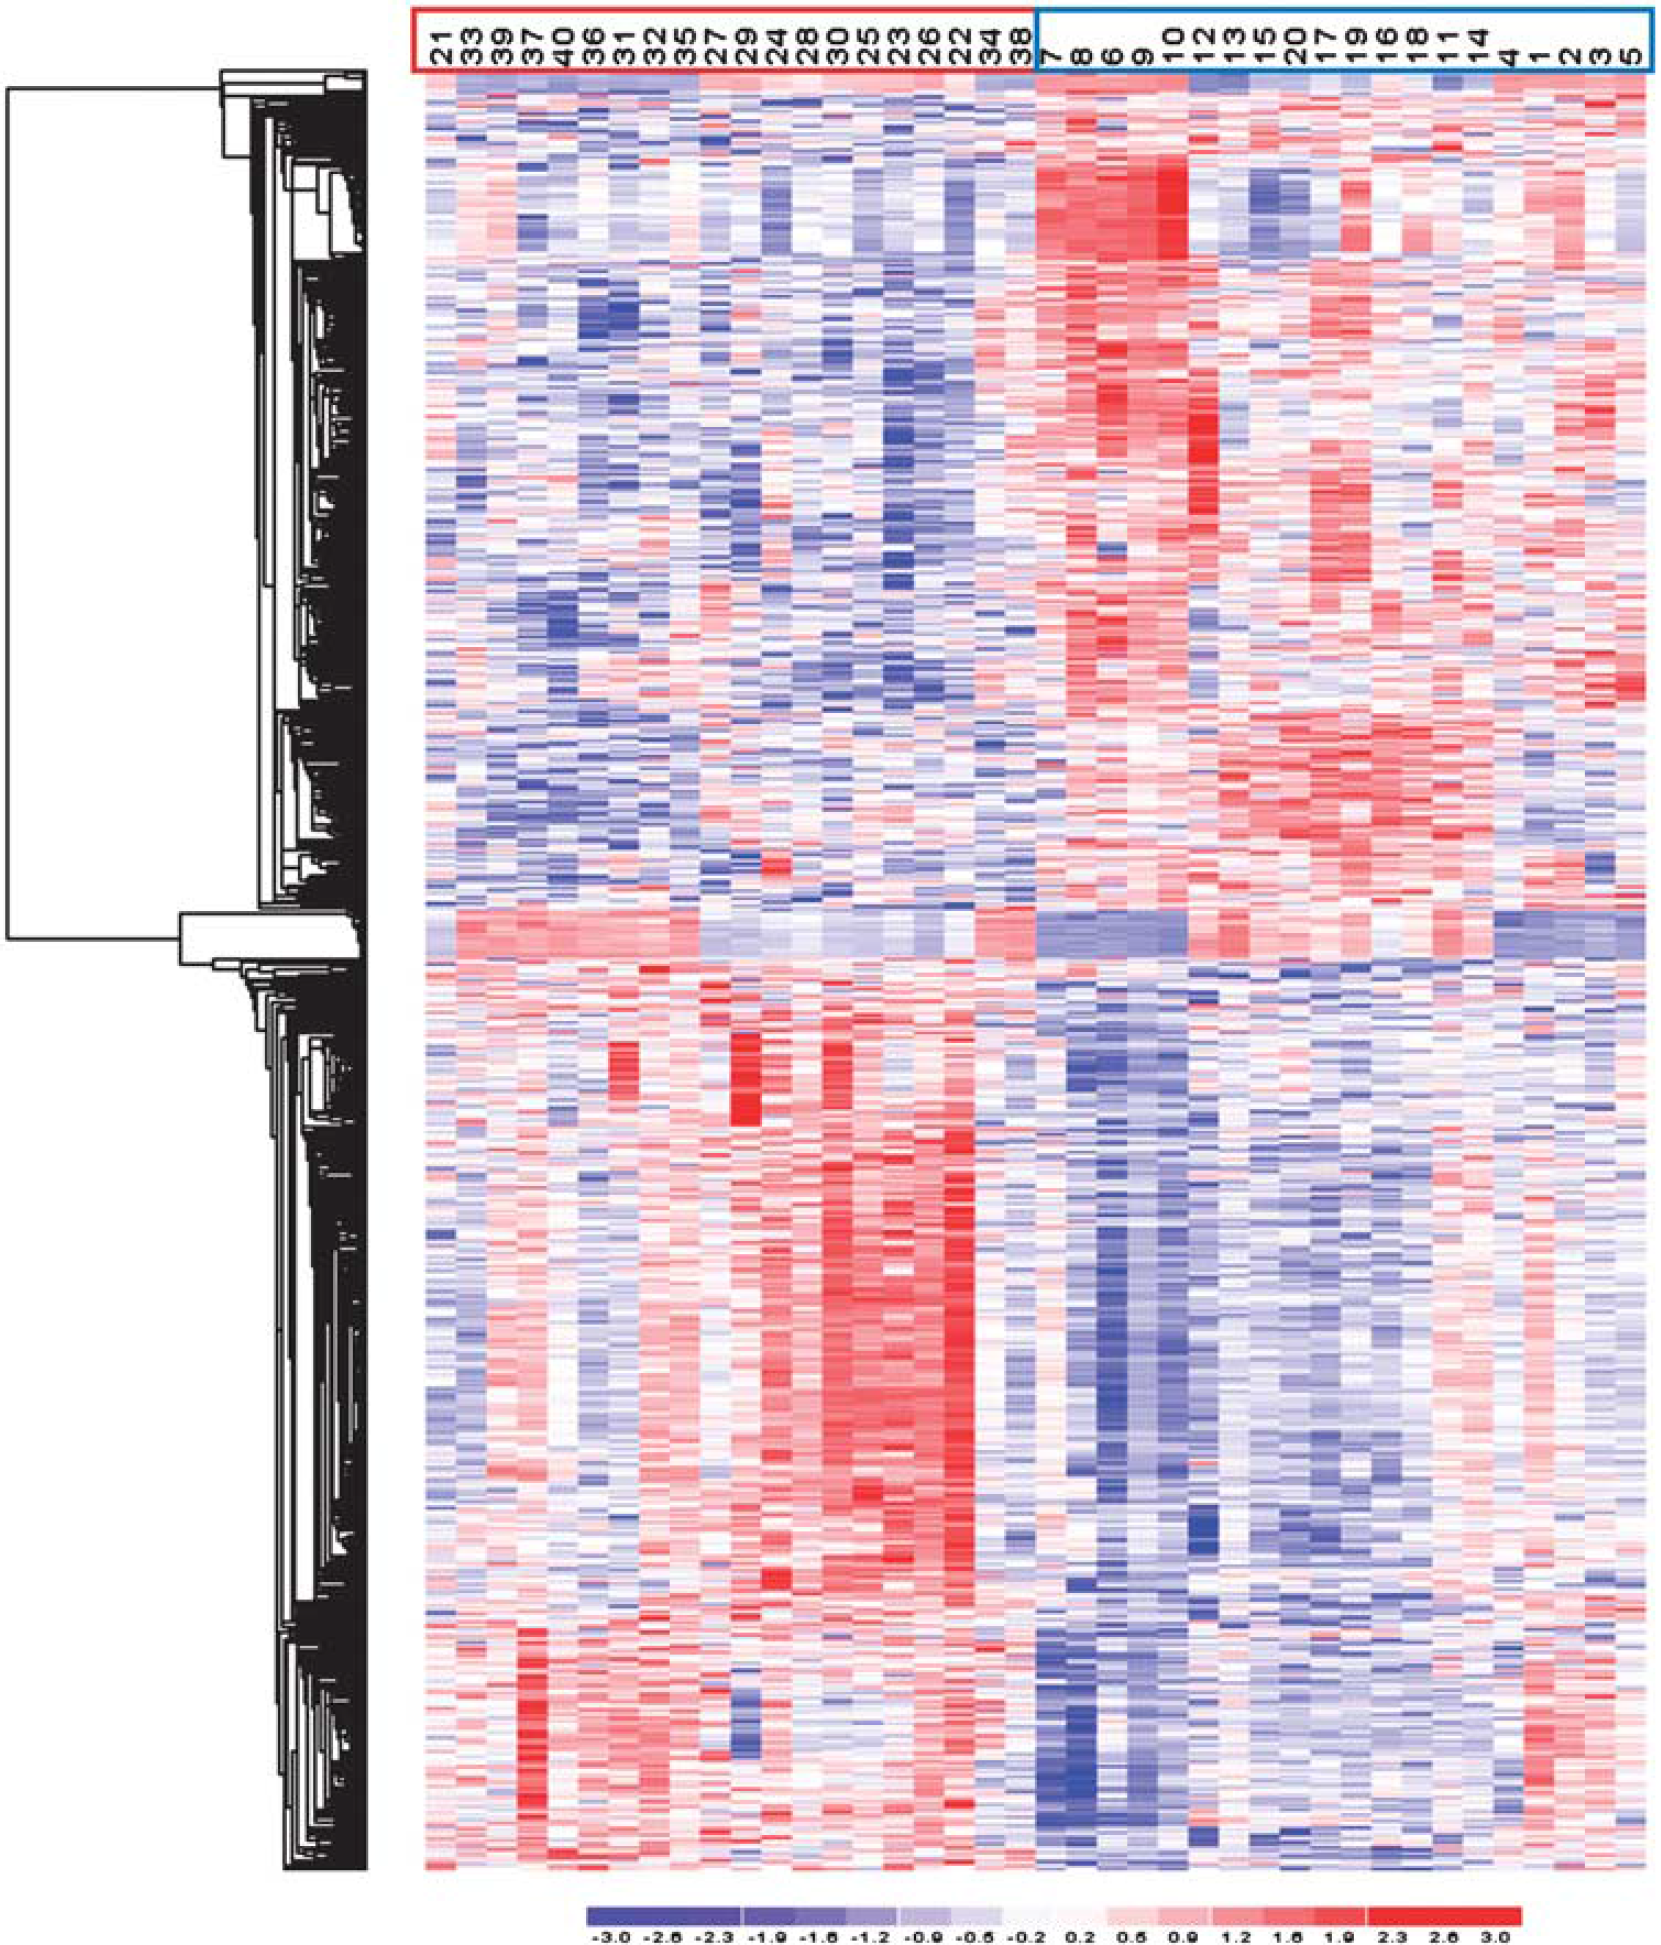
Illustration of the expression pattern differences among ischemic stroke (IS) cases and controls. Hierarchical clustering analysis of analyzed samples, using the 709 probe sets differentially expressed among IS cases and controls, with a threshold of a 1.2-fold change and a Q value 0.05. Each column represents an individual, and each row a probe set. Higher expression levels are dark red and lower levels are dark blue. Control and IS samples are indicated with blue and red boxes, respectively. This figure is produced with the Partek software.
When analyzing the 580 differentially expressed genes for their function (Supplementary Table 4), we found a significant overrepresentation (1.0 × 10⁻⁹<P<8.8 × 10⁻⁴) of genes related to antigen binding (13 genes), immune and inflammatory responses (38 and 16 genes, respectively), platelet α granule membrane (five genes), response to virus (11 genes), oxidoreductase activity (eight genes), and response to DNA damage stimulus (17 genes). These findings suggest that the PBMCs (from which the total RNA was extracted) of the IS patients have an active role in the complex immune and homeostatic responses to the vascular injuries that cause the ischemic attacks.
Convergence of Expression with Linkage and Genome-Wide Association Studies
To prioritize genes to be tested for association with stroke susceptibility, we intersected our expression results with those from published whole-genome linkage screens and GWAS for stroke. We found that 16 differentially expressed genes (Table 2) represented by specific probe sets (‘_at’ suffix) mapped to previously reported linkage peaks on chromosomes 1p34, 5q12, 9q22, 9q34, 13q32, 14q32, and 20q13 (Gretarsdottir et al, 2002; Nilsson-Ardnor et al, 2007). One of these 16 prioritized genes was TTC7B (ENSG00000165914), which was also a top hit for major CVD in the GWAS for CVDs of the Framingham Heart Study 100K project (Larson et al, 2007). In that project, the major CVD phenotype included myocardial infarction, coronary insufficiency, coronary heart disease death, and atherothrombotic stroke diseases. The emergence of this gene from our multifactorial approach emphasizes its likely role in IS and supports our expression findings.
Prioritized genes

Differentially expressed genes that mapped to previously reported whole-genome linkage peaks for stroke.
TTC7B Association Study
To investigate the role of TTC7B in IS, we performed a two-phase association study. In the first stage, 46 tagging SNPs in the gene or in its 10 kb flanking regions (Supplementary Tables 1 and 5) were tested for association with IS in a Portuguese case–control data set. In the second stage, SNPs that were associated at a low-stringency significance (P0.05) and those that defined associated haplotypes in the first phase were tested for association in a Spanish sample.
The principal demographic and clinical characteristics of the Portuguese study participants (565 unrelated IS patients and 520 unrelated healthy individuals) are shown in Supplementary Table 6. As expected, male-to-female ratio, and frequencies of hypertension, diabetes, ever smoking, and ever drinking were significantly higher in IS patients than in controls. The age-at-examination was deliberately significantly higher in controls relative to patients to minimize misclassification biases. Since the sex, ever smoking, and ever drinking were correlated (correlation factors near 0.5), only the hypertension, diabetes, and ever smoking were included in the analyses adjusted for covariates.
The top plot in Figure 2 depicts the allelic, genotypic (crude and adjusted), and top haplotype association results from the Portuguese data set (represented by open circles connected by lines). The pairwise LD plot (bottom picture of Figure 2) shows little LD between most of the 46 SNPs studied. Three polymorphisms (SNPs 15, 31, and 36) demonstrated allelic associations with IS, while six SNPs were associated with IS in unadjusted (SNPs 5, 15, 19, 33, and 36) and/or adjusted (SNPs 5, 7, 19, 33, and 36) genotypic tests (recessive model). Only SNP 36 was associated in all tests performed, with P<0.0095. Furthermore, the G allele of SNP 36 that was associated with increased stroke risk (OR (95% CI)=1.33 (1.10–1.61)), also drives the association between IS and the TACGTC haplotype defined by SNPs 33_34_35_36_37_38 (P=0.012, top plot in Figure 2). The AGG haplotype defined by SNPs 30_31_32 was also associated with IS (P=0.015, top plot in Figure 2).
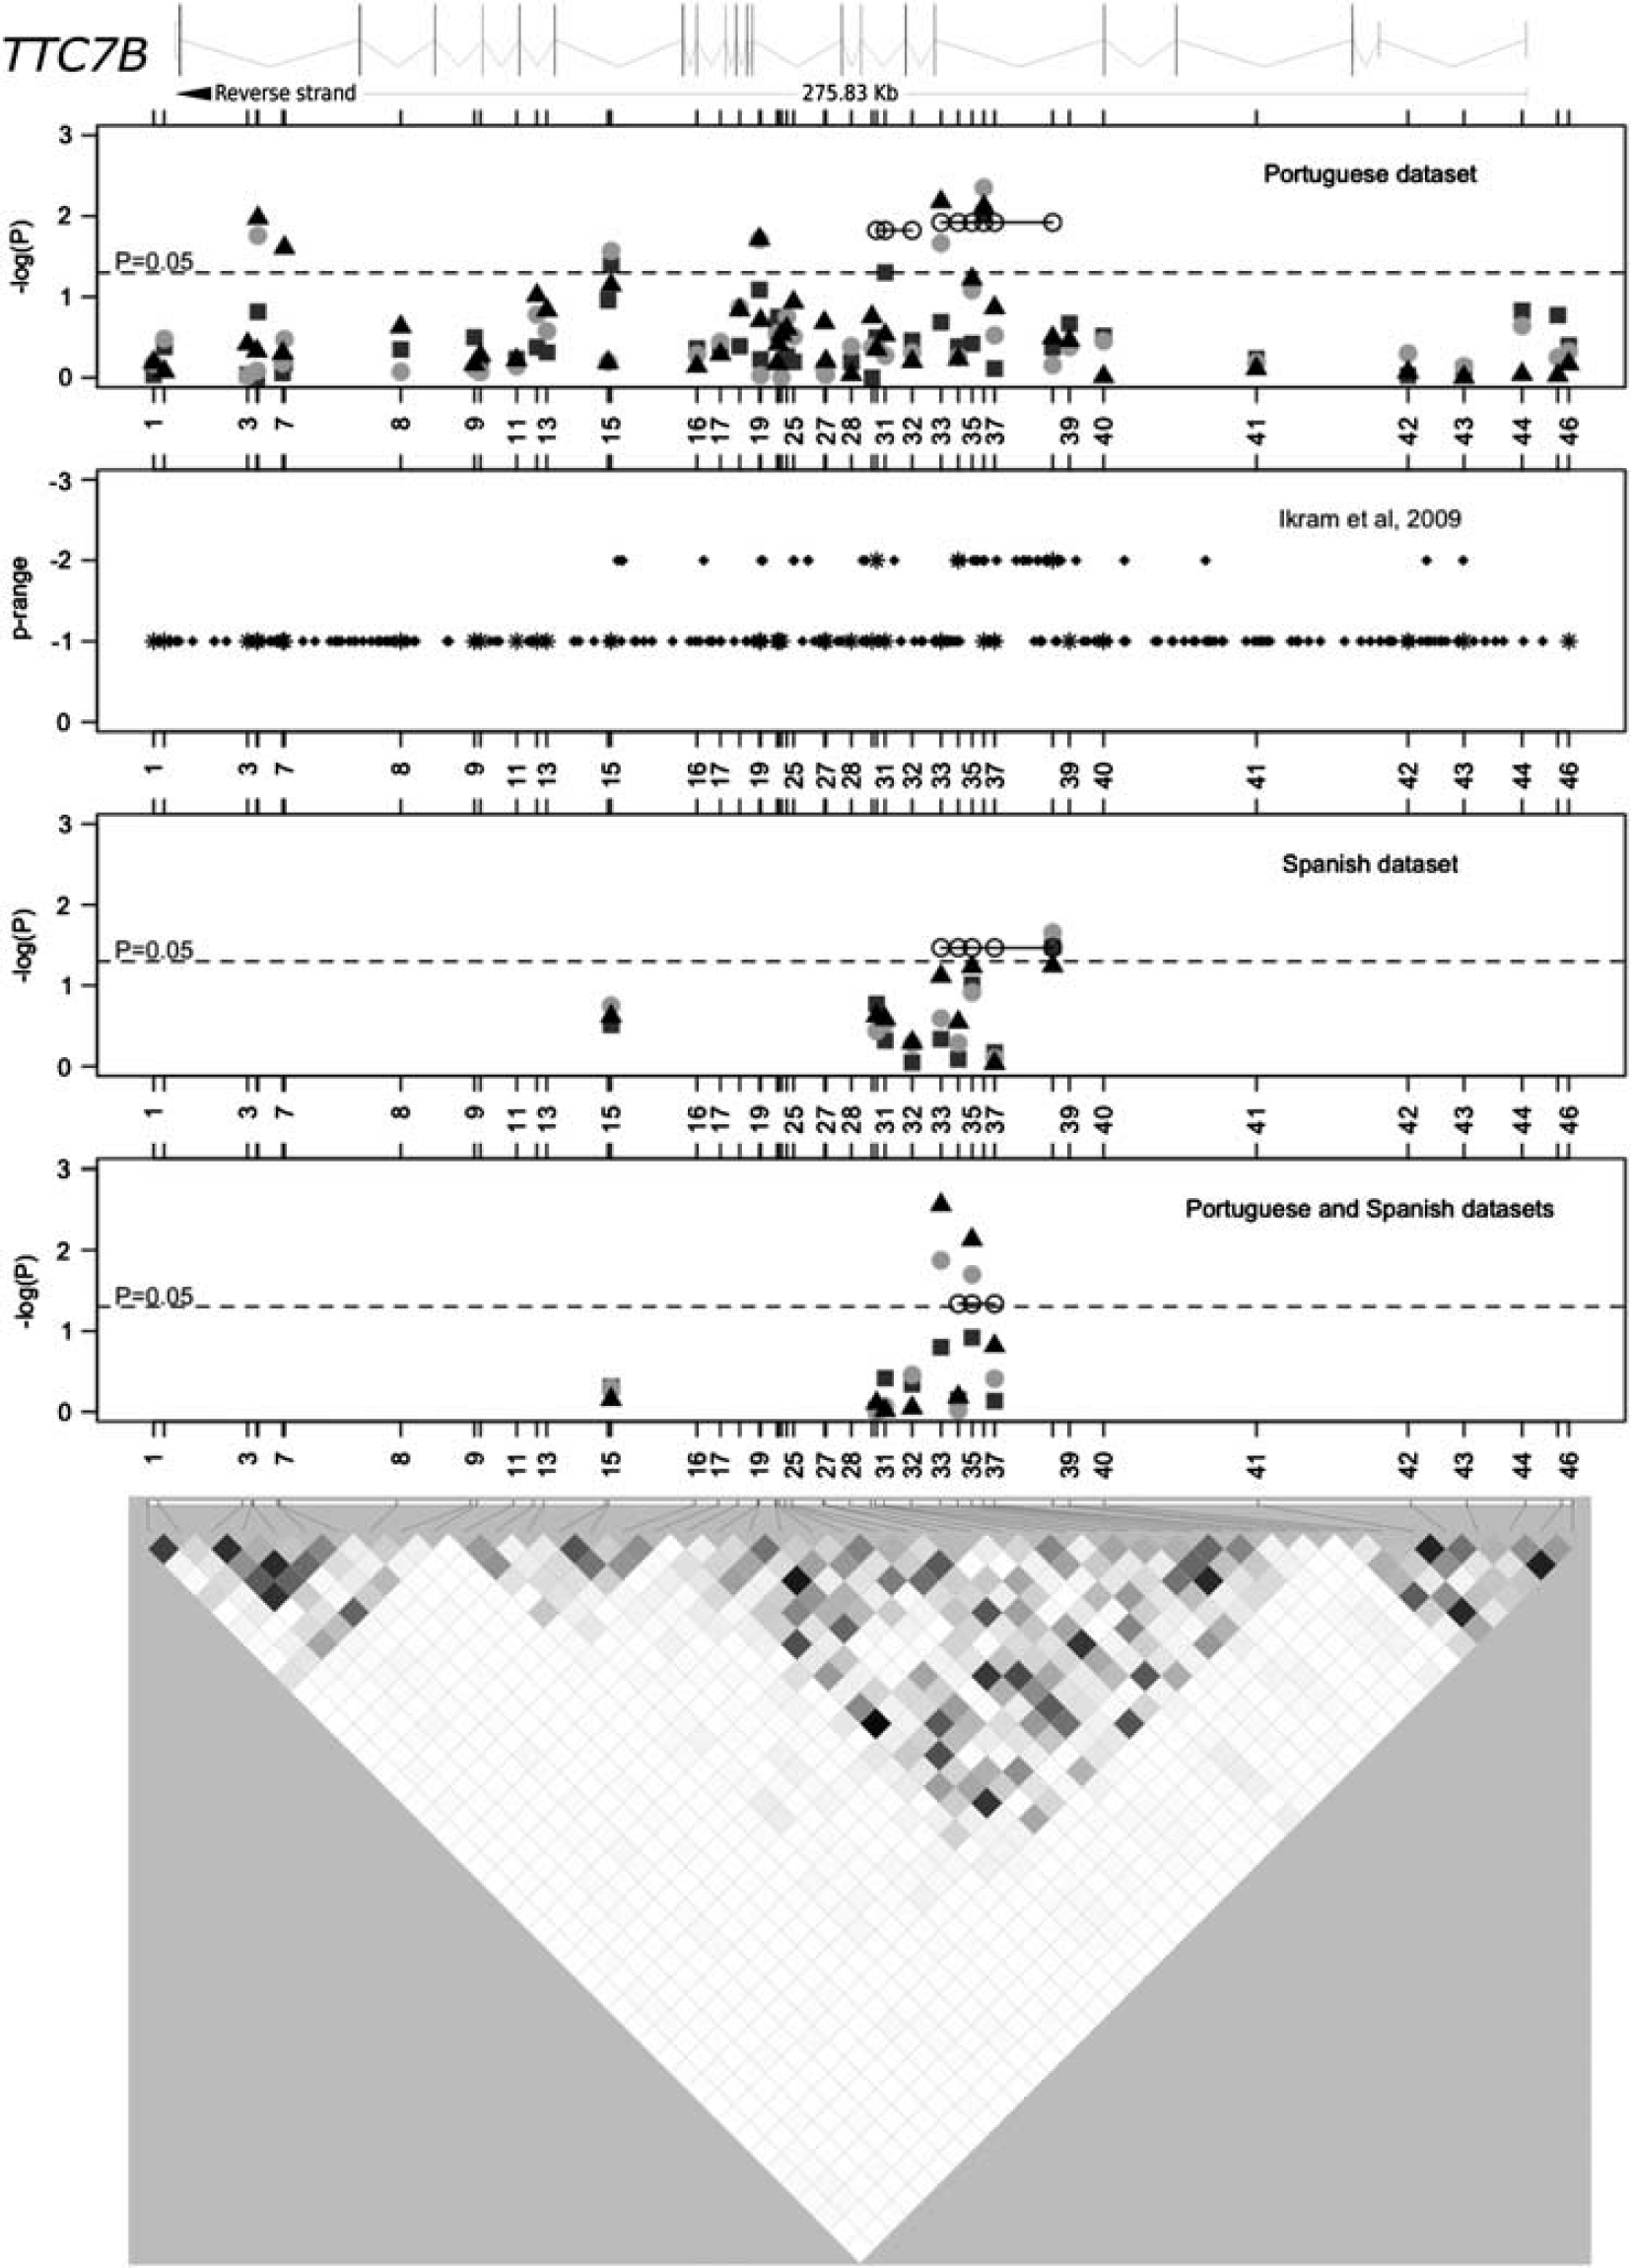
Association results and pairwise linkage disequilibrium (LD) among all genotyped polymorphisms for TTC7B. The top diagram schematically represents the introns and exons of the TTC7B gene (ENST00000357056 transcript) relative to the genotyped polymorphisms. The first, third, and fourth plots display the association results in the Portuguese, Spanish, and combined data sets, respectively. Allelic (gray squares), crude (light gray discs), and adjusted (black triangles) genotypic (recessive model) association results are shown. The second plot depicts the association (‘P range’) of all single-nucleotide polymorphisms (SNPs) in this region that were studied in the Ikram et al (2009) genome-wide association study (GWAS). Stars in this second plot indicate polymorphisms that were investigated in the Portuguese sample. The LD plot at the bottom represents the LD between genotyped SNPs in the Portuguese data set, with white-to-black gradient shading proportional to the magnitude of LD using the pairwise statistic r2.
We analyzed 259 polymorphisms investigated in the IS GWAS conducted by Ikram et al (2009) that were identified in the TTC7B gene region (second plot in Figure 2). There was a modest association (‘P range=−2’ in Ikram et al, 2009) of 42 SNPs localized between SNPs 15 and 43, with a higher density (24 SNPs) between SNPs 33 and 40. The region of increased association between SNPs 15 and 43 showed increased LD (Figure 2) and mapped to the central region of the TTC7B locus in both the Portuguese data set and the multinational data set of Ikram et al (2009).
TTC7B Replication Study and Combined Analysis
Since our association findings did not withstand the conservative Bonferroni's multiple testing correction, we performed a replication study in an independent Spanish sample. Single-nucleotide polymorphisms associated individually (SNPs 15, 19, 31, 33, and 36) and/or defining an associated haplotype (SNPs 30–38) were assayed in the Spanish data set. Single-nucleotide polymorphisms 19 and 36 failed quality controls and could not be tested. Gender, hypertension, diabetes, dyslipidemic status, and cigarette smoking were observed at significantly different frequencies between the 570 Spanish IS cases and the 390 Spanish controls (Supplementary Table 7). Since the gender and cigarette smoking were correlated (correlation factor near 0.5), the covariates in the adjusted analyses in this data set were hypertension, diabetes, cigarette smoking, and dyslipidemic status. The Spanish cases were classified according to the Trial of Org 10172 in Acute Stroke Treatment subtype classification system; 38.5% were cardioembolic, 30.5% were atherothrombotic, 30.8% were lacunar, and 0.2% were undetermined. Single-nucleotide polymorphism 38 was significantly associated with IS risk in allelic (P=0.033, OR (95% CI)=0.73 (0.56–0.96)) and unadjusted genotype (P=0.022, OR (95% CI)=0.31 (0.11–0.89)) tests, and was marginally associated in the adjusted genotype test (P=0.057) (third plot in Figure 2). The CATTG haplotype, defined by SNPs 33_34_35_37_38, was also associated with IS (P=0.034; third plot in Figure 2). Single-nucleotide polymorphism 15 was associated with atherothrombotic IS in all tests performed (0.007<P<0.033).
A joint analysis of the Portuguese and Spanish data sets (fourth plot in Figure 2) strengthened the previous findings. Single-nucleotide polymorphism 38 was out of Hardy–Weinberg equilibrium in the combined controls (P=0.010) and was not tested further. Single-nucleotide polymorphisms 33 and 35 were associated with IS in the unadjusted (P=0.013 and P=0.020, respectively) and adjusted (P=0.003 and P=0.007, respectively) recessive models; the ACT (base pairs in the SNPs 34_35_37 haplotype that is associated with ischemic stroke) haplotype, defined by SNPs 34_35_37, was also associated (P=0.046).
Discussion
With the ultimate goal of uncovering novel genetic risk factors for IS, we converged the results of several genome-wide approaches (an expression study, whole-genome linkage studies, GWAS) to identify high-priority genes for further analyses. Whole-genome strategies have the tremendous advantage of being unbiased by preconceived etiopathogenic models of disease; however, they typically generate an overwhelming amount of information and the top hits are not necessarily the only interesting leads to follow-up. By intersecting the findings of multiple studies, we compiled several independent lines of evidence supporting the involvement of a gene in the disease pathogenesis. This study demonstrated an altered gene expression profile in PBMCs of IS patients sampled at least 6 months after their first and only stroke episode, relative to controls. We found that TTC7B was overexpressed in PBMCs of IS cases, and SNPs and haplotypes located in the intron 5 through intron 6 region of TTC7B were associated with IS in multiple independent data sets.
The first convergence factor in the present report was an mRNA expression profile of PBMCs of age- and sex-matched cases and controls. The underlying hypothesis was that genes that were differentially expressed in a pertinent tissue were likely to be involved in the disease process. Blood constitutes a clinically relevant tissue since it is readily accessible. Additionally, it is biologically relevant for stroke since the complex immune and homeostatic responses to the vascular injury that cause the stroke event are likely to be reflected in the expression profiles of circulating PBMCs (Sharp et al, 2011). It is important to note that the some of the published whole-genome expression studies conducted for stroke in humans (Moore et al, 2005a, 2005b), in animals (Tang et al, 2001), and the current study were performed on PBMCs, while most of the other published studies have been performed on whole blood (Tang et al, 2006; Zhan et al, 2010; Barr et al, 2010) using PAXgene tubes and at times Nugen amplification methods. The use of PBMCs rather than whole blood has the advantage of increased detection sensitivity due to the very high levels of globin mRNA in erythrocytes, which represent ∼95% of all blood cells.
Previous studies analyzed the expression profiles from PBMCs collected during the acute or convalescent phases of IS to understand the cascade of events precipitated by a stroke and its recovery (Moore et al, 2005a, 2005b; Tang et al, 2006; Larson et al, 2007). Here, we searched for genetic factors that predispose individuals to IS, and therefore our cases were sampled at least 6 months after the first and only IS. Several studies suggest that neurological and functional recovery after stroke, even in patients with severe and very severy strokes, reaches a plateau after 6 months (Jørgensen et al, 1995; Toschke et al, 2010). Six months was therefore estimated to be a sufficient time window to allow the PBMCs to return to their ‘resting’ expression profiles. One drawback of this strategy is that the expression of genes that render patients more prone to stroke may be normalized by the use of secondary prevention drugs, such as antiplatelet agents and statins.
Hierarchical clustering and principal component analyses (Figure 1; Supplementary Figure, respectively) showed a very good separation between cases and controls, based on differentially expressed genes. After a sensitivity analysis, we selected genes for follow-up studies based on a low threshold 1.2-fold change, which was deemed to be appropriate for a late-onset disease such as stroke, where small changes in expression over a long period of time are expected to result in the phenotype. Some of the differentially expressed genes (e.g., SELP, F13A1, and TUBB1) were previously tested and found associated with stroke in candidate gene association studies (Zee et al, 2004; Pruissen et al, 2008; Navarro-Núñez et al, 2007). Conversely, some highly investigated stroke susceptibility genes such as PDE4D and ALOX5AP (Domingues-Montanari et al, 2010a), which were originally associated with stroke after linkage studies and fine-mapping, and genes that associated with stroke in GWAS such as NINJ2 (Ikram et al, 2009), were not differentially expressed. One limitation of this type of expression profiling study is that, although differentially expressed genes may constitute good indicators of affection status and downstream disease mechanisms, they are not necessarily susceptibility genes that directly account for the initial phenotype under investigation. One strategy to address this issue is to study pathways that are significantly overrepresented among the list of differentially expressed genes. The alternative route proposed here is to prioritize differentially expressed genes by converging the expression profiling results with those from published linkage screens and GWAS.
The gene TTC7B emerged from our study using this approach. It was subsequently tested in detail for association with IS in Iberian data sets. Polymorphisms in this gene were found to be associated with IS in Portuguese, Spanish, and the combined samples. Population stratification in these data sets does not appear to be of major concern since the mitochondrial haplogroup distribution was similar in Portuguese cases and controls (Rosa et al, 2008), and the samples from the Spanish data set originated from one hospital in Barcelona. Furthermore, since population structure was corrected for in the TTC7B associations identified in the GWAS (Ikram et al, 2009; Larson et al, 2007), it is unlikely that the consistent TTC7B associations are false positives caused by stratification.
Even though our results did not retain significance following the conservative Bonferroni's correction for multiple testing, our association findings were strengthened by validation in multiple independent data sets. The recurrent nonreplication of genome-wide significant association findings in the stroke genetics field (ISGC and WTCCC2, 2010) suggests that there may be false positives, and that association results below the genome-wide significance level must be evaluated cautiously if they have not been replicated; corroboration of results in other studies may lead to more reproducible conclusions. For example, several of the most significant findings in the only IS GWAS that attained no genome-wide significant results have been replicated (Domingues-Montanari et al, 2010b; Ding et al, 2010). We therefore consider that the modest association of TTC7B with IS (Ikram et al, 2009) and its association with major CVD (P=5.23 × 10⁻⁵) (Larson et al, 2007) reinforce our findings in the Portuguese and Spanish samples. Even though the allele frequencies of SNPs that were associated with IS individually or as part of a haplotype in the joint analysis of the Portuguese and Spanish data set (33, 34, 35, and 37) vary appreciably across populations (http://www.ncbi.nlm.nih.gov/projects/SNP/), these SNPs are polymorphic in all tested HapMap populations of European, Asian, and African ancestries, suggesting that our positive association findings may be tested in other races.
Although the association signals clustered to the central region of the gene, no single SNP or haplotype in TTC7B emerged as consistently associated in all data sets; thus, the true susceptibility variant(s) in this gene remains elusive. The observed heterogeneity of the nominally associated SNPs in TTC7B highlights the need for a more detailed study of this gene, possibly involving the investigation of other types of genetic markers (e.g., insertion/deletion and copy number variations) or less common non-tagging variants using next-generation sequencing.
TTC7B is a member of the TPR (tetratricopeptide repeat) gene family. Tetratricopeptide repeats consist of tandem arrays of highly degenerate 34-amino acid repeats that are predicted to form extended superhelical arrangements. These TPR domains function as protein–protein interaction modules for macromolecular complexes involved in numerous cellular processes, including transcriptional regulation, mRNA processing, protein folding, and translocation (Krachler et al, 2010). However, there are no reports to date on the function of TTC7B.
Future work must be directed toward replicating these findings in other stroke samples as well as in other related vascular phenotypes. Additionally, studies should focus on elucidating the biochemical functions of TTC7B and functional consequences of its associated polymorphisms.
Footnotes
Acknowledgements
The authors are deeply grateful to all study participants, to the Affymetrix Core Facility and genotyping unit at the Instituto Gulbenkian de Ciência, and to the neurologists and nurses of the Stroke and Laboratory Units of Vall d'Hebron Hospital for their contributions. The Neurovascular Research Laboratory takes part in the Spanish stroke genetics consortium (GeneStroke), the international stroke genetics consortium (ISGC), and in the Spanish stroke research network (RENEVAS RD06/0026/0010).
Disclosure/conflict of interest
The authors declare no conflict of interest.
References
Supplementary Material
Please find the following supplemental material available below.
For Open Access articles published under a Creative Commons License, all supplemental material carries the same license as the article it is associated with.
For non-Open Access articles published, all supplemental material carries a non-exclusive license, and permission requests for re-use of supplemental material or any part of supplemental material shall be sent directly to the copyright owner as specified in the copyright notice associated with the article.