
Abstract
Drug delivery to the brain is influenced by the blood–brain barrier (BBB) and blood–tumor barrier (BTB) to an extent that is still debated in neuro-oncology. In this paper, we studied the delivery across the BTB and the BBB of compounds with different molecular sizes in normal and glioma-bearing rats. Studies were performed at baseline as well as after an osmotic BBB disruption (BBBD) using dynamic contrast-enhanced magnetic resonance imaging and two T1, contrast agents (CAs), Magnevist (743 Da) and Gadomer (17,000 Da). More specifically, we determined the time window for the BBB permeability, the distribution and we calculated the brain exposure to the CAs. A different pattern of accumulation and distribution at baseline as well as after a BBBD procedure was observed for both agents, which is consistent with their different molecular size and weight. Baseline tumor exposure was threefold higher for Magnevist compared with Gadomer, whereas postBBBD tumor exposure was twofold higher for Magnevist. Our study clearly showed that the time window and the extent of delivery across the intact, as well as permeabilized BTB and BBB are influenced by drug size.
Keywords
INTRODUCTION
Grade 4 astrocytomas, or glioblastoma (GBM), are the most frequent and aggressive primary brain tumors. In the last decades, the outcome of GBM patients has been only slightly improved, from 12.1 to 14.6 months, with the current standard of care. 1 Since the report by Stupp et al detailing this increase in median survival, every attempt at improving on these results with new drugs administered systemically via standard routes has failed. Invasion of surrounding brain parenchyma by glioma cells eliminates the possibility of complete surgical resection such that adjuvant therapies are required. Unfortunately, glioma cells become resistant to such that recurrence is inevitable. Thus, other lines of treatment need to be developed, but few of these second and third lines of treatment have been effective. 2 An additional limiting factor is the presence of the blood–brain barrier (BBB) that prevents chemotherapeutics from reaching infiltrated glioma cells, especially those that have migrated away from the brain-tumor barrier (BTB). Only small lipid-soluble cationic molecules with a molecular weight of lower than 400 Da that are not substrates of the ABC transporters can cross the normal BBB.
The situation is different within the tumor itself, as newly formed blood vessels are characterized by an incompetent BBB and elevated BTB permeability that enable the detection of tumors by contrast-enhanced computed tomography and magnetic resonance imaging (MRI). The BTB is highly heterogeneous and its permeability depends on the tumor type and size.3,4 Permeability of the BTB to contrast agents (CAs) should not be considered as a free access to the brain for all drugs, as was so clearly showed by Lockman et al. 5
Many approaches have been developed to deliver drugs across the BBB to maximize drug concentration to the tumor cells. One such strategy is the osmotic BBB disruption (BBBD) consisting in an intraarterial infusion of a hyperosmolar solution (mannitol 25%) that produces a transient increase in BBB permeability via the shrinkage of the endothelial cells leading to the reversible opening of the tight junctions. The BBBD process has been largely characterized in preclinical and clinical studies.6–11 It is now used in the clinic regularly in some clinical centers with a demonstrated safety profile, and clear evidence of a therapeutic value. 12 The procedure has been shown to increase the survival of newly diagnosed GBM patients, with a median survival of 32.2 months. 10 One major weakness of this therapeutic strategy remains the intersubject variability in the BBB permeability; this is accompanied by an inherent difficulty in predicting and evaluating the extent of this permeability. 13 The extent of BBBD in preclinical studies has traditionally been studied with ex vivo brain samples using an Evan's blue staining technique, and consequently do not allow the follow-up of the animals.13–17 Few studies have looked at the dynamic process of the BBBD, and the methodology used in these experiments typically required harvesting brain specimens at each time point, thereby preventing a longitudinal observation in a single subject.18,19 We have recently developed a new technique allowing the longitudinal in vivo study of the BBBD process by dynamic MRI. 11 In that report, we characterized the BBBD dynamic process for a small molecular weight MRI CA (Magnevist, 743 Da), in a healthy rat model. We showed that the BBB is permeable to Magnevist from the first minute up to 30 minutes after the mannitol infusion. Moreover, the Magnevist distribution through brain after BBBD seems to be mediated by two mechanisms: extravasation in the extravascular space immediately after the BBBD followed by diffusion in the interstitial compartment. The size of the injected drug determines the extent of its delivery across the permeabilized BBB.8,19 Prior studies applied different methodologies and drug dosing, making a quantitative comparison of the gain afforded by the BBBD strategy difficult. Dynamic contrast enhanced-MRI (DCE-MRI) allows for a noninvasive and quantitative characterization of drug delivery, accumulation, and distribution in the brain. Using DCE-MRI, we undertook the current study with two complementary goals: (1) to characterize the dynamic BBBD process (therapeutic permeability window and distribution) in healthy Wistar rats for a larger molecule, Gadomer (17,000 Da) and (2) to quantitate the increase in exposure to these two CAs after a BBBD procedure in the tumor and surrounding brain parenchyma in Fischer-F98 glioma-bearing animals.
MATERIALS AND METHODS
All animal experiments were approved by the Université de Sherbrooke ethical committee for animal research and performed in accordance with institutional and Canadian council on Animal Care in Science guidelines. Those guidelines are based on the three R's principle of Russel and Burch and with the addition of a fourth R: respect (physical and psychological animal welfare). In all, 83 healthy Wistar male rats weighing 225 to 75 g and 15 male Fischer rats (225 to 50 g) were obtained from Charles River, St-Constant, QC, Canada. The animals were housed in a pathogen-free room, with one to three companions per cage, 12-hour/12-hour dark/light cycle, food (rodent #5075; Charles River) and water ad libitum. Animals were observed twice every day to ensure animal welfare. At the end of the experiments, animals were euthanized by CO2 inhalation under general anesthesia.
Dynamic Contrast Enhanced-Magnetic Resonance Imaging
Dynamic contrast enhanced-magnetic resonance imaging experiments were performed at the Centre d'imagerie moléculaire de Sherbrooke (CIMS) with a 7-T small animal MRI scanner (Varian Inc., Palo Alto, CA, USA) as previously described. 11
A single intravenous bolus injection of the T1 CA, mimicking antineoplastic agents, Magnevist (<1 nm, 743 Da, charge −2 in solution) or Gadomer (5 to 6 nm, 17 kDa, apparent molecular weight 30 to 35 kDa, charge −2 in solution) was administered (143 mmol/L, 500 μL over 50 seconds) 3 minutes after the beginning of the dynamic acquisition in BTB baseline measurement scans, 3 minutes after the BBBD procedure in the experimental scans, except for the characterization of the permeability window experiments where the delay between BBBD and CA injection was varied.20–24
The BBBD procedure was performed at day 10 after implantation for tumor-bearing animals (F98-Fischer rats). To evaluate CA delivery related to baseline BTB permeability in the analysis of the BBBD efficacy in glioma-bearing rats, an initial scan was performed using the same MRI parameters previously described, and the clearance interval of the CAs was determined. On the basis of these findings, the interval between successive imaging sessions differed for each CA: the interval was 12 hours for Gadomer experiments and 4 hours for Magnevist. Comparison of the initial scan with the postBBBD scan allowed a strict evaluation of the change in concentration that can be attributed to the BBBD procedure. The MRI signal was calibrated in terms of the concentration expressed in mmol/L of the CA and determined using a preprocedure T1 map.25,26 We had previously determined the relaxivity of the CAs in a saline solution using the 7-T small animal MRI scanner, which were 3.6 and 8.74/(mMs) for Magnevist and Gadomer, respectively. The contrast agent concentration calculations were validated by supplementary experiments. Inductively coupled plasma mass spectrometry was used to quantify post mortem the gadolinium content in each brain hemisphere of animals subjected to a BBBD procedure and DCE-MRI scan (Supplementary data).
Cell Culture
F98 malignant astrocytoma cells were cultured in Dulbecco's modified Eagle medium (DMEM) (Wisent, St-Bruno, QC, Canada), supplemented with 10% fetal bovine serum (Wisent) and 1% penicillin/streptomycin (Wisent). The cells were incubated at 37°C and 5% CO2, grown in 75 cm2 flasks (Sarstedt, Montreal, QC, Canada) and passaged every 2 days.
Animal Implantation Technique
Fifteen male Fischer rats (225 to 250 g) were acquired from Charles-River Laboratories and kept under standard conditions (12 hours day-night rhythm, unlimited access to water and food). The implantation technique of the F98-Fischer model was performed as described previously.12,27 Briefly, animals were put under general anesthesia by an intraperitoneal injection of a mixture of ketamine (83 mg/mL) and xylazine (17 mg/mL) at a dose of 100 mg/kg and were adequately positioned on a stereotaxic frame. Injection of 5 μL of a solution containing the F98 cell suspension (2 × 10 6 cells/mL) in DMEM with 1% penicillin/streptomycin was performed in the right caudate nucleus at the following coordinates: 1 mm anterior to the bregma, 3 mm lateral to the right of the midline, and a depth of 6 mm from the outer table of the skull. The cell suspension was infused at 1 μL/min. Bone wax was then applied to the burr hole and the scalp was closed.
Blood–Brain Barrier Disruption Procedure
The procedures were standardized as described in Blanchette et al.11,28 Briefly, animals were put under general anesthesia with 5% isoflurane in oxygen and maintained at 2% isoflurane in oxygen (2 L/min) and then perfused intravenously with a propofol infusion (3.9 mg/kg per hour) via the tail vein. Another caudal intravenous catheter was installed to allow the CA injection. Isoflurane was discontinued 10 minutes after the initiation of the propofol infusion. Animals were then intubated and the right carotid complex was surgically exposed using aseptic technique. The right external carotid was isolated and catheterized in a retrograde manner with PE50 polypropylene tubing filled with mannitol. All surgical procedures were performed on a warm pad to prevent hypothermia. Once the catheter was secured in place, a subcutaneous injection of atropine (0.04 mg/kg) was performed to prevent bradycardia induced by the BBBD procedure. The animals were then inserted in the 7T MRI scanner. The MRI dynamic acquisition was started and the propofol infusion was stopped 3 minutes later. One minute after discontinuation of propofol, 4.2 mL of a 25% mannitol solution was infused at a rate of 0.14 mL/s. Propofol infusion was resumed 30 seconds after the end of the mannitol infusion.
Study Groups
Characterization of the blood–brain barrier disruption permeability window for Gadomer in healthy animals. Eighty-three healthy Wistar male rats weighing 225 to 275 g were randomly distributed in two groups to study the Gadomer permeability window after a BBBD procedure. Animals in group 1 were sorted in subgroups corresponding to the delay between BBBD and the injection of Gadomer: at 1 (n = 8), 2 (n = 7), 3 (n = 27), 5 (n = 4), 7 (n = 3), 10 (n = 6), 15 (n = 6), 20 (n = 4), and 30 (n = 2) minutes. Group 2 (control group) was divided into six subgroups in which Gadomer was administered at 1 (n = 3), 3 (n = 3), 5 (n = 3), 7 (n = 4), 10(n = 1), and 20 (n = 2) minutes after sham BBBD, where mannitol was replaced by saline.
Gadomer distribution within the brain parenchyma. Seven healthy Wistar rats from the permeability window group that were injected with Gadomer at the 3-minute delay time point were studied to assess the extent of the CA penetration after BBBD.
Role of the baseline blood–brain barrier and blood–tumor barrier in impeding drug delivery in F98 glioma-bearing rats. We studied the initial preBBBD scans in the 15 F98-Fischer glioma-bearing animals. The MRI signal was calibrated in terms of the concentration expressed in mmol/L. Exposure of the tumor, ipsilateral (ipsi), and contralateral (contra) hemispheres to the CAs was computed for the first 30 minutes after their administration and expressed in mM.min.
Quantitation of tumor, peritumoral, and contralateral brain exposure to Magnevist and Gadomer, in glioma-bearing rats after blood–brain barrier disruption. Fifteen F98-Fischer male rats weighing 225 to 250 g were randomly distributed in four groups (two experimental and two control groups). Group 1 represented BBBD followed by an intravenous Magnevist injection (n = 4), whereas group 2 represented BBBD followed by an intravenous Gadomer injection (n = 5). The control groups were as follows: in group 3, animals received a saline infusion instead of mannitol (sham BBBD) followed by an intravenous Magnevist injection (n = 3) whereas the same substitution was effected for group 4 (sham BBBD) which was followed by an intravenous Gadomer injection (n = 3).
Statistical Analysis
Prism 5 software (GraphPad Software Inc., La Jolla, CA, USA) was used to perform statistical analysis. The results are expressed as mean ± standard error of the mean (s.e.m.). Interindividual differences in the extent of BBBD are high; consequently, statistical differences were evaluated using the Mann-Whitney test with P≤0.05.
RESULTS
Characterization of the Dynamic blood–brain barrier disruption Process in Healthy Animals with Gadomer
Figures 1A and 1B displays representative Tq-weighted MRI images prior (A), and 17 minutes after (B) a BBBD procedure and Gadomer infusion. Gadomer was infused 3 minutes after BBBD and its accumulation over 15 minutes was analyzed. Gadomer accumulation in the extravascular space produced a signal enhancement that can be observed within the brain parenchyma of the treated hemisphere in the subtraction, color-coded image (Figure 1C). Higher signal intensity is systematically observed within the cortex and the basal ganglia, paralleling the higher vascularization density in these anatomic areas.
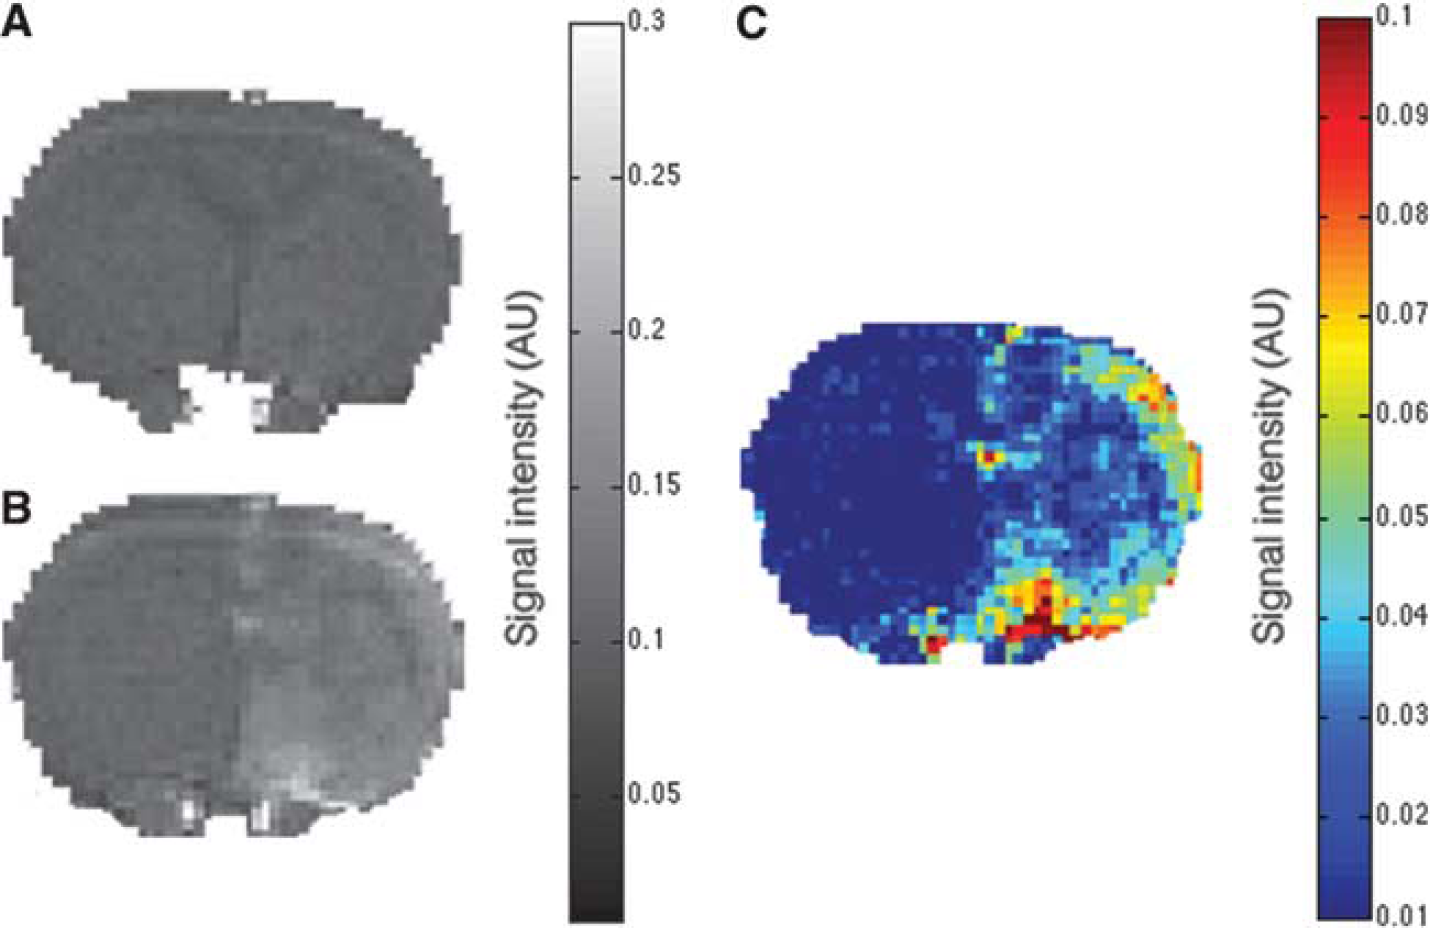
The blood–brain barrier permeability to Gadomer is enhanced immediately after a blood–brain barrier (BBB) disruption (BBBD) procedure. Representative axial magnetic resonance imaging (MRI) brain scans of a healthy rat lying supine in a 7-T MRI scanner before
Blood–Brain Barrier Disruption Permeability Window for Gadomer
Two groups of animals were studied to determine the time window of the BBB permeability to Gadomer: an experimental group (n = 67) in which the animals were injected with Gadomer at different time points postBBBD (injection delays: 1, 2, 3, 5, 7, 10, 15, 20, and 30 minutes) and a control group (n = 16) with sham BBBDs (injection delays: 1,3,5, 7, 10, and 20 minutes). As the BBBD process can be highly variable between animals (for discussion on this topic, see Joshi et al 13 ), a large number of animals had to be included in each subgroup for this experiment. The data shown in Figure 2 represent the peak Gadomer concentration (mmol/L) in the treated hemisphere of animals injected at a specific delay after the BBBD procedure (Table 1). We observed that the maximal accumulation of Gadomer in the treated hemisphere took place when the CA was injected 1 minute after the BBBD procedure, the earliest time point studied. The BBB permeability to Gadomer rapidly decreased thereafter. Blood–brain barrier permeability to Gadomer returned to baseline ˜30 minutes after the mannitol infusion (Figure 2).

Blood–brain barrier disruption (BBBD) therapeutic window for Gadomer in healthy Wistar rats. The empty circles correspond to the average (mean ± s.e.m.) concentration of Gadomer (mmol/L) at the peak of the concentration over time curve, within the treated hemisphere of animals, filled circles for control animals. Animals were injected at a specific delay postBBBD.
Maximal Gadomer concentration (mmol/L) within the whole treated hemisphere (mean ± s.e.m.)

Gadomer Distribution in the Brain after Blood–Brain Barrier Disruption
Seven representative animals from the permeability window experimental subgroup injected with Gadomer 3 minutes after BBBD were studied. This specific time point was chosen based on our earlier study on Magnevist to allow an adequate comparison between both CAs. 11 Figure 3A shows a 15-minute postcontrast T1-weighted image where five regions of interest (ROIs) have been selected as per our earlier report. 11 Region of interest 1 was placed in a highly vascularized subarachnoid region between the brainstem and telencephalic structures. In this area, we noticed that the signal intensity decreased immediately after mannitol infusion as the BBBD process induces a plasma leakage and edema in the perivascular space. This area subsequently displays the highest T1-weighted signal intensity increase when the CA is infused. Regions of interest 2 to 4 were located gradually away from ROI 1 marching toward the midline within the ipsilateral hemisphere, whereas ROI 5 transgressed the midline, lying at a distance in the contralateral hemisphere. The time to reach maximal signal intensity was similar for all ROIs, ˜14 minutes after the Gadomer injection (Figure 3B). The accumulation of the CA observed at the 14th minute in ROIs 1 to 4 corresponds to the extravasation of Gadomer within the extravascular space after the BBB permeabilization. The maximum accumulation in ROI 5, observed during the same interval, likely corresponds to the maximal Gadomer concentration in the vascular compartment. Indeed, the observed accumulation was much smaller than in ROIs 1 to 4 and was equivalent to Gadomer accumulation for this ROI in control animals. Contrary to Magnevist, our data suggest that Gadomer does not diffuse within the brain parenchyma. If it does, then the process appears to be exceedingly slower and of a lesser magnitude than what was observed for Magnevist, as expected from its larger size.11,22
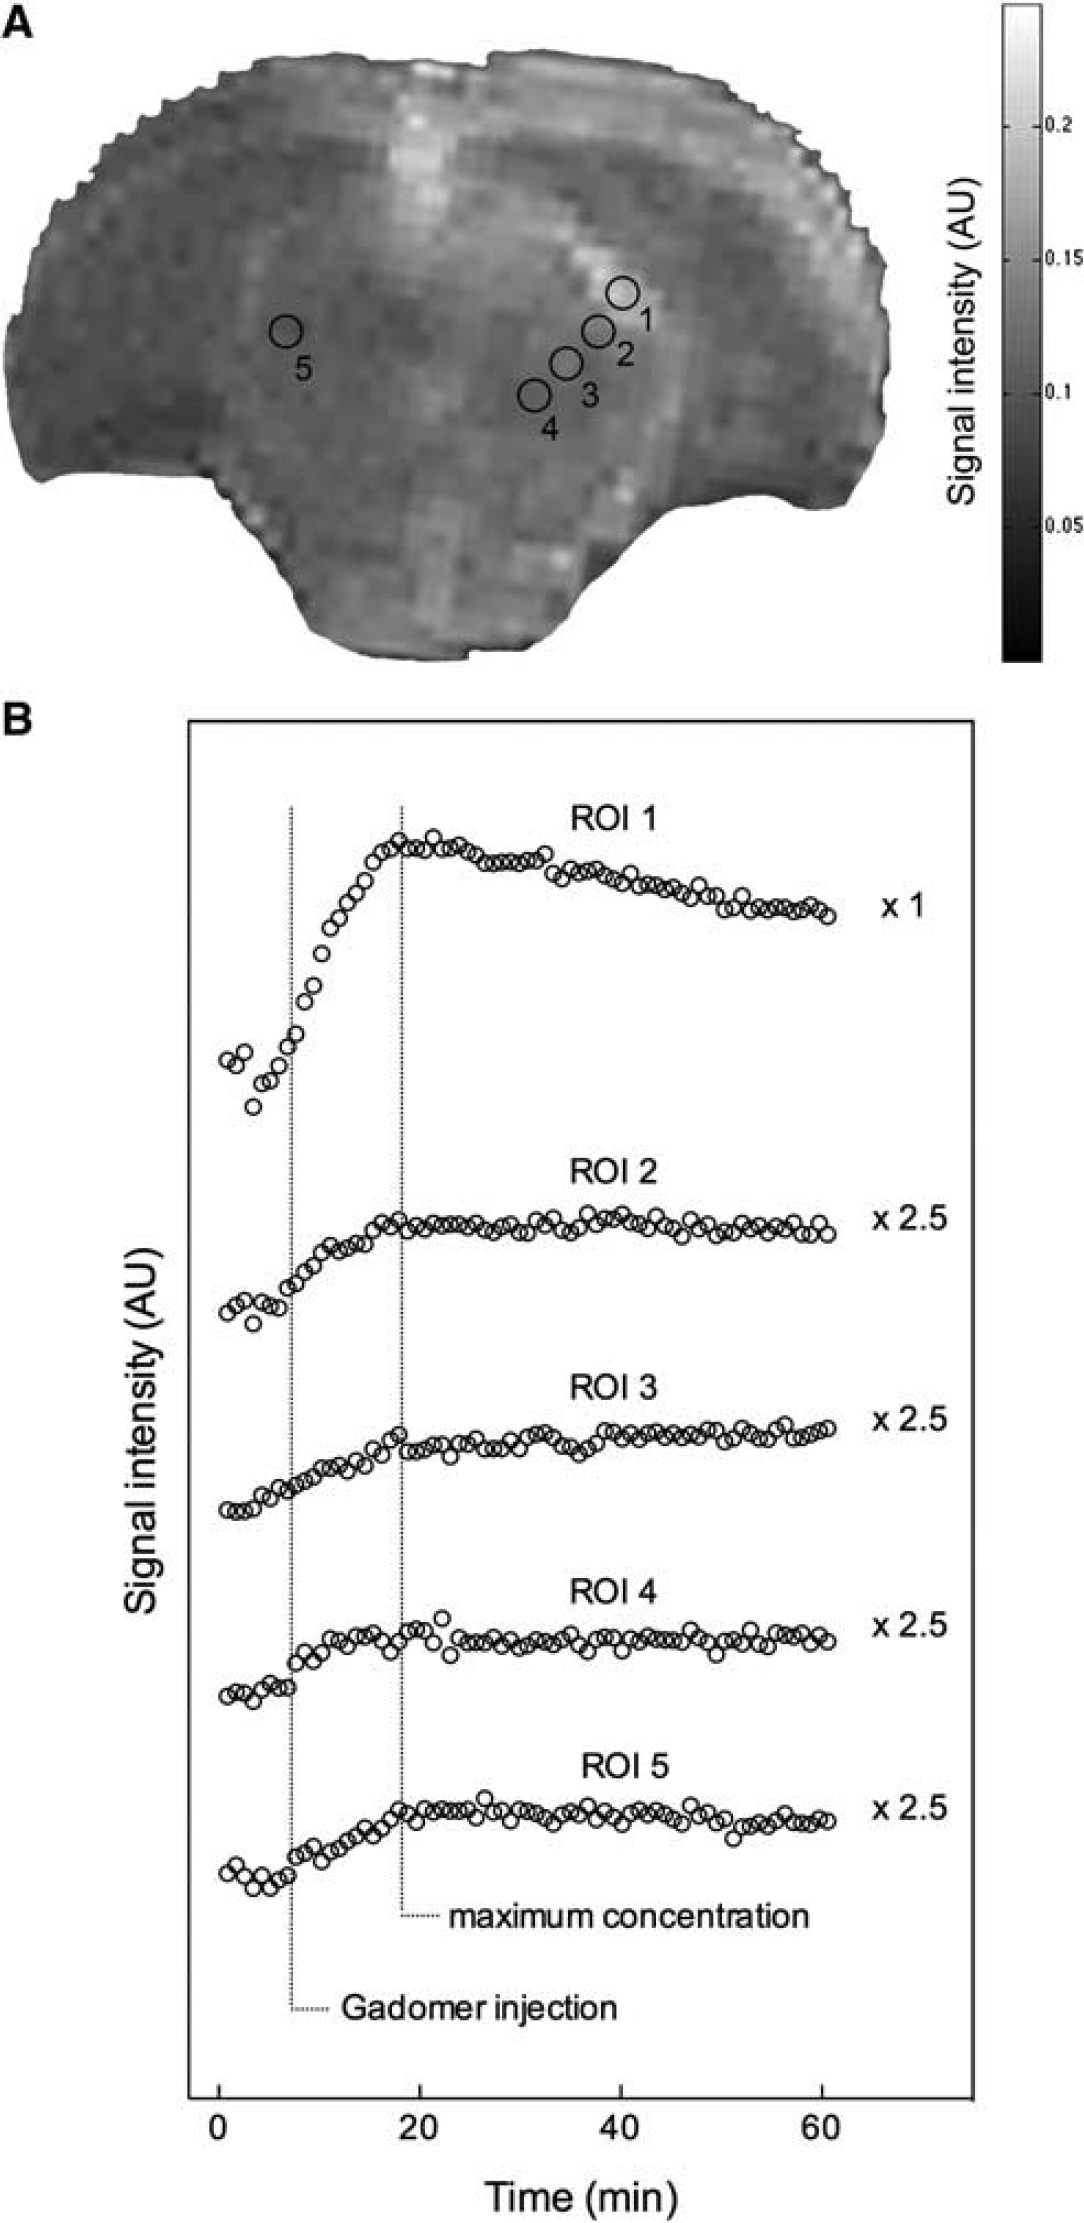
Representative T1-weighted axial magnetic resonance imaging (MRI) image 15 minutes postcontrast
Baseline Blood–Tumor Barrier and Blood–Brain Barrier Permeability in Fischer-F98 Rats
To study BTB permeability in the Fischer-F98 model, we measured baseline tumor exposure to Magnevist and Gadomer in glioma-bearing animals. Representative T1-weighted MRI images of tumor enhancement for Magnevist and Gadomer injected animals are shown in Figures 4A and 4B. Three ROIs were studied: the tumor area, the ispilateral distant parenchyma, and the contralateral hemisphere (Figure 4C). For each ROI, the exposure to the CAs was estimated for the first 30 minutes after the CAs injection (Figure 4D). Tumor exposure was significantly different for each CA, with values of 6.15 and 1.81 mM.min for Magnevist and Gadomer injected at the same dose, respectively (Mann-Whitney test, two-tailed, P = 0.0003, Magnevist n = 7, Gadomer n = 8). We did not observe a significant difference between the ipsilateral distant parenchyma and the contralateral hemisphere exposure either to Magnevist (1.05 mM.min ipsi vs. 0.85 mM.min contra, Mann-Whitney test, two-tailed, P = 0.3176) or to Gadomer (0.30 mM.min ipsi vs. 0.32 mM.min contra, Mann-Whitney test, two-tailed, P = 0.7984). Together, these observations highlight the important difference in permeability between BTB and BBB, as well as the inherent capacity of the BBB to limit the extravasation of Magnevist and Gadomer into the brain parenchyma. The data suggest that molecular weight determines the ability of a compound to extravasale through the permeabilized BBB.
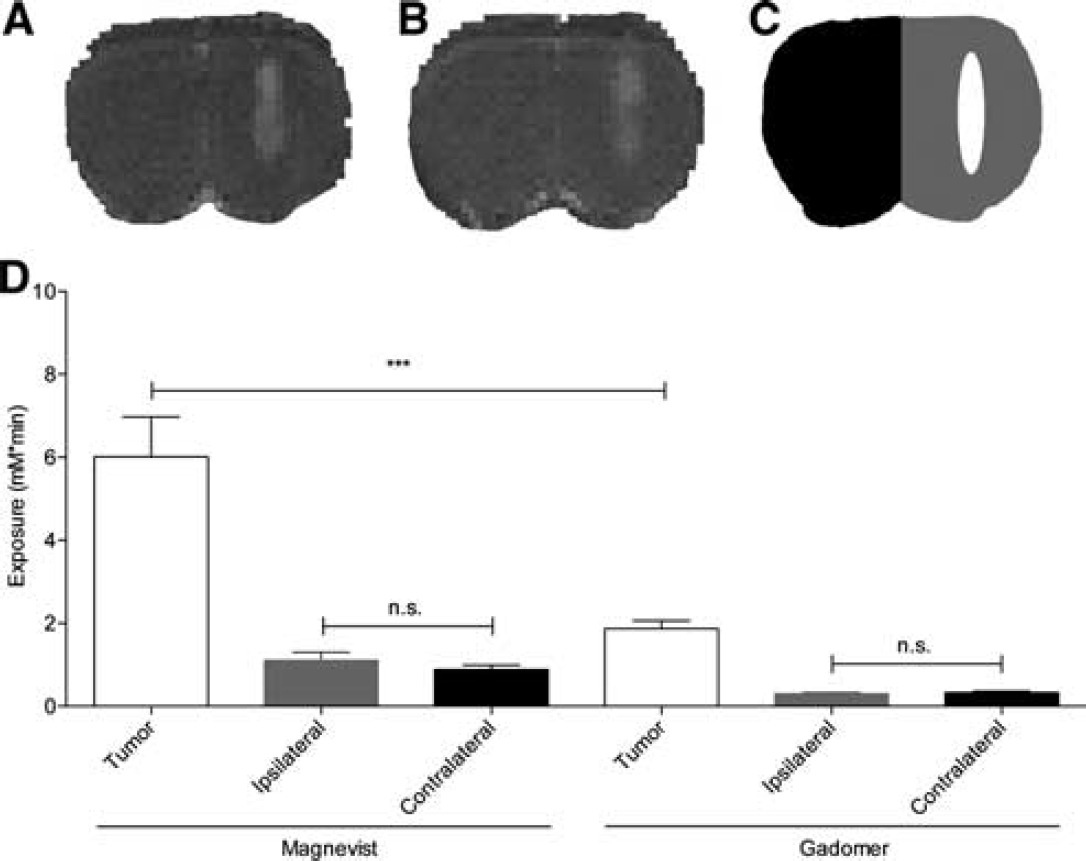
Blood–tumor barrier (BTB) and blood–brain barrier (BBB) delivery impediment showed by tumor and parenchyma exposure to Magnevist and Gadomer for 30 minutes postcontrast agent injection on the initial scan. T1-weighted image of a F98-Fischer rat 15 minutes after
Tumor and Distant Brain Parenchyma Exposure to CAs after a Blood–Brain Barrier Disruption Procedure in Glioma-Bearing Animals
The permeable neovasculature of the BTB is expected to result in some level of exposure of the tumor to a CA. We first measured this baseline permeability with a first scan performed 4 hours (Magnevist) or 12 hours (Gadomer) before the BBBD procedure. Segmentation of the ROIs was identical to those in the prior experiment (see Figure 4C) and consisted of the tumor, ipsilateral distant parenchyma, and contralateral hemisphere. Figure 5 displays the exposure to the CAs for 30 minutes after its injection performed at 3 minutes after BBBD. Baseline exposure to Magnevist (Figure 5A) and Gadomer (Figure 5B) after BBBD was not significantly different from the exposure calculated for the control groups (data not shown). Tumor exposure to Magnevist increased twofold after BBBD, from 6.32 to 12.47 mM.min (Mann-Whitney test, one-tailed, P = 0.0286), whereas it increased threefold for Gadomer, from 1.65 to 4.95 mM.min (Mann-Whitney test, one-tailed, P = 0.0179). Tumor exposure was higher to Magnevist than to Gadomer by a factor of 2, either at baseline or after BBBD.
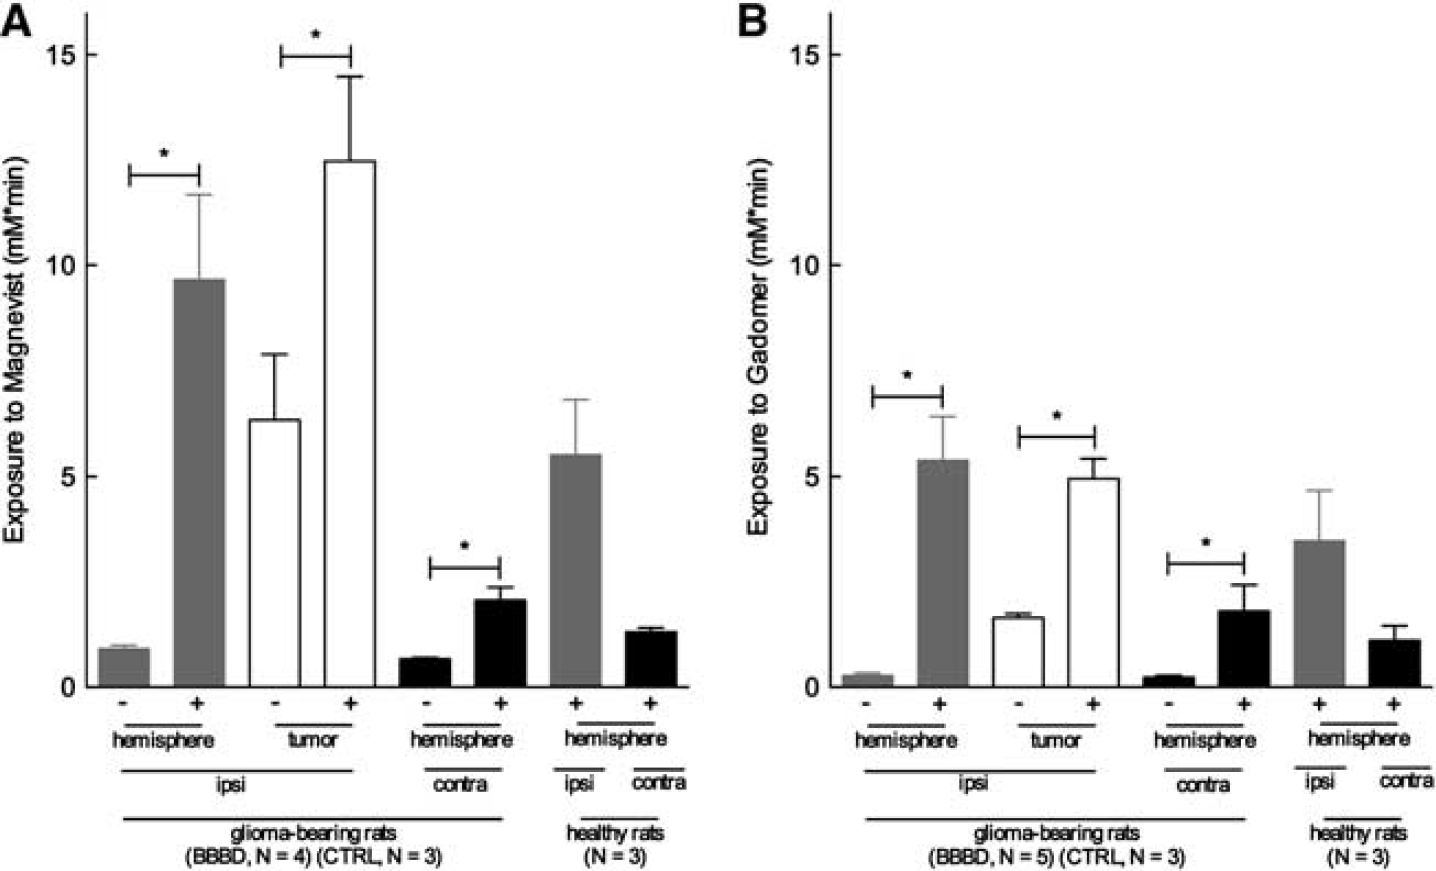
In these tumor-bearing animals, the BBBD procedure also triggered a T1-weighted contrast enhancement in the distant ipsilateral parenchyma as well as in the contralateral hemisphere for the two CAs. This increase in exposure was similar to that observed in normal animals treated with the BBBD procedure.
Interestingly, the BBBD procedure appears to produce and evenly distributed permeability of the BBB in the treated hemisphere, as tumor exposure was not significantly different from that of the ipsilateral distant parenchyma. Moreover, exposure of the permeabilized hemisphere was not significantly different between tumor-bearing animals and healthy animals for both CAs injected (Mann-Whitney test, two-tailed, P = 0.1143 and 0.2500 for Magnevist and Gadomer, respectively), implying that the presence of the tumor does not alter the BBBD process.
DISCUSSION
Numerous reports clearly showed that the BTB and the BBB drastically reduced the drug delivery to the brain parenchyma. Surprisingly, this subject is still not widely acknowledged in neuro-oncology. Even when the most efficient BBB permeabilizing technique (BBBD) is used, exposure to the injected drug is still limited. The results obtained in this study clearly show that delivery across the BTB and the BBB depends on the size of the administered compound, even after BBBD.
It was our goal to study the impact of the size and the molecular weight of CAs as surrogates for the central nervous system delivery of chemotherapy agents. To do this, we determined the permeability of the BBB to Gadomer, a CA larger than Magnevist, which we studied previously. 11 The dynamic distribution of Gadomer was different from that of Magnevist in several aspects. First, BBB permeability to Gadomer rapidly decreased in the first 5 minutes after the BBBD procedure (Figure 2). Approximately 30 minutes after the mannitol infusion, the BBB was permeable to Magnevist but not to Gadomer, thereby suggesting that the period during which a compound can cross the permeabilized BBB is determined by the molecular weight and size. This is in agreement with the hypothesis of Rapoport and Robinson 18 whereby pores are created by the BBBD, and their diameter decreases rapidly as the endothelial cells gradually rehydrate. The reported duration of the BBB permeability window varies considerably.9,11,14,29–34 These studies were performed in different species and with different reporter molecules. Our study suggests that the permeability window of the BBBD process appears modulated according to the size and the molecular weight of the compound. PostBBBD Gadomer distribution within the brain parenchyma of the treated hemisphere in normal animals appeared homogeneous (Figure 1B). Slight variations were observed depending of the brain areas surveyed due to a higher vascular density in the cortex and the deep ganglia compared with the white matter (Figures 1B and 1C). Gadomer distribution within the brain parenchyma appeared to be regulated exclusively by its extravasation immediately after mannitol infusion. As shown in Figure 3B, Gadomer accumulated in all brain areas to a maximum concentration at 14 minutes after injection, and was followed by a very low clearance rate. This is in contrast with the postBBBD Magnevist distribution process, which displayed diffusion within the extracellular space in addition to the immediate extravasation. 11 We attribute this difference in behaviour between both CAs to their difference in molecular weight and size such that the diffusion of Gadomer within the extracellular space is considerably reduced. This is consistent with prior reports linking diffusion and molecular weight.35,36
The second set of experiments consisted in assessing the exposure of the brain of F98 implanted Fischer rats to the two CAs without any manipulation of the BBB. This provided an estimate of the baseline BTB and BBB permeability to these two compounds. When studying the brain parenchyma at a distance from the tumor implantation nodule (ipsilateral and contralateral hemisphere), we found no significant baseline accumulation of either Magnevist or Gadomer. This can be appreciated in Figure 4. The exposure values calculated for both CAs in these areas indeed correspond to their presence within the vascular compartment. This is consistent with the absence of BTB away from the tumor nodule and with an intact BBB that prevented accumulation of the two compounds in the brain parenchyma. In contrast, major differences were observed in the intrinsic tumor exposure to both CAs. Baseline exposure to Magnevist was threefold higher than to Gadomer (Figure 4D). This finding implies that BTB permeability is drug dependent and varies according to the different physical characteristics of a given compound, such as molecular weight and size.
Finally, we evaluated the BBB and BTB permeability after BBBD in tumor-bearing animals. The BBBD procedure did indeed increase delivery to the tumor but also to the surrounding brain tissue. Interestingly, the extent in the increase of exposure to the two CAs generated by the BBBD was similar in the tumor-bearing animals and in the healthy animals, thereby suggesting that the presence of the lesion does not impact the efficacy of the BBBD process (Figure 5).
Our study clearly suggests a link between molecular weight and size of the administered agent in relation to the apparent size of the pores between the endothelial cells, reducing as a function of time postBBBD. Methodologies used and compound tested covered a wide array in previous BBB permeability studies. It may therefore not be surprising that results on the BBB permeability window postBBBD differed from ours.8,11,29,37–41 To eliminate confounding factors, we selected two CAs having the same charge, −2, in solution but a different weight and size to perform our study. 20 Since, other than size and molecular weight, molecular charge is also expected to have an impact on drug penetration, since the opened tight junctions are negatively charged.11,25 Together, these observations support the notion that drug delivery to the brain is modulated in a drug-size dependent manner after a BBBD procedure or at baseline.
Malignant gliomas are very aggressive tumors that remain resistant to treatment for numerous reasons. Not only do they display an aggressive infiltrative phenotype that prevents a complete resection, but they are also sheltered from the antineoplastic drugs by the BBB and the BTB. As shown in this study, the BTB is selectively permeable to drugs of different molecular weight. Clearly, the use of the BBBD procedure is potent at increasing delivery of molecules across the BTB and the BBB. However, the yield of the procedure is affected by different factors including the size of the molecule. Certain limitations in our experimental design need to be considered before drawing a parallel and extending conclusion from this work to the clinical use of the BBBD procedure. Due to limitations related to the experimental design, the CAs were administered intravenously, instead of the intraarterial route normally used for chemotherapeutics. Thereby, our results severely underestimate the delivery potential of this strategy. Moreover, our animal model does not include other treatment modalities such as radiotherapy or surgery, which can further increase the BBB permeability. Next, our experimental approach with a standardized g No ma-bearing rat model does not replicate the heterogeneity of the tumor tissue and of the neovascularization observed in the clinical situation. It is also important to keep in mind that the results may depend on the species under study.
Therefore, when considering the treatment of primary brain tumors, a thorough research effort should study the BTB, BBB permeability as well as the outcome of the BBBD process for a complete panel of cytotoxic drugs, including substrates of the efflux pumps, another factor that was not included in the present study. Investigators should also detail the brain penetration potential of drugs and correlate their brain accumulation with clinical outcome. Efforts on the use or the development of strategies for drug delivery across the BBB and the BTB should be promoted in the field of neuro-oncology.
Footnotes
References
Supplementary Material
Please find the following supplemental material available below.
For Open Access articles published under a Creative Commons License, all supplemental material carries the same license as the article it is associated with.
For non-Open Access articles published, all supplemental material carries a non-exclusive license, and permission requests for re-use of supplemental material or any part of supplemental material shall be sent directly to the copyright owner as specified in the copyright notice associated with the article.