
Abstract
13C magnetic resonance spectroscopy (MRS) combined with the administration of 13C labeled substrates uniquely allows to measure metabolic fluxes in vivo in the brain of humans and rats. The extension to mouse models may provide exclusive prospect for the investigation of models of human diseases. In the present study, the short-echo-time (TE) full-sensitivity 1H-[13C] MRS sequence combined with high magnetic field (14.1 T) and infusion of [U-13C6] glucose was used to enhance the experimental sensitivity in vivo in the mouse brain and the 13C turnover curves of glutamate C4, glutamine C4, glutamate+glutamine C3, aspartate C2, lactate C3, alanine C3, γ-aminobutyric acid C2, C3 and C4 were obtained. A one-compartment model was used to fit 13C turnover curves and resulted in values of metabolic fluxes including the tricarboxylic acid (TCA) cycle flux VTCA (1.05 ± 0.04 μmol/g per minute), the exchange flux between 2-oxoglutarate and glutamate Vx (0.48 ± 0.02 μmol/g per minute), the glutamate-glutamine exchange rate Vgln (0.20 ± 0.02 μmol/g per minute), the pyruvate dilution factor Kdil (0.82 ± 0.01), and the ratio for the lactate conversion rate and the alanine conversion rate VLac/VAla (10 ± 2). This study opens the prospect of studying transgenic mouse models of brain pathologies.
INTRODUCTION
In vivo 13 C magnetic resonance spectroscopy (MRS) in conjunction with the administration of 13 C labeled glucose provides a unique tool to assess cerebral metabolism noninvasively. For instance, following the infusion of [1- 13 C] or [1,6- 13 C2] glucose, 13 C MRS can dynamically monitor the 13 C label incorporation into desired carbon positions of MR detectable metabolites, e.g., glutamate (Glu) and glutamine (Gln). Then, cerebral metabolic fluxes can be quantitatively derived from experimentally measured 13 C-label time courses using a mathematical model.1–3
Mice have been widely used for genetic modification to investigate the pathology of respective human diseases. The use of 13 C MRS studies on transgenic mouse models may provide unique insights into the pathologies of various brain diseases. For instance, the pathogenesis of Huntington's disease may involve the impairment of glutamate-glutamine cycling 4 assessed uniquely by 13 C MRS. In vivo 13 C MRS is commonly conducted in the human 5 and rat brain. 6 However, for the mouse brain, the intrinsically low sensitivity of 13 C MRS and the small brain size render the measurement of 13 C labeling into metabolites in vivo challenging. Hence, most 13 C MRS studies in mouse brain were achieved by using brain extracts.7,8 One in vivo 13 C study in mouse brain, using direct 13 C MRS by image selected in vivo spectroscopy localization with distortionless enhancement by polarization transfer, reported time courses of C4 and C3 of Glu and Gln. 9 However, the cerebral metabolic fluxes remain to be determined.
In addition, a time-resolved isotopic enrichment of plasma glucose is typically required as an input function to derive metabolic fluxes from 13 C labeled time courses using a given metabolic model in a 13 C labeled glucose infusion study. However, frequent blood sampling in small animals such as mouse during 13 C NMR experiment is hardly feasible due to the small blood volume of the mouse and rather big dead volume in the catheter from the center of the magnet to the entrance of the magnet bore.
Relative to direct 13 C MRS techniques, indirect detection of 13 C through 1 H combined with [1,6- 13 C2] or [U- 13 C6] glucose administration can improve the sensitivity and allow the direct measurement of fractional enrichments (FEs). However, the distinct separation of 13 C labeling in Glu and Gln using indirect detection requires sufficiently high spectral resolution. 10 Recently, a short-echo-time (TE) full-sensitivity 1 H-[ 13 C] NMR sequence was proposed and validated at a high magnetic field strength of 14.1 T, which provides high spectral resolution and signal sensitivity. 11
Therefore, the aim of the present study was to use the short-TE full-sensitivity 1 H-[ 13 C] MRS 11 combined with high magnetic field (i.e., 14.1 T) and infusion of [U- 13 C6] glucose to measure the time-resolved 13 C labeling of individual metabolites with a focus on glutamate and glutamine, to assess metabolic fluxes in vivo in the mouse brain.
MATERIALS AND METHODS
Animal Preparation
Male ICR-CD mice (33.4 ± 3.7 g, n = 5, Charles River, L'Arbresle Cedex, France) were housed in standard cages, fasted over 7 hours with free access to water and anesthetized using isoflurane (1% to 2%) mixed with O2. One femoral vein was cannulated for the infusion of [U- 13 C6] glucose (Sigma-Aldrich, St. Louis, MO, USA). After giving a bolus of a 20% (w/v) 99%-enriched [U- 13 C6] glucose solution at an exponentially decaying rate over 5 minutes, a 67%-enriched [U- 13 C6] glucose solution was infused continuously for up to 3 hours.12,13 The respiration rate was continuously monitored (SA Instruments Inc., Stony Brook, NY, USA) and maintained in the range of 80 to 110 breath per minute by adjusting the amount of isoflurane in the O2 to sustain mouse under physiological condition, i.e., pH = 7.3 to 7.4, PaCO2 =30 to 42 mmHg and PaO2 > 100 mmHg (data not shown), all of which allowed sustaining normal functional activity and normal cerebral blood flow.14,15 The mouse was placed in a holder (RAPID Biomedical GmbH, Rimpar, Germany) and the head was stereotaxically fixed. Body temperature was measured by a rectal thermosensor and maintained at 36.0 ± 0.5°C with the circulation of heated water. All animal preparation procedures were performed in accordance with local and federal guidelines (EXPANIM, Expérience sur animaux-SCAV, Service de la consommation et des affaires vétérinaires, Switzerland) and were approved by the Veterinary Office of Canton de Vaud.
In Vivo NMR Spectroscopy
Magnetic resonance spectroscopy experiments were performed in a 14.1 T magnet with a 26 cm horizontal bore (Agilent Technologies, Palo Alto, CA, USA) using a homebuilt geometrically decoupled 1 H quadrature surface coil (13 mm diameter) and a linearly polarized 13 C coil (10 mm diameter) as a transceiver. Images for voxel positioning were obtained using a multislice fast spin-echo sequence in sagittal and coronal planes (effective TE = 54 ms, repetition time = 4,000 ms, echo train length = 8, average = 4, slice thickness = 0.6 mm, slices = 25, field of view = 20 × 20 mm2, data matrix = 256 × 256). 13 C decoupled 1 H MR spectra were acquired using a previously proposed full signal intensity 1H-[ 13 C] NMR sequence ‘SPECIAL-BISEP’ (Supplementary Figure S1), 11 which was a hybrid sequence composed of SPECIAL (SPin ECho, full Intensity Acquired Localized spectroscopy) localization part 16 and a preceding 13 C editing block based on the inversion B1-insensitive spectral editing pulse (BISEP), including a segmented 0o BIR-4 pulse with two pulse interval delays (τ = 1/2J) in the 1 H channel and an adiabatic full passage (AFP) in the 13 C channel centered at the central segment of the 0o BIR-4 pulse. 17 13 C editing was achieved by turning on and off the AFP pulse in the 13 C channel on alternate scans, and then the edited spectrum (i.e., 13 C AFP off– 13 C AFP on) contained 13 C coupled 1 H resonances. Outer volume suppression and water suppression with VAPOR (VAriable Pulse power and Optimized Relaxation delays) 18 were applied before SPECIAL-BISEP. B0 inhomogeneity was optimized using first- and second-order shimming with FAST(EST)MAP,19,20 resulting in water linewidth of 24 to 28 Hz for a volume of 60 μL (5 × 4 × 3 mm3) containing primarily cerebral cortex and striatum (Figure 2). Adiabatic 13 C decoupling 10 was applied during 145 ms acquisition time. Spectra with 13 C AFP off and on were acquired with 8-scan blocks in an interleaved mode (TE = 2.8 ms, repetition time = 4 seconds) during the whole infusion experiment.
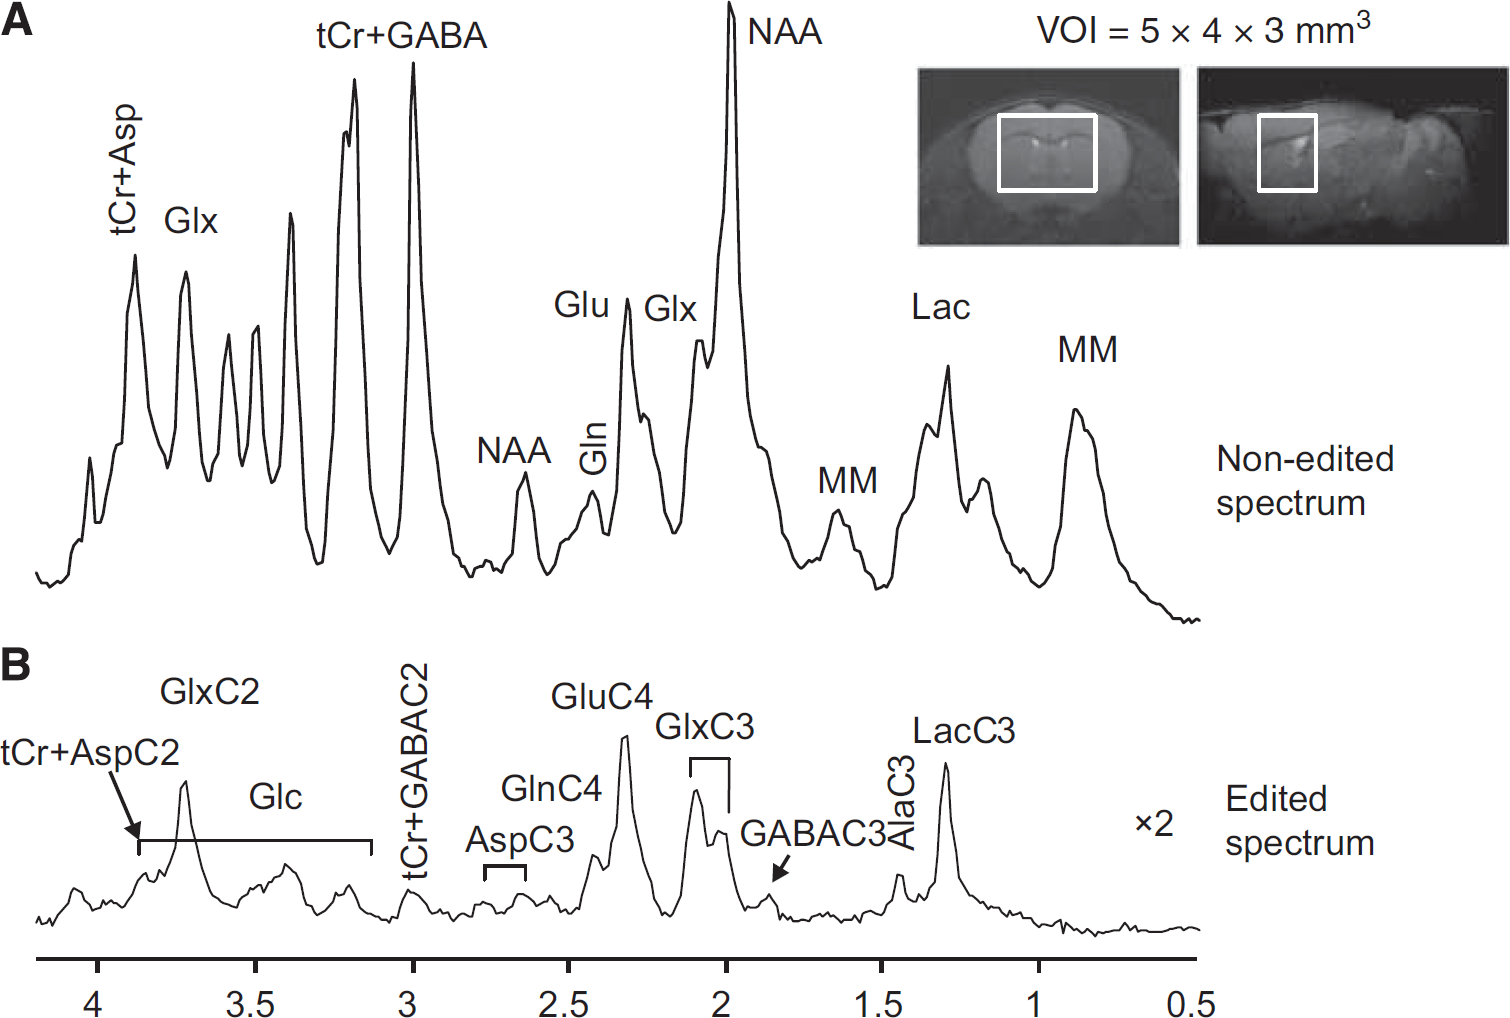
Representative coronal and sagittal fast spin-echo images of the mouse brain with the volume of interest (VOI) for magnetic resonance spectroscopy (MRS) measurement. Averaged nonedited (
Data Analysis
After Fourier transformation and frequency correction, every four blocks (64 averages) of spectra were summed and quantified with LCModel (Stephen Provencher Inc., Oakville, ON, Canada). 21 Nonedited 1 H spectra acquired with 13 C AFP off, which contain 1 H resonances coupled to both 13 C and 12 C nuclei, were quantified with a standard 1 H MRS basis set containing a measured macromolecular baseline 22 and simulated metabolite spectra. 23 Another basis set including simulated metabolite spectra of 1 H resonances coupled to N-acetyl aspartate (NAA) C6, Glu (C2, C3, and C4), Gln (C2, C3, and C4), γ-aminobutyric acid (GABA) (C2, C3, and C4), aspartate (Asp) (C2 and C3), glucose (C2-C6), total creatine (C2 and C3), lactate (Lac) C3, and alanine (Ala) C3 was used to quantify 13 C edited MR spectra. All metabolites concentrations were calculated using total creatine as an internal reference by assuming its concentration of 8 μmol/g. 24
Metabolic Modeling
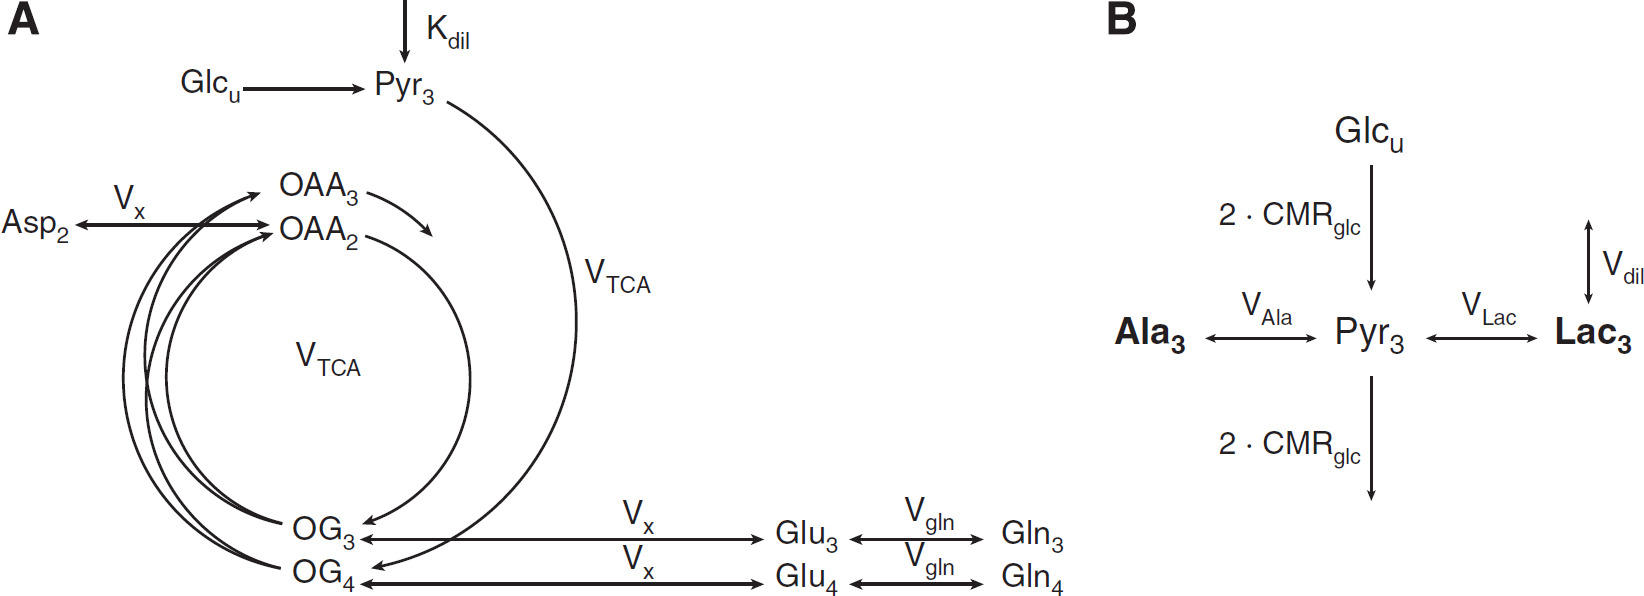
In the metabolic reaction chain of glucose utilization in brain tissue, pyruvate (Pyr) is the last intermediate of the glycolysis and is not only a precursor for oxidative metabolism in the tricarboxylic acid (TCA) cycle, but also of lactate and alanine. Given the strong activity of lactate dehydrogenase allowing fast exchange between pyruvate and lactate as compared with the TCA cycle rate,25,26 the 13 C turnover of LacC3 closely follows that of PyrC3 in terms of 13 C FE. On the time scale of the 13 C turnover of the amino acids labeled through the TCA cycle, the FE of LacC3 can therefore be used as an input function of the metabolic system, as a substitute to the nonmeasurable pool of pyruvate. The LacC3 turnover curve was thus smoothed by being fitted with an exponential function FE(t) = (a · t+b)(1 – e−c·t) and used as the input function for the metabolic model. Cerebral metabolic fluxes were explored by fitting a one-compartment metabolic model of mitochondrial metabolism (Figure 1A)2,27 to the measured 13 C labeling time courses of metabolites (i.e., GluC4, GlnC4, GluC3+GlnC3 (GlxC3) and AspC2). The curve fitting process was undertaken in MATLAB (Version 7.11, The MathWorks, Inc., Natick, MA, USA) using a standard built-in ordinary differential equation solver and a modified Levenberg-Marquardt nonlinear regression method. The fitting procedure was weighted with the square root of the inverse of the variance of the experimental noise, to compensate for the different precisions in the measurement of the turnover curves.
(
In a second step, the ratio of lactate conversion rate VLac and alanine conversion rate VAla was obtained by fitting time courses of AlaC3 and LacC3 to a compartmental model (Figure 1B) of the chemical reactions involving pyruvate in brain glucose metabolism. In this model, the FE of glucose is assumed to follow a step function at a level of 67% after the start of tracer infusion, as previously shown using this type of infusion protocol.12,13 The cerebral metabolic rate of glucose consumption (CMRglc) was fixed to 0.5 μmol/g per minute, which is a representative value for brain glucose metabolism in anesthetized mice, as found in this study and in the literature. 7 In the case of the considered model, with a bidirectional flux with the same pyruvate pool, the FE of Lac is expected to be very close to the FE of Ala, since the dilution flux in lactate also dilutes the labeling in Ala through the exchange with Pyr. Note that the calculated FE of AlaC3 was slightly higher than that of LacC3, which may be ascribed to a potential underestimation of the small Ala concentration given its overlap with macromolecule resonances at 1.4 ppm. Therefore, the FE turnover curve of AlaC3 at steady state was scaled with the FE of LacC3, based on the ratio between FELacC3/FEAlaC3 at steady state found in brain extracts in Duarte et al. 13 The errors of all adjusted metabolic fluxes were evaluated by Monte–Carlo simulation.
The equations describing the mathematical modeling approaches used in this study are reported in appendix, as Supplementary information.
RESULTS
Nonedited (Figure 2A) and edited 1 H MR spectra (Figure 2B) acquired from the volume of interest of 60 μL in the mouse brain using SPECIAL-BISEP show good spectral quality at 14.1 T in this study, such as high spectral resolution, e.g., the separation of GluC4 and GlnC4, and the absence of contamination signal from extraneous lipids, which allows the measurement of lactate and alanine. In the 13 C edited spectra, 13 C labeled 1 H resonances in the mouse brain can be observed in LacC3, AlaC3, GluC4, GlnC4, GlxC3, GlxC2(GluC2+GlnC2), AspC3, AspC2, GABAC3, GABAC2, and Glc(C2-C6) (Figure 2B).
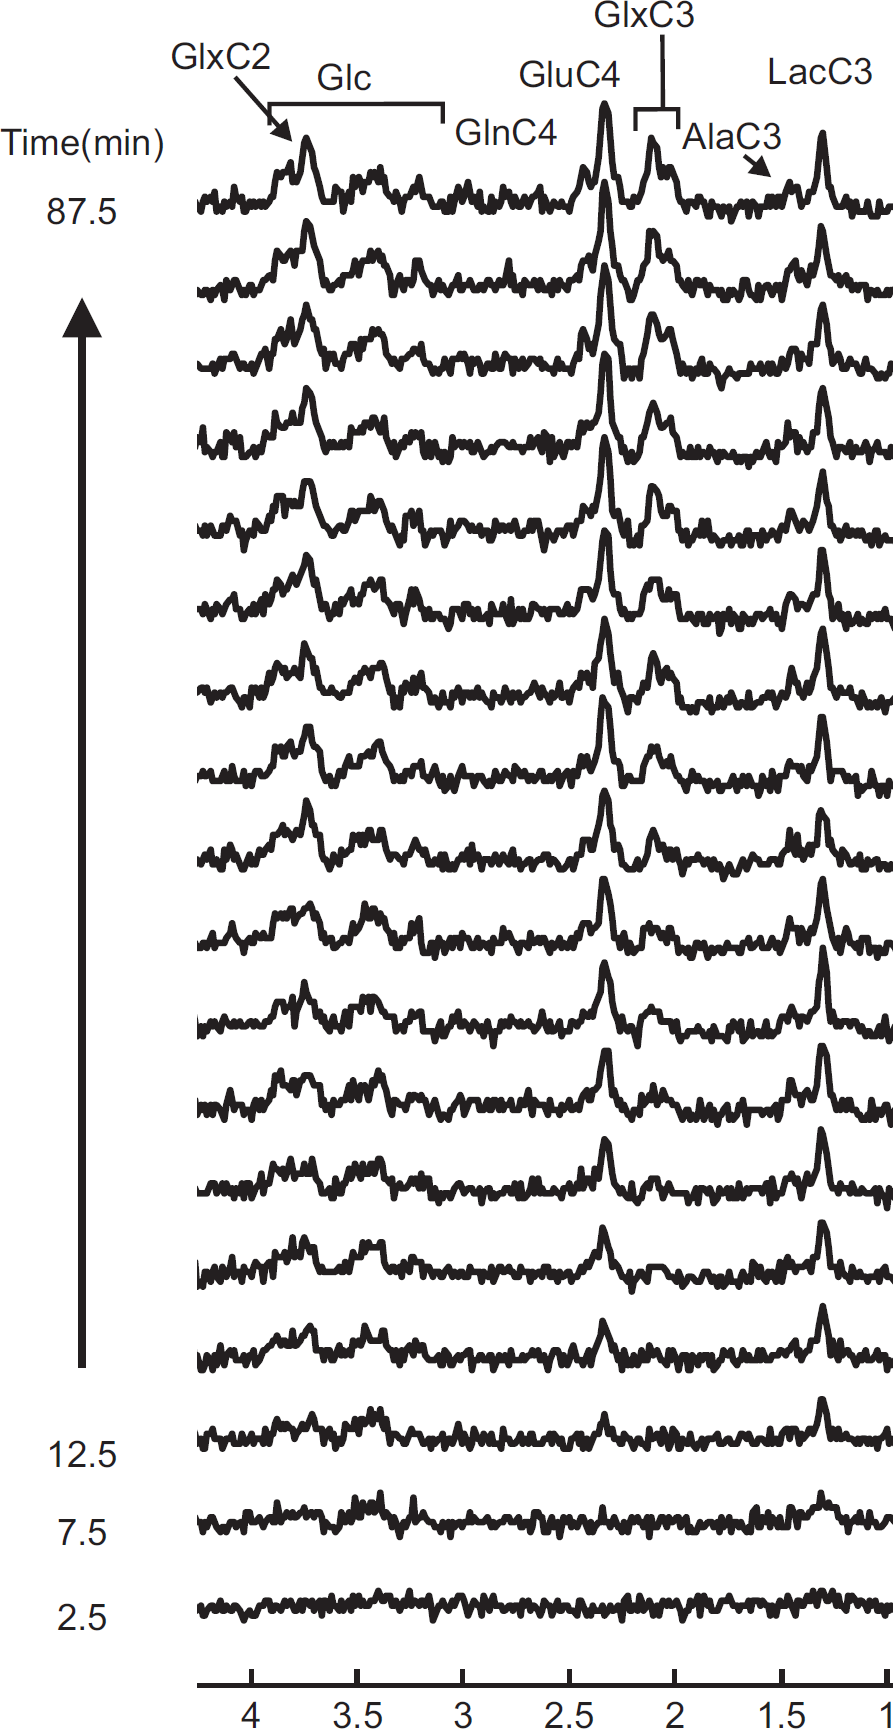
To show the dynamic incorporation of 13 C label into individual carbon positions of metabolites, edited spectra containing 13 C-coupled 1 H resonances were summed over 5 minutes for 90 minutes after the start of [U- 13 C6] glucose infusion (Figure 3). Note that 13 C labeling into Glc and Lac can already be observed during the second 5-minute acquisition after the start of infusion. Subsequently, carbon positions of Ala, Glu, Gln and GABA were labeled, respectively (Figure 3).
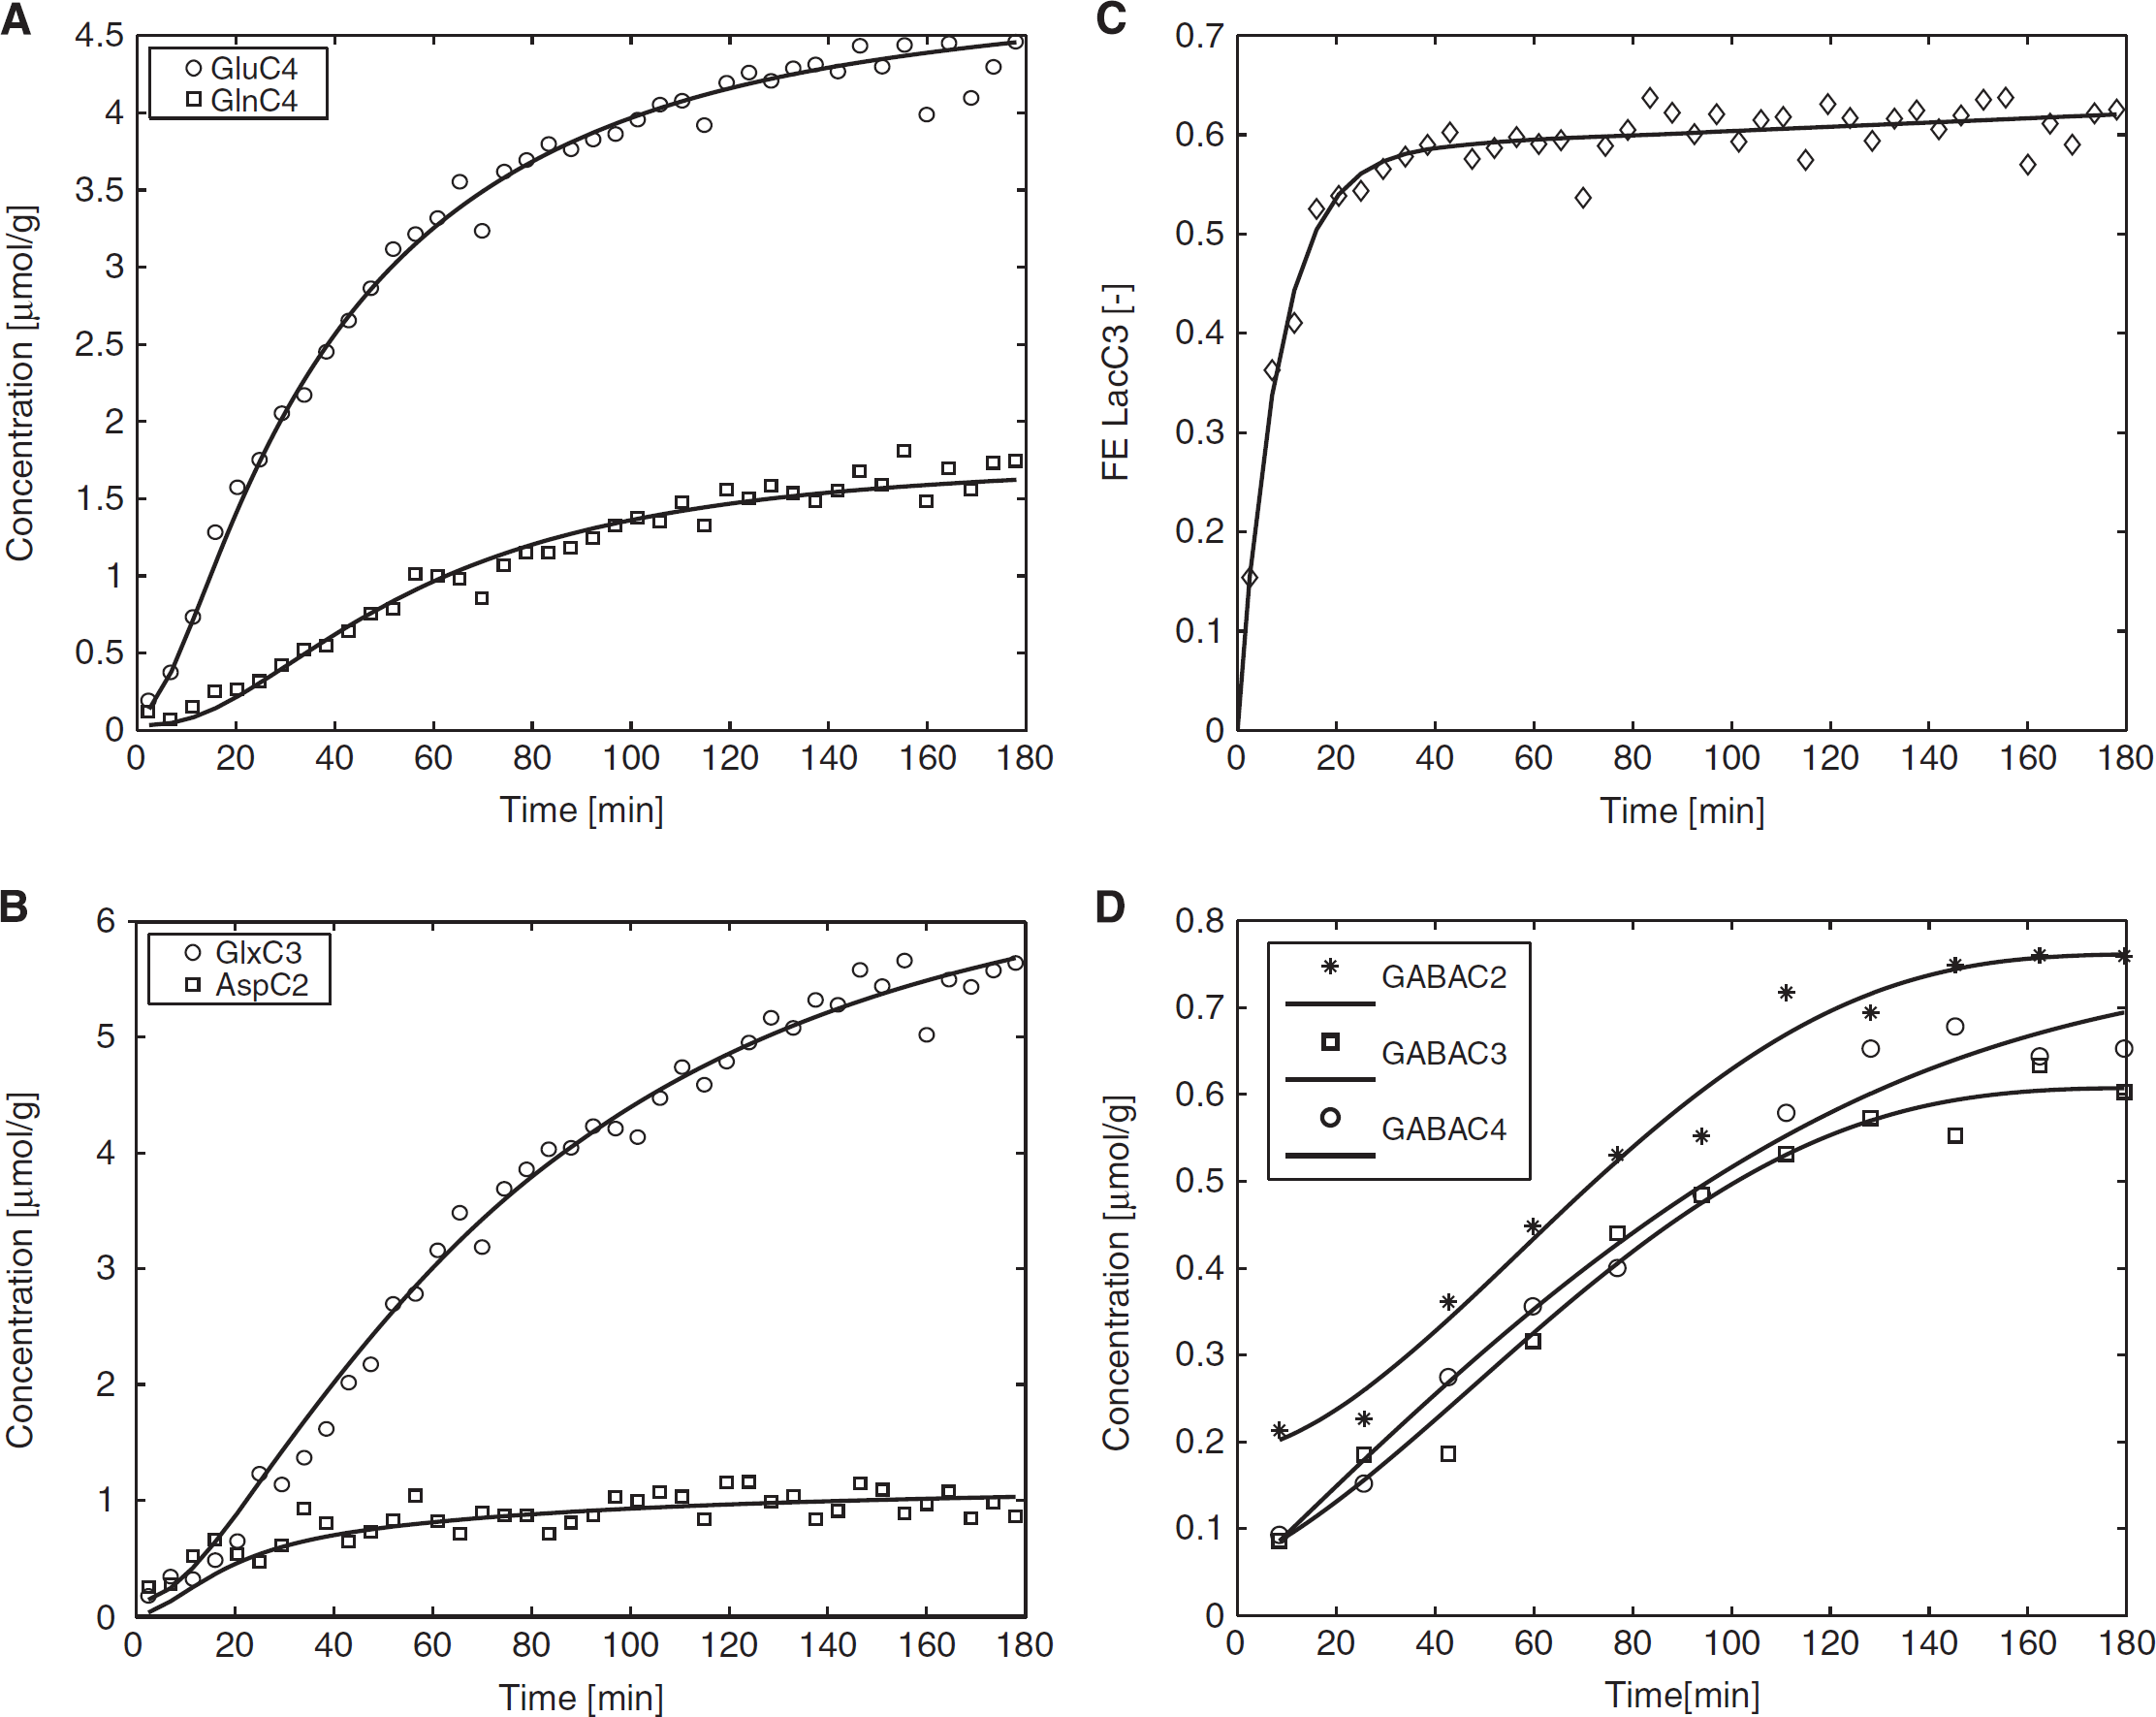
To determine the total concentration of metabolites ( 13 C+ 12 C) and the concentrations of 13 C labeled metabolites, nonedited and edited 1 H spectra were analyzed using LCModel. The pool sizes of glutamate (9.1 ± 0.5 μmol/g, mean ± s.e.m.), glutamine (3.4 ± 0.1 μmol/g), and aspartate (2.1 ± 0.2 μmol/g) were measured simultaneously from the nonedited 1 H spectra. The average time courses of 13 C labeled GluC4, GlnC4, GlxC3, AspC2 and GABA(C2, C3, and C4) concentration were obtained from the edited spectra with a temporal resolution of 4.3 minutes during 180-minute infusion of [U- 13 C6] glucose (Figure 4).
Average time courses of (
To determine the TCA cycle flux (VTCA = 1.05 ± 0.04 μmol/g per minute, mean ± s.d.), the exchange flux between 2-oxoglutarate (mitochondrial TCA cycle intermediate) and glutamate (cytosolic amino acid) (Vx = 0.48 ± 0.02 μmol/g per minute), the Glu-Gln exchange rate (Vgln = 0.20 ± 0.02 μmol/g per minute) and the dilution factor (Kdil = 0.82 ± 0.01), the average time courses of GluC4, GlnC4, GlxC3, and AspC2 were fitted by a one-compartment model of mitochondrial metabolism using fitted LacC3 time course as the input function (Figures 4A–4C). The comparison of metabolic fluxes obtained in mouse (ex vivo), rat, and human (in vivo) brains is summarized in Table 1.
Metabolic fluxes (μmol/g per minute, mean±s.d.) obtained in rat, human, and mouse brain using 13C MRS
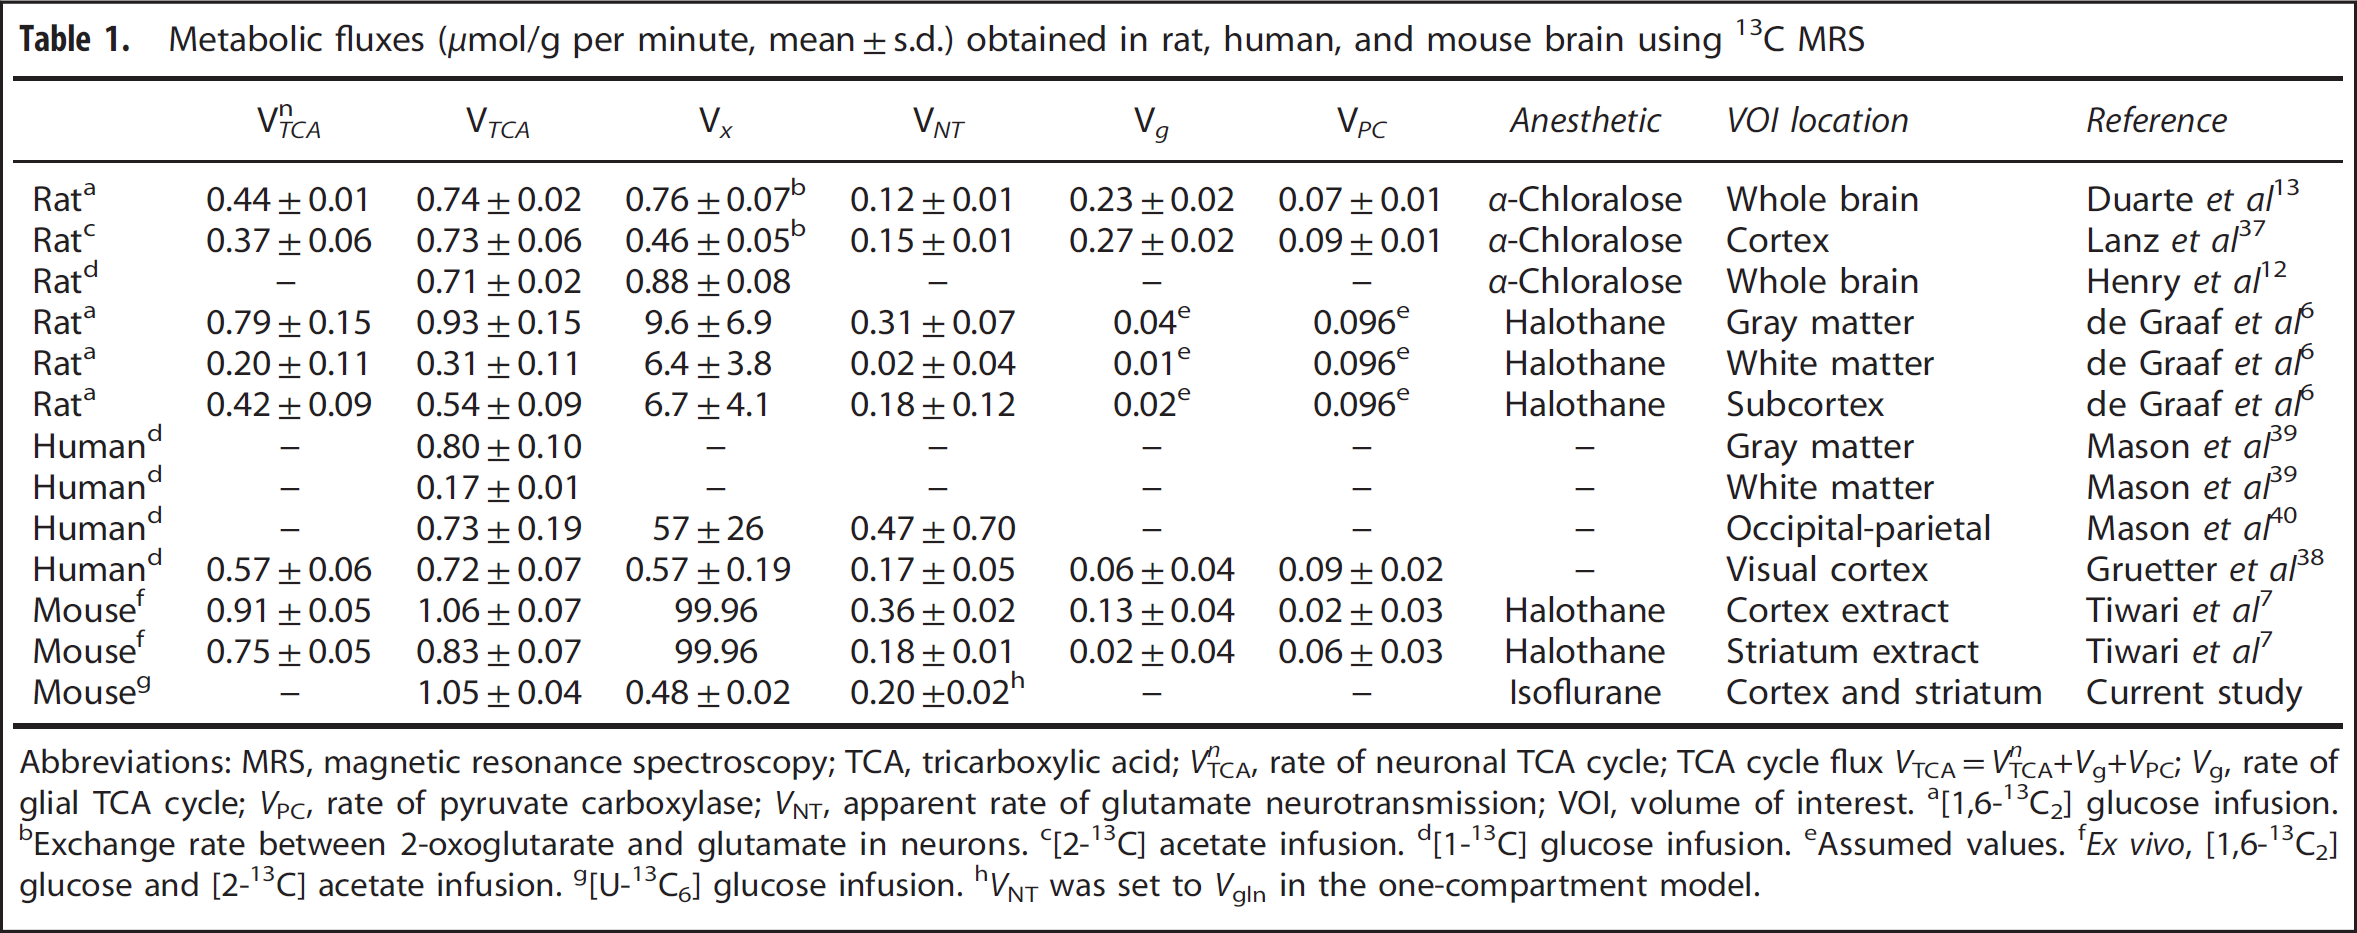
Abbreviations: MRS, magnetic resonance spectroscopy; TCA, tricarboxylic acid; VTCA n , rate of neuronal TCA cycle; TCA cycle flux VTCA=VTCA n +Vg+VPC; Vg, rate of glial TCA cycle; VPC, rate of pyruvate carboxylase; VNT, apparent rate of glutamate neurotransmission; VOI, volume of interest.
[1,6-13C2] glucose infusion.
Exchange rate between 2-oxoglutarate and glutamate in neurons.
[2-13C] acetate infusion.
[1-13C] glucose infusion.
Assumed values.
Ex vivo, [1,6-13C2] glucose and [2-13C] acetate infusion.
[U-13C6] glucose infusion.
VNT was set to Vgln in the one-compartment model.
To determine the ratio of VLac/VAla (10 ± 2), the turnover curves of LacC3 and AlaC3 (Figure 5A) were fitted, assuming a glucose utilization CMRglc of 0.5 μmol/g per minute. 7 To investigate the effect of the assumed CMRglc value on the assessment of VLac/VAla ratio, VLac/VAla ratios were calculated by varying CMRglc values (Figure 5B). For CMRglc values lower than 0.45 μmol/g per minute, the simulated curves failed to describe the initial rising portion of the measured LacC3 enrichment curve. This value was therefore used as a minimum in the analysis. Error bars represents the standard deviation determined by Monte–Carlo simulations. The VLac/VAla ratio was found to be between 6.6 and 11.6 for the considered CMRglc range. For an assumed value of CMRglc of 0.5 μmol/g per minute, 7 the ratio was 10 ± 2. The pool size of Ala and Lac may vary due to physiological conditions, such as the higher plasma glucose level during [U- 13 C6] glucose infusion. From the 1 H MRS data, we observed a net production of lactate (0.01 μmol/g per minute) and in a smaller extent of alanine (0.002 μmol/g per minute). When this metabolic nonsteady-state condition was added to the metabolic model, i.e., considering linearly increasing pool sizes, no statistically significant difference was found for the VLac/VAla ratio (data not shown).

(
DISCUSSION
The present study measures for the first time in vivo in the mouse brain the 13 C label incorporation into brain metabolites using 1 H-[ 13 C] MRS with the concomitant determination of the TCA cycle flux VTCA, the exchange flux between 2-oxoglutarate and glutamate Vx, the Glu-Gln exchange rate Vgln, the pyruvate dilution factor Kdil and the ratio VLac/VAla.
1 H-[ 13 C] Magnetic Resonance Spectroscopy in the Mouse Brain Due to the small size of the mouse brain and the intrinsic low sensitivity of 13 C MRS, several strategies were used in this study to enhance sensitivity of the measurement. The use of [U- 13 C6] glucose infusion increased the sensitivity of the measurement by two-fold relative to [1- 13 C] glucose by labeling both molecules of [3- 13 C] pyruvate from [U- 13 C6] glucose through glycolysis. In addition, as an alternative to direct-detected 13 C MRS, 9 detection of 13 C labeling through coupled 1 H nuclei intrinsically increased the experimental sensitivity. The application of SPECIAL-BISEP 11 at ultra-high magnetic field of 14.1 T further increased the quality of in vivo spectra from the mouse brain in terms of signal-to-noise ratio, spectral resolution, and localization performance. Moreover, the nonedited 1 H spectra allow the straightforward measurement of metabolites pool size in vivo, which is especially practical for recording the pool size of those metabolites that may vary during the infusion experiment.13,28 Although the application of 1 H-[ 13 C] MRS at 14.1 T improved the spectral dispersion of GluC4 and GlnC4 (Figure 2B), the separation of labeling in C2 and C3 of Glu and Gln was not complete.
Input Function for Metabolic Modeling
As a major energy source of the brain, glucose is first transported into brain across the blood–brain barrier and then degraded into pyruvate by the glycolytic pathway. Pyruvate can then be transported into mitochondria and oxidized in the TCA cycle. It can also be converted to lactate through lactate dehydrogenase, which has a higher activity than that of the pyruvate dehydrogenase. 25
Therefore, following the glucose metabolic pathway, several candidates, e.g., plasma glucose, brain glucose, lactate, and pyruvate could serve as an input function in the mathematic modeling to derive metabolic fluxes. However, due to small pool size of pyruvate, it can only be detected with sensitivity enhancement using dynamic nuclear polarization. 29
To date, when using direct 13 C MRS, it has been hardly feasible to measure the time-resolved FE of metabolic pools such as glucose or lactate in vivo. Therefore, a time-resolved FE of plasma glucose was commonly obtained from blood sampling during the MRS experiment and then used as an input function to derive metabolic fluxes using a given metabolic model in a 13 C labeled glucose infusion study.13,30 However, frequent blood sampling during 13 C NMR experiments remains challenging in the mouse due to its small blood volume. Recently, one study showed the blood sampling during 13 C MR experiments in young rat (~100 g) by using a specifically designed animal holder. 31
Alternatively, the measure of FE of brain glucose using 1 H-[ 13 C] MRS has been reported in the rat brain; 10 however, this remains challenging as it heavily relies on excellent water suppression and shimming performance. The optimization of field inhomogeneity in mouse brain is highly demanding on shimming capacity because of an increased susceptibility gradient comparing with rat brain 24 and becomes even more challenging at 14.1 T compared with 9.4 T. 32 Therefore, in the current study, the reliable measurement of C1 glucose at 5.2 ppm was not applicable in mouse brain. Other 1 H resonances coupled to C2-C6 of glucose present a number of peaks (3.3 to 3.8 ppm) overlapping with macromolecule baseline and many metabolites. This results in the underestimation of total glucose concentration in the nonedited spectra and overestimation of FE of brain glucose. Therefore, brain glucose might not be best candidate as the input function in this study.
However, the mouse brain contains higher level of lactate (3 to 5 mmol/L)24,33 across four brain regions relative to rats (1 to 2 mmol/L) 34 and human (~1 mmol/L), 35 leading to direct time course measurements of lactate FE using 1 H-[ 13 C] MRS (Figure 4C). Compared with plasma or brain glucose, which is several biochemical steps further from the TCA cycle, the lactate pool is likely to represent closely the FE of pyruvate. In addition, lactate can also be transported into the brain via monocarboxylate transporters and utilized as brain fuel. 36 The use of lactate as an input function could take into account the potential 13 C labeling from the blood. Therefore, the brain lactate signal is the most favourable and straightforward candidate for input function in the mouse brain.
Metabolic Fluxes
The value of TCA cycle flux (VTCA = 1.05 ± 0.04 μmol/g per minute) representing essentially glutamatergic neuron activity is in agreement with the results obtained from mouse brain extracts (Table 1). 7 As shown in Table 1, mouse brains showed a higher TCA cycle flux compared with human and rat brain, suggesting distinct kinetics for the mouse. The Glu-Gln exchange rate of 0.20 ± 0.02 μmol/g per minute for cerebral cortex and striatum falls in the range of reported ex vivo values of 0.18 ± 0.01 and 0.36 ± 0.02 μmol/g per minute in striatum and cortex. 7 The transmitochondrial flux Vx (0.48 ± 0.02 μmol/g per minute) summarizing the exchange between 2-oxoglutarate and cytosolic glutamate was measured for the first time in the in vivo mouse brain and was found on the same order of magnitude as the TCA cycle rate, similarly to previous studies in rats13,37 and humans. 38
In this study, we applied a one-compartment model analysis of brain energy metabolism based on the turnover curves GluC4, GlnC4, GlxC3, and AspC2. Since brain tissue is composed of many different cell types with distinct roles in energy metabolism, it would be desirable to develop the model into a more complex scheme closer to the tissue biochemical complexity. A next step would be to consider a two-compartment approach1,13,37 to distinguish between neuronal and astrocytic metabolism in the 13 C labeling of glutamate, glutamine and aspartate. However, to characterize properly the activity of astrocytic and neuronal TCA cycles separately, the separate acquisition of the positions C4 and C3 of glutamate and glutamine is at least necessary, 1 when infusing [1,6- 13 C]glucose. The main reason is the different labeling pattern of the position C3 induced in the astrocytic compartment by the astrocytic-specific pyruvate carboxylase. This cell-specific labeling pattern enables to decouple the effects of neuronal and astrocytic TCA activity on the observed turnover curves by a glial-specific dilution of glutamine C3. In the present study using [U- 13 C]glucose and limited to the measurement of GlxC3 due to spectral overlap, this cell-specific labeling pattern was not observed and the use of two-compartment modeling approach leads to strong correlations between the determined metabolic rates in the neuronal and astrocytic compartments (data not shown). This underdetermination can either be solved by fixing some metabolic rates using a priori knowledge or decreasing the level of complexity of the model, i.e., reducing it to a one-compartment approach. Future studies enabling the separate measurement of the C3 and C2 positions of glutamate and glutamine are expected to give a cell-specific insight in cerebral oxidative metabolism in the mouse.
Metabolic concentrations, required for the determination of the metabolic fluxes, are commonly varying strongly with cerebral regions as shown in the human 35 , rat, 34 and mouse 24 brains. Therefore, it is crucial to determine the metabolic pool size in the studied volume of interest (VOI). One of the advantages of 1 H-[ 13 C] MRS is the simultaneous measurement of metabolic pool sizes from nonedited spectra. The metabolite values measured in the VOI containing mainly cerebral cortex and striatum in this study are in the range of those reported in vivo in the mouse striatum and cortex. 24
Metabolic Flux Ratio of VLac/VAla
In the present study, we report for the first time the in vivo measurement of 13 C label incorporation into Lac and Ala in the mouse brain. A separate metabolic model of the biochemical reactions involving the production of alanine and lactate from pyruvate was therefore developed to enable the characterization of the dynamics of the labeling of alanine and lactate (Figure 1B). The conversion rate between pyruvate and alanine through alanine aminotransferase was expected to be on the same order of magnitude as the conversion between pyruvate and lactate. Therefore, the strategy of substituting the unknown FE time course of PyrC3 by the measured FE turnover curve of LacC3 as used for the modeling of the TCA cycle activity was not applicable. An alternative approach would be to work with another upstream substrate, such as the plasma glucose FE as an input function.
With the applied glucose infusion protocol, the FE of glucose in blood has been shown to reach steady state within 5 minutes. 13 Blood glucose FE was therefore modeled as a step function. However, the biochemical pathways and intermediates from plasma glucose to cerebral pyruvate are numerous (i.e., glucose transport, phosphorylation, and glycolysis). All these intermediate labeling pools potentially delay the turnover of pyruvate as compared with blood glucose and therefore may affect the kinetics of 13 C uptake in alanine and lactate. Since the glycolytic process is expected to be relatively slow compared with the conversion between pyruvate and lactate or alanine, this effect may not be negligible. Therefore, the separate evaluation of CMRglc and the labeling fluxes VAla and VLac is not possible without measuring the FE of PyrC3. However, since this labeling delay due to glycolysis affects pyruvate labeling, which is the last precursor for lactate and alanine, the dynamics of AlaC3 and PyrC3 turnover curves carries information on the relative conversion rates VAla and VLac, which could be determined in this study, as confirmed by Monte–Carlo simulation (VLac/VAla = 10 ± 2).
In this study, a representative CMRglc of 0.5 μmol/g per minute 7 was assumed to avoid potential mathematical underdetermination of the metabolic model. Further analysis (Figure 5B) showed that assumed CMRglc in a range of 0.45 to 2 μmol/g per minute resulted in a ratio VLac/VAla from 6.6 to 11.6. Note that the gradual increase in lactate and alanine concentrations measured by 1 H MRS did not affect the determination of the ratio VLac/VAla.
We conclude that high quality 1 H-[ 13 C] NMR spectra can be acquired from a volume as small as 60 μL in mouse brain in vivo at 14.1 T. This allows to obtain 13 C labeling turnover curves of GluC4, GlnC4, GlxC3, and for the first time, AspC2, AlaC3, GABA (C2, C3, and C4) as well as LacC3 that offers precursor information to determine a number of metabolic fluxes without additional blood sampling. This study opens the prospect of studying transgenic mouse models of brain pathologies.
DISCLOSURE/CONFLICT OF INTEREST
The authors declare no conflict of interest.
Footnotes
References
Supplementary Material
Please find the following supplemental material available below.
For Open Access articles published under a Creative Commons License, all supplemental material carries the same license as the article it is associated with.
For non-Open Access articles published, all supplemental material carries a non-exclusive license, and permission requests for re-use of supplemental material or any part of supplemental material shall be sent directly to the copyright owner as specified in the copyright notice associated with the article.