
Abstract
Sensory and cognitive impairments have been documented in diabetic humans and animals, but the pathophysiology of diabetes in the central nervous system is poorly understood. Because a high glucose level disrupts gap junctional communication in various cell types and astrocytes are extensively coupled by gap junctions to form large syncytia, the influence of experimental diabetes on gap junction channel-mediated dye transfer was assessed in astrocytes in tissue culture and in brain slices from diabetic rats. Astrocytes grown in 15-25 mmol/l glucose had a ***slow-onset, poorly reversible decrement in gap junctional communication compared with those grown in 5.5 mmol/l glucose. Astrocytes in brain slices from adult STZ (streptozotocin)-treated rats at 20-24 weeks after the onset of diabetes also exhibited reduced dye transfer. In cultured astrocytes grown in high glucose, increased oxidative stress preceded the decrement in dye transfer by several days, and gap junctional impairment was prevented, but not rescued, after its manifestation by compounds that can block or reduce oxidative stress. In sharp contrast with these findings, chaperone molecules known to facilitate protein folding could prevent and rescue gap junctional impairment, even in the presence of elevated glucose level and oxidative stress. Immunostaining of Cx (connexin) 43 and 30, but not Cx26, was altered by growth in high glucose. Disruption of astrocytic trafficking of metabolites and signalling molecules may alter interactions among astrocytes, neurons and endothelial cells and contribute to changes in brain function in diabetes. Involvement of the microvasculature may contribute to diabetic complications in the brain, the cardiovascular system and other organs.
INTRODUCTION
Many diverse, progressive and severe complications of diabetes are well established and are linked to chronically high glucose levels in conjunction with insulin deficiency (Type 1 diabetes) or insulin resistance (Type 2 diabetes). The complex, multifactorial pathobiology of diabetes (Brownlee, 2005) includes non-specific glycation reactions of glucose, increased sorbitol production and osmotic stress, oxidative stress due to generation of ROS (reactive oxygen species)/RNS (reactive nitrogen species), depletion of endogenous ***anti-oxidants, enhanced lipid peroxidation, metabolic changes, altered hormonal responses, cardiovascular disease, kidney damage, poor wound healing, and cataract formation. Overall, the impact of diabetes on the central nervous system is generally considered to be mild or modest compared with involvement of peripheral organs and peripheral neuropathies (Little et al., 2007), which have severe consequences for both the quality and duration of life of diabetic patients.
Diabetes does, however, affect the brain, altering blood flow, blood-brain barrier integrity, brain metabolism and neurotransmitters, and cognitive function in diabetic patients and in animal models, but these findings are sometimes contradictory due, in part, to differences in duration, severity and control of the disease and to methodological issues (McCall, 1992, 2004, 2005; Mooradian, 1997; Allen et al., 2004; Sima et al., 2004; Biessels and Gispen, 2005; Huber et al., 2006; Kamal et al., 2006; Brands et al., 2007; DCCT/EDIC, 2007; Kodl and Seaquist, 2008; Manschot et al., 2008; Roberts et al., 2008). Specific brain functions are measurably impaired in diabetic patients, including increased latencies of visual and auditory evoked potentials (Buller et al., 1988; Di Mario et al., 1995; Díaz de León-Morales et al., 2005) and hearing deficits (Tay et al., 1995; Frisina et al., 2006; Vaughan et al., 2006, 2007), all with unidentified aetiologies. Alloxan- and STZ (streptozotocin)-treated diabetic rats have abnormal visual and auditory evoked potentials (Buller et al., 1986; Rubini et al., 1992; Biessels et al., 1999; Manschot et al., 2003), impaired long-term potentiation and facilitated long-term depression in hippocampal neurons, and abnormal water maze learning skills (Biessels et al., 1998, Kamal et al., 1999, 2006; Biessels et al., 2005). Together, these findings suggest that subtle or sub-clinical functional disturbances in diabetic brain may be more widespread than generally recognized and may affect auditory, visual and other sensory processing pathways, as well as cognitive capability.
Our interest in the involvement of astrocytes in diabetic complications of the central nervous system arose from reports of impaired gap junctional communication in hyperglycaemic vascular smooth muscle, endothelial cells and retinal pericytes (Inoguchi et al., 1995; Stalmans and Himpens, 1997; Kuroki et al., 1998; Oku et al., 2001; Sato et al., 2002; Li et al., 2003). We recently found that astrocytes in the inferior colliculus, an auditory pathway structure with the highest metabolic rate in brain, are highly coupled by gap junctions (Ball et al., 2007) and are involved in selective syncytial ‘trafficking’ of energy and redox metabolites (Gandhi et al., 2009a), including lactate (Gandhi et al., 2009b). (Note: in the present study, metabolite ‘trafficking’ refers to transfer among cells of small molecules involved in metabolism, energetics and signalling by processes driven mainly by concentration gradients. Trafficking of small molecules involves diffusion and transporters, and differs from protein ‘trafficking’. Fluorescent dyes are used as surrogate markers to visualize and quantify movements of small molecules among cells.) We hypothesized that diabetes may cause ‘silent’ changes affecting astrocytic communication and metabolite trafficking via gap junctions may alter interactions among astrocytes, neurons and endothelial cells (i.e. the neurovascular unit), thereby contributing to the slow, progressive brain dysfunction in diabetes. The present study, therefore, examined the effects of experimental diabetes on astrocytic gap junctional transport using two model systems, the STZ-diabetic rat and cultured astrocytes grown in medium containing very high glucose concentrations.
Studies in rat models of diabetes show that plasma and brain glucose levels increase on average by approx. 3-fold, with mean values in brain rising from 2.2 μmol/g in controls to 6.9 μmol/g in diabetic animals (Table 1). In STZ-diabetic rats, the increases in plasma and brain glucose content occur within 2 days after STZ treatment and persist for months at levels similar to those in spontaneously diabetic rats (Table 1). The rise in brain glucose concentration with an increase in plasma glucose level is the expected consequence of concentration gradient-driven transport of glucose across the blood-brain barrier. Under steady state conditions in normal rats infused with various concentrations of glucose, the brain glucose level is approx. 20% that in plasma in the normo- and hyper-glycaemic range; in contrast, the brain plasma glucose distribution ratio falls during hypoglycaemia when glucose supply does not match demand (Dienel et al., 1991, 1997; Holden et al., 1991). Thus brain glucose level rises when plasma glucose concentration increases, and in diabetic rats the brain: plasma glucose distribution ratio is even higher, approx. 50% greater than in control rats, and the elevated ratio is not normalized by acute insulin treatment to reduce plasma glucose level to the normal range (Hofer and Lanier, 1991a, 1991b). Corresponding studies of brain glucose level in human diabetics are sparse, but one NMR study reported a 1.5-fold increase in the level of glucose relative to creatine in diabetic brain and calculated a net rise in brain glucose level of approx. 2 mmol/l (Table 1). Routine commercially available tissue culture media contain glucose concentrations as high as 25 mmol/l glucose, which approximates to the level of glucose in the plasma of diabetic animals and exceeds the normal and diabetic rat brain glucose level by approx. 10- and 3-fold respectively (Table 1). Astrocytes grown in ‘high’-glucose media would be exposed to the myriad of well-established consequences of severe, chronic hyperglycaemia, and the pathophysiological consequences of neuronal and Schwann cell culture in high-glucose media have been recently emphasized by Kleman et al. (2008) and Mîinea et al. (2002). In the present study, astrocytes chronically exposed to elevated glucose levels in vivo and in vitro were used as models of experimental diabetes. We report that intercellular gap junction-mediated communication among astrocytes is markedly reduced in cultured cerebral cortical astrocytes and in slices of inferior colliculus from STZ-treated rats, and that pharmacological intervention can protect against or restore this impairment.
Plasma and brain glucose concentrations in experimental diabetes
BB/Wor, BioBredding/Worcester; Cr, creatine; Glc, glucose; STZ, streptozotocin.
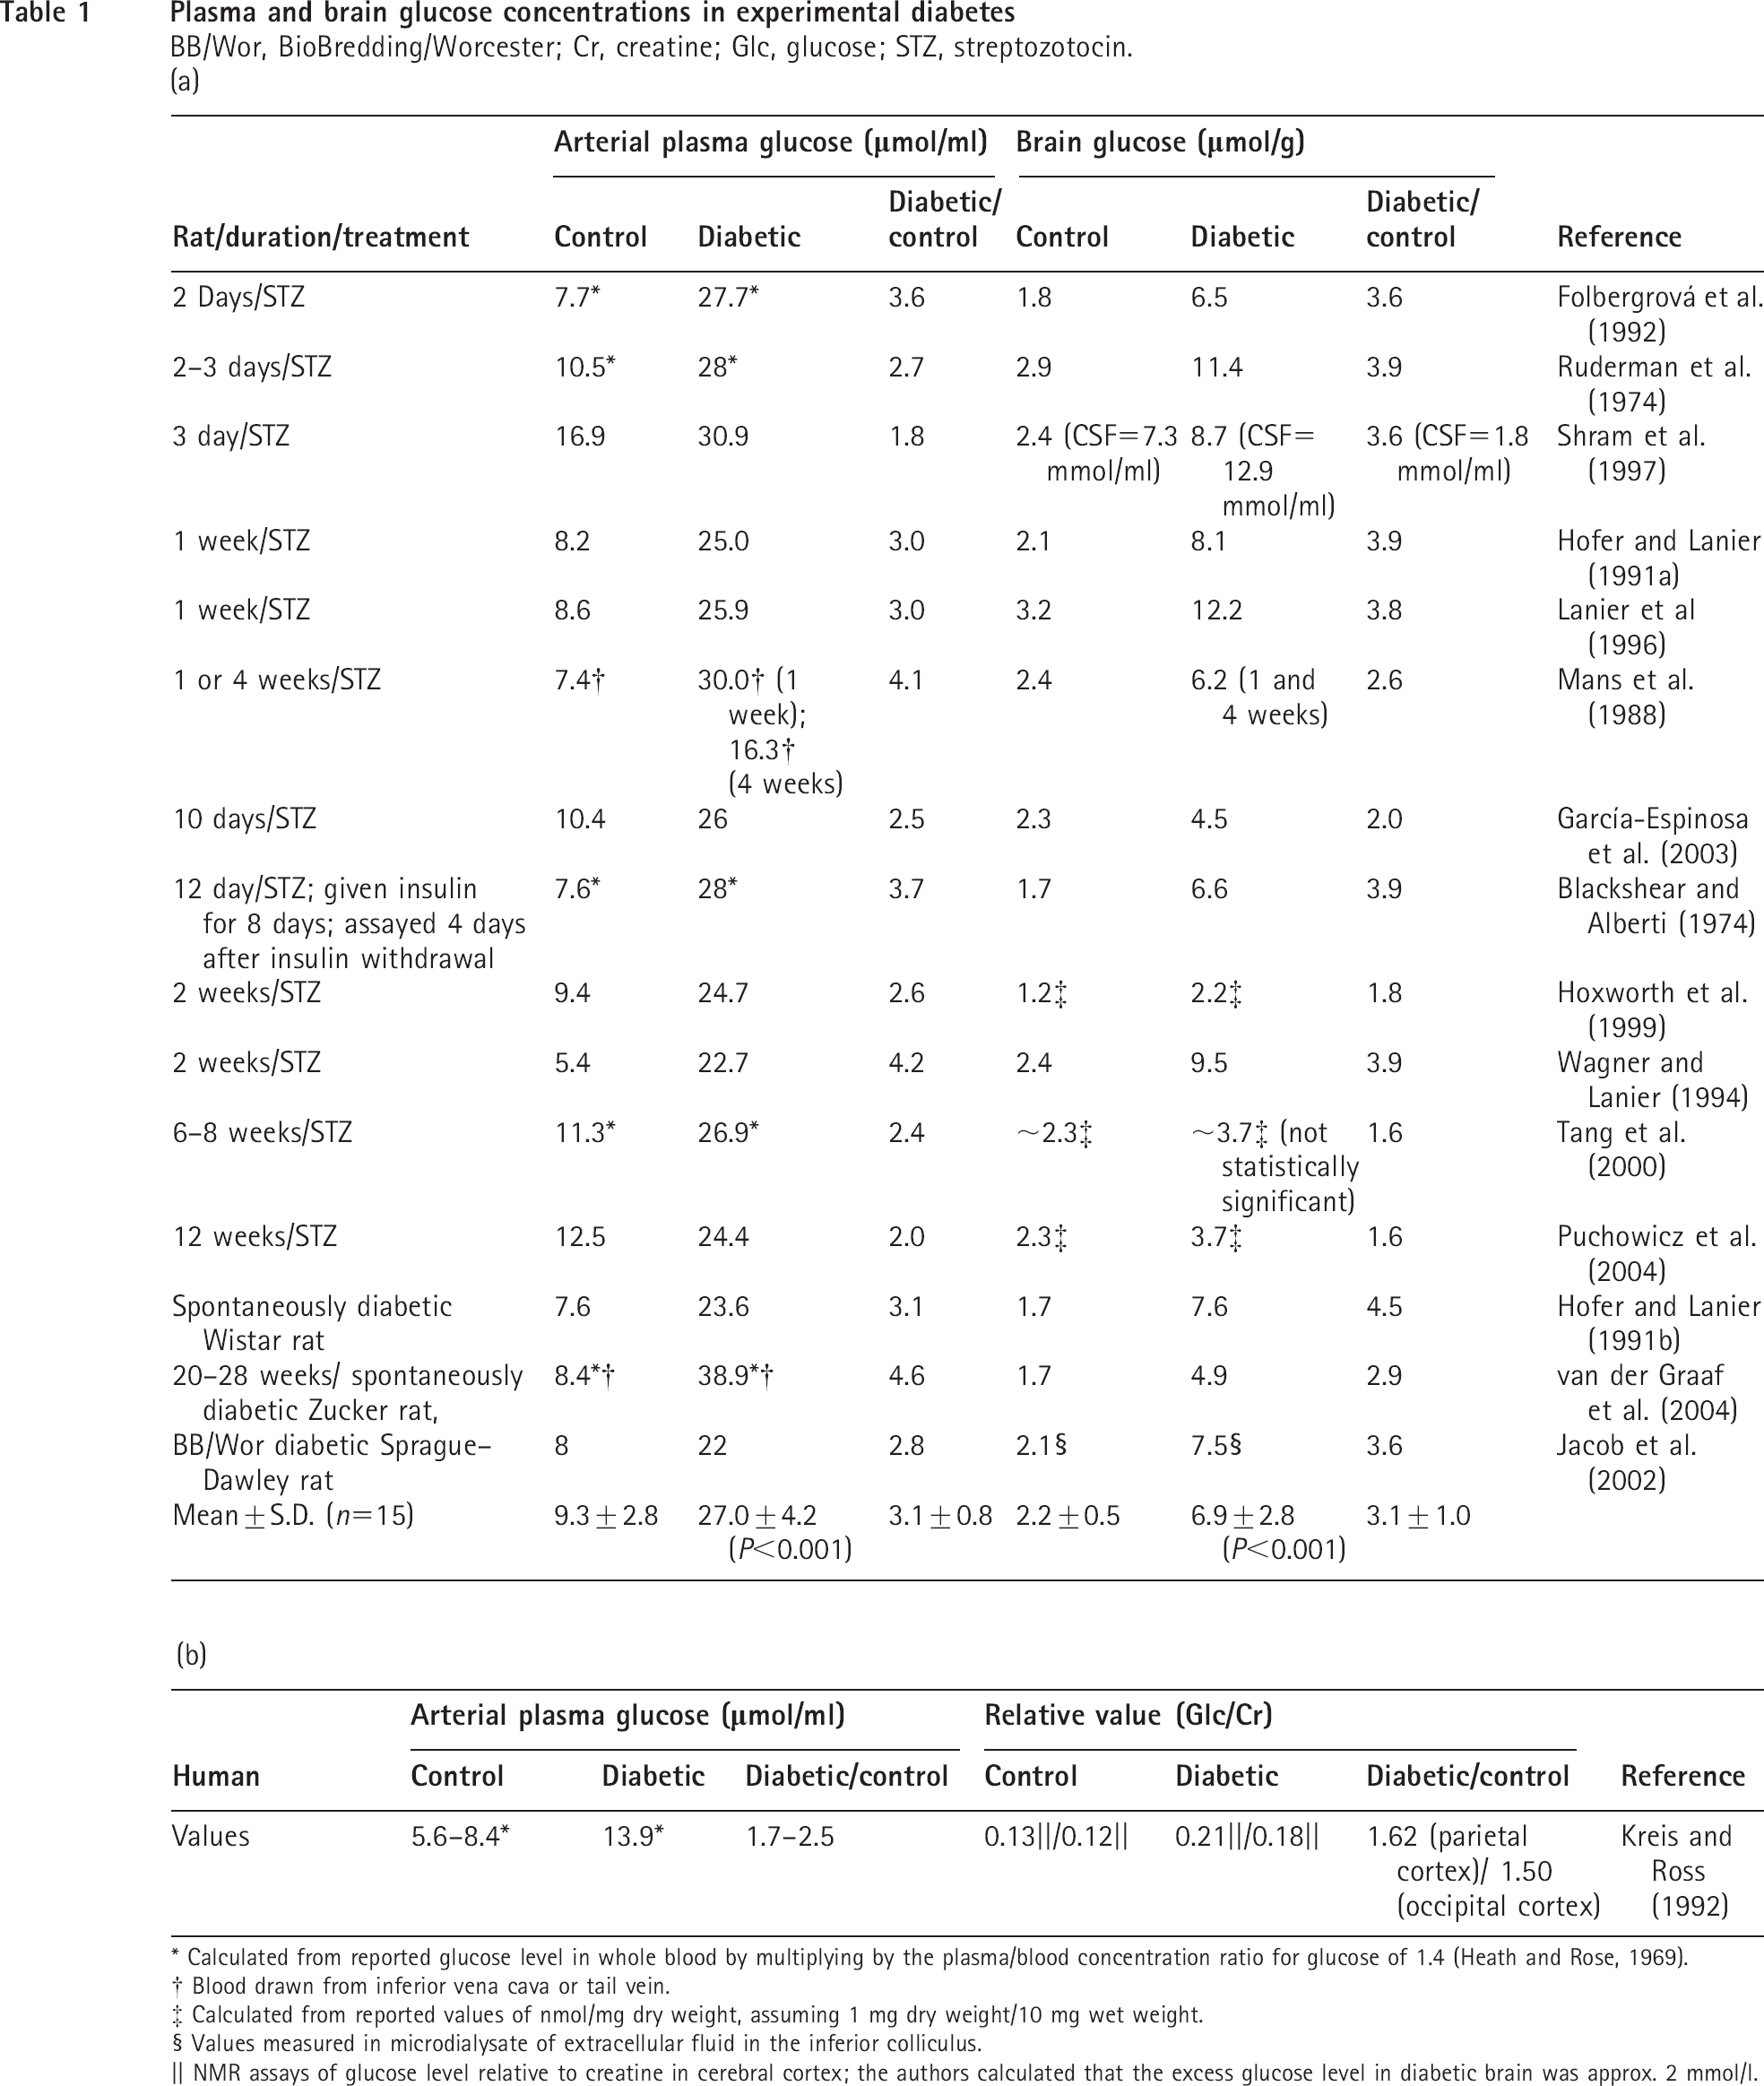
Calculated from reported glucose level in whole blood by multiplying by the plasma/blood concentration ratio for glucose of 1.4 (Heath and Rose, 1969).
Blood drawn from inferior vena cava or tail vein.
Calculated from reported values of nmol/mg dry weight, assuming 1 mg dry weight/10 mg wet weight.
Values measured in microdialysate of extracellular fluid in the inferior colliculus.
NMR assays of glucose level relative to creatine in cerebral cortex; the authors calculated that the excess glucose level in diabetic brain was approx. 2 mmol/l.
MATERIALS AND METHODS
Reagents
DMEM (Dulbecco's modified Eagle's medium; low glucose, catalogue no. 12320-032, and high glucose, no. 12430-054), penicillin, streptomycin, amphotericin B and trypsin were obtained from Invitrogen (Carlsbad, CA, U.S.A.). FBS (fetal bovine serum) was purchased from Hyclone (Logan, UT, U.S.A.). dBcAMP (dibutyryl cAMP), l-LME (l-leucine methyl ester hydrochloride), octanol, cytochalasin B, LYVS (Lucifer Yellow VS, dilithium salt), LYCH (Lucifer Yellow CH, dilithium salt), L-NAME (N ω-nitro-L-arginine methyl ester), 4-PBA (4-phenylbutyric acid), glycerol, butyric acid and N-(methylnitrosocarbamoyl)-α-d-glucosamine (STZ) were from Sigma-Aldrich (St Louis, MO, U.S.A.). Rhodamine-dextran, 6-NBDG {6-[N-(7-nitrobenz-2-oxa-1,3-diazol-4-yl)amino]-2-deoxyglucose}, Alexa Fluor® 350 carboxylic acid, succinimidyl ester (A350), carboxy-DCF-DA [carboxy DCF (2′,7′-dichlorodihydrofluorescein) diacetate] and DCF-DA were from Invitrogen (Molecular Probes, Eugene, OR, U.S.A.). TMAO (trimethylamine N-oxide dihydrate) was from Acros Organics (Fisher Scientific, Pittsburgh, PA, U.S.A.); TUDCA (tauroursodeoxycholic acid, sodium salt), tunicamycin (Streptomyces lysosuperficus) and MnTBAP [manganese(III) tetrakis(4-benzoic acid) porphyrin chloride] were from Calbiochem (EMD Biosciences, La Jolla, CA, U.S.A.). Affinity-purified rabbit polyclonal antibodies against Cx43 (catalogue number 71-0700), Cx30 (71-2200) and Cx26 (51-2800) and the goat anti-rabbit Texas Redlabelled secondary antibody were from Invitrogen; goat serum was from Dako (Carpinteria, CA, U.S.A.).
Astrocyte culture
Cultured astrocytes were prepared by small modifications of established procedures (Hertz et al., 1998). Briefly, astrocytes were harvested from the cerebral cortex of 1-day-old albino Wistar-Hanover rats (Taconic Farms, Germantown, NY, U.S.A.) and grown in T-75 culture flasks with DMEM containing 5.5 mmol/l glucose, 10% (v/v) FBS, 50 IU (international units) of penicillin and 50 μg/ml of streptomycin at 37°C in humidified air containing 5% CO2. L-LME (0.1 mmol/l), a lysosomotrophic agent that selectively destroys mononuclear cells including microglia, was also included in the culture medium, and the cultures were shaken by hand twice per week to remove microglia. When confluent, the cells were trypsinized, seeded on to polylysine-coated glass coverslips and grown to confluence in a medium containing amphotericin B (2.5 μg/ml). Then differentiation was induced by supplementing the culture medium with 0.25 mmol/l dBcAMP. The next day, cells were maintained in a medium containing 0.25 mmol/l dBcAMP and 5.5, 15 or 25 mmol/l glucose for up to 4 weeks. Purity of cultures was based on the expression of the astrocyte marker, glial fibrillary acidic protein, which was expressed in >90% of the cells.
STZ-induced diabetes
Male Sprague-Dawley rats (200-300 g; Harlan, Indianapolis, IN, U.S.A.) were fasted overnight, injected intraperitoneally with STZ (65 mg/kg body weight in 33 mmol/l citrate-buffered saline, pH 4.5); controls received the same volume of citrate-buffered saline (Romanovsky et al., 2006). Tail blood samples were taken for glucose determination from overnight-fasted animals on the day before STZ injection and on days 3, 8 and 13 thereafter; rats were categorized as normoglycaemic or hyperglycaemic, using a cut-off value of >6.9 mmol/l to define hyperglycaemia based on the day 3 fasting blood glucose level. All animal use procedures were in strict accordance with the NIH Guide for Care and Use of Laboratory Animals and were approved by the local Animal Care and Use Committee.
Brain slice preparation
At 20-24 weeks after induction of STZ-diabetes, the diabetic and age-matched, vehicle-injected control rats were deeply anaesthetized with halothane and decapitated and their brains were quickly removed and chilled by immersion in an oxygenated (i.e. bubbled with O2/CO2, 95:5), ice-cold aCSF (artificial cerebrospinal fluid) solution (concentrations in mmol/l: 26 NaHCO3, 10 glucose, 124 NaCl, 2.8 KCl, 2.0 MgSO4, 1.25 NaH2PO4 and 2.0 CaCl2, pH 7.3) and 248 sucrose, and 250 μm-thick slices were cut using a Leica (Heidelberg, Germany) VT 1000S tissue slicer; inferior colliculus slices were incubated in oxygenated aCSF containing sucrose for 30 min at 35°C and then for 1 h at 22°C (Moyer and Brown, 1998). Slices of inferior colliculus were transferred to an open bath perfusion chamber (Warner Instruments, Hamden, CT, U.S.A.) on the microscope stage. Then the slices of inferior colliculus and the cultured astrocytes were perfused (1 ml/min) with aCSF that was continuously bubbled with O2/CO2 (95:5) and contained 26 mmol/l NaHCO3 (pH 7.3) and 10 mmol/l glucose at approx. 21-22°C.
Gap junction dye transfer assays
Two procedures were used to insert a membrane-impermeant dye into astrocytes to assay gap junctional communication, scrape-loading (el-Fouly et al., 1987; Giaume et al., 1991) and diffusion into a single cell impaled with a micropipette (Ball et al., 2007; Gandhi et al., 2009a). Scrape loading is commonly used for dye transfer assays because it is a simple procedure, but the procedure destroys cells at the scrape site and releases their contents to the medium; it requires medium changes and washing of cells after dye loading, and it cannot be used in tissue slices in which astrocytes have formed their syncytia during normal brain development involving interactions of astrocytes with neurons and the vasculature. Microinjection of cells is technically more difficult, but offers more control for dye loading, and it can be used in brain slices. Fluorescent compounds used to assay dye transfer were LYVS (4% or 62 mmol/l), 4% LYVS plus 4% LYCH, Alexa Fluor® 350 (5 mmol/l) and 6-NBDG (20 mmol/l). 6-NBDG is a non-metabolizable fluorescent analogue of glucose that is a substrate for glucose transporters. In the brain slice assays of 6-NBDG gap junctional transfer, 10 μmol/l of cytochalasin B, a glucose transport inhibitor (Speizer et al. 1985), was included to minimize efflux of 6-NBDG from cells via glucose transporters. In these assays, an excess amount of pyruvate (10 mmol/l) was added to the perfusate as an oxidative fuel to compensate for blockade of glucose transport.
Scrape loading
The procedure of Giaume et al. (1991) was used for ***scrape-load assays, as follows. Glass coverslips containing astrocytes were transferred to sterile 35 mm culture dishes; coverslips were washed once and incubated in ionic-buffered solution containing (concentrations in mmol/l) 130 NaCl, 2.8 KCl, 1 CaCl2, 2 MgCl2 and 10 Hepes (pH 7.2) for 1 min, washed again and incubated in calcium-free medium for 1 min. The medium was replaced with a calcium-free medium containing 0.5 mg/ml LYVS and 1 mmol/l rhodamine-dextran (a non-permeant macromolecule used to label the scrape-loaded cells); a 2-3 cm scrape was made with a razor blade, and dye transfer was allowed for 2 min. Giaume et al. (1991) stated that calcium was omitted from the medium during scrape-loading because 1 mmol/l Ca2+ blocks Lucifer Yellow transfer; Mg2+ was still included in the scrape-load medium. A recent study showed that incubation of cultured astrocytes in the nominal absence of extracellular bivalent cations (Ca2+ and Mg2+)opens channels (hemichannels or pannexin channels) that allow rapid, widespread entry of Lucifer Yellow into astrocytes (Ye et al., 2003); the presence of Mg2+ during the scrape-loading would prevent opening of these channels. Cells were washed twice with calcium containing ionic-buffered solution and dye-labelled area determined at 8 min after scraping by image analysis using MetaVue software. Line scans were used to evaluate the change in Lucifer Yellow fluorescent intensity as a function of distance from the scrape site. The dye-labelled area was determined in three regions of each scrape; regions were imaged, and gap junctional dye transfer was calculated as the difference between the areas labelled by LYVS (gap junction permeable) and rhodamine-dextran (labels the dye-loaded cells); the mean value for each triplicate determination was used as the area labelled in that scrape-load assay.
Dye diffusion into single cells
For single-cell dye loading with micropipettes, cultured astrocytes were visualized under DIC (differential interference contrast) and astrocytes in brain slices were visualized under IR-DIC (IR-differential interference contrast) (Dodt and Zieglgänsberger, 1990) using a Nikon Eclipse E600 microscope (Nikon, Melville, NY, U.S.A.) equipped with a Nikon Fluor × 40 [NA (numerical aperture)=0.80] objective and Photometrics CoolSNAP ES camera (Roper Scientific, Atlanta, GA, U.S.A.). Micropipettes with 12-14 MΩ resistance (tip inner diameter: 1.0±0.1 μm, outer diameter: 1.8±0.1 μm; means±S.D.) were constructed from borosilicate glass (1 mm outer diameter, 0.5 mm inner diameter) using a P97 pipette puller (Sutter Instruments, Novato, CA, U.S.A.) and filled with a test solution containing a fluorescent probe. Except where noted, micropipette solutions contained (composition in mmol/l) 21.4 KCl, 0.5 CaCl2, 2 MgCl2, 5 EGTA, 2 ATP, 0.5 GTP, 2 ascorbate and 10 Hepes, pH 7.2, and one of three fluorescent dyes (LYVS, excitation/emission maxima: 430/530 nm; 6-NBDG, 475/550 nm; or Alexa Fluor® 350, 346/442 nm). The osmolarity of each solution was measured (Osmette II; Precision Systems, Natick, MA, U.S.A.) and adjusted to 305-320 mOsm/l with sucrose. Astrocytes were impaled with micropipettes using an MP-225 manipulator (Sutter Instruments, San Francisco, CA, U.S.A.), and tracers were diffused into cells for 2 min in cultured cells and for 5 min in brain slices. Fluorescence intensity was determined using MetaVue software before (background) and after diffusion of the test compound into a single astrocyte, and the dyelabelled area was determined with MetaVue software (Ball et al., 2007; Gandhi et al., 2009a). In brain slice assays, cells labelled with LYVS were counted after cutting the 250 μm-thick slices into 10 μm-thick serial sections; the number of labelled cells was based on counts of the prominently labelled nuclei. The area labelled by 6-NBDG in slices was measured in the intact slice with MetaVue software. Gap junctional transfer was inhibited by pretreatment with octanol (final concentration, 0.6 mmol/l).
Dye transfer was also assayed in astrocytes cultured in media containing 5.5 or 25 mmol/l glucose for up to 21 days in the presence or absence of compounds to reduce ROS/RNS levels or that facilitate protein folding. MnTBAP (50 μmol/l) is a superoxide dimutase mimetic that is a scavenger of ROS (Kowluru and Abbas, 2003) and
Oxidative stress assays
Astrocytes were grown in 5.5 or 25 mmol/l glucose in the presence or absence of inhibitors or chaperones, and ‘oxidative stress’ was assayed with DCF-DA or carboxy-DCF-DA, compounds that are cell membrane permeable, cleaved by intracellular esterases and, after oxidation by various reactive compounds, become fluorescent dichlorofluorescein (DCF) or carboxy-DCF (Tampo et al., 2003; Cruthirds et al., 2005 and references cited in these studies). At indicated days in culture, DCF-DA (10 μmol/l) was added to the culture medium (that had been changed 24 h earlier) or to a fresh medium containing the inhibitors plus 30 μmol/l DCF-DA. Cells were returned to the CO2 incubator for 30 min at 37°C, then washed with perfusion solution, and DCF fluorescence intensity was measured with the Nikon E600 microscope (× 40 objective) and MetaVue software. Ten field-of-view images were collected per coverslip, and analysed by thresholding to include the pixels with the highest 30% or highest 2% fluorescence intensity; the 30% threshold value excluded background fluorescence and included the cell bodies plus ‘hot spots’, whereas the 2% threshold included only the highest-intensity ‘hot spots’. Slices of inferior colliculus from diabetic rats were incubated for 30 min in 10 μmol/l carboxy-DCF-DA and fluorescence intensity assayed as described above.
Cx immunostaining
Cultured astrocytes on coverslips were fixed with 2% (w/v) paraformaldehyde in 0.1 M PBS for 10 min, washed three times with PTX (0.1 M PBS containing 0.3% Triton X), blocked in 10% (v/v) goat serum in PTX for 30 min, and incubated with rabbit polyclonal primary antibodies (diluted in 10% goat serum in PTX as follows: Cx43, 1:250 to a final concentration of 1 μg/ml; Cx30, 1:250, to 1 μg/ml; Cx26, 1:25, to 5 μg/ml) for 2 h at room temperature (approx. 21-22°C) and then overnight at 4°C. The manufacturer's recommended levels for use in frozen sections were 1-5 μg/ml for Cx43 and Cx30 antibodies and 10-20 μg/ml for Cx26; in the present study, the dilution of Cx43 was the same as that used by Ye et al. (2003). The next day, samples were warmed to room temperature, washed with PTX (three 5 min washes), incubated with goat anti-rabbit secondary antibodies conjugated to Texas Red (diluted 1:500 in 10% goat serum in PTX) for 1 h at room temperature, given three 5-min washes with PTX and stored at 4°C in PBS. Immunostained Cx protein includes intracellular punctate or vesicle-like structures (probably ER, Golgi apparatus and cytoplasmic vesicles; see Wolff et al., 1998 and references cited therein), that were prominent in the images of immunoreactive Cxs under the fixation and immunoassay conditions used in the present study (see the Results section). The area of this punctate or vesicular immunoreactive material was measured by image analysis of composite images of z-stacks using the maximum projection setting with a Nikon E600 microscope with confocal attachments and a × 60 water immersion objective (NA 1.00) and MetaVue software. The minimal fluorescence intensity threshold value was set to only include prominent punctate or vesicle-like structures, and integrated morphometric analysis was used to measure their total area in each of the 16-36 cells per Cx group that were derived from two independent cultures.
Statistics
Comparisons between two groups of independent samples were made with two-tailed, unpaired t tests. Comparisons among three or more groups of independent samples were made with one-way ANOVA and Dunnett's test for multiple comparisons against the same control value or the Bonferroni test for multiple comparisons among experimental groups. P<0.05 was considered to be statistically significant. All statistical analyses were performed with GraphPad Prism® software, version 5.02 (GraphPad Software, La Jolla, CA, U.S.A.).
RESULTS
Severe hyperglycaemia reduces dye transfer through gap junctional channels
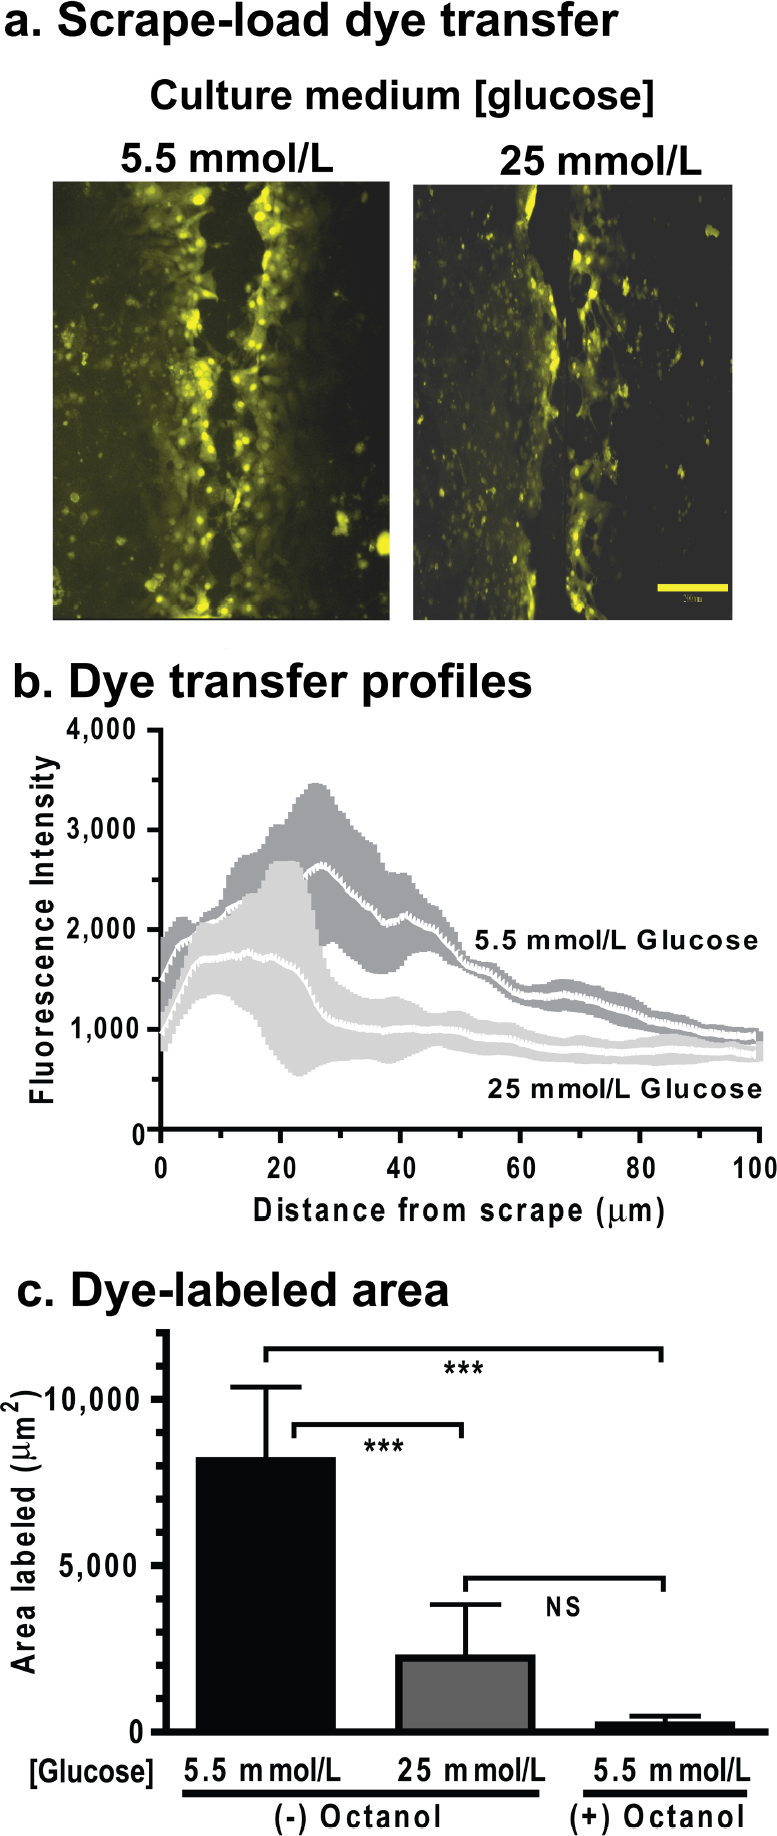
Transcellular spreading LYVS after scrape-loading of astrocytes grown for 3 weeks in 5.5 mmol/l glucose greatly exceeded that of astrocytes grown in 25 mmol/l glucose (Figure 1A). Line scan analysis of Lucifer Yellow fluorescence intensity with distance showed that overall LYVS fluorescence level was higher and dye spread extended further from the scrape site in cells grown in the lower glucose concentration (Figure 1B). The mean LYVS intensity in the pixels closest to the scrape site (at 0.6 μm) tended to be higher (P=0.084) in the low-glucose cultures and it reached a peak (∼2600 fluorescence units) at 26-29 μm from the scrape, whereas the high-glucose cultures had a much lower mean maximal value (∼1700 fluorescence units; P<0.001) and a broader peak that was closer (7.7-20 μm) to the scrape (Figure 1B). At 90-100 μm from the scrape the fluorescence intensities in the low glucose group were still 22% higher (P<0.001) than in the higher glucose group. These findings suggest that the lower dye levels and reduced dye spread in severely hyperglycaemic astrocytes are not due to differential release of Lucifer Yellow from cells during the scrape load procedure via Cx ‘hemichannels’ or pannexin channels. If these channels were preferentially open to the medium in either group of cells, extensive dye labelling would be expected to increase markedly throughout the culture, not just adjacent to the scrape site, as observed (Figures 1A and 1B); this labelling would be readily detected by visual observation because the LYVS causes prominent labelling of nuclei.
(
The net area labelled by LYVS was calculated by subtracting the area of the scrape-filled cells (i.e. area labelled by the gap junction-impermeant tracer, rhodamine-dextran) from that labelled by LYVS. Astrocytes grown in low glucose had a 4-fold higher dye-labelled area than those grown in high glucose (Figure 1C). Blockade of gap junctions with octanol reduced the LYVS-labelled area (Figure 1C) to the level of that labelled by rhodamine-dextran (results not shown).
Prolonged exposure to high glucose is required to reduce dye transfer
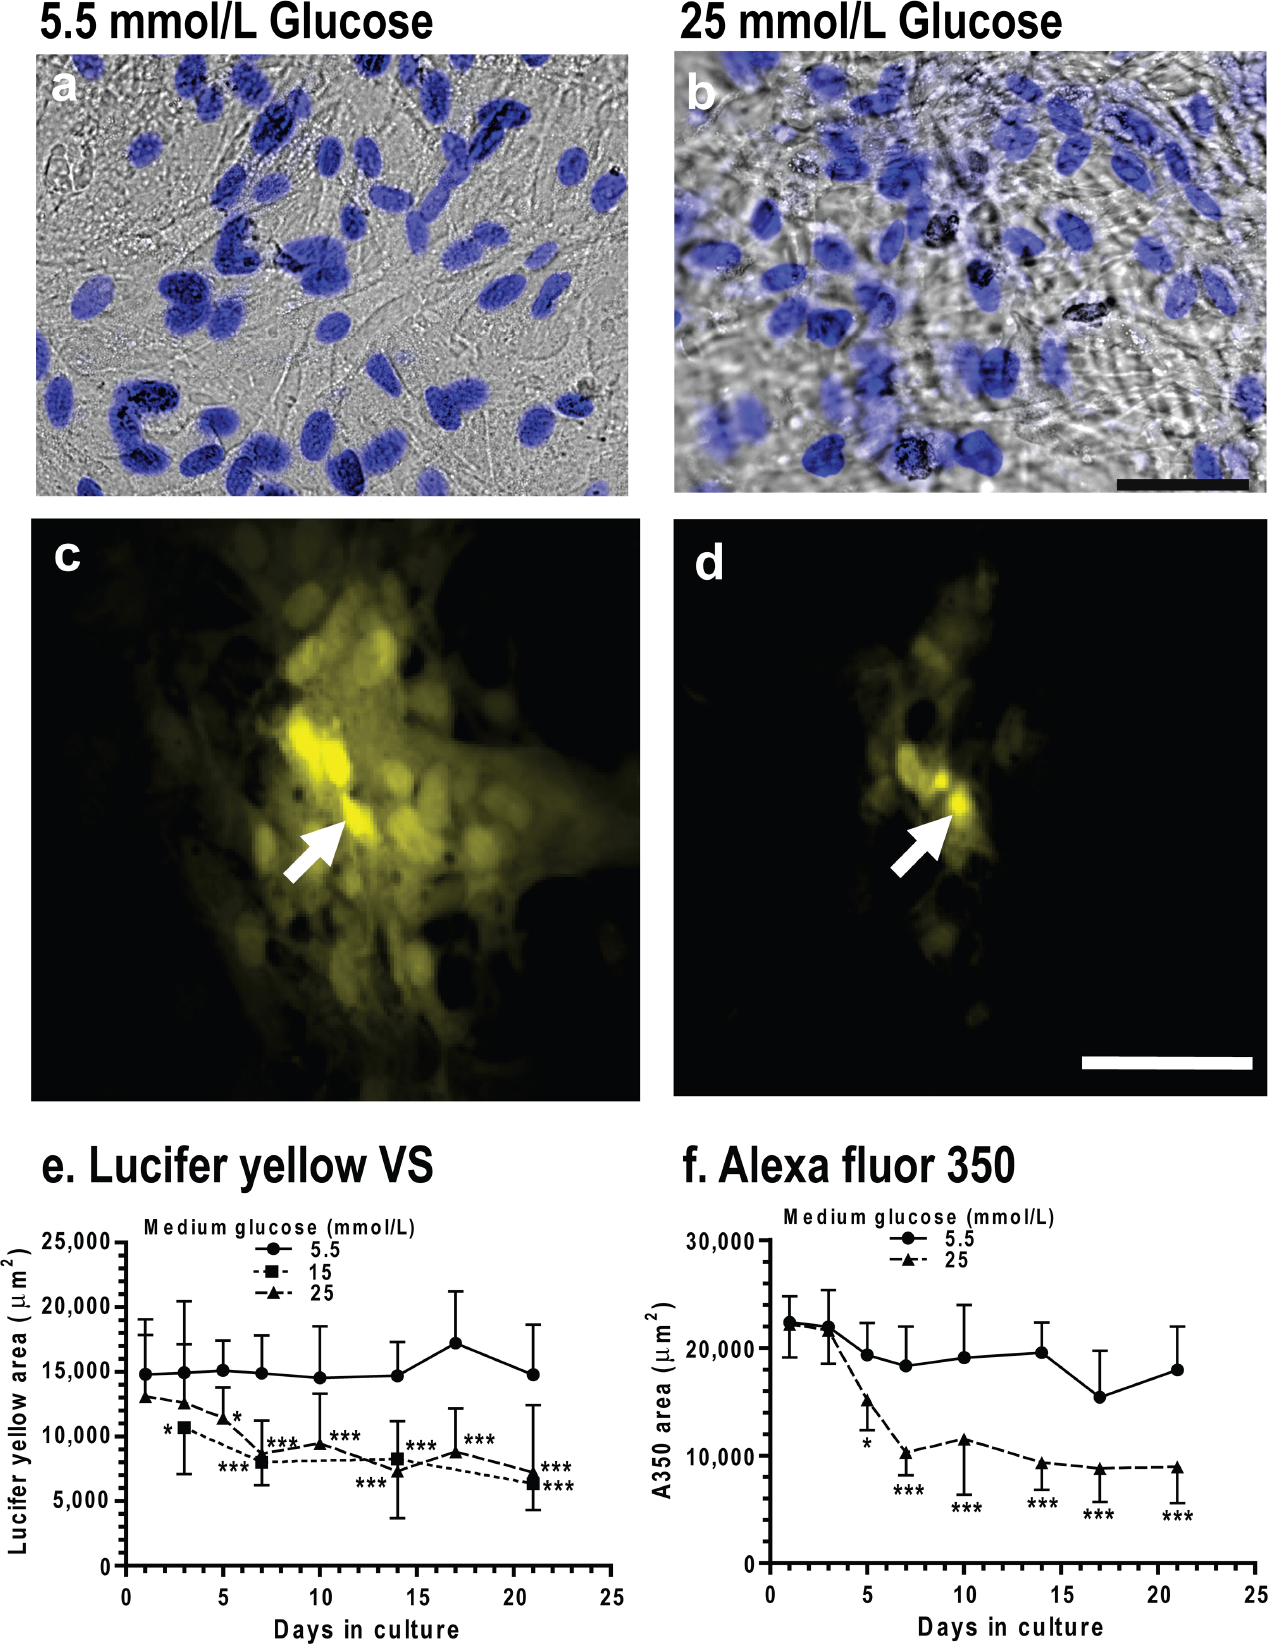
Glucose concentration in the culture medium did not affect astrocyte viability, and astrocytes grown in 5.5, 15 and 25 mmol/l glucose had similar cell densities on days 3, 14 and 21 (results not shown), as illustrated in Figure 2 for representative cultures grown for 2 weeks in 5.5 mmol/l (Figure 2A) or 25 mmol/l (Figure 2B) glucose. However, when gap junctional communication was assayed by impaling a single astrocyte with a micropipette and diffusing Lucifer Yellow into one cell, dye spreading from the impaled cell was much greater in cells grown for 3 weeks in 5.5 mmol/l glucose (Figure 2C) compared with those grown in 25 mmol/l glucose (Figure 2D), confirming the results of scrape-load assays (Figure 1).
Representative DIC images of astrocytes grown in 5.5 mmol/l (
Time in culture did not affect the area labelled by Lucifer Yellow in astrocytes grown in low glucose, but those grown in high glucose had a progressive decrease in gap junctional communication (Figure 2E). Impaired LYVS transfer had a slow onset, requiring approx. 3-5 days exposure to 15 or 25 mmol/l glucose before a statistically significant decrement was detectable. The time courses and maximal inhibition for cells grown in 15 and 25 mmol/l glucose were similar; the maximal decrement in gap junctional communication was relatively stable at approx. 50% of that in the low-glucose cultures during the interval from 7 to 21 days (Figure 2E).
Diffusion of a smaller fluorescent dye, Alexa Fluor® 350, among astrocytes was stable with time in the low-glucose cultures, and it also exhibited a progressive fall in labelled area in the high-glucose cultures (Figure 2F). There was a 5-day delay before Alexa Fluor® 350-labelled area was reduced by high glucose, and the 50% decrement was stable between 7 and 21 days. Thus the two dyes had similar lag times, temporal profiles and maximal reduction of labelled area, suggesting that reduced dye transfer may not be simply due to partial constriction of the gap junctional channel to block the passage of larger molecules (Alexa Fluor® 350 has a molecular mass of 311 Da after hydrolysis of the succinimidyl ester by water compared with 536 Da for the ionized form of LYVS). Note that Alexa Fluor® 350 does label a greater area than the LYVS in the low-glucose cultures (e.g. P<0.01 on day 1; compare Figures 2E and 2F); this is probably due mainly to its high fluorescence quantum yield (the concentration of Alexa Fluor® 350 in the micropipette was 5 mmol/l compared with 62 mmol/l for LYVS), and perhaps also to its smaller size.
Dye transfer deficit is not restored by subsequent glycaemic control
When astrocytes were grown in 15 or 25 mmol/l glucose for 2 weeks and then transferred to 5.5 mmol/l glucose for an additional 2 weeks, LYVS spreading via gap junctions did not recover. Dye transfer remained subnormal after either 7 or 14 days in the low-glucose media (Figure 3), indicating that the acquired decrement in gap junctional communication could not be reversed within 2 weeks by simply reducing the glucose concentration in the culture medium.
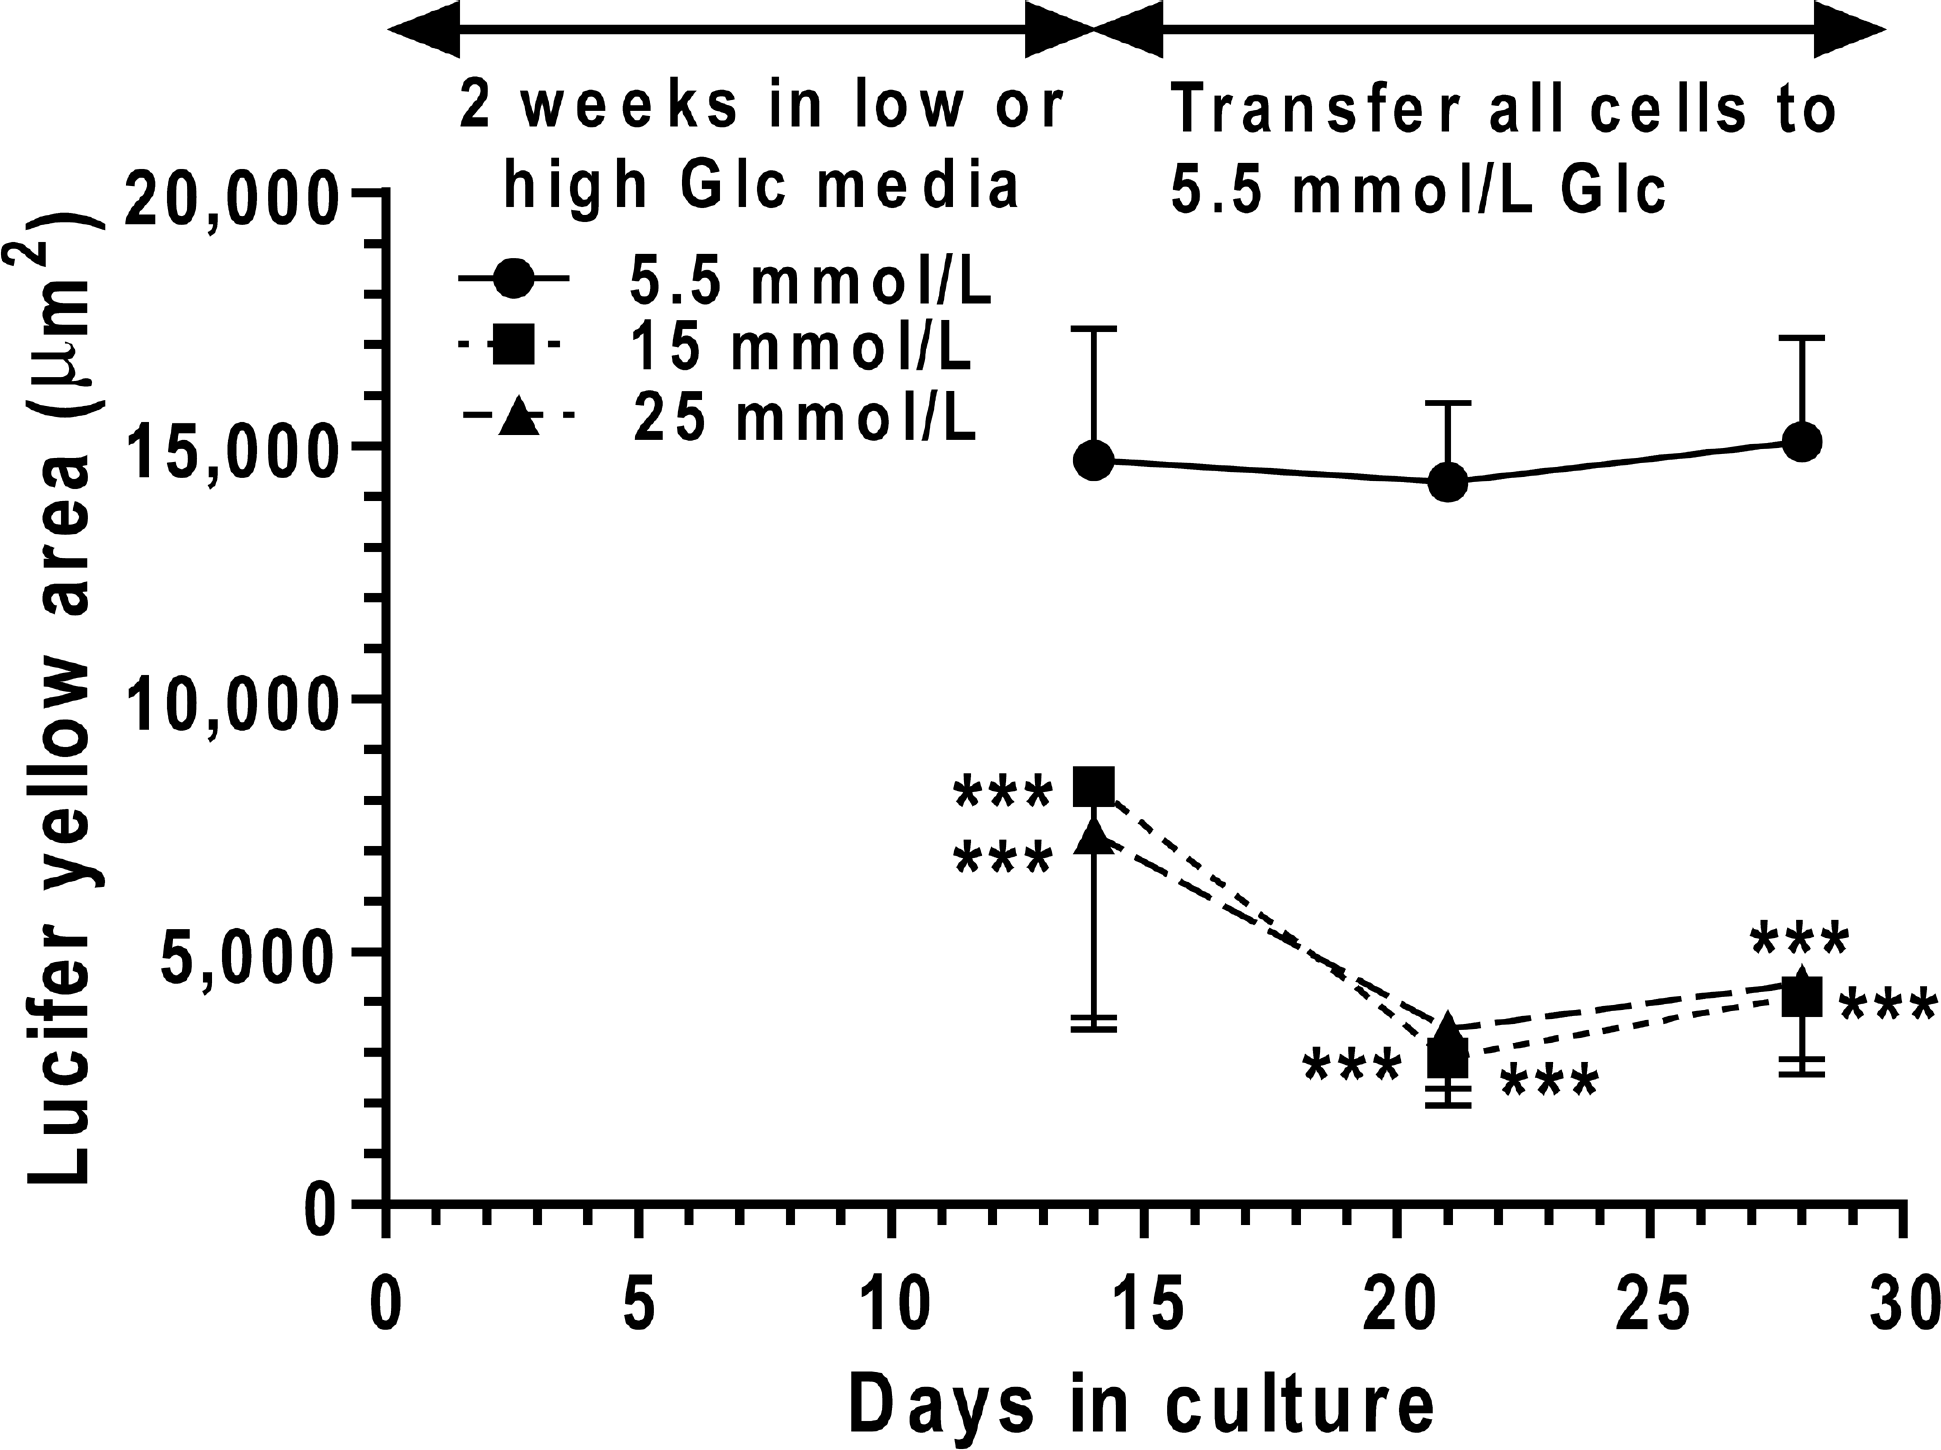
Cultured astrocytes were grown in medium containing the indicated glucose concentrations for 14 days. Then the cells grown in 15 or 25 mmol/l glucose were also cultured in medium containing 5.5 mmol/l glucose, and all cultures continued for an additional 7 or 14 days. At the time intervals indicated, dye transfer was assayed by impaling a single astrocyte with a micropipette, dye was diffused into the cell for 2 min and labelled area was measured. The respective number of samples/group at 21 and 28 days is as follows: 5.5 mmol/l glucose, n=20 and 10; 15 mmol/l glucose, n=10 and 10; and 25 mmol/l glucose, n=20 and 10. Cells in each experimental group were derived from at least three independent cultures. Values are means and vertical bars represent 1 S.D.; when bars are not visible, they are smaller than the symbol. *P<0.05, **P<0.01, ***P<0.001, for the indicated comparisons using ANOVA and Dunnett's test for multiple comparisons against the respective 5.5 mmol/l glucose group.
Oxidative stress precedes impairment of gap junctional communication
Because diabetes is associated with oxidative stress (Brownlee, 2005), DCF fluorescence was assayed at intervals after exposure of astrocytes to the high-glucose medium to assess changes in the levels of ROS and RNS. Increased DCF fluorescence was detectable after 1 day of exposure to high glucose, with a progressive rise with time in culture (Figure 4). Elevated ROS/RNS production preceded impairment of gap junctional communication that became evident only after 3-5 days of exposure to very high glucose (compare Figures 2E, 2F and 4).
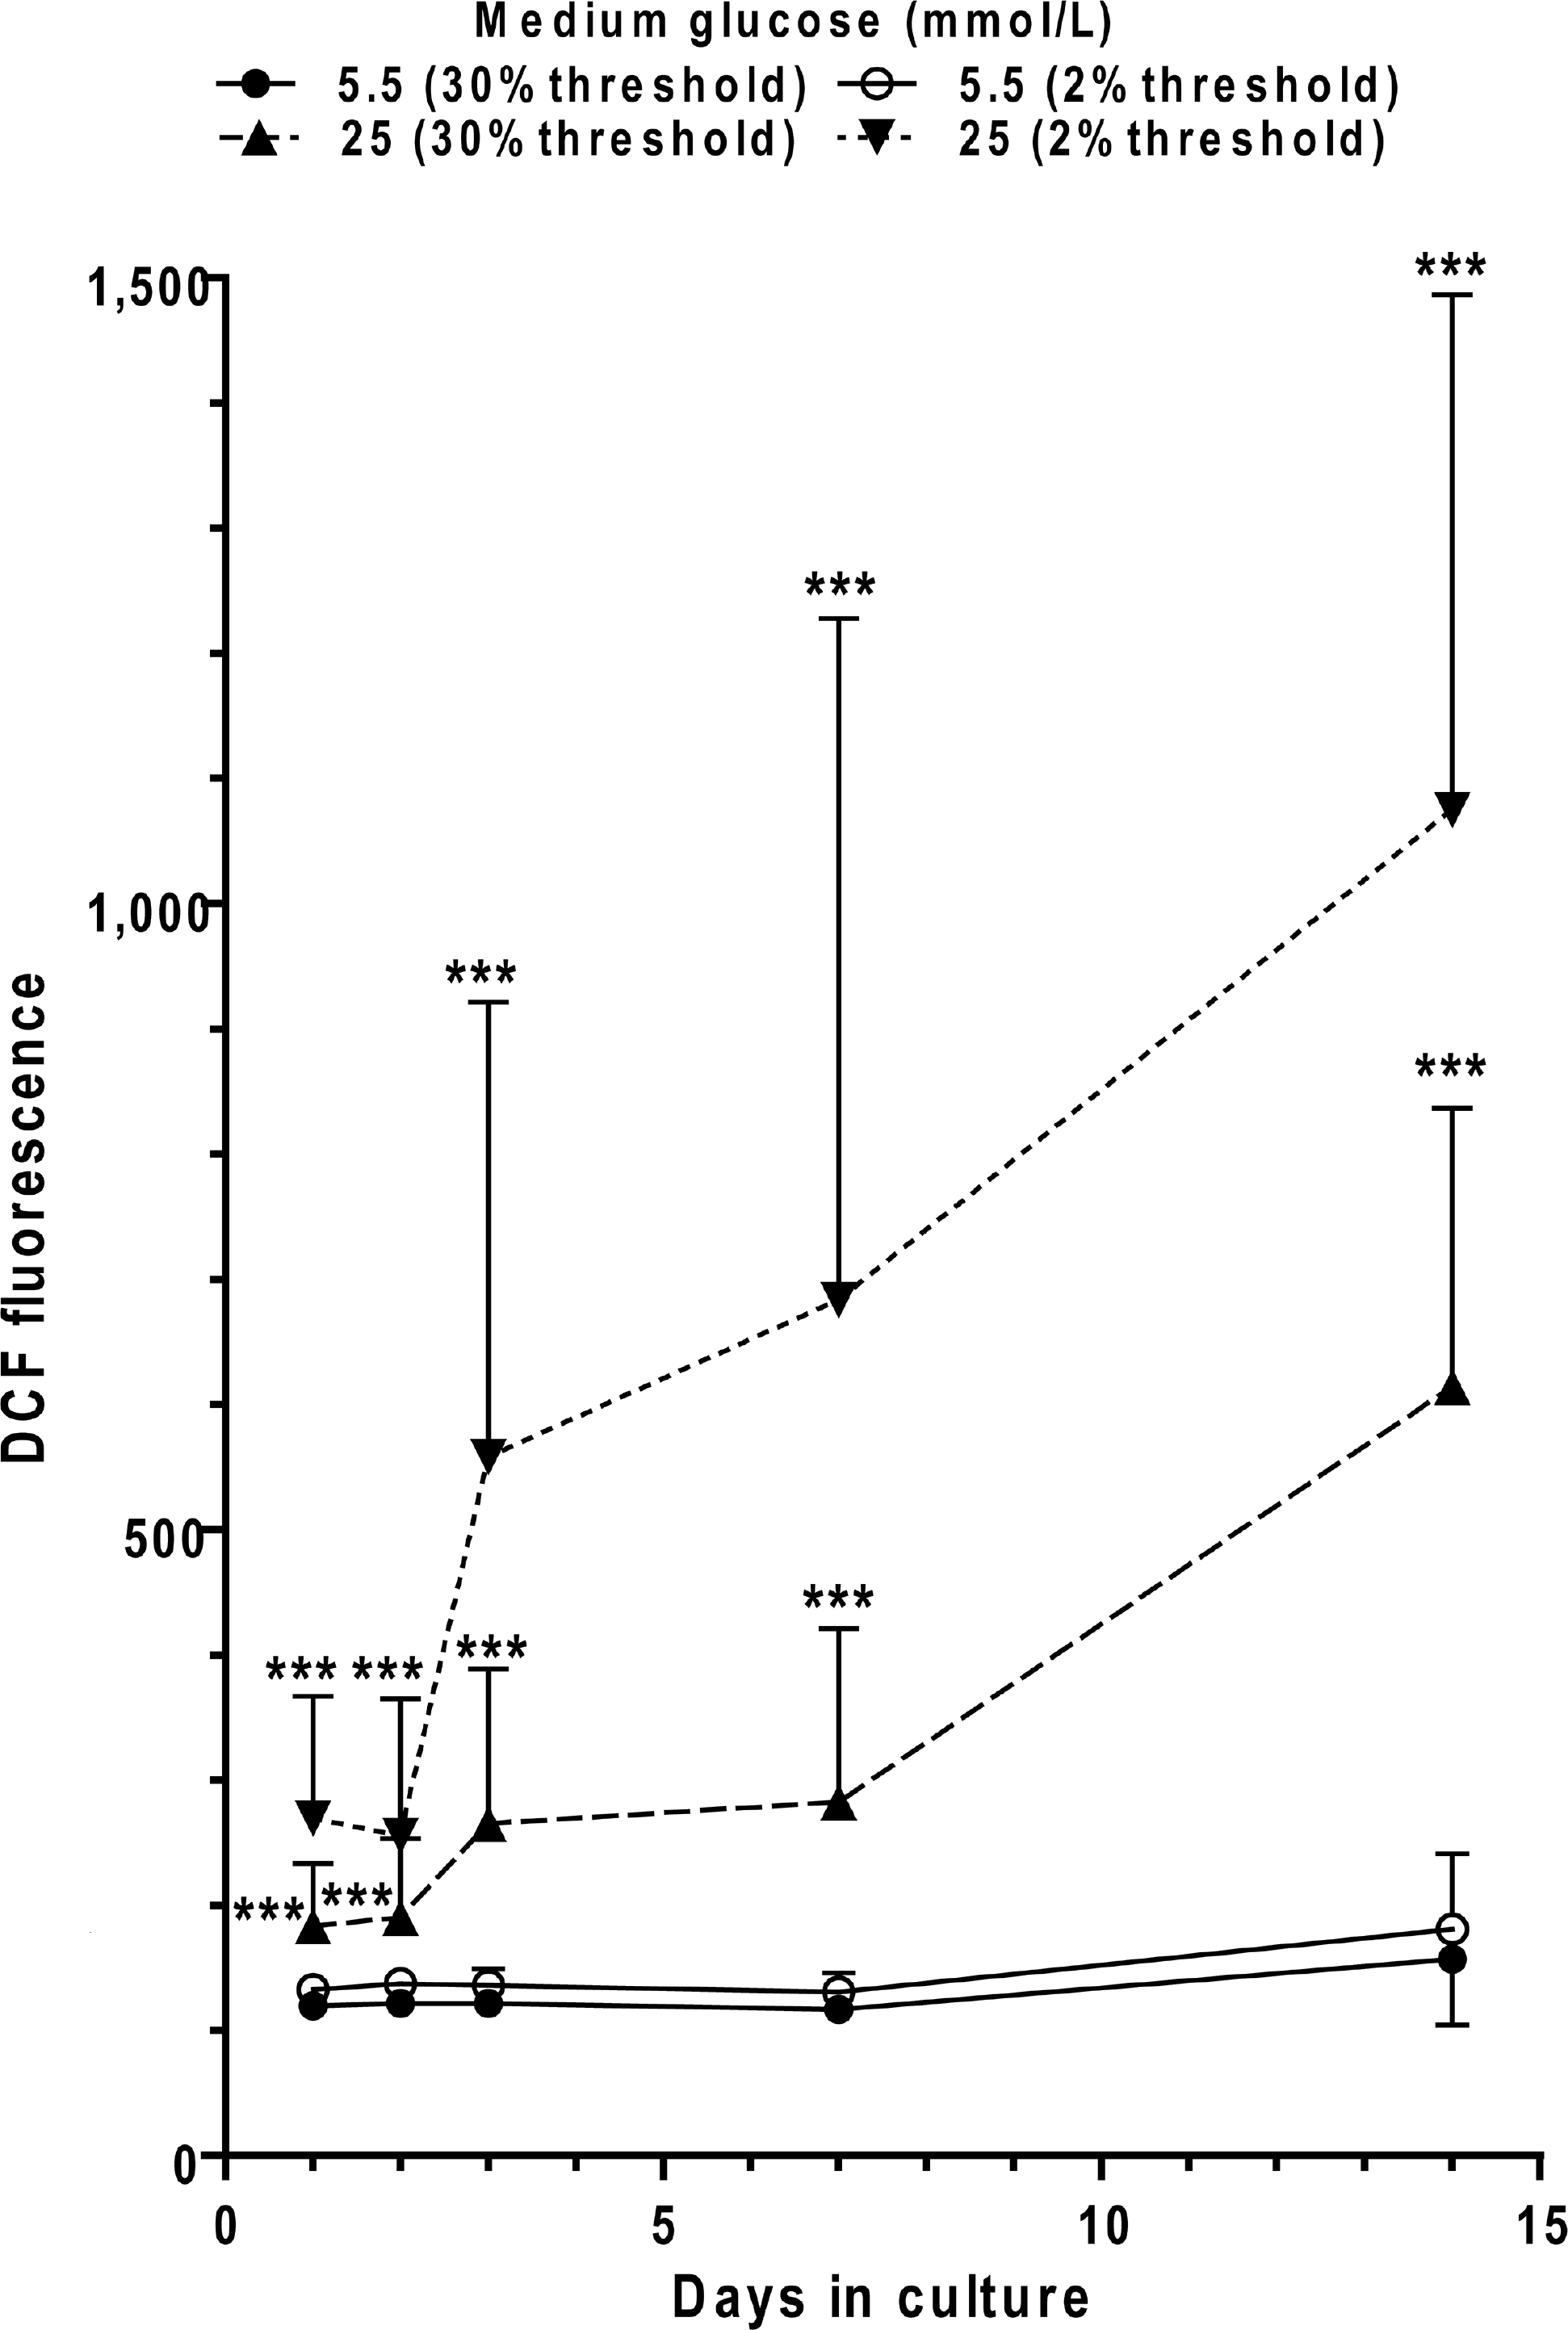
Cultured astrocytes were grown in media containing 5.5 or 25 mmol/l glucose for 14 days. ROS/RNS production was assayed by DCF fluorescence (30 min incubation in 10 mmol/l DCFDA) and quantified using MetaVue software, with thresholding to include either the highest 2% or 30% fluorescence intensities; thresholding at 30% excluded the background and thresholding at 2% quantified the small ‘hot spots’ that are readily visible in the images. The values thresholded at 2% and 30% were similar for cells grown in 5.5 mmol/l glucose; comparisons between the cells grown in 5.5 or 25 mmol/l glucose were made for each respective threshold value. Endogenous fluorescence in the absence of DCF was 114±3 (30% threshold) and 123±5 (2% threshold) for cells grown in 5.5 mmol/l glucose for 3 or 7 days, and slightly lower values were obtained for cells grown in 25 mmol/l glucose (results not shown). These control values for endogenous fluorescence were not subtracted from those in which DCF was added to assay NOS/ROS production, indicating that generation of DCF fluorescence by reactive species in low-glucose media is very low. The respective number of samples per group at 1, 2, 3, 7 and 14 days is as follows: 5.5 mmol/l glucose, n=30, 29, 30, 30 and 45; 25 mmol/l glucose, n=20, 17, 29, 15 and 35. Each sample represents analyses of images (200mm × 200 μm) of astrocytes grown on coverslips; results are from up to ten images per coverslip and three to five coverslips per group. Cells in each experimental group were derived from at least three independent cultures. Values are means and vertical bars represent 1 S.D.; when bars are not visible, they are smaller than the symbol. ***P<0.001, for the indicated comparisons using the unpaired, two-tailed t test against the respective 5.5 mmol/l glucose group.
Focal oxidative stress
The high-glucose cultures had focal ‘hot spots’ of greater DCF fluorescence intensities (quantified by thresholding the highest 2% fluorescence values; see the Materials and methods section) that averaged approximately twice those of the overall mean intensities in the high-glucose cultures (thresholded at 30%) at all time points (Figure 4). The hot spots in the hyperglycaemic cultures also had quite large S.D. values. In contrast, hot spots in the control cultures grown in 5.5 mmol/l glucose had fluorescence intensities closer to the overall mean intensities (Figure 4).
Magnitude of oxidative stress is variable in culture batches
In a replicate experiment (results not shown) in which astrocytes were grown in high or low glucose for 1, 3, 7 or 14 days (n=3-5 coverslips per group with 9-11 regions of interest assayed per coverslip for a total of 44-70 regions per group) the cells were incubated for 30 min in 30 μmol/l DCF-DA, and at each time point, DCF fluorescence was statistically significantly higher in cells grown in 25 mmol/l glucose compared with those in 5.5 mmol/l glucose (P<0.001). However, the mean DCF fluorescence intensities in the high-glucose cultures were more similar to each other at each time point, differing somewhat from the data set in Figure 4. The high glucose/low glucose ratio of DCF values in the replicate cultures was 1.86, 2.84, 2.04 and 2.67 at 1, 3, 7 and 14 days for threshold at 30%, and 2.52, 4.02, 2.42, and 4.78 respectively for the ‘hot spots’ quantified by thresholding at 2%. Thus the high-glucose cultures have higher DCF fluorescence than those grown in low glucose, but replicate assays can differ in magnitude. For unidentified reasons, some astrocytes grown in high glucose exhibited low DCF fluorescence at 14 days, but they still had reduced trafficking of LYVS. Unfortunately, the oxidative stress and gap junctional transfer assays do not permit longitudinal studies on the same cells; the properties of the cells before the assay are unknown.
Diabetic rat brain exhibits abnormal dye transfer and oxidative stress
The body weight of STZ-diabetic rats during the 13-20-week interval after onset of diabetes averaged 53±2% (n=4) of age-matched, vehicle-injected controls (n=4), and at 20 weeks, the respective body weights were 268±36 and 471±19 g. At the time of assay for dye transfer and oxidative stress, the arterial plasma glucose level in diabetic rats was elevated 4.1-fold compared with controls (33.1±5.2 and 8.0±0.9 mmol/l respectively; P<0.001), whereas arterial plasma lactate content was unchanged (2.2±0.7 and 2.2±0.4 mmol/l respectively). To verify that brain glucose levels were also elevated in our STZ rats, the glucose concentration was assayed in ethanol extracts of cerebral cortex dissected from funnel-frozen brains of two STZ rats, using previously described methods (Dienel et al., 2007). The brain glucose concentrations were 8.2 and 6.8 μmol/g, indicating that both plasma and brain glucose levels in the STZ rats used in the present study were within the range of the mean literature values tabulated in Table 1.
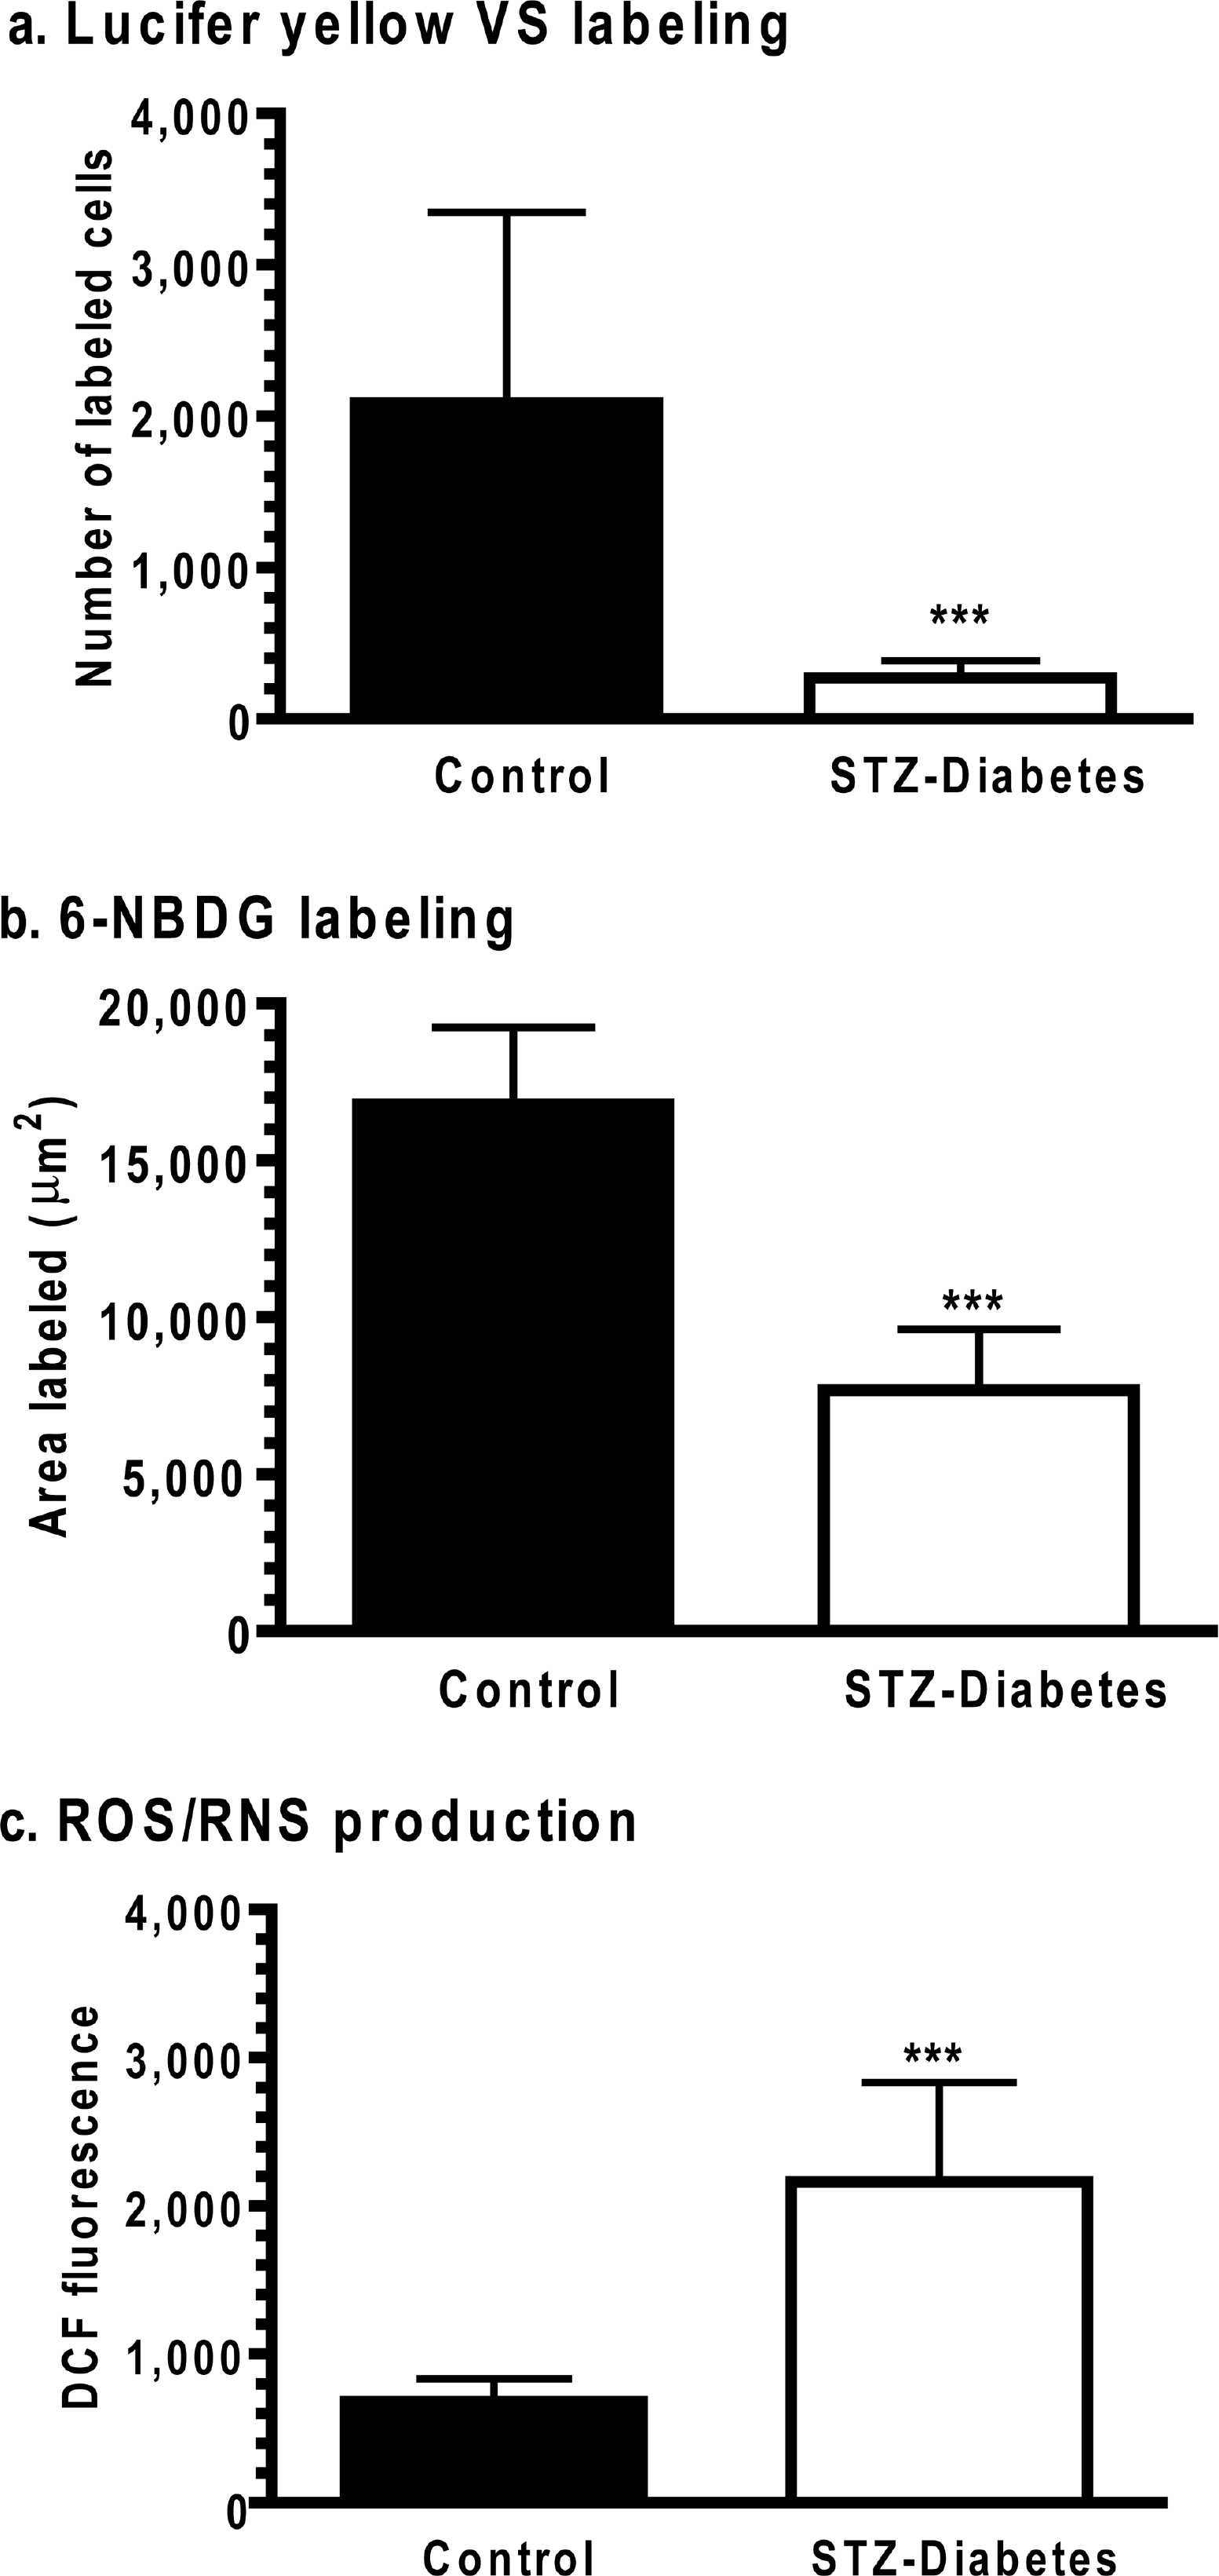
Dye transfer among gap junction coupled astrocytes was assayed by dye diffusion into single astrocytes in slices of the inferior colliculus from age-matched, vehicle-treated control and STZ-diabetic rats. Both Lucifer Yellow and 6-NBDG had greater dye labelling in slices from control rats (Figures 5A and 5C) compared with those from STZ-treated rats (Figures 5B and 5D). The number of LYVS-labelled cells was 7.7-fold higher in slices from control compared with diabetic rats (Figure 6A), whereas the area labelled by the fluorescent glucose analogue, 6-NBDG (342 Da), was 2.2-fold greater in control compared with diabetic rat slices (Figure 6B). DCF fluorescence in diabetic brain slices was 3.2 times that in controls (Figure 6C). Thus gap junctional communication was reduced and oxidative stress was increased in slices of the inferior colliculus from diabetic rats at 20-24 weeks after STZ treatment, as observed in cultured astrocytes that were exposed to much higher glucose levels for short time intervals (compare with Figures 2 and 4).
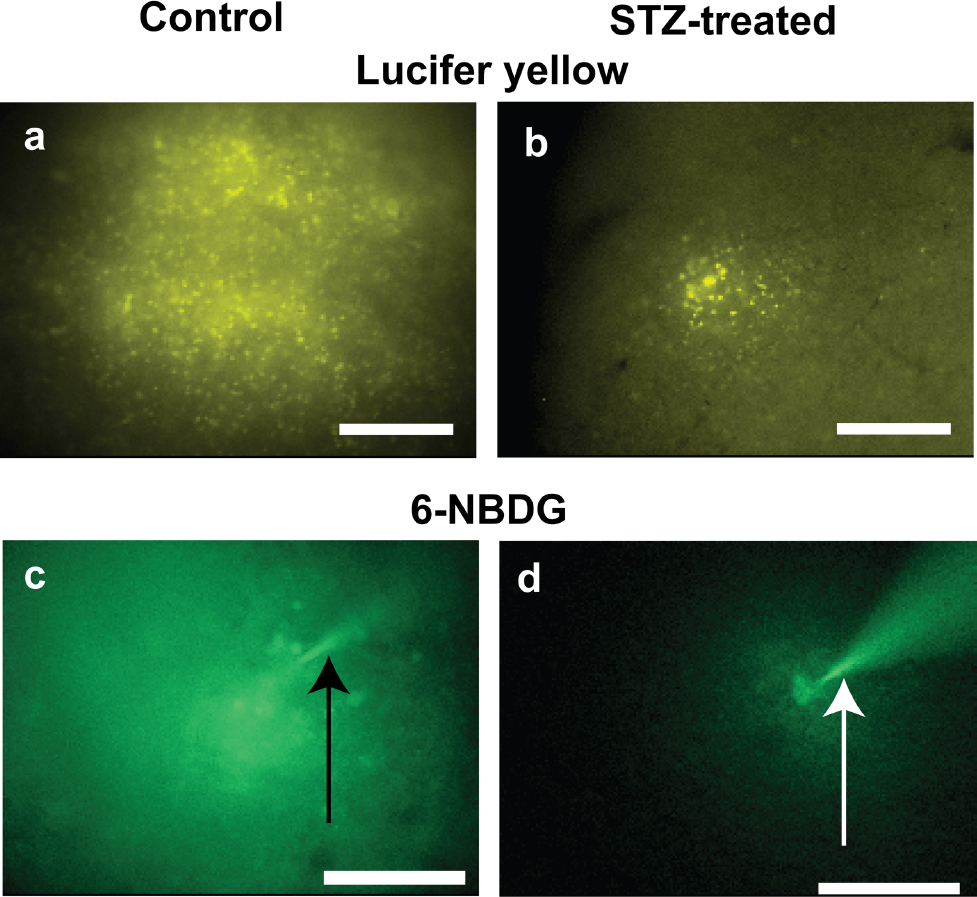
Gap junctional communication was assayed in slices of inferior colliculus from age-matched, vehicle-injected controls (
Dye transfer was assayed in slices of inferior colliculus from adult male rats at 20-24 weeks after the onset of STZ-induced diabetes and in age-matched, vehicle-injected controls by impaling a single astrocyte with ***a tracer-containing micropipette and diffusing the tracer for 5 min (for more details, see the legend to Figure 5). (
Pharmacological treatment can induce, prevent or restore changes in gap junctional permeability
ER stress is associated with obesity, insulin resistance and Type 2 diabetes, and treatment with chemical chaperones that reduce ER stress normalizes many pathophysiological consequences of Type 2 diabetes (Özcan et al., 2004, 2006). A toxin that induces ER stress, ROS/NOS blockers that can reduce oxidative stress (Cruthirds et al., 2005) and chemical chaperones known to facilitate protein folding (Welch and Brown, 1996; Özcan et al., 2006) were, therefore, tested for their ability to cause, prevent or restore deficits in gap junctional communication.
ER stress impairs gap junctional communication
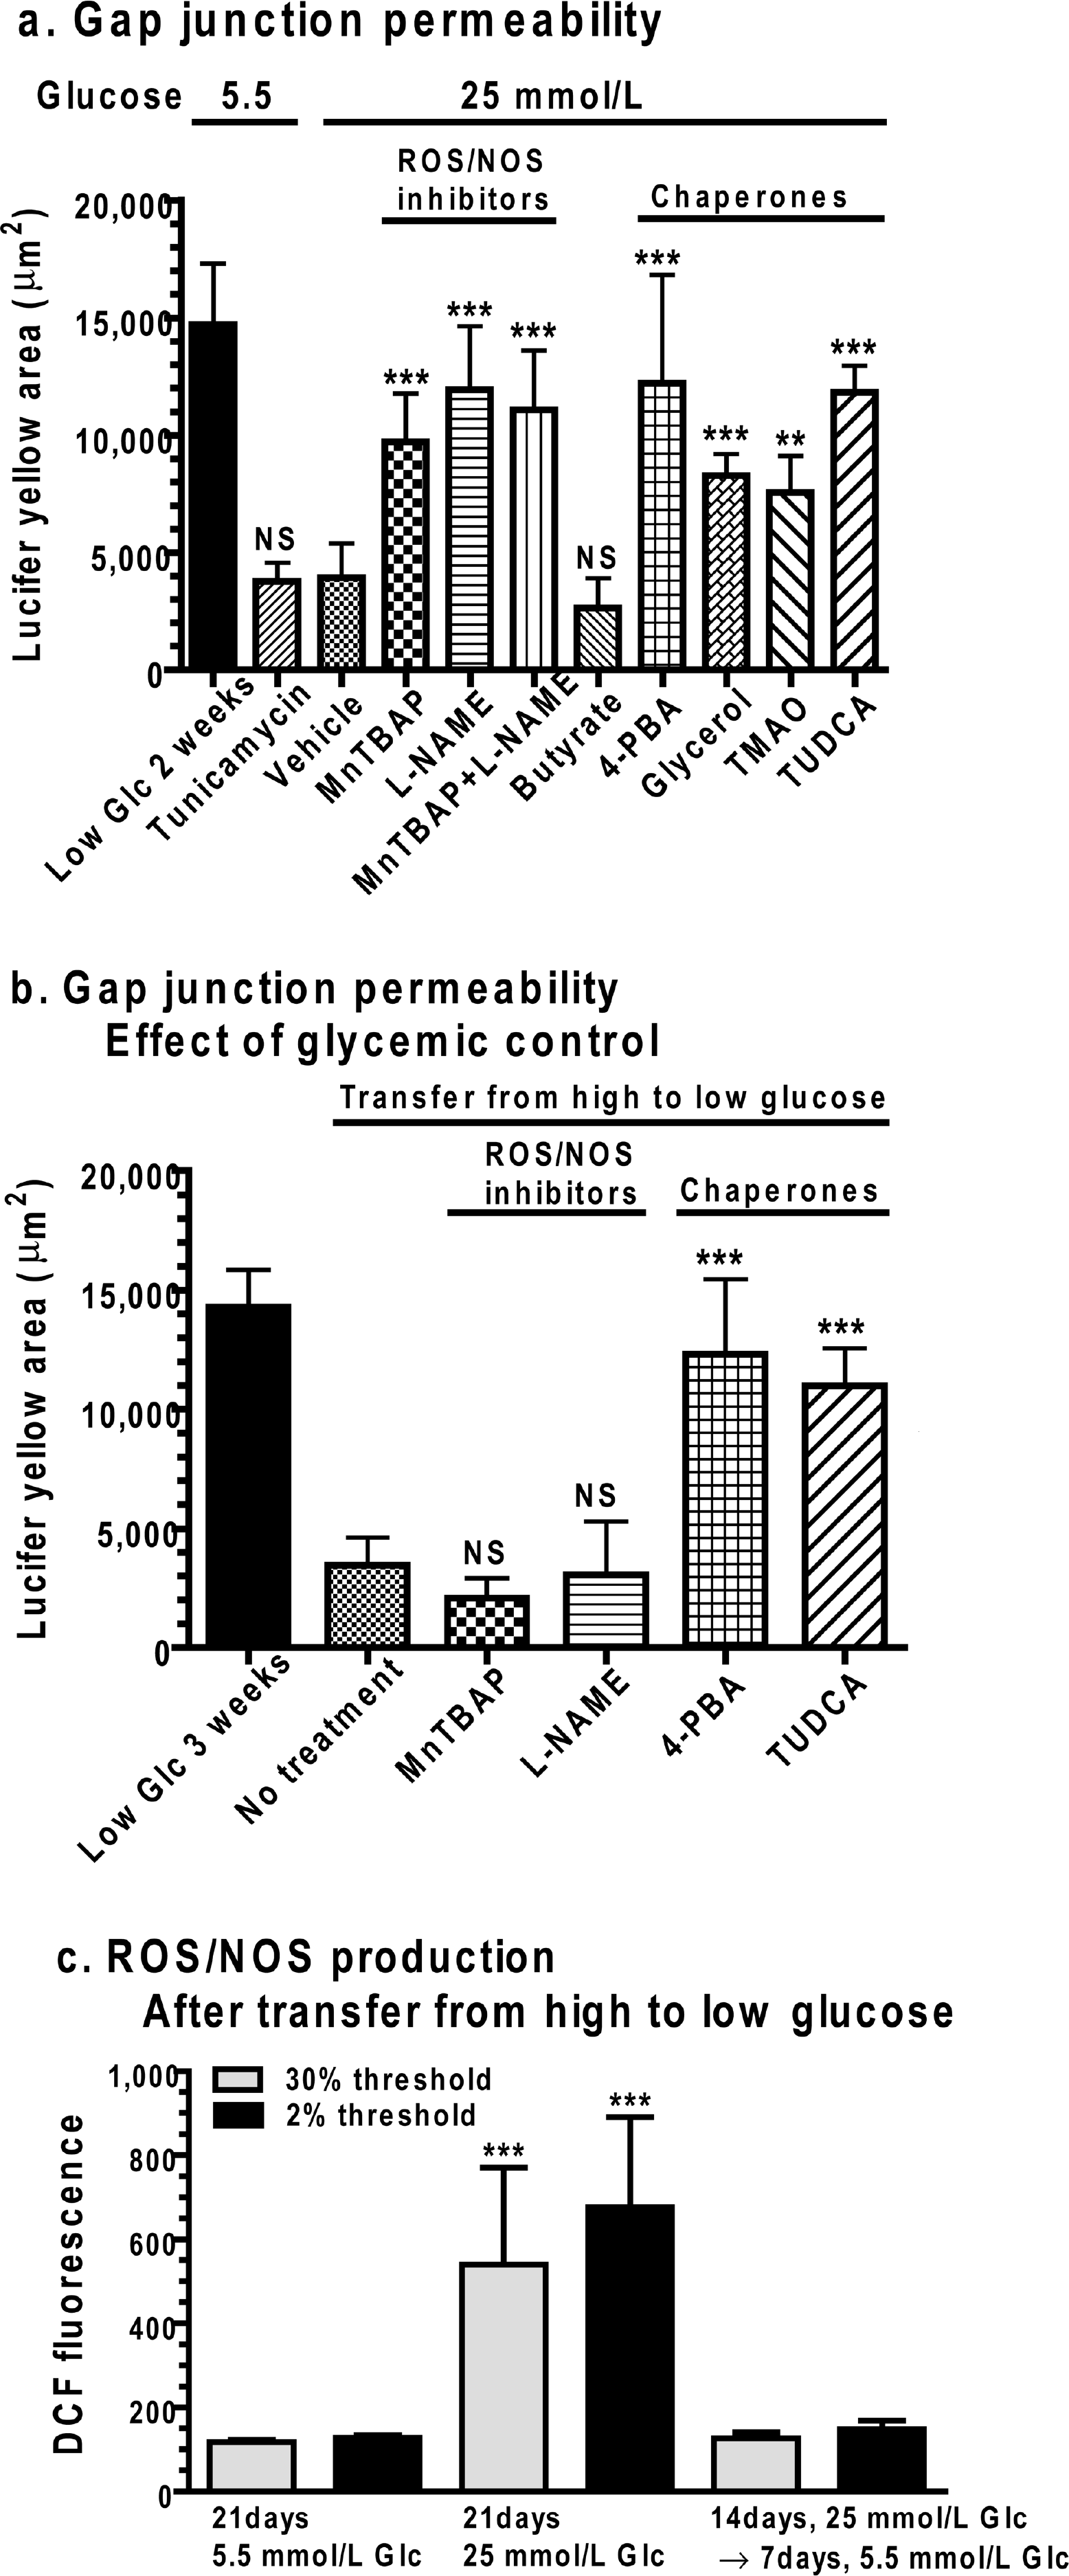
Tunicamycin is an inhibitor of N-acetylglucosamine transferases known to cause ER stress by blocking the formation of N-glycosidic protein-carbohydrate linkages and preventing the glycosylation of newly synthesized proteins in the ER. Astrocytes were grown for 2 weeks in low glucose and then treated with tunicamycin for 16 h and dye transfer was assayed. The dye-labelled area was reduced by tunicamycin to the low level observed in vehicle-treated cells that were grown in high glucose for 2 weeks (Figure 7A), i.e. the Lucifer Yellow-labelled area was approx. 4000 μm2 under both these conditions. For comparison with these values, astrocytes grown in low glucose for up to 3 weeks had a Lucifer Yellow-labelled area of approx. 15 000 μm2 (Figures 2 and 3) and the 2-3 week values for low-glucose cultures from Figures 2 and 3 are included in Figures 7(A) and 7(B) as reference values. However, to avoid additional multiple statistical comparisons against the same data sets, comparisons in Figures 7(A) and 7(B) were made against the vehicle-treated control grown in high glucose or the no treatment group in the high-to-low glucose transfer assay.
(
ROS/RNS inhibitors and chemical chaperones are protective in the presence of high glucose
Continuous 2-week treatment of cultured astrocytes grown in high glucose with MnTBAP, a superoxide dismutase mimetic, or with
Chaperones, not ROS/RNS inhibitors, restore the acquired deficit
Astrocytes were grown for 2 weeks in high glucose and then transferred to the low-glucose medium containing vehicle or other compounds for 7 days. The dye-labelled area in ***vehicle-treated astrocytes remained at the low level (Figure 7B) obtained for astrocytes previously grown in high glucose (compare with Figure 3). Inclusion of MnTBAP or
Oxidative stress is eliminated by transfer to low glucose
DCF fluorescence was elevated in cells grown in high glucose for 3 weeks compared with those grown in low glucose. However, when astrocytes were grown in high glucose for 2 weeks and then transferred to low glucose for an additional week, the level of oxidative stress fell to that of cells continuously grown in low glucose for 3 weeks (Figure 7C). Thus the decrement in gap junctional communication caused by prior exposure to high glucose persists (Figure 7B, no treatment group), even though oxidative stress is eliminated (Figure 7C) by reducing the glucose level in the culture medium.
Effect of gap junction permeability modulators on oxidative stress
The ROS/RNS blockers would be expected to improve gap junctional communication by reducing or preventing the rise in DCF fluorescence in cells grown in high glucose, whereas the chaperone molecules would not be expected to alter glucose-induced oxidative stress. To test these predictions, DCF fluorescence was assayed in two independent experiments using different batches of astrocytes that were grown for 2 weeks in 25 mmol/l glucose in the continuous presence of each of the test compounds shown in Figure 7(A) (n=30-40 samples per group per experiment). Unfortunately, the results in the replicate assays were variable (results not shown), and further work is required to identify factors that influence the response of DCF fluorescence intensity to these drug treatments.
Summary of results of pharmacological studies
Both prolonged exposure to high glucose and short-term tunicamycin treatment impair astrocytic gap junctional communication. In high-glucose cultures, oxidative stress is detectable on day 1 (Figure 4), whereas the fall in dye transfer becomes manifest at approx. 3-5 days (Figures 2E and 2F). Transfer of cells from high- to low-glucose medium was sufficient to reduce DCF fluorescence to control levels (Figure 7C), but not restore dye transfer to normal within 2 weeks (Figure 3). ROS/RNS inhibitors could prevent this deficit if included in the medium at the onset of exposure to high glucose (Figure 7A), but could not improve the acquired deficit that persisted in the low-glucose medium (Figure 7B). Chaperone treatment could, however, restore the gap junctional deficit in the presence of high glucose (Figure 7A), as well as in the presence (Figure 7A) or absence (Figures 7B and 7C) of elevated DCF fluorescence. Thus prolonged antecedent oxidative stress is linked to reduced gap junctional trafficking, but reducing ROS/RNS levels after the onset of the deficit did not restore dye transfer (Figure 3). In sharp contrast, the persistent change in Cx function acquired by growth in high glucose was ameliorated by four different chaperone molecules that can improve protein folding
Immunoreactive Cx protein
All astrocytes exhibited immunostaining for Cx43, Cx30 and Cx26, with the most intense immunoreactivity mainly in intracellular material, as illustrated for astrocytes grown for 2 weeks in 5.5 mmol/l glucose (Figure 8, left column). Intracellular immunostained Cx protein can include ER, Golgi apparatus and cytoplasmic vesicles (Wolff et al., 1998 and references cited therein), and punctate, vesicle-like intracellular staining in astrocytes is evident in other studies (e.g. Ye et al., 2003). The area of the immunoreactive punctate structures in astrocytes grown in high glucose was reduced to approx. 50% and 25% of that in the low-glucose cultures respectively for Cx43 and Cx30, whereas that for Cx26 was unaffected (Figure 8, right column). Thus the morphological appearance of immunoreactive Cx protein is selectively influenced by medium glucose concentration, perhaps reflecting changes in trafficking or turnover of these proteins.
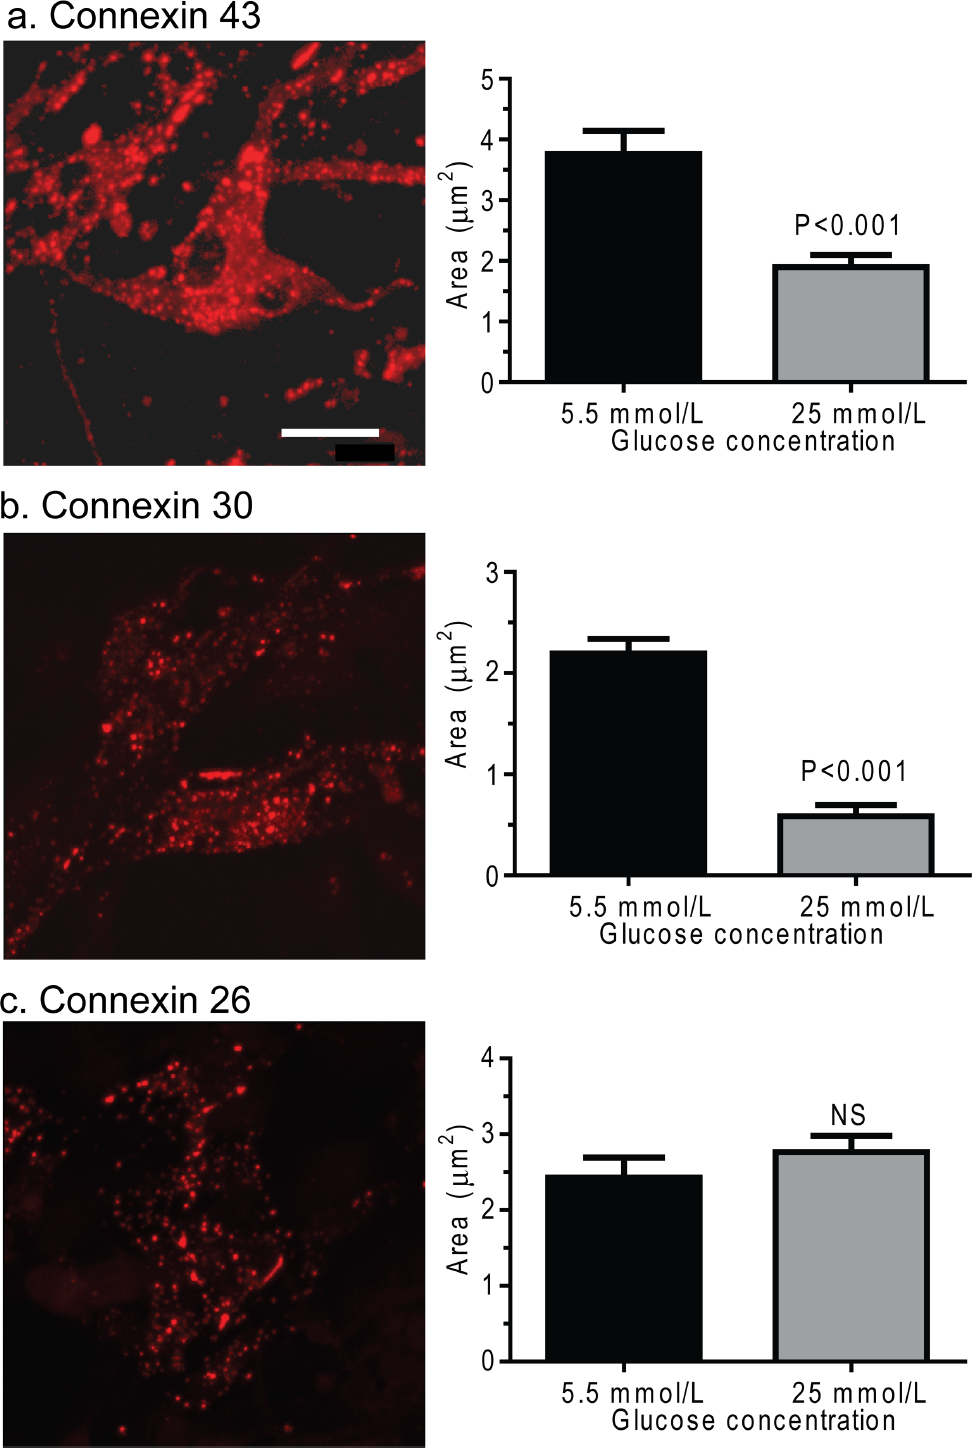
Composite z-stacks of confocal images (left column) of immunostained astrocytes showed a low-intensity background and prominent staining of punctate or vesicular immunoreactive material that appeared to be mainly intracellular. This morphological appearance of immunostaining was evident for Cx43 (
DISCUSSION
Prolonged hyperglycaemia interferes with astrocytic gap junctional communication
The two major findings of the present study are that chronic hyperglycaemia and STZ-induced diabetes markedly reduce gap junctional dye transfer among astrocytes and that the impairment of gap junctional communication can be prevented and rescued by pharmacological treatment with compounds that reduce oxidative stress or improve protein folding. Impaired transcellular communication had a slow onset and, once established, it was poorly reversible by subsequent glycaemic control. This deficit was detectable with three tracers of different sizes and charges (Lucifer Yellow, Alexa Fluor® 350 and 6-NBDG, a non-metabolizable glucose analogue), and the scrape-loading assays indicate that it did not arise from differential dye release by hyperglycaemic cells via pannexin pores or Cx hemichannels (Figures 1–3). Because increased DCF fluorescence preceded the onset of the decline in gap junctional permeability by 3-5 days and ROS/RNS blockers could prevent but not rescue the decrement (Figures 4 and 7), damage arising from oxidative stress may be a causative factor. Acute tunicamycin treatment generates abnormal newly synthesized proteins, causes ER stress and impairs dye transfer within 16 h without hyperglycaemia and oxidative stress. However, results of our ongoing studies indicate that expression of selected markers for ER stress is delayed compared with onset of reduced gap junctional communication in hyperglycaemic cultured astrocytes, suggesting that gap junctional impairment may be an early, relatively selective event in the pathophysiology of diabetes.
High glucose is sufficient to impair gap junctional communication
The effects of chronic hyperglycaemia and complications of diabetes are very complex, and relationships among pathophysiology, threshold glucose level and cumulative exposure to elevated glucose concentrations are very difficult to define. However, tissue culture experiments demonstrate that severe, chronic hyperglycaemia itself is sufficient to disrupt gap junctional communication in astrocytes in the absence of endocrine dysfunction and multiorgan interactions. Both of our experimental model systems, cultured astrocytes and STZ-rats, have high glucose concentration as a variable, but they differ with respect to maximal glucose level, cumulative exposure and effects of interactions among brain cell types and among body organs. Cumulative exposure can be expressed as the product of glucose concentration multiplied by time, or the area under a plot of concentration as a function of time. Different pathophysiological processes can be expected to take place at various threshold levels of glucose concentration. For example, glucose flux into the sorbitol pathway will progressively increase as glucose concentration rises above normal due to the high K m of aldose reductase for glucose (∼25 mM). The threshold concentrations and cumulative exposure required to cause various effects of elevated glucose (e.g. non-enzymatic glycation reactions, oxidative stress and disruption of signalling pathways) are unknown, but these effects could be expected to increase with glucose level and duration of exposure (Mîinea et al., 2002). Brain glucose levels are lower than in peripheral tissues owing to the restrictive transport properties of the blood-brain barrier (Table 1), but diabetic patients live with the disease for decades, facilitating cumulative CNS (central nervous system) effects of chronic hyperglycaemia.
Growth of cultured cells under severely hyperglycaemic conditions is a pathophysiological condition relevant to diabetes. Commercially available tissue culture media can contain glucose concentrations ranging from 0 to 25 mmol/l and, for example, DMEM is formulated with 0, 5.56 or 25 mmol/l glucose, Ham's nutrient mixtures can have 7, 10 or 17.5 mmol/l glucose and Neurobasal™ medium (Brewer et al., 1993) contains 25 mmol/l glucose. Even a ‘low-glucose’ medium, 5-6 mmol/l glucose, is approximately twice the normal rat brain glucose concentration (i.e. approx. 2-3 μmol/g) and is equivalent to severe diabetes in rat brain (Table 1). Growth of astrocytes in 22 mmol/l glucose reduces both glucose and lactate oxidation by approx. 50% compared with cells grown in 2 mmol/l glucose (Abe et al., 2006), and would be expected to predispose astrocytes grown in high glucose to increased glycolytic metabolism and greater lactate release. In cultured neurons, the lactate dehydrogenase isoenzyme pattern was not altered by medium glucose level (5.5, 13.4 or 26.8 mmol/l; O'Brien et al., 2007), but Kleman et al. (2008) emphasize the negative effects of high glucose levels on the viability of cultured neurons and neuronal responsiveness to the AMPK (AMP-activated protein kinase) energy signalling system. High glucose may or may not influence experimental outcome, but diabetic complications are, nevertheless, a concern for astrocytes and neurons grown in high glucose, and it is important to re-evaluate the results of such studies (e.g. 20 mmol/l glucose: Ye et al., 2001, 2003, 2009; McCoy and Sontheimer, 2010; 25 mmol/l glucose: Sorg and Magistretti, 1991; Yu et al., 1993; Takahashi et al., 1995; Itoh et al., 2003; Pellerin and Magistretti, 2005, 1994; Chenal and Pellerin, 2007; and 50 mmol/l glucose: Bliss et al., 2004). Also, Methods sections in published studies sometimes only identify the ‘generic’ culture medium (e.g. DMEM) without stating the glucose level or other key constituents; ideally, the catalogue number of the medium should be reported so its formulation is available. The use of normal brain tissue glucose levels for growth of cultured cells with twice-weekly feeding schedules may also have nutritional complexities. For example, our unpublished data (K.K. Ball, N.F. Cruz and G.A. Dienel) indicate that astrocytes grown in 5.5 mmol/l glucose consume most of the glucose within approx. 12-18 h, with release of lactate to the medium; this lactate can be subsequently consumed as an oxidative substrate, along with glutamine and other substrates in the medium. Daily replenishment of glucose and other nutrients and removal of lactate and other compounds released to the culture medium may be necessary to control levels of extracellular metabolites, but total medium replacement could also negatively affect the cells due to various ‘stresses’ associated with removal from the incubator and medium change, e.g. shear stress to the surface of the cells, transient loss of CO2 and buffering capacity, and transient hypoxia and hypothermia.
Abnormal proteins and therapeutic potential
Covalent protein modification can arise from various causes known to occur in diabetes, e.g. non-enzymatic glycation reactions and formation of advanced glycation ***end-products, protein carbonylation reactions, and altered regulation of gene expression and signalling pathways causing abnormal phosphorylation or nitrosylation states (Bonnefont-Rousselot, 2002; Brownlee, 2005). The ability of four different chaperone molecules that can facilitate protein folding in other experimental systems to (i) prevent the decline in dye transfer even in the presence of high glucose levels and oxidative stress and (ii) rescue an established deficit (Figure 7) suggests that changes to Cx proteins secondary to oxidative stress may cause abnormal protein structure, folding, ***protein-protein interactions or protein trafficking that may be reflected by the morphological changes in intracellular non-junctional immunoreactive Cx 43 and 30 protein (Figure 8). Further work is required to evaluate the contributions of these possibilities to altered non-junctional immunoreactive material in diabetic astrocytes. Poor reversibility of gap junctional communication after reversion to low-glucose culture media (Figures 3 and 7B) underscores the importance of continuous, strict glycaemic control in diabetic patients. The effectiveness of treatment with chaperones (Figure 7) that are already approved for human use (e.g. 4-phenylbutyrate and TUDCA; (Özcan et al., 2006) opens a therapeutic avenue to improve gap junctional intercellular trafficking that is effective in the presence of high glucose levels, oxidative stress and metabolic disturbances.
Involvement of different Cxs in many cell types during experimental diabetes
Dysfunction of any or all the three astrocytic Cxs (Cx43, Cx30 and Cx26), as well as Cx-associated proteins, may contribute to the functional deficit of gap junctional trafficking of small molecules during experimental diabetes and would be anticipated to affect transcellular communication via channels that comprise these Cxs in all body tissues, not just brain. Because Cx30 channels are not permeable to LYCH (Manthey et al., 2001), the abnormal transfer of Lucifer Yellow may involve Cx43 and Cx26 channels that are permeant to this dye (Elfgang et al., 1995). Cx43 may be a major ‘target’ of diabetes in astrocytes, as well in other organs, as suggested by previous studies in other cell types.
Gap junctional communication in a number of cell types is inhibited by growth in high-glucose media ranging from 14 to 30 mmol/l for different intervals (1-9 days) compared with cells grown in 5-5.5 mmol/l glucose, and decrements have been documented in endothelial cells in the aorta (Inoguchi et al., 1995, 2001), in the retina (Fernandes et al., 2004) and in epididymal fat pads (Sato et al., 2002; Li and Roy, 2009), in smooth muscle cells in aorta (Kuroki et al., 1998; Inoguchi et al., 2001), in pigment epithelial cells in retina (Stalmans and Himpens, 1997; Malfait et al., 2001), and in pericytes in retina (Li et al., 2003). These studies have linked dye transfer deficits to altered PKC (protein kinase C) signalling, increased phosphorylation of Cx43, reduced Cx43 mRNA and protein levels, low Cx43 plaque counts, and increased proteosomemediated degradation of Cx43. Consistent with the above findings are reports that propagation of calcium waves is inhibited in hyperglycaemic and PKC-activated retinal pigment epithelial cells (Stalmans and Himpens, 1997), as well as in PKC-activated astrocytes (Enkvist and McCarthy, 1992). In STZ-diabetic rats, dye transfer is reduced in acutely isolated pericytes in retinal microvessels after 5-18 days of diabetes (Oku et al., 2001). Also, the increased duration of QRS waves in electrocardiograms from STZ-diabetic rats is associated with increased phosphorylation of Cx43 that is linked to activation of PKC, with either unchanged or reduced Cx43 protein levels (Inoguchi et al., 2001; Lin et al., 2006, 2008; Howarth et al., 2008). However, in coronary endothelial cells isolated from STZ-diabetic mice, Cx40 is a critical element in loss of gap junction intercellular communication; its levels are reduced, along with those of Cx37, but not Cx43, and high glucose impairs capillary network formation in vitro (Makino et al., 2008). Together, the above findings indicate that gap junctional communication is abnormal in many organ systems exposed to prolonged hyperglycaemia and experimental diabetes, with tissue- and organ-specific effects. The brain is generally considered to be affected by diabetes to a lesser extent than peripheral organs, but gap junctional trafficking among astrocytes, retinal cells and endothelial cells is markedly reduced.
Roles of gap junctions in pathophysiology of diabetes and Alzheimer's disease
Gap junction-coupled astrocytes are involved in integration of neurotransmission, energetics and blood flow at a local level, and impaired syncytial communication by means of cytoplasmic signalling, redox and energy-related molecules can contribute to brain dysfunction. For example, lack of Ins(1,4,5)P 3 signalling arising from mutations in Cx26 in non-neuronal support cells in the cochlea is sufficient to cause deafness (Beltramello et al., 2005), indicating that a sensory loss associated with neurons can arise from dysfunction of other cell types whose roles are required for processing of sensory information. Gap junctions have important roles in regulation of vascular function (Figueroa and Duling, 2009), and the brain's vasculature is surrounded by astrocytic endfeet that are extensively coupled with each other by gap junctions that facilitate long-distance dye transfer along the vasculature when dye is diffused into a single astrocyte (Ball et al., 2007). Thus it is likely that signals among cells within the ‘neurovascular unit’ that comprises neurons, astrocytes and endothelial cells would be disrupted by impairment of gap junctional communication between astrocytic processes and their endfeet. As discussed above, hyperglycaemia induces abnormalities in Cx proteins and signalling in astrocytes, endothelial cells in different tissues, vascular smooth muscle cells, and retinal pericytes. Microvascular pathology is common to diabetes and Alzheimer's disease (Luchsinger and Gustafson, 2009; Sonnen et al., 2009), STZ-diabetic rats exhibit increased levels of amyloid β-peptide and phosphorylated tau protein (Li et al., 2007), hyperglycaemia exacerbates pathophysiological changes and cognitive decline in pre-symptomatic Alzheimer's mice (Burdo et al., 2009), and aged Alzheimer model mice have altered astrocytic networks (Peters et al., 2009). Taken together, these findings suggest that impairment of astrocytic gap junctional trafficking may contribute to the pathology of the microvasculature in brain and, ultimately, to sensory and cognitive decline in diabetes and Alzheimer's disease. In addition, involvement of abnormalities in gap junctional communication in vascular endothelial and smooth muscle cells and cardiac cells may underlie or contribute to complications of diabetes in the cardiovascular system and other organs.
Footnotes
Funding
This work was supported by NIH (