
Abstract
The ability of an AEF (axolemma-enriched fraction) to influence the proliferation, survival and differentiation of OPC (oligodendrocyte progenitor cells) was evaluated. Following addition of AEF to cultured OPC, the AEF associated with the outer surface of OPC so that subsequent metabolic events were likely mediated by direct AEF-OPC contact. Addition of AEF to the cultured OPC resulted in a dose- and time-dependent increase in proliferation that was partially dependent on Akt (protein kinase B) and MAPK (mitogen-activated protein kinase) activation. The major mitogen in an AEF-SE (soluble 2.0 M NaCl extract of the AEF) was identified as aFGF (acidic fibroblast growth factor) and accounted for 50% of the mitogenicity. The remaining 50% of the mitogenicity had properties consistent with bFGF (basic fibroblast growth factor) but was not unequivocally identified. Under conditions that limit the survival of OPC in culture, AEF treatment prolonged the survival of the OPC. Antigenic and morphological examination of the AEF-treated OPC indicated that the AEF treatment helped the OPC survive in a more immature state. The potential downstream metabolic pathways potentially activated in OPC by AEF and the consequences of these activated pathways are discussed. The results of these studies are consistent with the view that direct contact of axons with OPC stimulates their proliferation and survival while preventing their differentiation.
Keywords
INTRODUCTION
The influence of axons on oligodendrocyte development has been controversial (Barres and Raff, 1999). While a number of researchers have reported that axons regulate OPC (oligodendrocyte progenitor cell) proliferation (Barres and Raff, 1993), the role of the axon in the differentiation of OPCs is less clear. OPCs can differentiate into oligodendrocytes in the absence of axons (Abney et al., 1981), giving rise to the idea that OPCs contain an intrinsic timer related to cell division that regulates their development. Support for this view has previously been reported by Dugas et al. (2007) who showed that p57(kip2) may be an intracellular timer that regulates how many times an OPC can divide prior to differentiating. Alternatively, a more recent analysis of the transcriptome of OPCs reveals three enriched signalling pathways in OPCs, which the authors postulate are influenced by cell-cell signalling pathways (Cahoy et al., 2008). A role for axons in preventing early differentiation of OPC via the axonal Jagged ligand and Notch receptor on the OPC has also been postulated (Wang et al., 1998). It is important to note that most of these studies have utilized as an axonal source the easily accessible optic nerve in neonatal animals. However, in the adult CNS (central nervous system) during demyelinating disease, it is the mature demyelinated axon that must reinitiate the OPC proliferation and possibly differentiation. Our laboratory has devised a method to isolate an AEF (axolemma-enriched fraction) from the mature CNS (Detskey et al., 1988) that retains its ability to influence the differentiation and proliferation of myelinating glial cells (Yoshino et al., 1984; Chen and DeVries 1989). In the present study, we examined the potential of the axonal plasma membrane derived from the adult CNS to influence the proliferation, differentiation and survival of OPC. These data are significant, since it has been reported that active demyelinating lesions contain intact OPCs that fail to be stimulated by mature demyelinated axons (Breij et al., 2008). It is postulated that this lack of remyelination is possibly due to a loss of axon-oligodendrocyte communication.
METHODS
All animals used in the present study were housed in the Hines VA Animal Facility, and procedures were approved by the Hines Animal Care and Use Committee and conducted in accordance with the guidelines in “Guide for the Care and Use of Laboratory Animals” from the National Institutes of Health.
Preparation of AEFs
AEF isolation from bovine white matter has been previously described (Zetusky et al., 1979; Detskey et al., 1988). In brief, bovine CNS white matter was homogenized and centrifuged to obtain a floating layer of myelinated axons. The myelinated axons were osmotically shocked to release the myelin from the axonal plasma membrane, followed by separation of the shocked myelinated axons in a 10-40% continuous sucrose gradient. To control for any variation in starting tissue sample, multiple AEF preparations were made and tested in multiple experiments.
Primary cell culture
OPCs were prepared from postnatal day 2 Sprague-Dawley rat pups using the method of McCarthy and De Vellis (1986). Cortices were dissected from approx. 25 pups, suspended in DMEM-F12 [Dulbecco's modified Eagle's medium-nutrient mixture F-12 (Ham's F12 nutrient medium); Invitrogen] and treated for 30 min at 37°C with 0.25% trypsin (Invitrogen). Trypsin digestion was inactivated by the addition of FCS (fetal calf serum; Hyclone) and the tissue dissociated using a 14-gauge needle. Following dissociation, the cells were centrifuged at 1000 g for 15 min to form a pellet that was resuspended in DMEM-F12 with 10% (v/v) FCS. The mixed-glial cell suspension was added to poly-
MAPK (mitogen-activated protein kinase) and Akt (protein kinase B) kinase activation and Western blot analysis
OPC were plated on to poly-
Immunocytodiemistry
OPCs were plated on to poly-
OPC proliferation assays
OPC were plated on poly-
In order to confirm results obtained with the CyQuant assay, an MTT [3-(4,5-dimethylthiazol-2-yl)-2,5-diphenyl-2H-tetrazolium bromide] assay was used to determine the cell number following treatment with AEF. The MTT assay is based on the conversion of MTT into insoluble formazan, which can then be solubilized and the concentration determined by attenuance (D) at 540 nm. The attenuance can be correlated to the number of cells present in the well. OPCs were plated at 6000 cells/well in poly-L-lysine-coated 96-well plates, allowed to attach and treated with AEF in basal DMEM without Phenol Red for 48 h. MEK [MAPK/ERK (extracellular-signal-regulated kinase) kinase] inhibitor (PD-98059, Biomol) was used at 10-50 μM and the Akt kinase inhibitor, triciribine (Biomol) was used at 1-100 μM. Following AEF treatment, 10 μl of MTT stock solution was added to each well and incubated at 37°C for 4 h. Following the incubation, 85 μl of medium was removed from each well and 50 μl of DMSO was added to each well and the plate was incubated at 37°C for 10 min. Plates were read on the PerSeptive Biosystems CytoFluor Series 4000 Multiwell Plate Reader at 540 nm. Attenuance values from wells with no cells were subtracted from treatment wells to account for background signal. Mean attenuance values from triplicate runs were expressed as a percentage and untreated OPCs were set to 100%. Significance of change in percent proliferation was compared between AEF-treated and AEF-treated with addition of kinase inhibitor using a paired t test with significance at P<0.05.
In the experiments designed to extract the mitogen from the AEF, the more sensitive 3H-thymidine incorporation assay was used to determine cell proliferation. In this assay, OPCs were seeded on PDL-coated 96-well plate in defined medium plus 1% horse serum at a cell density of 4 × 10 cells/well. The cells were allowed to attach for 24 h before the serum-containing medium was removed. The cultures were washed twice with PBS and shifted to defined medium for another 48 h. Membrane fraction or soluble mitogen in 100 μl was added to each well for 72 h and 3 piCi/ml of 3H-thymidine was added to the cultures 24 h after the mitogen was added. The cultures were washed with PBS and treated with 0.25% trypsin at 37°C for 60 min. The cells were collected on to a filter paper using a Titertek cell harvester. The filter paper was transferred into a 10 ml scintillation vial and 4 ml of Budget-solve scintillation fluid (Research Products International Corp., Mount Prospect, IL, U.S.A.) was added to each vial. The radioactivity on the filter was determined using a Beckman LS5801 liquid-scintillation counter.
Live-dead assay
OPCs were plated on to poly-
Solubilization of AEF mitogen for OPCs
Four approaches were used to solubilize the axolemmal mitogen. Alkaline extraction: 0.25 M sodium carbonate/sodium bicarbonate buffer (pH 9). Detergent extraction: 0.05% Triton X-100 prepared in 0.5 M NaCl solution. Heparin extraction: 0.5 mg/ml heparin in water. High salt extraction: 2 M NaCl in 20 mM phosphate buffer (pH 7.4).
AEF membranes were centrifuged in a Beckman microfuge at 12000 rev./min (12000 g) for 10 min to obtain a pellet. The pellet was resuspended in alkaline buffer, detergent, high-salt solution or heparin solution to reach a final concentration of 10 mg protein/ml.
Extract mixtures were shaken at 1000 rev./min on an orbital shaker at 37°C for 1 h and subsequently centrifuged in a Beckman airfuge with pressure set at 28 (135000 g) for 30 min. Soluble protein in the supernatant was collected and protein concentration was determined by the Bradford dye-binding assay (Bradford, 1976). Insoluble pellet was resuspended in isotonic saline (0.9% NaCl in HP) and protein was determined with Hartree (1972) protein assay.
Before adding the alkaline extract to the culture to assay mitogenicity, the soluble fraction of the pH 9 extraction was neutralized with Hepes buffer; the salt and detergent in salt extract and detergent extract were removed by dialysing the sample in 1 litre of 20 mM phosphate buffer (pH 7.4) plus 0.15 M NaCl overnight with two changes of dialysis buffer. Dialysis tubing with a molecular mass cut-off of 3.5 kDa was used throughout for sample dialysis. Tubing was boiled in EDTA aqueous solutions as followed: 1.5 mM EDTA twice for 15 min each, 1 mM EDTA for 15 min and 0.2 mM EDTA for 15 min. Boiled tubing was then soaked in Milli Q H20 and stored at 4°C. Table 1 lists the specifics of the extraction of the mitogenic activity from the AEF.
Extraction of mitogenic activity from axolemmal membrane

Heat and trypsin treatment of soluble mitogen
Heat treatment
Microfuge tubes containing heparin extract in PBS, salt extract in PBS, heparin alone or PBS alone were placed in a water bath preheated to 60°C or 100°C for 10 min and then cooled to room temperature (23°C). The soluble extracts were diluted to appropriate concentration with fresh defined medium and added to oligodendrocyte cultures.
Trypsin treatment
Heparin extract in PBS, salt extract in PBS, heparin alone or PBS alone were treated with 0.25% acetylated trypsin (final concentration) at 37°C for 30 min. Trypsin was inactivated by adding 0.5% soy bean trypsin inhibitor (final concentration). The mixture containing extract, acetylated trypsin and trypsin inhibitor was diluted with fresh defined medium and added to the cultures.
Heparin-sepharose column chromatography
Affi-Gel Heparin gel (Bio-Rad, Richmond, CA, U.S.A.) was packed in a 0.6 × 10 cm column and the column was equilibrated with 20 mM phosphate buffer, pH 7.4, plus 0.15 M NaCl. Sample was applied in the same buffer at a flow rate of 20 ml/h. The unbound fraction was collected and reapplied to the column twice. The column was washed with the same buffer until the D at 280 nm of the eluant reached the background reading. Proteins bound to the column were then eluted with a linear gradient of 0.15-2 M NaCl in phosphate buffer. Fractions (0.8 ml) were collected at a flow rate of 12 ml/h and D at 280 nm was measured for each fraction. Aliquots of 100 μl of each fraction were saved for protein assay using a micro-BCA (bicinchoninic acid) protein assay (Smith et al., 1985). Another 100 μl of each fraction was saved for SDS/PAGE. BSA was added to the rest of each fraction to reach a final concentration of 0.1 mg/ml. The buffer of each fraction was exchanged with phosphate buffer (20 mM, pH 7.4) plus 0.15 M NaCl by using a PD-10 column (prepacked Sephadex G-25 column from Pharmacia). The samples were then sterile filtered with a 0.22 pm Millex-GV4 filter (Millipore, Bedford, MA, U.S.A.) and stored at 4°C.
In some experiments, the bound proteins were eluted with step salt solution. The column was first eluted with phosphate buffer containing 0.8 M NaCl. Fractions were collected and D at 280 nm were measured. Fractions with D at 280 nm above the background reading were pooled and labelled as 0.8 M NaCl fraction. Similar methods were used to collect 1.5 M NaCl fraction and 2 M NaCl fraction. The pooled fractions were then dialysed in 0.15 M NaCl phosphate buffer (20 ml, pH 7.4) overnight at 4°C with two changes of dialysis buffer. The fractions were sterile filtered and stored at 4°C. Protein concentration of each fraction was determined with the micro-BCA protein assay.
Trichloroacetic acid precipitation of protein
Proteins in the soluble fraction were precipitated by adding ten times the volume of 10% cold trichloroacetic acid. BSA (0.1 mg/ml as final concentration) was added as carrier when the protein concentration in the solution was lower than 0.1 mg/ml. The mixtures were precipitated at 4°C for 2 h and centrifuged in a Beckman microfuge at 12000 rev./min (12000 g) for 15 min at 4°C. The pellet was resuspended with acetone and vortexed for 30 s. After removing acetone by centrifugation in a Beckman microfuge at 12000 rev./min (12000 g) for 15 min, the pellet was dried overnight under a vacuum. The precipitate was dissolved in sample buffer for polyacrylamide electrophoresis and subjected to SDS/PAGE.
Gel electrophoresis
SDS/PAGE was carried out using a 10% acrylamide gel by the method of Laemmli (1970) or in an 11-23% precasted gradient gel from Amersham (Arlington Heights, IL, U.S.A.). Ten percent gels were run at constant current using 15 mA for the stacking gel then 40 mA for the separating gel. Gradient gels were run at constant current using 15 mA for the first 20 min then 40 mA until the tracking dye reached the gel front. Proteins in the gel were either stained with Coomassie Brilliant Blue or silver stained with a silver stain kit (Bio-Rad).
Immunoblot analysis
AEF, heparin extract and salt extract were subjected to SDS/PAGE as described above and then transferred electrophoretically to 0.45 μM nitrocellulose membrane using a current of 90 mA. Rainbow molecular mass marker from Amersham was used to indicate the position of proteins of known molecular mass. The filters were equilibrated in a large volume of TTBS (0.05 M Tris, pH 7.5, 0.15 M NaCl and 0.1% Tween 20) for 10 min. BLOTTO containing TTBS and 5% Carnation dry milk was used to block the non-specific binding at room temperature for 10 min. Primary antibodies at the proper dilution in BLOTTO were incubated with the membrane at room temperature for 1 h. The nitrocellulose filters were washed twice with large volume of TTBS for 10 min each and blocked with BLOTTO for 10 min. Alkaline phosphatase-conjugated secondary antibody at the appropriate dilution in BLOTTO was incubated with the membrane at room temperature for 1 h. The membrane was washed twice with TTBS and twice with TBS (0.05 M Tris, pH 7.5, 0.15 M NaCl). The alkaline phosphatase activity was visualized using Nitro Blue tetrazolium (0.4 mM) and 5-bromo-4-chloro3-iodolyl phosphate (0.4 mM) in alkaline phosphatase buffer [100 mM NaCl, 5 mM MgCl2 and 100 mM Tris/HCl (pH 9.5)]. The enzyme reaction was stopped by washing the membrane several times with water.
RESULTS
Direct neuronal-glial contact
To determine how the isolated axonal plasma membrane would interact and affect OPC in vitro, we directly added AEF to wells containing actively growing OPC. We initially observed that the AEF bound to the OPC within 30 min of incubation (Figure 1). The OPC cultures treated with AEF did not appear to be adversely affected with regard to proliferation or survival, even at longer incubation times (>72 h). We had previously determined that the AEF contained minute fragments of neuronal cytoskeletal proteins such as beta-3 tubulin and neurofilament, probably due to the anchoring of these intracellular proteins to the plasma membrane. Following incubation with AEF for 24 h, OPC were washed to remove excess and loosely bound AEF. Using antibodies to beta-3 tubulin and neurofilament, two proteins not expressed by OPC, AEF was found localized to the OPC bodies and processes (Figure 1). AEF was bound to OPC even after incubation for 72 h (results not shown). Random binding of the AEF to the culture dish was not detected (Figure 1B).

(
AEF contact induces OPC proliferation
On prolonged incubation with AEF, we noted that the number of OPCs was significantly increased after 24 h. We incubated increasing amounts of AEF with OPC and found a dose-dependent increase in the amount of proliferation (Figure 2). This dose-dependent increase in cell number diminishes with AEF concentrations in excess of 100 μg/ml (results not shown). The experiment was conducted using both basal DMEM with no additives as well as defined medium without B104 (described in the Methods) with similar results. The data shown in Figure 2 are representative of experiments performed in triplicate.

OPCs were incubated in two types of medium, basal DMEM with gentamicin and DM, a defined medium with some growth factors added. OPCs cultured in either DMEM or DM without AEF treatment show an increase in the mean absorbance correlating with basal levels of proliferation. AEF treatment in addition to the medium results in an increased amount of absorbance directly correlated to the amount of AEF added, up to 100 μg/ml when the effect has reached peak levels. Differences in the amount of converted formazan are not significantly different between the two media used in this experiment. Data are means ± S.D. of three separate determinations. *P<0.05, ** P<0.01.
In order to determine the effect of AEF treatment over time, we treated OPC with 10, 25 or 50 μg/ml AEF over 72 h, measuring the amount of fluorescence and correlating this with the number of cells at 24, 48 and 72 h. We found a significant increase in the number of OPCs both as a function of time and amount of AEF used for treatment (Figure 3).
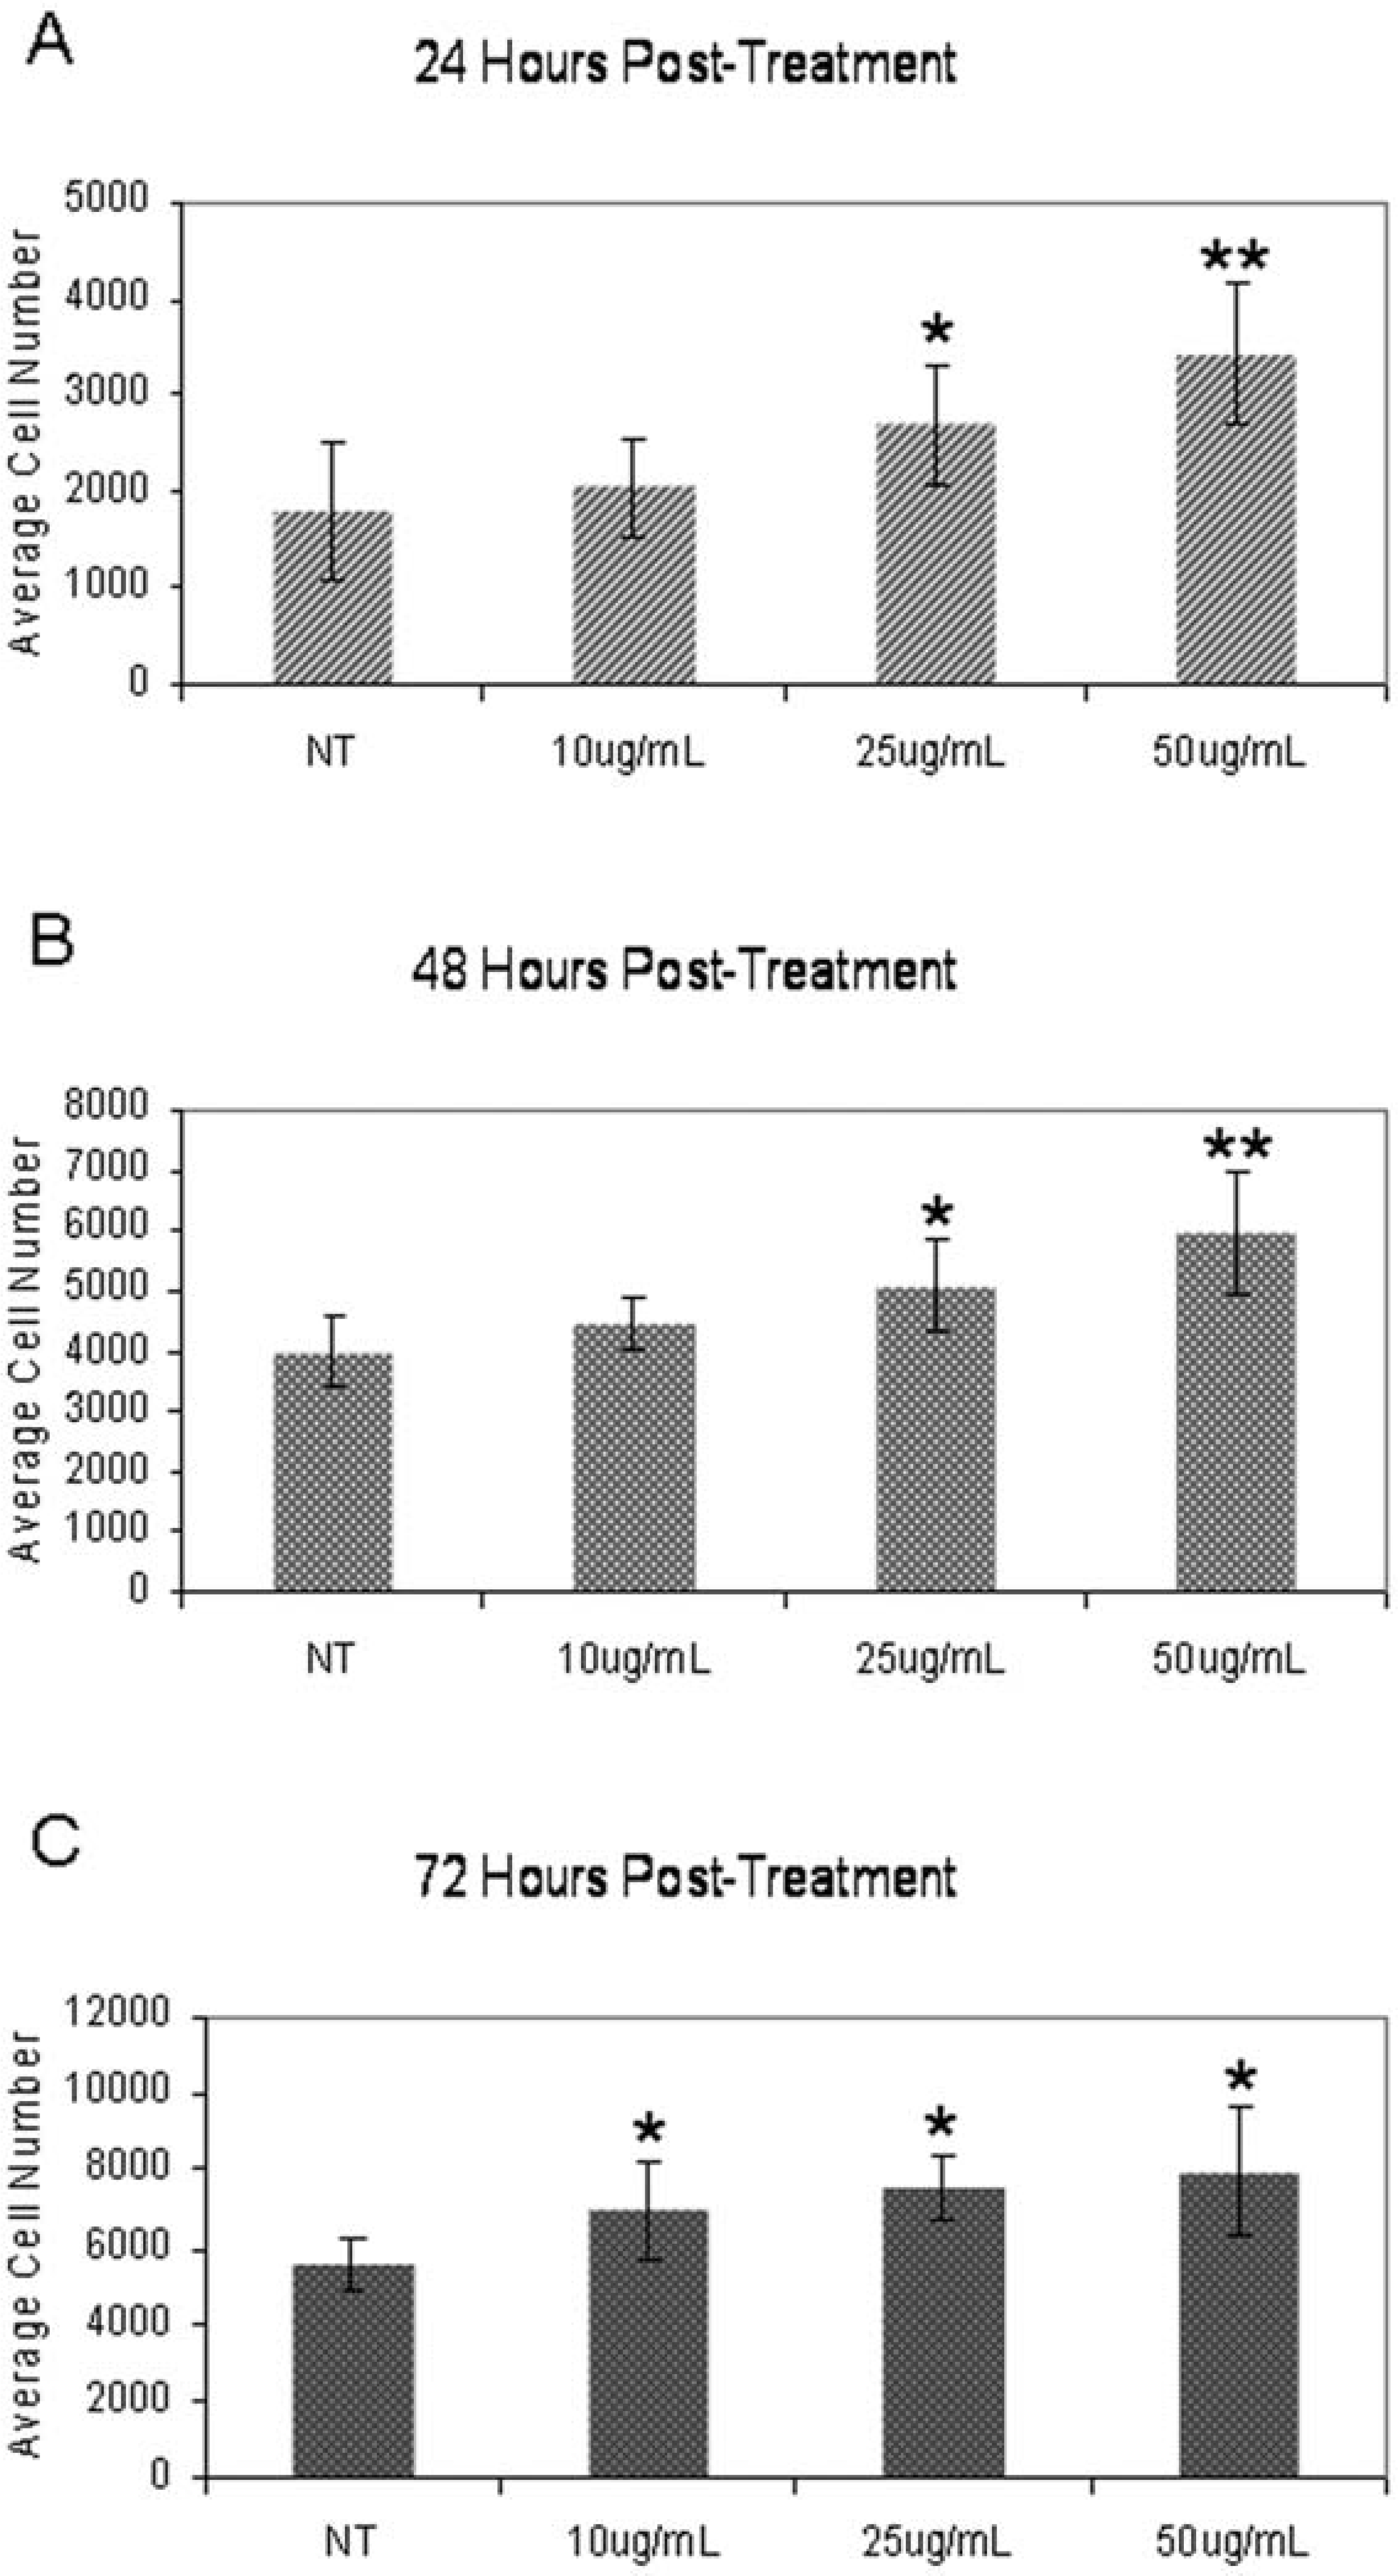
Increased cell number is dose dependent and becomes significant at 25 μg/ml compared with non-treated (NT) OPC at all three time points. Data are means ± S.D. of three separate determinations. *P<0.05, ** P<0.001.
Characterization of the AEF OPC mitogen
Since the mitogenicity of AEF OPC appeared to require membrane contact, several approaches were taken to extract the mitogenicity from the membrane fraction.
The abilities of heparin, salt, alkaline or detergent conditions to extract AEF mitogenicity are shown in Table 1. Clearly, heparin potentiates whatever mitogen it extracts from the AEF, since the recovery of activity was 1.6-fold greater than the starting activity. Heparin binds and activates aFGF (acidic fibroblast growth factor), which gave the first clue as to the potential mitogen in the AEF. Next to heparin, the most efficient extraction was achieved with 2 M NaCl salt that removed about half of the original mitogenic activity with a 5.8-fold enrichment in specific activity. Alkaline extraction (0.25 M sodium carbonate/sodium bicarbonate, pH 9) solubilized 19.3% of the original protein with moderate mitogenicity recovery (36%). Detergent (0.05% Triton X-100+0.5 M NaCl) extracted mitogen of low specific activity with low recovery.
Figure 4 shows a dose-dependent stimulation of OPCs 3H-thymidine incorporation in response to added heparin extract, salt extract, detergent extract and pH 9 extract. Salt extract exhibited a dose-dependent stimulation curve similar to that obtained from heparin extract, with a slightly higher minimum effective concentration (5 μg protein/ml for salt extract versus 2.5 μg/ml for heparin extract). Both the pH 9 extract and the detergent extract required much higher protein concentrations to stimulate the proliferation of cultured OPCs. Based on these results, salt extraction was chosen to solubilize the AEF mitogen. Since there was only 50% of the original mitogenicity present in the 2 M NaCl extract, we confirmed that the remaining 50% mitogenic activity is still associated with the membrane fragment. When the mitogenicity of the salt extract pellet was compared with the original AEF membrane, a similar dose-dependent stimulation with 50% less potency was observed (results not shown). We made an attempt to further solubilize the remaining mitogenicity by a second salt extract but failed to obtain a significant amount of activity. The failure to extract all the mitogenicity from AEF membrane by salt extraction is consistent with the view that AEF might contain more than one mitogenic signal with differing membrane affinities.

Cultured OPCs were seeded on 96-well plates and stimulated with increasing amounts of PBS, AEF-heparin extract, AEF-salt extract, AEF-detergent extract and AEF-pH 9 extract. Cultures were incubated with soluble mitogen for 72 h with the last 48 h in the presence of 3H-thymidine. Values shown are the average dpm of four separate determinations; error bars indicate S.D. Where no error bars appear the S.D. is contained within the symbols.
To further investigate the protective and potentiating effects of heparin on the extracted mitogens, the heparin extract and the salt extract (in the presence or absence of heparin) were subjected to heat and trypsin treatments. The results are shown in Figure 5. Note that under the untreated conditions there was a 4-fold increase in the mitogenicity of the salt extract. The AEF-salt extract alone was completely inactivated by heating at 60°C for 10 min or by trypsin digestion. In contrast, in the presence of 100 μg/ml of heparin the mitogenic activity of salt extract was not affected by heat or trypsin treatment, similar to the behaviour of the heparin extract. We conclude that heparin binds to the AEF mitogen specifically, and the formation of a heparin-protein complex induces a conformational change of the AEF mitogen that stabilizes the biological activity of the mitogen.

Cultured OPCs were seeded in 96-well plates and maintained in defined medium. Medium alone, AEF-heparin extract (5 μg/ml), heparin alone (100 μg/ml), AEF salt extract (5 μg/m1) or AEF-salt extract (5 μg/ml) plus heparin (100 μg/ml) were added to the cultures either untreated or after heat (10 min) or trypsin (0.25%, 37°C, 30 min) treatment. Cultures were incubated with mitogen for 72 h with the last 48 h labelled with 3H-thymidine. Values shown are the average dpm of four separate determinations; error bars indicate S.D.
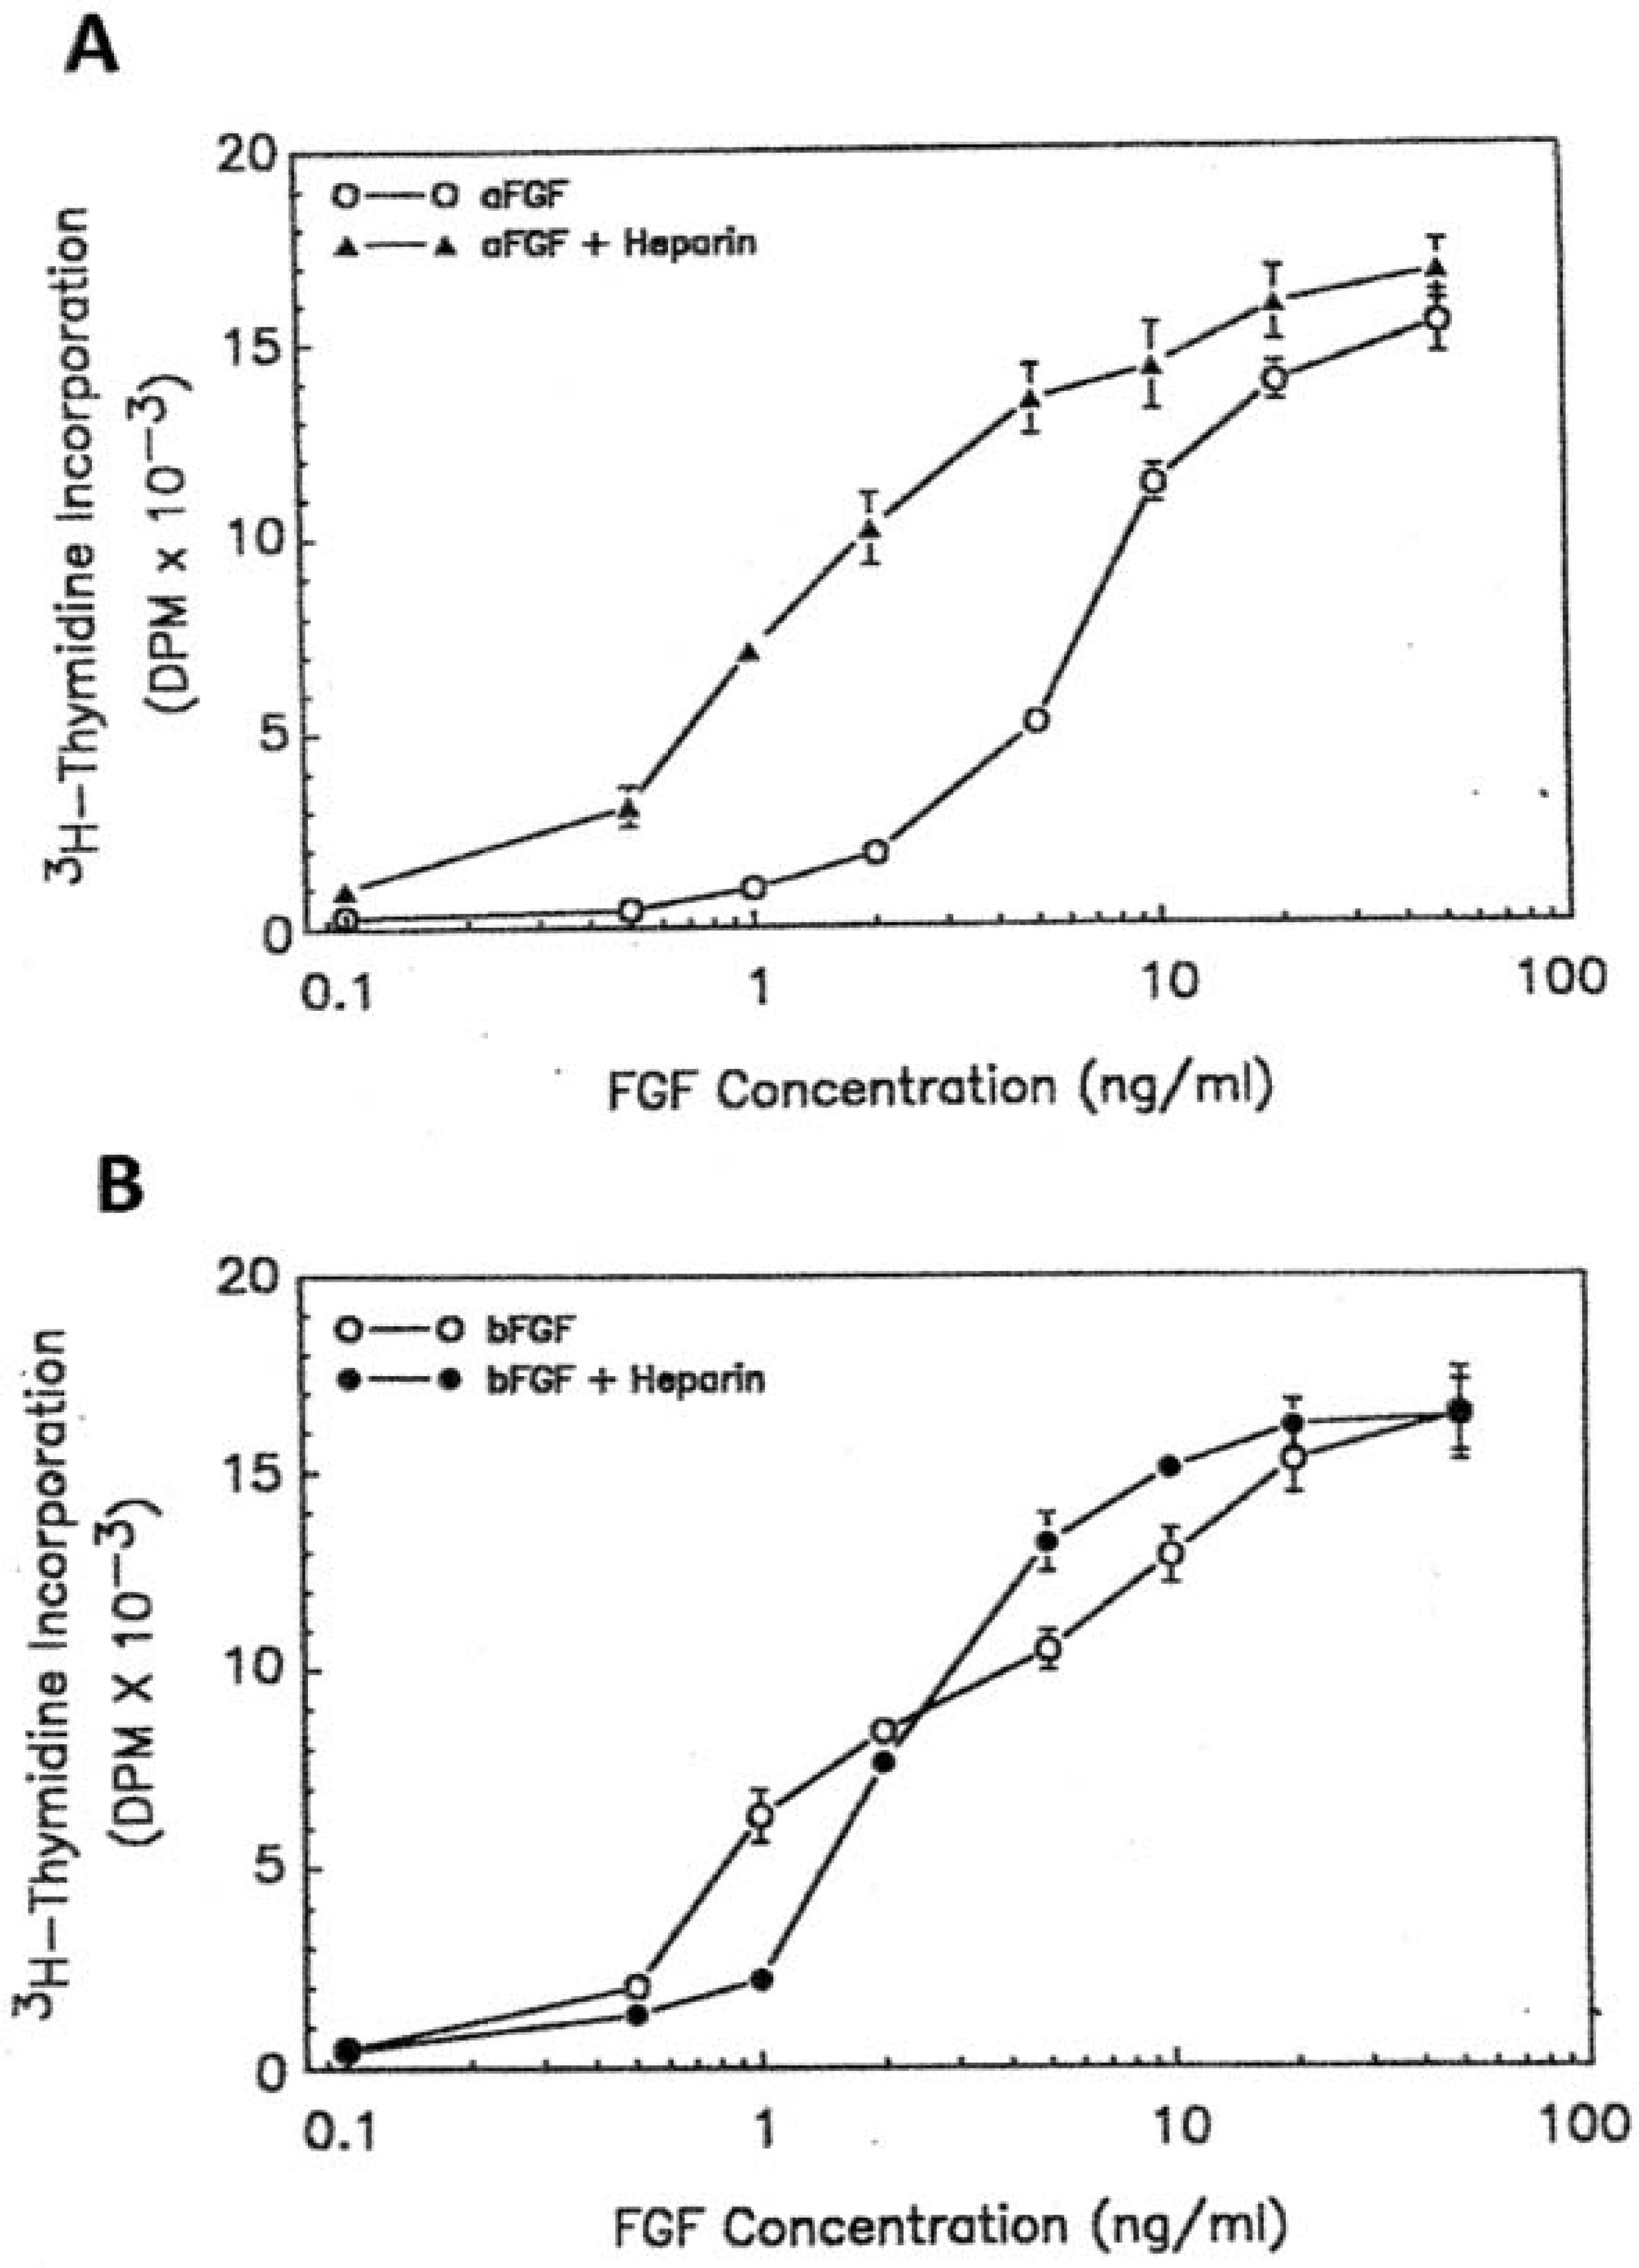
To assess the possibility that the AEF mitogen might be similar or identical with the brain-derived, heparin-binding growth factors, we investigated the mitogenicity of the aFGF and bFGF (basic fibroblast growth factor) on cultured OPCs under our experimental conditions. As shown in Figure 6, both aFGF and bFGF were potent mitogens for cultured OPCs. Purified aFGF gave a more than 50-fold stimulation at a protein concentration of 100 ng/ml, with half-maximal stimulation at the concentration of 8 ng/ml. Purified bFGF stimulated the 3H-thymidine incorporation of cultured OPCs to the same extent, with a lower half-maximal stimulation concentration, 1.1 ng/ml. We also examined the effect of heparin on the mitogenicity of both aFGF and bFGF. As shown in Figure 6, 100 μg/ml of heparin potentiated the mitogenicity of aFGF on cultured OPCs about 8-fold but had no effect on the bFGF activity. The half-maximal stimulation concentration of aFGF in the presence of 100 g/ml heparin was 1.1 ng/ml, similar to that obtained for bFGF.
(
To determine the affinity of the AEF mitogen for heparin, proteins in the AEF-salt extract were bound to an Affi-Gelheparin column and eluted using a 0.15-2.0 M salt gradient. Figure 7 shows the elution profile of protein and the distribution of the mitogenicity in the gradient. While most of the proteins were eluted from the column at the salt concentration below 0.8 M, the major peak containing mitogenic activity was found at the salt concentration between 1.0 and 1.5 M. The results revealed an affinity of the AEF mitogen in the AEF-SE for the immobilized heparin consistent with the properties of aFGF.

AEF-salt extract was bound to Affi-Gel-heparin in phosphate buffer (20 mM, pH 7.4) plus 0.15 M NaCl and eluted with a 0.15-2.0 M NaCl gradient. Fractions (0.8 ml) were collected and salt concentration was reduced to 0.15 M by the use of a PD-10 desalting column. Aliquots of each fraction were taken for D 280 measurement (O.D.) and mitogenic activity.

Ten ng of aFGF (STD 1), 2.5 ng of aFGF (STD 2), 200 μg of AEF-salt extract (AEF-SE), 100 μg of 0.8 M NaCl eluted fraction (0.8 M) and 20 μg of 1.5 M NaCl eluted fraction (1.5 M) were loaded on to a 11-23% polyacrylamide gel, electrophoresed in the presence of 0.1% SDS, and transferred to a nitrocellulose membrane. The membrane was then incubated with anti-aFGF polyclonal antibody (2.5 g/ml) and exposed to goat anti-rabbit alkaline phosphatase-conjugated secondary antibody, and was visualized with the substrate as previously described.
To definitively identify the salt-extracted mitogen, the AEF-salt extract, the fraction eluted from Affi-Gel-heparin with 1.5 M NaCl, and standards of purified bovine aFGF were analysed by using SDS/PAGE (Figure 8). The proteins were electrophoretically transferred to nitrocellulose paper and incubated with rabbit antiserum against bovine brain aFGF or bFGF. The anti-bFGF antibody detected 1-5 ng of bFGF but did not detect any immunoreactivity of 10 ng aFGF. Similarly, the anti-aFGF antibody recognized 10 ng of aFGF but did not cross-react with 10 ng bFGF, thus confirming the specificity of these antibodies. No band of immunoreactivity could be detected in either AEF-salt extract or fraction eluted with 1.5 M NaCl by using anti-bFGF (results not shown). However, the anti-aFGF antibody detected a protein in both the AEF-salt extract and the fraction eluted by 1.5 M NaCl from the heparin affinity column. The protein migrated to the 17.5 kDa position, which is consistent with the migration of the FGF standards (Figure 8). Based on the stimulation of oligodendrocyte proliferation observed with these extracts (Figure 4), and assuming that all that activity was due to aFGF, there should be 1-2 ng of aFGF in those two lanes, and the intensity of the immunoreactivity is consistent with this estimation. These results unequivocally confirm the presence of aFGF in the AEF-salt extract.
AEF-OPC contact activates kinase pathways
The increase in the number of OPCs detected using both the CyQuant and MTT assays could be due to both increased OPC proliferation and/or survival after AEF treatment. To elucidate which cellular mechanism was responsible for the increased number of OPCs, we examined the activation of two well-documented pathways in OPC, MAPK and Akt (protein kinase B). Activation of the MAPK [ERK1/2 (extracellular-signal-regulated kinase 1/2)] pathway is known for its downstream effect on cell proliferation and differentiation. Following treatment with AEF, we found a rapid increase in the expression of the phosphorylated form of MAPK (Figure 9A). The peak of this increase was detected as early as 5 min after treatment and remained at 15 min but tapered to basal levels by 30 min. Activation of Akt and its subsequent signalling cascade have effects on both cell survival and proliferation. We found increased levels of phosphorylated Akt peaking approx. 5 min following AEF incubation and with continued activation at 15 min (Figure 9B).

(

An MTT assay was used to evaluate the effects of 50 μg/ml AEF in the presence of an MAPK (PD-98059) and Akt inhibitor (triciribine). PD-98059 (PD) was tested at 50 μM and triciribine (Tri) at 100 μM. Results from triplicate experiments are expressed as percentage cell proliferation, with non-treated cells set to 100%. **P<0.05 indicates that the percentage of OPC proliferation is significantly increased due to AEF treatment of these cultures.
OPC survival increases following AEF treatment
Since the CyQuant and MTT assays were mainly used to assess proliferation, we wanted to examine whether AEF treatment played a role in cell survival via the Akt pathway. Given the activation of both the MAPK and Akt pathways during normal OPC culture, it was not clear as to whether the increased number of OPCs in AEF-treated cultures was due to an increase in cell proliferation, cell survival or both. The percentage of live OPCs within AEF-treated cultures was measured by counting the number of live cells within a field and expressing this as a percentage of the total number of cells within that field. The percentage of live cells in AEF-treated cultures was compared with the percentage of live cells in untreated cultures at 24-h intervals over 3 days. A significant increase in the number of live cells in AEF-treated cultures was observed at 24 h (Figure 11). At subsequent time points, there was no significant increase in cell number in the AEF-treated cultures relative to appropriate untreated controls.
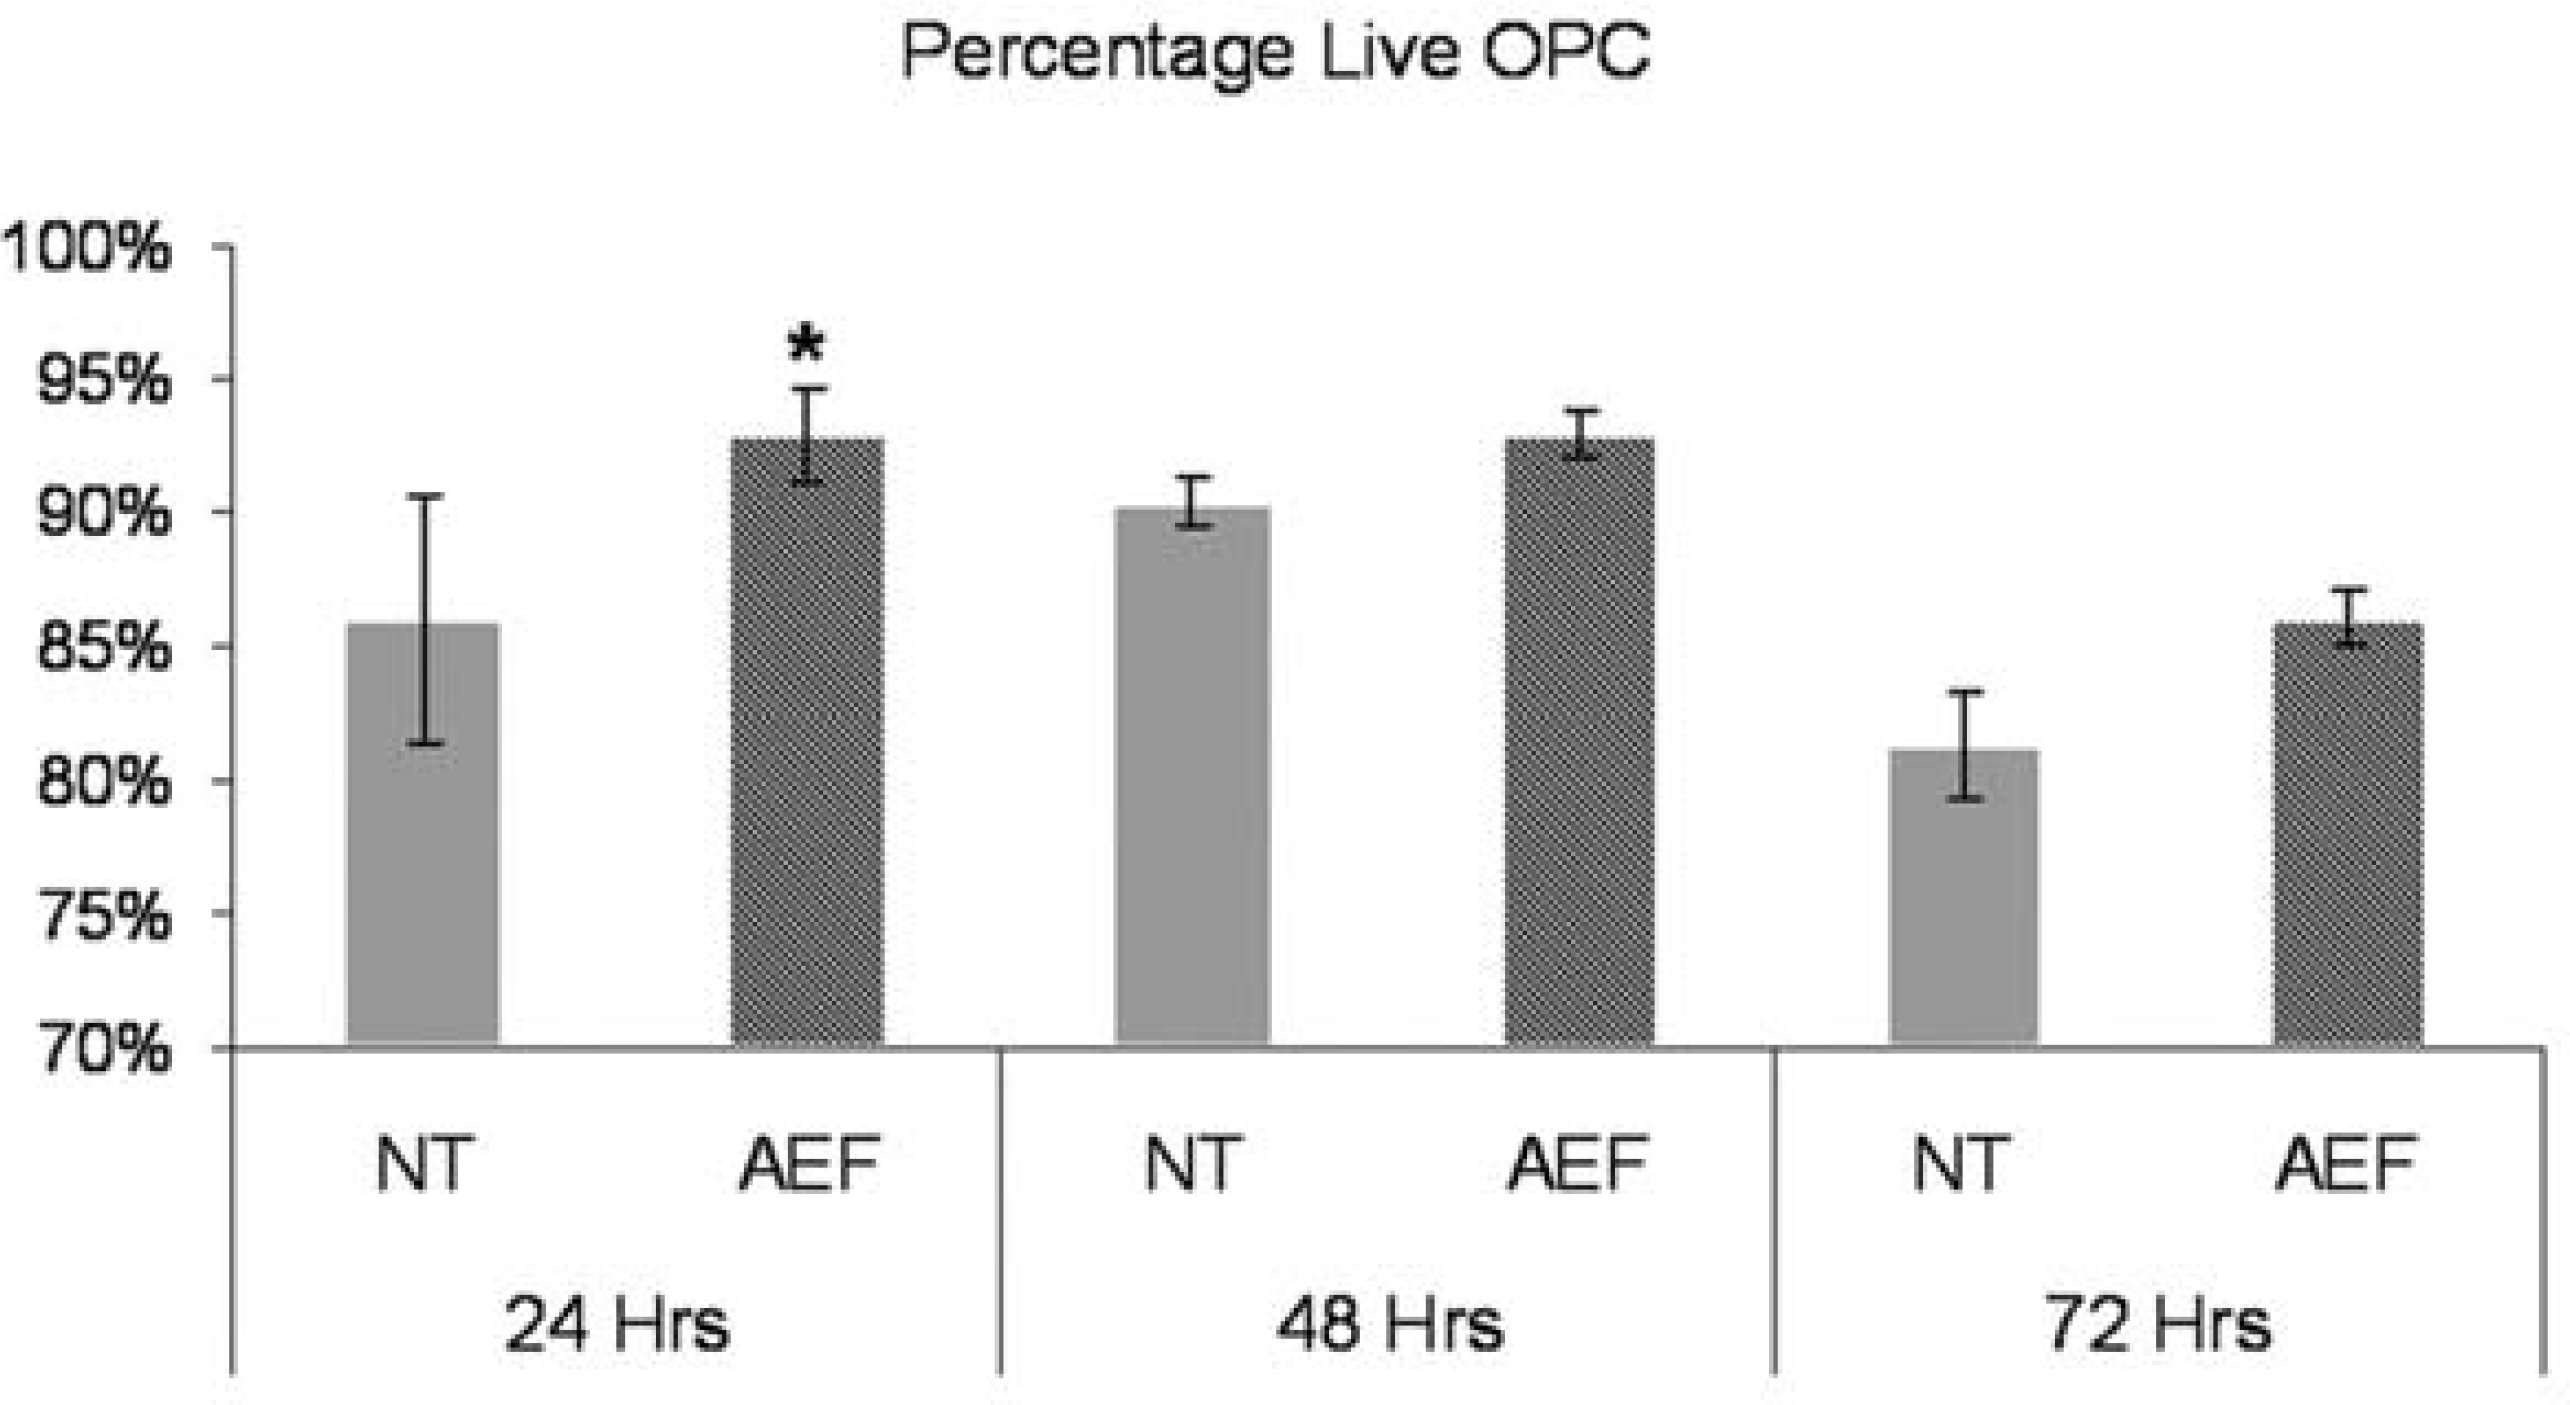
OPC were incubated with AEF (50 μg/ml) for 24, 48 and 72 h and the Live-Dead assay performed (Roche). The total number of cells counted for each time point and treatment is 1207, 1803, 2238, 3092, 2799 and 4768 respectively. Results are means ± S.D. of three separate determinations. The percentage of live AEF-treated OPC compared with NT at 24 h is significant, *P<0.05.
AEF-treatment reduces the extent of OPC differentiation
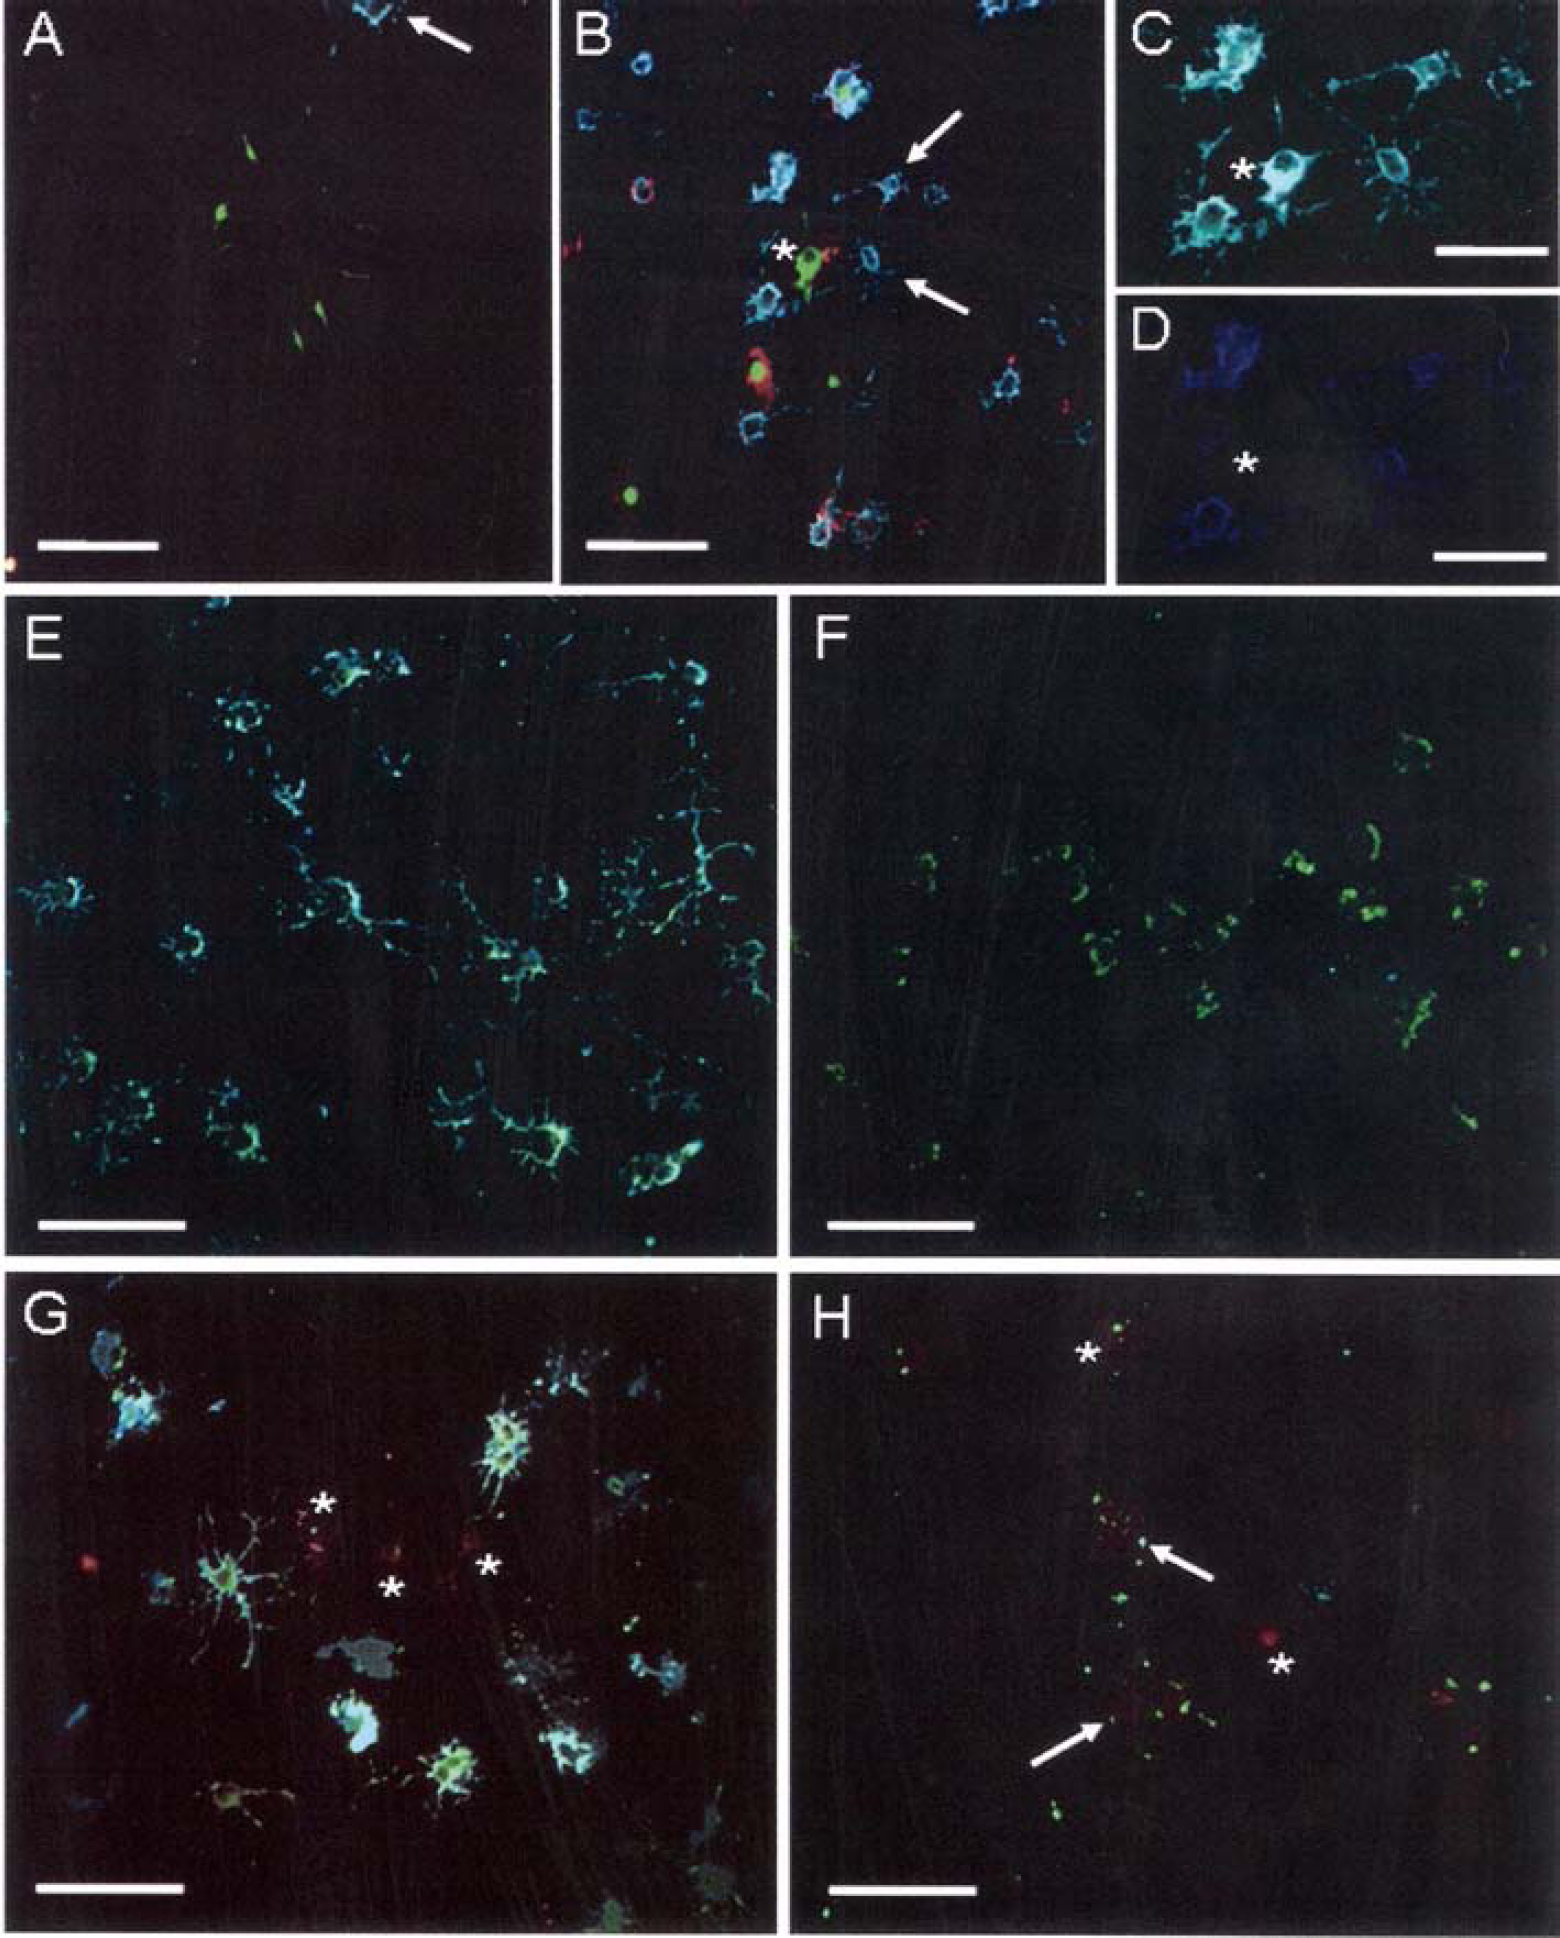
Given the AEF-dependent induction of both the MAPK and Akt pathways, the effect of AEF-treatment on early OPC differentiation was investigated. After 24 h, the number of AEF-treated OPC expressing nestin (an intermediate filament protein) and A2B5 (Figure 12B, arrows), was increased compared with untreated OPC (Figure 12A). Few AEF-treated OPC expressed nestin alone (asterisk - Figure 12B), while the majority of the AEF-treated OPC co-expressed both nestin and A2B5 (Figures 12C and 12D). GFAP-positive processes of astrocytes were detected in close proximity to nestin and A2B5-positive OPC in AEF-treated but not in untreated cultures (asterisk-Figure 12B), which may indicate that AEF-treated immature OPC may preferentially signal to and require close contact with astrocytes under these culture conditions. In agreement with previous studies that showed axolemmal fragments diminish astroglial proliferation (Sobue and Pleasure, 1984), an increase in astrocyte proliferation with AEF treatment was not observed (results not shown). In untreated OPC at 24 h, there was a marked increase in the number of OPC co-expressing CNPase and O4 which displayed a more mature morphology with numerous branched processes (Figure 12E). In contrast, the AEF-treated OPC expressed limited CNPase which was restricted to the cell body. The AEF-treated OPC did not express O4 at all (Figure 12F), suggesting a more immature stage of maturation. After 48 h, the untreated cultures had both increased GalC and O4-positive OPC (Figure 12G), which exceeded the amount of GalC expression in the AEF-treated cultures (Figure 12H). Limited punctate GalC expression can be seen on the cell bodies and proximal processes of AEF-treated OPC, possibly indicating the start of maturation (Figure 12H, arrows). The emergence of specific populations of transferrin-positive OPC in the untreated cultures (Figure 12G, asterisks) could suggest a second wave of differentiation occurring in these cultures. Taken together, these data demonstrate that the majority of the OPC in the untreated cultures have already lost immature markers such as nestin and A2B5 and now express more mature markers such as CNPase, O4 and GalC. In contrast, the AEF-treated OPCs are maintained in a more immature state, evidenced by the continued expression of nestin and A2B5, the limited expression of CNPase, O4 and GalC, and an immature morphology with more limited extension and branching of processes.
(
DISCUSSION
In the present study, we have demonstrated that an AEF isolated from adult myelinated axons stimulates the proliferation, promotes the survival and arrests the differentiation of OPCs in culture. Axonal signals responsible for regulation of oligodendrocyte proliferation and differentiation as well as survival are currently a topic of intense investigation. Since the AEF can be isolated only from well-myelinated axons, we could not generate an AEF from less mature or actively myelinating axons for comparison of the relative potencies of these signals during development. It is not known if signals required for myelinogenesis in early development would be retained by the axon later in development. The present study demonstrates the persistence of axonal signals for proliferation and survival, in the axolemma of fully myelinated mature axons. The converse has also been reported, namely that neurites from embryonic dorsal root ganglia can stimulate adult OPCs to divide (Wood and Bunge, 1986). Our laboratory has also reported that under the proper conditions adult rat OPCs can be stimulated to divide by AEF (Vick and DeVries, 1992). Fields has recently summarized the evidence that even in the fully matured CNS, neuronal signals influence the thickness of the myelin sheath (Fields, 2008). The persistence of axonal signals in mature myelinated axons is consistent with the view that these signals could be reactivated by neuronal activity at later stages of development, perhaps at the paranode and at the node of Ranvier.
Several studies have reported that the mitotic signal for myelinating glial cells is specific to the AEF. We have previously reported that the dose-dependent stimulation of rat OPC proliferation by rat AEF is not present in a myelin-enriched fraction, red blood cell membranes or a membrane fraction prepared from astrocytes (Chen and DeVries, 1989). In addition, neither granule cells nor a membrane fraction derived from granule cells was mitogenic for cultured OPCs (Mason et al., 1990). Since the neuronal mitogen for OPCs and Schwann cells may be co-localized (Mason et al., 1990), it is relevant to cite evidence of the specificity of AEF for Schwann cells. Plasma membrane fractions from rat skeletal muscle or mitochondrial fragments could not stimulate mitosis of neonatal rat Schwann cells in culture, as reported by Sobue et al. (1983). These data are consistent with the view that the mitogen for OPCs in AEF is specific and not due to a generalized effect of any membrane fraction on OPCs.
Since the AEF is a vesicular preparation, for proper cell-cell signalling, it is critical that these vesicles are oriented with the outside out rather than being inside out. If the vesicles were in an outside-in orientation, this orientation would not allow molecules that are on the surface of the axolemma in vivo to interact with the surface of the OPCs. Three lines of evidence indicate that the majority of the AEF vesicles are in the outside out orientation. First, freeze fracture studies of the AEF revealed distribution of membrane particles consistent with an outside-out orientation (Cullen et al., 1981).
Secondly, AEF is able to specifically bind scorpion toxin with an affinity similar to that of other excitable membranes (DeVries and Lazdunski, 1981). This binding is only possible if the membrane vesicle is properly polarized (Catterall et al., 1979), which requires an outside-out orientation. Finally, detergent treatment of AEF does not increase the specific activity of the externally orientated acetylcholinesterase, implying that none of this enzyme, which is externally orientated and enriched in the preparation (DeVries et al., 1983), is trapped inside the membrane vesicles, i.e. the AEF vesicles have an orientation that is outside out (G.H. DeVries, unpublished work). Therefore, the AEF preparation has an orientation that allows the surface of the axolemmal vesicles to interact with the outer surface of the OPCs, mimicking the cell-cell contact in vivo.
Although evidence has been presented to indicate that axonal signals for proliferation of OPC are secreted by axons (Richardson et al., 1988), there are abundant data to suggest that the mitogenic signal for OPCs is membrane bound. No mitogenic activity can be detected in the supernatant of high-speed centrifugation of the AEF (G.H. DeVries, unpublished work). Wood and Bunge (1986) first reported that in culture, only OPCs that had contacted neurites were stimulated to divide, which our laboratory has also confirmed (Mason et al., 1990). In further support of the tight association of the AEF mitogen with the membrane, we have previously reported that the AEF-related mitogenic signal for Schwann cells and OPCs are both tightly membrane bound (Mason et al., 1990).
A membrane-bound mitogenic signal implies that the mitogenic effect of AEF is mediated by direct contact of the AEF with the cultured OPCs. Given the similarity of the AEF mitogen for both Schwann cells and OPCs (Mason et al., 1990), studies that support direct contact of the AEF with the surface of the Schwann cell are informative. For example, fluorescent labelled AEF quickly localizes to the outer surface of Schwann cells and eletron microscopy studies confirm this cell surface localization. Direct contact of AEF with Schwann cells is also supported by the observation that, in contrast to myelin, AEF does not require internalization and lysosomal processing for its mitogenic activity (Meador-Woodruff et al., 1985). AEF specifically binds with high affinity to the surface of Schwann cells, but it does not bind at all to fibroblasts, consistent with AEF-Schwann cell surface binding. Treating the AEF with trypsin or heat inactivation decreased mitogenicity and adhesion to cultured Schwann cells in a parallel fashion, further supporting the cell surface localization of the AEF mitogen (Sobue and Pleasure, 1985). The extraction of the AEF mitogen by heparin (Table 1) indicates that the AEF mitogen is bound to a heparin-like molecule that is displaceable by heparin. Therefore it is likely that at least some of the mitogenicity in AEF is bound to cell surface heparin-related molecules and in this manner is presented to the oligodendrocyte surface as a result of cell-cell contact.
For the first time we report that at least half of the mitogenicity in the AEF for OPCs is due to aFGF. A number of lines of evidence support this view. The properties of the AEF mitogen are identical with those of aFGF: it is extracted by 1.5 M NaCl (Table 1), it is displaceable from the AEF by heparin (Table 1), it is potentiated and protected by heparin (Figure 5), and its elution profile from a heparin affinity column (Figure 7) is consistent with the elution profile of aFGF from a heparin affinity column (Thomas et al., 1991). Finally, PAGE analysis of the peak of mitogenic activity eluted from the heparin affinity column and the 1.5 M extracted mitogen unequivocally identify the mitogen as aFGF. A quantitative analysis of the mitogenicity in the salt extract leads to the conclusion that aFGF, is the only mitogen present in that fraction. For example, the mitogenicity for OPCs in a 5 μg/ml heparin-stimulated AEF-SE (soluble 2.0 M NaCl extract of the AEF) is equivalent to 5 ng/ml of heparin-stimulated aFGF. PAGE analysis of AEF-SE (Figure 8) revealed that there is 1 ng of aFGF/μg of AEF-SE. Therefore, the 5 μg/ml AEF-SE contains 5 ng of aFGF, which can account for the total mitogenicity in the AEF-SE. If OPCs respond not only to aFGF but also to other growth factors in the AEF-SE, a proliferation greater than can be accounted for by the aFGF in the AEF-SE should be observed that is not seen in our experiments. We conclude that the major mitogen extracted by 2 M salt from the AEF is aFGF.
However, the AEF-SE represents only 50% of the total mitogenicity in the total AEF fraction (Table 1), raising the interesting possibility that the AEF could contain other mitogenic signals in addition to aFGF. Preliminary results indicate that like the AEF-SE, the salt-extracted AEF pellet was able to stimulate the proliferation of FGF-sensitive cultured fibroblasts and cultured OPCs, suggesting that the non-dissociable AEF mitogen might be similar to the salt dissociable mitogen (S.-J. Chen and G.H. DeVries, unpublished work). The best candidate for this tightly associated mitogen is bFGF, because bFGF has been localized in neurons and because bFGF usually associates much more tightly with a heparin or heparin-like molecule than aFGF (Gospodarowicz et al., 1984; Lobb and Fett, 1984; Lobb et al., 1986). PAGE analysis of AEF has confirmed that bFGF is present in the preparation (S.G. Becker-Catania and G.H. DeVries, unpublished work). However, given that there are high levels of bFGF in astrocytes (Gonzalez et al., 1995), we cannot exclude the possibility that if bFGF is in the preparation, it may be derived from bFGF released from astrocytes during preparation of the AEF. Further investigations will be required to clarify this matter, since the tightly bound mitogen has not yet been identified.
The identification of aFGF and potentially bFGF as axonal mitogens for OPCs is consistent with the localization of these factors in the CNS. We have previously reported that cultured dorsal root ganglion neurons express both aFGF and bFGF on the surface of neurites after 20 days in culture (Neuberger and DeVries, 1993a). Both these growth factors were present on the surface of neuritic vesicles after a crush injury to neurites that had been cultured for 30 days (Neuberger and DeVries, 1993b). Elde et al. (1991) reported that in the CNS aFGF was localized in neurons and not glial cells, with strong aFGF immunoreactivity in the axonal membrane of myelinated axons. Since the AEF is derived from myelinated axons, it is not unreasonable to find aFGF in the AEF. In addition, Butt and Berry (2000) proposed that FGF is an axonal signal that regulates myelination based on in vivo studies of the effect of FGF on myelination in the rat anterior medullary vellum. We conclude that the presence of aFGF in AEF is consistent with its distribution in the CNS and reflects the in vivo expression of aFGF associated with the axonal plasma membrane in myelinated axons.
However, other molecules associated with the AEF may also contribute to the observed effects of AEF on OPCs. For example, it is known that both BDNF (brain-derived neurotrophic factor) and basic FGF induce oligodendrocyte proliferation (McTigue et al., 1998; Mason and Goldman, 2002) and AEF also contains BDNF and bFGF (S.G. Becker-Catania and G.H. DeVries, unpublished work). NRG (neuregulin) I isoforms have also been reported to play a major role in signalling that affects oligodendrocyte specification, differentiation, myelination and survival, at least in vitro (Raabe et al., 1997; Flores et al., 2000). Since both the alpha and beta isoforms of NRG I Type II have been detected in AEF (J.K. Fitzgerald and G.H. DeVries, unpublished work), it is reasonable to propose that these NRG I isoforms may stimulate the MAPK and Akt pathways. It is interesting to note that NRG I (III) is completely absent from CNS axons and AEF (Bare et al., 2011). Therefore, it is not likely that this isoform of NRG I plays any role in the biological effects of AEF on OPC although NRG I (III) is a critical axonal initiation factor for PNS (peripheral nervous system) myelination (Taveggia et al., 2005) and modulates CNS myelination (Taveggia et al., 2008). In any case, it is clear that activation of MAPK (ERK, specifically p42 and p44) is required for AEF-stimulated OPC proliferation to occur (Figure 9).
In addition to MAPK and Akt, AEF is also likely to influence other downstream signalling pathways related to proliferation. For example, CREB (cAMP-response-element-binding protein) has been reported to be a major mediator of the MAPK pathway regulating OPC proliferation (Johnson et al., 2000). AEF has been shown to induce both the expression and phosphorylation of CREB (Lee et al., 1996, 2003). Therefore it is possible that AEF-stimulated proliferation of OPC may result from the induction and phosphorylation of CREB and subsequent activation of MAPK in the OPC.
The metabolic pathways in OPCs which are activated by AEF are consistent with pathways known to be activated by FGF. For example, FGF activates both the Akt and the MAPK pathways (Yim et al., 2001). FGF activation of the Akt pathway prevents apoptosis in the OPCs lineage (Yasuda et al., 1995), which is consistent with the protective effect of AEF on oligodendrocyte survival possibly mediated by the AEF-associated FGF (Figure 11). Evidence has also been presented to suggest that FGF plays a subtle role in oligodendrocyte maintenance in the mature CNS (Harari et al., 1997). It is possible that in the mature CNS, AEF-associated FGF may play this role. Butt and Berry (2000) reported that in vivo FGF retarded oligodendrocyte differentiation and myelination. The inhibitory effect of aFGF and bFGF on OPC differentiation in vitro has also been reported (Engele and Bohn, 1992). Further studies showed that the inhibitory effect of FGF on oligodendrocyte differentiation was mediated by a specific FGF receptor known to be present on OPCs (Zhou et al., 2006). These data raise the possibility that AEF-associated FGF could mediate the inhibition of OPC differentiation that we observed (Figure 12). In summary, many of the biological effects observed when AEF contacts OPCs may be due to the FGF found in the AEF.
The ability of AEF to prevent OPC differentiation is interesting and unexpected. Although it would seem logical that OPC-AEF contact would stimulate myelinogenesis, recent evidence suggests several explanations for this inhibitory effect. The Gallo laboratory recently reported that ERK activation in OPC up-regulated c-Jun, which in turn has a negative effect on myelin gene expression (Chew et al., 2010). Therefore the sequence of events after addition of AEF to OPC could include rapid activation of ERK leading to stimulation of c-Jun, inhibition of myelin gene expression, and repression of other myelin markers as noted in Figure 12. Subsequent activation of p38 MAPK would repress ERK and JNK (c-Jun N-terminal kinase) activity and via up-regulation of Sox 10 stimulate the expression of myelin markers (Chew et al., 2010). These data would imply that signals other than those found in the AEF will be necessary to stimulate myelinogenesis after axonal contact is re-established following demyelination. The Notch1 signalling pathway in OPC is another FGF-activated pathway known to inhibit OPC differentiation (Zhang et al., 2009). In OPC, downstream targets in the Notch signalling pathway such as mastermindlike 1 and Hes 5 were activated by FGF signalling and inhibited OPC differentiation (Zhou and Armstrong, 2007). Taken together these data raise an interesting possible inhibitory role for the axolemma after demyelination. Evidence has been presented that after demyelination, the Notch signalling pathway is specifically activated in OPCs near demyelinated lesions (John et al., 2002). The high expression of a ligand that activates the Notch1 signalling pathway (Jagged 1) was noted in hypertrophic astrocytes and postulated to inhibit oligodendrocyte differentiation via secretion of Jagged 1 by astrocytes, subsequent activation of the Notch pathway, followed by inhibition of OPC differentiation. After demyelination, contact of OPC with the surface of demyelinated axons containing FGF could activate these downstream effectors in the Notch signalling pathway and further inhibit OPC differentiation. In any case, the pathways activated by FGF and the downstream effects of this activation are consistent with the localization of FGF on the axonal surface of mature myelinated axons.
After demyelination, rapid OPC ensheathment can promote axonal preservation that is required not only during development but also after demyelination when the axon is in a metastable condition (Franklin and Kotter, 2008; Kassmann and Nave, 2008). Therefore, it is advantageous for the demyelinated axon to rapidly signal to the appropriate myelinating cell, expediting rapid myelin ensheathment. In this regard, we have shown that within 5 min after addition of AEF to OPC, both the MAPK and Akt activation are almost at maximal levels (Figure 10). We have also reported a similar rapid induction of axonal signals to Schwann cells (Saunders and DeVries, 1988). It has been reported that maximal AEF-induced Schwann cell proliferation requires 24 h of exposure to AEF in spite of the fact that maximal AEF adhesion to Schwann cells is reached after 6 h (Sobue and Pleasure, 1985). Although initial axonal contact may cause a rapid metabolic response in both Schwann cells and OPC, sustained axonal contact is required to achieve a proliferative response. AEF binding to OPC persists even after 72 h in culture (see Figure 12). We have previously reported that AEF signalling to induce CREB expression reaches a maximum at 72 h (Lee et al., 1996). These data suggest that the OPCs are not able to phagocytose or break the binding between the AEF membrane fraction and the OPC cell surface for at least 72 h (Meador-Woodruff et al., 1985). This persistent AEF-OPC binding suggests that if OPC are supplied to a freshly demyelinated axon, then after binding, the OPC would rapidly receive the appropriate signals to survive and multiply, but further signals may be required for differentiation. A possible candidate for the differentiation signal is LIF (leukaemia inhibitory factor), which the laboratory of Fields has identified as a key signalling molecule for the initiation of myelination (Ishibashi et al., 2006, 2009). Recently, evidence has been presented that LIF-negative mice have impaired remyelination implying a role for LIF in remyelination (Marriott et al., 2008).
In summary, the present study demonstrates that axonal signalling to OPC leading to proliferation and survival as well as arrested differentiation can result from direct axonal contact with the OPC. aFGF has been identified as a key factor in the AEF preparation relating to mitotic stimulation of OPCs by AEF. These results are consistent with the report of Butt and Berry (2000) who concluded that axons and OPC form interdependent functional units and that axons govern the number of OPCs and their differentiation state. Current studies are aimed at further identification of factors in the AEF that also contribute to regulation of OPCs.
Footnotes
Acknowledgement
We thank Ms Clara Schindler, Mr Christian Campbell and Dr Dan Bare for technical assistance.
Funding
This work was supported by the