
Abstract
Wire + arc additive manufacturing components contain significant residual stresses, which manifest in distortion. High-pressure rolling was applied to each layer of a linear Ti–6Al–4V wire + arc additive manufacturing component in between deposition passes. In rolled specimens, out-of-plane distortion was more than halved; a change in the deposits’ geometry due to plastic deformation was observed and process repeatability was increased. The Contour method of residual stresses measurements showed that although the specimens still exhibited tensile stresses (up to 500 MPa), their magnitude was reduced by 60%, particularly at the interface between deposit and substrate. The results were validated with neutron diffraction measurements, which were in good agreement away from the baseplate.
Introduction
Wire+arc additive manufacturing (WAAM) is a technique which utilises arc-welding processes, in combination with wire feeding, for additive manufacturing (AM) purposes. [1] Tungsten inert gas or plasma processes can be used for titanium, aluminium and refractory metals;[2–4] and metal inert gas welding for aluminium and steel.[5–7] Benefits of this AM technique include high deposition rates and therefore lower cost of deposition compared to powder-based processes, greatly reduced lead times, and potentially limitless part size. [1]
WAAM components are affected by residual stress and distortion. [8] These two issues threaten to undermine the adoption of AM in industry; consequently, numerous projects are targeting their mitigation. In welding, various techniques have been investigated to reduce residual stress. [9] Ultrasonic impact treatment is the combination of ultrasonic waves with mechanical impact by means of an ultrasonic transducer. When applied to the toes of a six-pass weld, ultrasonic impact treatment (UIT) was found to be effective in reducing the tensile stress, especially close to the centreline of the weld. [10]
Global mechanical tensioning involves tensile loading of the weld; [11], [12] it could be done either during the welding process (in situ global mechanical tensioning (GMT)) or after (post weld GMT). These techniques are successful with linear welds or simple geometries, and the equipment is large and heavy. [13] If the load is applied only to a small region around the welding tool, mechanical tensioning is defined as local; one of the local tensioning techniques is rolling. Due to a much more compact set-up, rolling has the potential to overcome some of the impracticalities of GMT.[13–16] Rolling was found to result in a dramatic reduction of tensile stresses along the weld line of hot rolled S355JR structural steel plates, and for high rolling loads tensile weld stresses have even turned into compressive ones. [12], [17] It has also been shown that in situ rolling, in which the roller is placed immediately behind the welding torch and the load is applied as soon as the material solidifies, has negligible effect on residual stress. [17]
Previously, high-pressure interpass rolling was successfully tried on steel WAAM structures. [7] When applied to Ti–6Al–4V WAAM linear deposits, a refined equiaxed microstructure throughout the whole height of the components was obtained.[18–20] In this paper, the effect of high-pressure rolling on distortion, geometry and residual stress of Ti–6Al–4V WAAM linear deposits are evaluated. The residual stresses are measured with the contour method [21] and validated using neutron diffraction measurements. It must be pointed out that some of the work reported here was initially presented in a conference publication, [22] however both the contour method and neutron diffraction results have been refined in the present work, in which more details are also provided.
Experimental methods
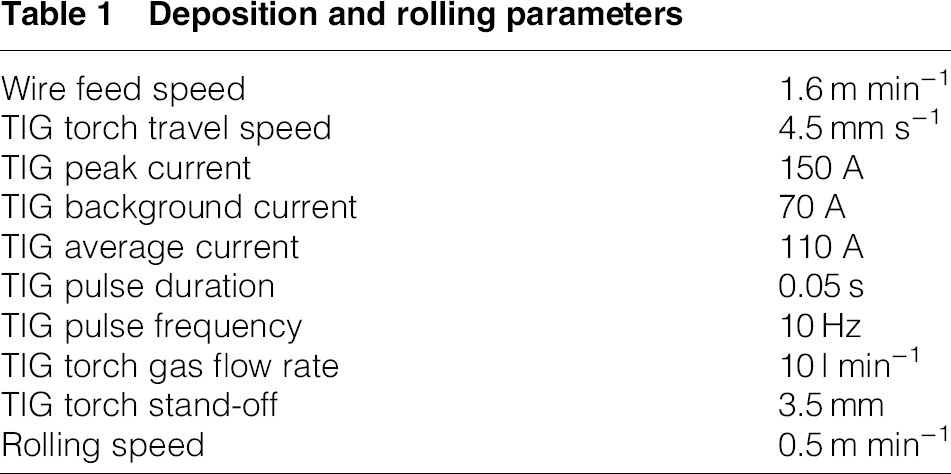
The deposition and rolling experiments were performed on a custom-made rolling rig, equipped with a Lincoln Electric Invertec V310-T AC/DC tungsten inert gas (TIG) power supply. A schematic view of the set-up is shown in Fig. 1a (the X, Y and Z directions are defined in this figure). The electrode to workpiece distance was 3.5 mm. The parameters for the pulsed TIG process, presented in Table 1, produced a wall width (WW) of 6 mm.
Experimental set-up for layer deposition and rolling: a schematic of experimental set-up, b details of base plate including holes for clamping and c dimensions of the profiled roller (A). Deposition and rolling parameters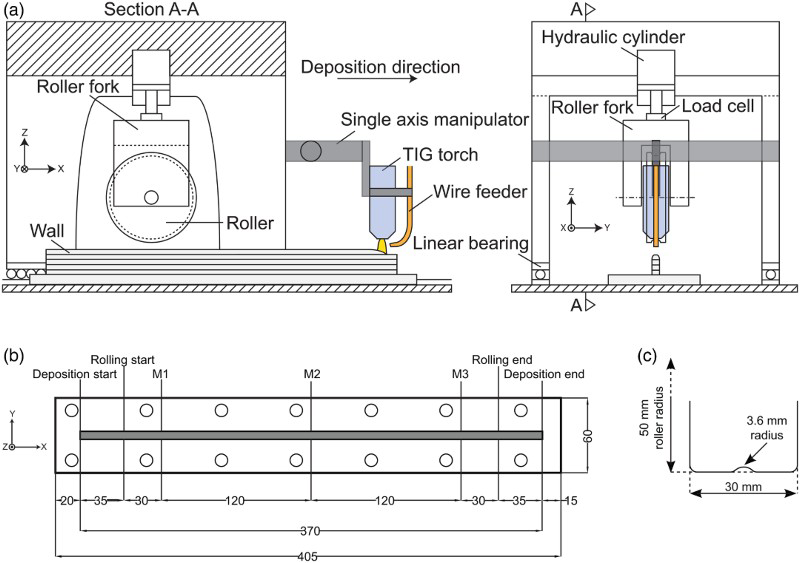
A 200-mm long trailing shield with a single inlet (20 l min−1) located at its midpoint, attached to the TIG torch, was used to provide an argon environment behind the deposit to protect it from oxidation. Because this trailing shield was designed for welding applications, in which it works relatively close to the plates that are being welded, aluminium tape was attached to both its long edges to contain argon and improve the device's shielding capability. For additional protection,  mm3 aluminium plates were stacked on either side of the deposit as the build progressed in height, to prevent ingress of argon from underneath; this improved shielding performance further. It must be pointed out that a WAAM-specific trailing shield is now available and will be used for future experiments.
[23]
mm3 aluminium plates were stacked on either side of the deposit as the build progressed in height, to prevent ingress of argon from underneath; this improved shielding performance further. It must be pointed out that a WAAM-specific trailing shield is now available and will be used for future experiments.
[23]
Chemical composition of Ti–6Al–4V wire used in the experiments (wt%)

Evaluation of geometry and distortion
Ti–6Al–4V baseplates were 405 mm long, 60 mm wide and 6 mm thick, and were clamped by countersunk bolts along each side of the plate (Fig. 1b). Five 20 single-pass-layer walls were built: a ‘control’ reference sample deposited without rolling, but incorporating the same cooling stages between passes; two samples treated with the profiled roller using loads of 50 and 75 kN; and two that were treated with the flat roller using loads of 50 and 75 kN.
Deposition was initiated 20 mm from the end of the baseplate and stopped 15 mm from the other end (Fig. 1b), giving a total wall length of 370 mm. Each layer was deposited in the same direction. Rolling began and ended 35 mm from the ends of the deposit.
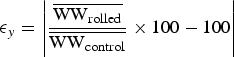
The WW was measured from optical microscopy images of three cross-sections extracted at the points labelled M1, M2 and M3 ( , where j is the point of measurement, as indicated in Fig. 1b), using Adobe Photoshop CS4.*
Photoshop is a registered trademark of Adobe Systems Inc.

The standard deviation was calculated as

As described in a previous publication,
[19]
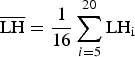
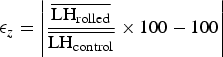
the layer height (LH) from the baseplate was measured with a digital calliper also at three points labelled M1, M2 and M3 ( ) during building of the part, before and after rolling; i is the layer number, and j the point of measurement. The height of each individual layer (LH
 ), mean layer height (
 ) and standard deviation (
 ) were calculated from

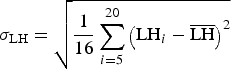
The thermal effect of the baseplate led to a reduction in WW and an increase in LH, for the first few layers. Consequently, the first four layers are excluded from the calculation of  and
and  in equations (3b) and (3c).
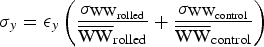
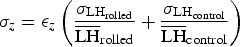
The calculation of the average total engineering strains ( and
and  ) introduced by rolling was based on the average changes in WW and LH, respectively:
Furthermore, strains on a layer-by-layer basis were calculated only for the LH (Z direction) by comparing the LH of the rolled specimens with the LH
 of the control one.
Because of the manual start and stop of the arc, and the manual operation of the motion system which manipulated both the welding torch and the rolling tool, there were inaccuracies in the length of deposits which made the calculation of the change in the deposits’ length ( ) meaningless; hence, these values are not reported in this paper.
After manufacturing each sample, the maximum out-of-plane distortion (D) was assessed as shown in Fig. 2.
Measurement of out-of-plane distortion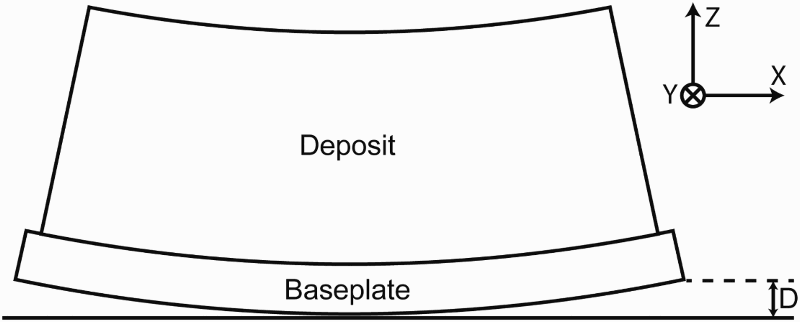
Characterisation of residual stress
The same equipment was used to manufacture titanium deposits onto 250-mm long, 60-mm wide and 6-mm thick Ti–6Al–4V substrates, which were also clamped by countersunk bolts. Each linear deposit began and ended on the edge of the substrate, and comprised 40 layers. Starting the deposition on cold material results in slight humping.
[4]
Equally, because of the lack of heat sink ahead of the torch, sloping is observed when a layer is finished.
[4]
These errors accumulate as the build progresses, and while acceptable for a limited number of layers (such as those required to produce the samples for evaluation of geometry and distortion), for taller structures the deviation is such that at the beginning of the deposition, the TIG electrode can crash into solid material, and at the end a massive amount of spatter is produced due to a substantial increase in the arc length and voltage. Consequently, when producing samples for residual stress measurements, the direction of deposition was alternated, so that the lack of material at the end was compensated by the additional material produced at the beginning of the new layer, which started where the last one ended. This was also described in Martina et al.
[4]
To avoid rotation of the torch, the wire was fed 90 to the direction of the travel. The profiled roller was used (Fig. 1c), and four samples were built: two unrolled (control), one rolled at 50 kN and a final one rolled at 75 kN. All other manufacturing parameters were the same as above.
Contour method of residual stress measurements
The contour method of residual stress measurement was employed to assess how the residual stresses evolved in the component as a function of processing. Briefly, the contour method is a destructive technique for assessing residual stress whereby the component is experimentally cut into two using the principles of elastic superposition. The deformation of the newly created surface due to the release of residual stress is then experimentally measured. This deformed surface is flattened analytically on representative geometry of the component to indicate the original residual stress normal to the cut plane. [21], [24]
Samples were cut by wire electrical discharge machining (EDM) in a purpose-built fixture which was designed to conform to the component (i.e. accounting for the distortion shown in Fig. 2 of each specimen) and provided appropriate restraint during cutting (Fig. 3). The cutting strategy and restraint employed followed the best practices to mitigate cutting artefacts.
[25]
Clamping of components during wire EDM cut
The cut started from the top of the deposit and into the baseplate with the wire moving parallel to the part's Y -axis. The two matching resultant surfaces were scanned using a NanoFocus μScan laser surface profilometer with a rectangular grid of points spaced 30 μm apart. These unregistered point clouds were then aligned and averaged to produce a single point cloud. This point cloud was then fitted with cubic B-splines to permit interpolation. The average fitting error of the spline to the averaged surface was 15.6 μm with a standard deviation of 1.2 μm as calculated in the direction normal to the cut surface.
The outline of the average surface was then used to generate a finite element model of the component consisting of 20-noded quadrilateral elements in Abaqus †
Abaqus is a registered trademark of Dassault Systèmes Simulia Corp.
 for Poisson's ratio and E=113.8 GPa for Young's modulus. Boundary conditions were imposed at node locations as found from the fitted spline, and stresses were calculated with an implicit static analysis. Further boundary conditions were imposed to eliminate rigid body movement on corner nodes of the baseplate; Z displacement was restricted on one and Z and Y on the other. A mesh sensitivity was conducted to ensure that an appropriate mesh density was employed. The characteristic mesh contained over 15,000 reduced integration elements, and resulting stresses were inferred from stress values found at the four integration points per element closest to the surface of the cut. The end result of the analysis was a distribution of the
  stresses over the entirety of the component's cross-section.
With regard to the measurement error associated with this technique, there are conflicting opinions in the scientific literature. In absolute terms, Prime et al. [26] provided an estimate of 5 MPa; Olson et al. [27] indicated 5–10 MPa, while Hosseinzadeh and Bouchard [28] described upwards of 15–30 MPa in certain regions of their sample. Therefore as a very conservative estimate, 30 MPa was chosen as the uncertainty for the contour method results in Fig. 7.
Neutron diffraction residual stress measurements
In order to cross-validate the contour method measurements, the residual stress was also measured in the control sample by neutron diffraction at the Heinz Maier-Leibnitz Zentrum nuclear facility in Munich, Germany, using a monochromatic neutron beam of wavelength of  and a detector angle of
  ° to identify the α-Ti(103) reflection, given that in lamellar Ti–6Al–4V, the α phase accounts for around 90% of the crystallographic structure at room temperature.
[29]
The scans were made at the mid-length position on half the original specimen length of 250 mm. Scans started 2 mm from the bottom of the baseplate, and finished at the top of the wall, with a spacing of 2 mm between each point, along the centreline of the wall.
° to identify the α-Ti(103) reflection, given that in lamellar Ti–6Al–4V, the α phase accounts for around 90% of the crystallographic structure at room temperature.
[29]
The scans were made at the mid-length position on half the original specimen length of 250 mm. Scans started 2 mm from the bottom of the baseplate, and finished at the top of the wall, with a spacing of 2 mm between each point, along the centreline of the wall.
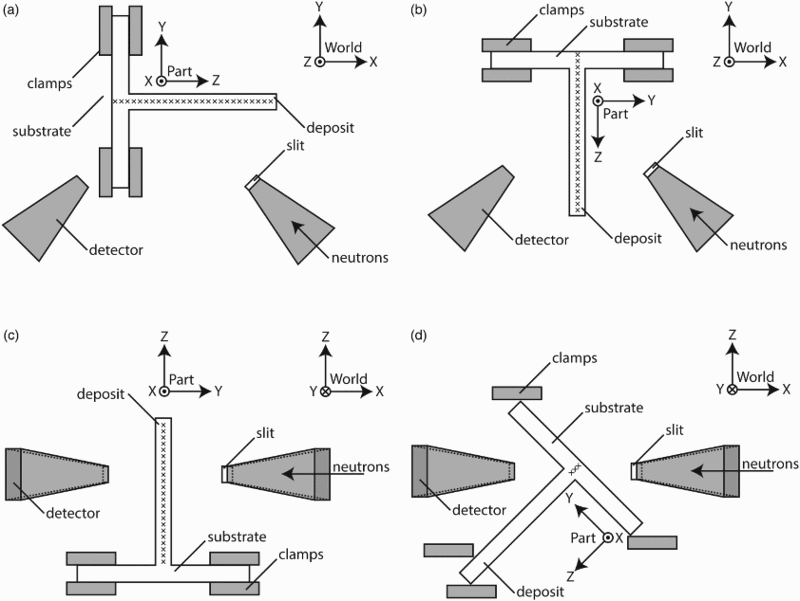
The same set-up (Fig. 4a and b) was used to read the diffraction peaks from the lattice spacings so as to measure the elastic transverse ( Sample set-ups for neutron diffraction measurements. a Plan view of the set-up for the transverse (Y) direction; b plan view of the set-up for the normal (Z) direction; c elevation view of the set-up for the longitudinal (X) direction for points within the deposit and d elevation view of the set-up for the longitudinal (X) direction for points within the substrate. Note that in c and d the detectors are 45° out of plane ) and normal (
 ) strains. The longitudinal values required two changes of set-up in order to minimise the beam attenuation through the sample: diffraction peak positions of the points with their gauge volume within the wall were measured with the part placed horizontally (Fig. 4c), while for the interface wall–baseplate, and for the baseplate itself, a 45° rotation of the part around its X-axis was necessary (Fig. 4d).
For the transverse and normal directions strain measurements, a matchstick gauge volume of  mm3 was used, with the long dimension parallel to the X direction; for the longitudinal direction it was
  mm3. For each point, the scan time was at least 15 min. Direction specific lattice spacings (
 ) were calculated using Bragg's law:

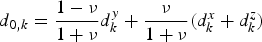
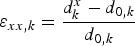
where k indicates the points were lattice spacing measurements were taken. The stress-free lattice spacings ( ) might be expected to vary as a function of position.
[30]
In such circumstances, one would normally cut a series of stress-free cubes as matchsticks to determine
) might be expected to vary as a function of position.
[30]
In such circumstances, one would normally cut a series of stress-free cubes as matchsticks to determine  point by point. However, given that the thickness of the deposit was approximately 6 mm, plane stress in the XZ-plane was assumed which means that it is possible to deduce the variation of
  from three elastic strains (
 ,
,  and
and  ) at each point k. The following condition, whose validity is discussed in the next section, is imposed:
[31]
) at each point k. The following condition, whose validity is discussed in the next section, is imposed:
[31]
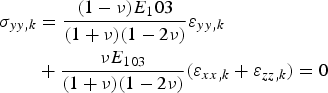
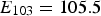 GPa is Young's modulus for the α–Ti(103) plane. This condition enables the calculation of the stress-free lattice spacings (
 ) parameters for the three measured lattice spacings:


Results and discussion
Distortion and manufactured geometry
The distortion results shown in Fig. 5a demonstrate that distortion reduced with increased rolling load. This is likely to be linked to the modification in residual stress, discussed in the next section. Rolling has also significantly affected the WW and LH, as shown in Fig. 5b and c. As the rolling load increases, there is a substantial increase in WW, which is accompanied by a concomitant reduction in the LH.
a Distortion, b average wall width and c layer height vs. rolling load. Note that the error bars in b and c represent the standard deviation of the three measurements
The change in geometry as a consequence of rolling will not affect the build-rate provided the final shape of the deposit is known, i.e. as long as the change in WW and LH produced by rolling is known beforehand, these can be taken into account when selecting the process parameters according to the desired geometry, using algorithms such as those described in Martina et al., [4] Martina. [20] Therefore, if the buy-to-fly ratio and deposition rate of the rolled part are similar to those of the unrolled one, the build-rate will not be affected.
After rolling, the standard deviation of WW and LH reduced from 0.18 to 0.14 and from 0.19 to 0.09, respectively, for the profiled roller; and was as little as 0.03 for the flat roller, as shown by the error bars in this figure. The reduction in the standard deviation for both WW and LH values shown in Fig. 5 could simplify automation of the deposition process, particularly the reduction in variation of the wall height. Variation in the LH, unless compensated by a control system, results in differences in the electrode to workpiece distance, which leads to a change in the heat input and ultimately to the geometric characteristics of the deposit. Operating the rolling equipment with position rather than load control could possibly reduce the height variation between passes further, or even eliminate it. Other benefits could include reduced material removal in post-manufacturing machining and less non-conformance rejection.
Average engineering strains (%)
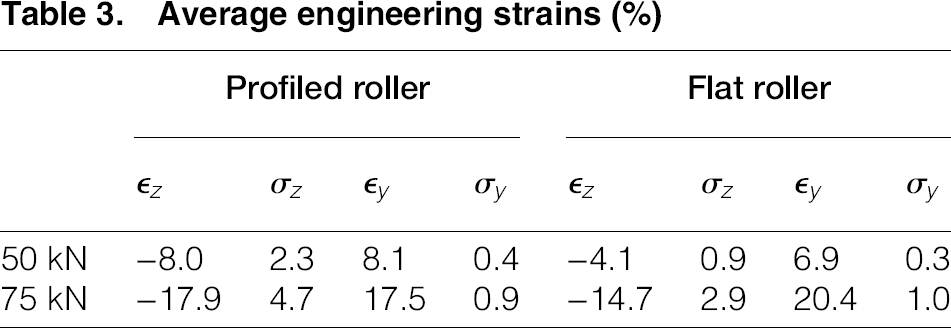


Figure 6 shows a plot of the change in LH ( Plot of reduction in layer height (Z direction) using rolling vs. layer number ) measured after rolling each layer. Two clear features can be seen: the first is the much larger reduction in layer height for 75 kN compared to 50 kN. The second is the much larger strain produced with the flat roller for a load of 75 kN during the deposition of the first few layers. For a rolling load of 50 kN, the difference is minimal.

The difference in strain for the first few layers when rolling at 75 kN (Fig. 6) can be attributed to the lack of lateral restraint of the flat roller. In the first few layers, the profiled roller was also in contact with the baseplate, because the depth of the machined groove was larger than the height which was being rolled. The flat roller was not affected by this problem which resulted in higher strain.
Residual stress
Figure 7 shows a comparison of the residual stress in the longitudinal (X) direction, measured along the centreline of the control and rolled specimens. Figure 8 shows contour maps of the stresses for the same direction. The control specimen showed a substantial level of tensile stress (500 MPa) concentrated just above the interface between the part and the baseplate. The magnitude of the stress steadily decreased towards the top of the wall, where it became compressive, peaking at around Longitudinal residual stress measured by contour method and comparison with the neutron diffraction measurements of the control sample Contour maps of residual stress: a control; samples rolled using the profiled roller with a load of b 50 kN and c 75 kN MPa. These measurements are consistent with those reported on steel WAAM structures,
[7],
[8]
and on WAAM Ti–6Al–4V structures,
[32]
but are different from those reported by Moat et al.
[33]
on laser sintered structures.
MPa. These measurements are consistent with those reported on steel WAAM structures,
[7],
[8]
and on WAAM Ti–6Al–4V structures,
[32]
but are different from those reported by Moat et al.
[33]
on laser sintered structures.
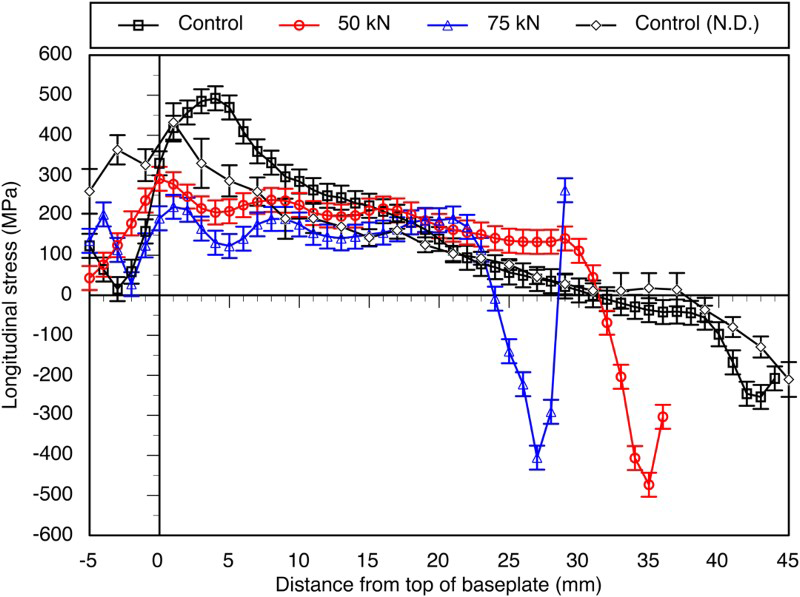

Tensile stresses were generated throughout the deposition due to shrinkage of the cooling material behind the molten pool, as discussed in Coules et al. [34] for welded joints. Bending distortion in WAAM parts was described clearly in Colegrove et al. [7] During deposition, the clamps applied a bending moment which kept the baseplate flat; the baseplate also contained the balancing compressive stress. Despite the differences in geometry in WAAM specimens, the mechanisms were similar to those discussed in welding. Upon releasing the baseplate from the clamps, the specimen bent upwards so that the net bending moment across the section was zero, turning the tensile stress at the top of the wall into compressive stress. This resulted in the tensile peak observed at the baseplate–part interface. The difference with that reported by Moat et al. [33] could be related to their deposit height, which is much smaller relative to the substrate they used, a scenario similar to having the wall still clamped. In addition, their walls/parts were produced by scanning rather than a single pass wall, which is also likely to affect the generation of residual stress.
The 75 kN specimen had lower residual stresses particularly at the interface between the part and the baseplate, and it had a peak tensile stress of 200 MPa, roughly 300 MPa less than the control specimen. In addition, the rolled specimen exhibited a much flatter residual stress profile apart from the highly compressive stresses at the top of the deposit. Rolling induces plastic strain in the longitudinal (X) direction, which reduced the tensile residual stress in that same direction. [7], [17] The reason why residual stresses were not fully eliminated, but only reduced, is discussed below.
During part building, there was a competition between the production of residual stress by each layer deposition (‘welding stress’), and the compressive ones introduced by each subsequent rolling pass. This was also evident in the work of Colegrove et al. [7] The compressive stresses associated with rolling were observed in the top of the wall also in the present case and are 150–250 MPa larger than in the control specimens (see Fig. 7). The lack of further deposition meant that these compressive stresses could not be changed. This condition is similar to that observed in rolled welds and reported by Coules et al., [17] in which the residual stress was fully compressive throughout the thickness of the welded plates. However, different from the welding case, in rolled WAAM deposits the lower beads had their stress modified by the subsequent deposition passes, and tensile stresses are still observed, further from the top of the wall. Another difference in the welding case is that, in rolling of welds, the parent material on either side of the weld acts as a constraint and allows little deformation in the transverse (Y ) direction, allowing more deformation in the longitudinal one (X), effectively reducing the tensile residual stresses in the X direction. In WAAM structures, there is no constraint in the transverse (Y) direction (apart from near the baseplate) so much more deformation occurs in the Y direction as a consequence of rolling, which results in less effective tensile stress reduction in the longitudinal direction.
Alternatively, roller designs that limit the amount of lateral deformation can be used such as the ‘slotted’ roller reported in Colegrove et al. [7] , Additional side rollers would have a similar effect, providing a more effective reduction in residual stress. [7] Progressively reducing the rolling load as the build approaches completion may avoid the large compressive stress in the top of the wall.
Despite the lower rolling load, the specimen treated with a 50-kN load showed higher compressive stress in the top region of the deposit (Fig. 7). This observation is linked to the different geometry of the specimens (the sample rolled at 50 kN is taller than the one rolled at 75 kN) and to the stress redistribution that occurred after unclamping: once the 50 kN sample was allowed to bend, it exhibited more distortion, which resulted in the greater compressive stress.
While a smaller gauge volume could have been chosen to allow measurement of stress nearer to the surface, the requirement for acceptable sampling statistics meant that a  mm3 interaction volume was necessary. Consequently, in this particular case the contour method enabled the measurement of stress much closer to the surface than neutron diffraction. It was possible to observe a tensile stress at the top of the wall, in the material that had been in contact with the roller (Fig.8). This tensile stress is likely to be due to the friction between the roller and the deposited material which produces more deformation under the surface.
[35]
The tensile residual stress at the very top is not desirable from a mechanical property viewpoint; however, this is not an issue, since in real components the top of the deposit would be machined off.
mm3 interaction volume was necessary. Consequently, in this particular case the contour method enabled the measurement of stress much closer to the surface than neutron diffraction. It was possible to observe a tensile stress at the top of the wall, in the material that had been in contact with the roller (Fig.8). This tensile stress is likely to be due to the friction between the roller and the deposited material which produces more deformation under the surface.
[35]
The tensile residual stress at the very top is not desirable from a mechanical property viewpoint; however, this is not an issue, since in real components the top of the deposit would be machined off.
The contour maps in Fig. 8 show a gradient in the transverse (Y ) direction, the lateral surfaces of the wall having lower residual stress (often compressive) than the bulk of the material. This is possibly related to the faster cooling of the external surface compared to the internal region. This could be beneficial from a lifetime viewpoint in applications in which surface finish is not key and the components do not need machining.
There are differences between the results obtained with the contour method and those produced by neutron diffraction (Fig. 7). Within the baseplate, the contour method showed a low tensile stress, while the one measured by neutron diffraction was considerably higher (250–350 MPa). From the interface up to a wall height of 20 mm, the initial offset of roughly 150 MPa becomes progressively smaller; and above 20 mm there is very good agreement. Two reasons could be proposed for the observed differences. Firstly, when performing the contour cut plasticity can occur ahead of the EDM wire. This could be particularly severe when changes in cross-section happen ahead of the wire: the EDM cutting settings are based upon cutting a uniform thickness of material; when the specimen geometry changes, so does the wire contact length, resulting in instabilities of the cutting conditions.
[25]
Secondly, with regard to the assumption of plane stress, while reasonable in the wall well away from the substrate, near the baseplate the stress becomes triaxial and so this method for estimating  is no longer valid. The plane stress assumption is only valid for distances greater than 6 mm from the substrate where the multiaxial constraint is reduced sufficiently.
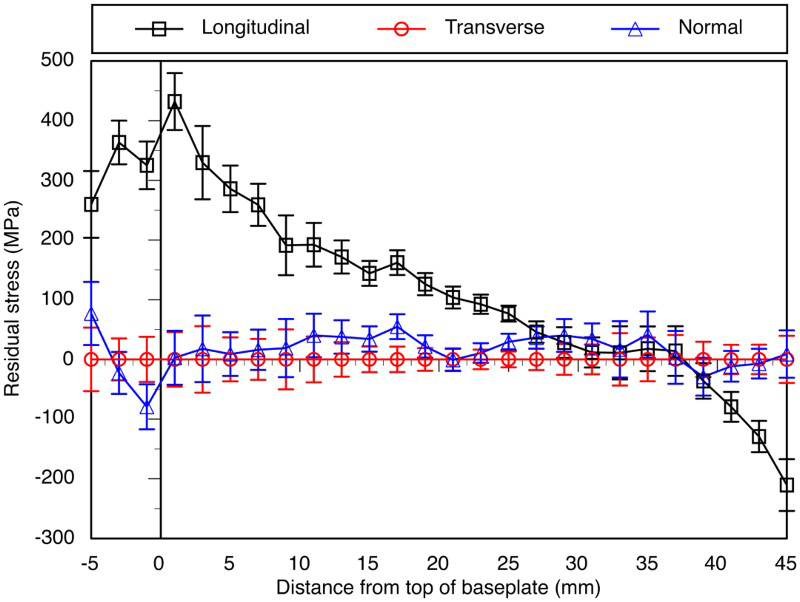
For completeness, Figure 9 presents the values of residual stress for the three main directions, measured by neutron diffraction. It must be pointed out that, although the measured strains were used in another publication,
[36]
the residual stresses reported in the present paper are different due to an alternative method to determine the stress-free lattice spacing ( Residual stress measured in the unrolled specimen by neutron diffraction ). Indeed, due to the assumption of plane stress in the XZ plane, Figure 9 shows null residual stress in the transverse (Y ) direction, while previous research
[36]
showed residual stress ranging from
). Indeed, due to the assumption of plane stress in the XZ plane, Figure 9 shows null residual stress in the transverse (Y ) direction, while previous research
[36]
showed residual stress ranging from  MPa to 120 MPa for such directions. Unsurprisingly, residual stress in WAAM parts are largest in the longitudinal (X) direction, confirming what Colegrove et al.,
[7]
Hoye et al.
[32]
reported previously.
MPa to 120 MPa for such directions. Unsurprisingly, residual stress in WAAM parts are largest in the longitudinal (X) direction, confirming what Colegrove et al.,
[7]
Hoye et al.
[32]
reported previously.
Finally, there are applications in which the baseplate is not part of the final structure. In these cases, it has been shown that the separation of the component from the baseplate resulted in elimination of residual stresses. [37] Should the baseplate be part of the component (which applies also to the repair or remanufacture of existing parts) preheating of the substrate could minimise the generation of tensile stress.
Conclusions
High-pressure interpass rolling was investigated as a mean of eliminating distortion and residual stress in wire + arc additive manufacturing Ti–6Al–4V components. It was found that:
unrolled specimens were characterised by a strong ( interpass rolling was successful in reducing the longitudinal residual stress, particularly at the aforementioned interface, where it is just 200 MPa; rolling resulted in higher compressive stresses near the top of the wall; part geometry was modified by rolling resulting in an increase in the wall widths and a reduction in layer heights; the standard deviation of layer height was substantially reduced by rolling, which could make it easier to automate the wire + arc additive manufacturing process and to improve process repeatability. This may aid industrial implementation of the process; rolling did not eliminate distortion; however, it did reduce it to less than half the untreated level; while the neutron and contour methods agree well for the stresses in the wall, the stresses in the baseplate differ significantly probably because the plane stress condition used to estimate the stress-free lattice parameters for the neutron measurements is not valid in the baseplate. This could be corrected for by cutting out stress-free reference samples.
 MPa) tensile residual stress peak at the interface between the substrate and the linear deposit, which falls linearly with the distance from the substrate becoming compressive near the top of the wall; this is ascribed to bending distortion of the wall;
Given that other work has shown that rolling can lead to equiaxed microstructure,[18–20] this combined with the reductions in residual stress and distortion discussed here suggests that rolling is a useful tool for improving the quality of additively manufactured parts.
Footnotes
Acknowledgments
The financial support from the Engineering and Physical Sciences Research Council under grant no. EP/K029010/1 is acknowledged. The financial support from the AMAZE Project which is co-funded by the European Commission in the 7th Framework Programme (contract FP7-2012-NMP-ICT-FoF-313781), by the European Space Agency and by the individual partners is also acknowledged. Enquiries for access to the data referred to in this article should be directed to
Disclosure Statement
No potential conflict of interest was reported by the authors.