
Abstract
Abstract
Presented here are thermoplastic fused filament fabrication (FFF) three-dimensional (3D) printed piezo-resistive pressure sensors for daily activities utilized on a prosthetic feedback system. The 3D printed pressure sensors were manufactured from various low elastic modulus composites comprising a compressible thermoplastic elastomer and conductive carbon. Carbon is in graphite form and added in high filler ratios. The printed sensors were compared to sensors that were fabricated in a gravity mold to highlight the difference in printed sensors to molded sensors. The design is an improvement on the current prosthetic pressure sensors that are either strain gage or thick/thin film-based sensors. The 3D printed pressure sensor has a thickness and feel similar to human skin, has a simple fabrication technique, and can be manufactured into user-specific geometries. Being FFF 3D printed, the sensor can be easily printed in smaller or larger sizes to create custom layouts or patterns for pressure sensor feedback systems. Where strain gage sensors are bulky and expensive and thick/thin film sensors do not provide aesthetic comparability and require complex manufacturing techniques, result in higher costs. The material was first characterized to establish the operating applied constant voltage and to demonstrate the low elastic modulus. The results from the cyclic voltammetry showed an ideal operating voltage of −0.2 V, and the modulus of the different composite types ranged from 1.83 × 10⁻⁴ to 6.01 × 10⁻⁴ GPa. After characterizing the composites, each was tested under a force to measure the change in current with an applied load. The FFF 3D printed sensors are able to detect pressure levels between 340.63 Pa and 51.09 kPa, and the molded sensors are able to detect pressure levels between 17.03 Pa and 47.69 kPa. The work presented here shows that a 3D printed prosthetic pressure sensor can be fabricated for daily activities and how 3D printing can impact the medical field.
Introduction
I
The focus of this article will be on upper limb prosthetic pressure sensor feedback devices. One of the main feedback systems used in prosthetics are tactile sensors that relay to the user when the prosthetic has come in to contact with an object. Tactile sensors are typically composed of a pressure or shear sensor, and sometimes contain both types of sensors. A pressure sensor detects forces acting perpendicular to its loading surface, whereas a shear sensor detects forces acting parallel to its surface.
When referring to upper limb prosthetic pressure sensors, these sensors are typically placed on the hand of the prosthetic due to the role they play in manipulating objects and daily activities (DAs). Sensor types include capacitive, piezo-resistive/electric, inductive, optoelectric, and strain gage based. 10 The main design types used for current prosthetics for detecting pressure, or shear, are strain gage sensors.
Strain gage sensors provide a large operating range that can detect very high- or low-pressure values, but suffer from being bulky and expensive. This forces the prosthetic fingers to be large and decreases the fine motor grasping function of the prosthetic. Having less bulky sensors allows the fingers to have improved fine motor control and greater ease with manipulating large and small objects.
To overcome the barriers of strain gage sensors, academic research has developed many different types/styles of pressure sensors most commonly referred to as thick or thin film sensors. These thick/thin film sensors are mostly piezo-resistive/electric-based sensors, but can be transistor, capacitance, or optical based, and can achieve high and low force detection. Also, this type of sensor design has been used for shear force detection too.
Each of these two sensors has its benefits but lacks in the areas of size, feel, and manufacturing techniques. As stated before, strain gage sensors are bulky and expensive, while thick/thin film sensors do not have a synthetic skin feel or appearance, have complicated manufacturing processes, high costs, and have difficulty being implemented on to a prosthetic.
The film-based sensors in research have been shown to reach very low-pressure values, down to 0.001 Pa, and up to high-pressure values of 200 kPa.11–21 These pressure values are well within the human skin threshold for pressure detection, where human skin is able to detect between 100 Pa and 1 MPa with the pressure required for common daily tasks being 10 kPa. 22
These film sensors do a great job of detecting the typical pressures of DAs and even pressures beneath a light touch on human skin. However, for these sensors to exist, they require complicated manufacturing processes and are subsequently expensive due to the materials used and complex fabrication. In addition, the sensors do not create a look or feel similar to human skin, and have a hard or smooth plastic finish that makes it difficult to be implemented on a prosthetic.
Thick/thin film sensors are simply composed of a top and bottom flexible layer, an inner conductive layer, and then a top and bottom electrode surface for signal recording. To flesh out the details of a few typical film sensor designs, they would include the following. (1) A micropillar array-based pressure sensor with the active pressure sensing area that comprised a PPy/PDMS substrate and an Au covered micropillar array. The pillars would have a repeating cell unit of 70.0 × 120.0 μm with the diameter of the pillars varying from 5 to 65 μm. (2) A microstructured rGO/PDMS film and an ITO-coated PET film, created through the use of silicone mold masters, were created from a photolithography method. The molds were then subjected to the elastomer precursor, which created a base layer to do a layer-by-layer fabrication method to add layers of uniform microstructure graphene to the elastomer surface. (3) Or laminating two layers together, where the bottom layer contains a source–drain electrode and the semiconducting polymer and the top contains the gate electrode and the microstructure dielectric.13,14,18
To overcome the pitfalls of strain gage and thick/thin film pressure sensors for prosthetics, we propose a fused filament fabrication (FFF) three-dimensional (3D) printed piezo-resistive pressure sensor for daily activity sensing. The 3D printed pressure sensor will be manufactured out of a composite comprising a low elastic modulus compressible thermoplastic elastomer, and carbon, in graphite form, as the conductive material in high filler amounts.
The sensor is mechanically compressible to allow for a change in resistance, 3D printed in one step with no postprocessing needed, flexible, has a rubber finish that allows it to be similar to human skin, can be customized to various designs to match the user's need, and has a thickness within the average human skin thickness.23,24
There have been many advances in 3D printing of medical devices but none for FFF 3D printed pressure sensors or sensors with highly elastic materials. Current work includes a larger area of topics but some key areas include tissue scaffolding, 25 anatomical molds for veterinarian research, 26 surgical and patient training,27,28 direct skeletal attachment system, 29 and prosthetic hands/fingers.30,31
Materials and Methods
All parts were printed on a MakerGear M2 with Simplify3D software, and tested on an MTS Model Sintech 1/S tensile machine (maximum load cell capability of 1000 lbs) and CH Instrument for measuring changes in current. Two types of sensors were created for this article: one using gravity molds for baseline testing and then 3D printed sensors using SOLIDWORKS 3D CAD software and pellets of the composite fed through a filament extruder to create a 1.75-mm-diameter filament for 3D printing.
Poly styrene ethylene butylene styrene (SEBS), the compressible thermoplastic elastomer, was chosen due to its synthetic skin feel, compressibility, and easy application in injection molding. Since FFF 3D printing has a close relationship to injection molding, it provided an addition benefit along with its tactile feel and synthetic skin applications.
The composite was created by first dissolving SEBS pellets in toluene, with a 1.2:1 ratio of toluene to SEBS, to break it down to a gel-like state since SEBS is a difficult polymer to get into a flowable state without being injection molded. To incorporate the conductive material into the polymer, the material needed to be in a state where it could be stirred. To accomplish this, the toluene was added to the SEBS pellets and left for 24 h at room temperature to dissolve the polymer.
Once in a liquid/gel-like state, the conductive material graphite was added to the mixture. Multiple iterations were created to show which composites are conductive and how it changes as the ratio increases. In addition, we demonstrate how to FFF 3D print with materials with low elastic modulus and high filler ratios, with the density of SEBS and graphite being 0.85 and 2.25 g/cm3, respectively.
The mixture was then thoroughly stirred until the carbon had fully dispersed within the polymer and toluene solution. From here, the mixture was placed in a gravity-fed mold and allowed to sit for 24 to 48 h until the toluene had evaporated out of the mixture. Toluene was chosen for this reason since it is highly evaporative at room temperature and pressure.
When the toluene evaporates out of the mixture, it leaves only the carbon distributed within the SEBS polymer (Fig. 1). The distributed particles can now be compressed when pressure is applied and brings them closer together. This allows for a change in resistance to take place due to the decrease in space between the conductive particles.

Left image represents the compression of conductive particles causing a change in resistance and the enlarged nozzle and heating chamber compared to original nozzle and heating chamber diameter. Right image is the pressure sensor test fixture with dotted white arrows indicating applied voltage direction. (Bottom) Left image shows the molded/nonprinted sensor design on the left and the FFF 3D printed sensor design with a centimeter scale across bottom. Right image shows sensor surface images with 100 ×
After the toluene has evaporated out, the composite is removed from the mold and cut into 12 × 12 mm2 samples with a thickness of 2.54 mm for testing. This same process was done for creating the pellets for the filament for 3D printing. The pellets were fed into a filament extruder at 95–100°C to create the 1.75-mm diameter. The filament was fed through the FFF 3D printer with the settings in Table 1 and was fabricated into the sample size as stated above. The quality of the filament postextrusion shows no breaks or tears in the filament. In addition, the filament has a consistent diameter along the entire length of filament with only a 0.05 mm difference in between the 1:1 and 1.33:1 sensor filaments.
FFF, Fused Filament Fabrication.
Filament strands were tested under tension to demonstrate the composite's low elastic modulus (Fig. 2) for results. To determine the optimal applied voltage, cyclic voltammetry (CV) was performed on a molded sample with no applied pressure (Fig. 2) for results. From here, the determined applied voltage of −0.2 V was used with calibrated masses for testing the molded and 3D printed samples.

Top row from left to right shows CV curve of an unloaded molded pressure sensor, 1.33:1 sensor ratio, and 1:1 sensor ratio to determine optimal applied voltage. Center row left graph shows tensile testing of sensor composites, ABS, and PolyFlex filament (ABS is sharp solid line curves, PolyFlex is dashed line curves, and the composites are the bottom cluster of curves). Center row right graph shows a zoomed version of the sensor composite filaments only. Sensor composite filaments are plotted with a moving average with the top two runs being the 2:1 ratio down to the 1:1 ratio runs at the bottom. Bottom graph shows the maximum tensile strength versus sample number. The sample numbers 1–8 represent the four different filament ratios and the two samples in each filament type. CV, cyclic voltammetry.
Results
Tensile testing had a sample size of N = 2 to categorize the elasticity of the composites and compare it to two known 3D printing filaments, one being ABS and the other being PolyFlex, which is a flexible, large strain material. After characterizing the multiple moduli and ideal applied voltage, the different samples were tested with masses ranging from 0.25 to 750 g, with an error in mass of 0.00019%. The various composite mass-to-mass ratios used were 0.75–2.00:1.00 to demonstrate the lower limit of a conducting material to the upper limit of which ratios can be fabricated, FFF 3D printed, and the lower limit of pressure detection.
Printed samples were printed longitudinally or perpendicular to the direction of applied compression to provide the greatest strength since printing parallel to the direction of applied compression would result in a weaker part due to the layer adhesion strength of FFF parts, this affect has been seen here. 32
All pressure testing samples were placed on to the custom test fixture with a copper plate at the bottom, acting as the bottom electrode, and a copper wire placed on top of the sample with vinyl insulating tape to prevent any electrical interferences with the copper wire and the brass weights (Fig. 1). The copper wire in our test setup carries the applied voltage and the copper plate carries the output signal to the CH Instrument.
The testing showed that the lowest composite mixture of 0.75:1 ratio of graphite to SEBS was not conductive under any pressure or applied voltage, while the 1.00–2.00:1 ratios were. Also, the only samples that could be FFF 3D printed were the 1:1 and 1.33:1 mixtures, the 0.75:1 mixture could have been 3D printed but was not since it proved to be not conductive. Composites with a ratio of 1.66:1 or 2:1 were not able to be FFF 3D printed due to the lack of thermoplastic matrix.
In order for the samples to be 3D printed, the extruder nozzle and heating chamber diameter needed to be increased from the standard 0.35-mm to a large 1.58-mm diameter for both 1:1 and 1.33:1 sensor ratios. This large diameter in tandem with the 1.75-mm-diameter filament results in very little backpressure to the feeder gear and using almost solely radiating heat to make the composite filament in a flowable state. This style of printing is different from the standard FFF 3D printing technique, where temperature and pressure are used to make the filament flowable for extrusion.33–35
The pressure sensors were designed to meet the demands of DAs or be designed into a two-part system, where two different composite mixtures would be used to create an overall sensor design that could accommodate the feedback needed for DAs. The pressure sensors presented here are capable of achieving values as low as 17.03 Pa and up to 51.09 kPa, with the pressures seen during DAs being 10 kPa and a light touch being 100 Pa.
FFF 3D printed sensors are able to detect between 340.63 Pa and 51.09 kPa and the molded sensors able to detect between 17.03 Pa and 47.69 kPa. Since the molded sensors can have a higher percentage of conductive material to polymer matrix, they are able to have a greater sensitivity to changes in pressure, where the 3D printed sensors need to have a greater percentage of polymer matrix to be FFF 3D printed. The molded samples are still an advanced manufactured pressure sensor since they can be molded into a variety of 3D printed molds to create point-of-care and embedded pressure sensors for prosthetics or other medical devices.
Discussion
Material characterization
The results from the tensile and CV testing show that the sensor has a low elastic modulus and an operating voltage of −0.2 V. This shows how flexible the sensor is, across multiple composite ratios, and that it requires a low operating voltage making it safe for use with prosthetics and interfacing with objects.
Tensile testing used fixtures where the filament wrapped around a top and bottom barrel and was fixed in place leaving a precise gage length for testing. Samples were pulled at a strain rate of 500 mm/min, following the ASTM D638 standard. Five hundred millimeters per minute were chosen over 5 or 50 mm/min because the high strain rate places more emphasis on the elastic region of the composite rather than the energy dampening effect of composite.
From the results we can see that with the increase in filler mass or volume, the ultimate tensile strength and elastic modulus increase from 1.83 × 10⁻⁴ GPa for a 1:1 ratio to 6.01 × 10⁻⁴ GPa for a 2:1 ratio, with 1.33:1 and 1.66:1 having a modulus of 3.17 × 10⁻⁴ and 4.64 × 10⁻⁴ GPa, respectively. Where the increase in mechanical reinforcements to a matrix increases the load absorbing properties by allowing a transfer of load to the higher strength material from the weaker matrix and decreases the mechanical strain a composite can withstand caused by the reinforcement material. The data are plotted with a moving average to remove noise from the data plots and show the sample variance between the 1:1, 1.33:1, 1.66:1, and 2:1 filament ratio samples to be 4.46%, 4.12%, 0.69%, and 0.84%, respectively. In addition, plotting the maximum tensile strength versus sample number shows an R2 of 0.927 demonstrating a high correlation and linear trend in the data (Fig. 2). The sample numbers 1–8 represent the four different filament ratios and the two samples in each filament type. For example, samples 1, 2, and 3 are filament types 1:1, 1:1, and 1.33:1, respectively.
When comparing the composite modulus results to ABS or PolyFlex, which are 0.18 and 2.72 × 10⁻³ GPa, we can see in Figure 2 that the modulus and additionally the maximum tensile strengths of the composites are low compared to these standard FFF 3D printing materials. This demonstrates that the sensor material is extremely weak with maximum tensile strength between 0.00057 and 0.0011 GPa. Whereas ABS and PolyFlex have tensile strengths of 0.41 and 0.70 GPa.
The second material characterization was the CV testing to determine the ideal applied voltage level. This test was performed on a 12 × 12 × 2.54 mm sample with a 2:1 composite ratio with no applied pressure to its surface.
The CV test is performed with a CH Instrument with five sweeps from −1.0 to 1.0 V and measures the current output, where a sweep is from −1.0 to 1.0 V. From here, the ideal voltage is selected by choosing the location where the greatest overlap of sweeps occurs. The ideal voltage chosen for the composite ratios was −0.2 V. When reviewing Figure 2, we can see that there is more scatter at the outer edges of the sweep pattern. If a voltage was chosen within the scatter areas, then it could induce noise into the pressure sensor data and cause an error in the recordings. In addition, if a voltage is picked that is too close to 0.0 V along the sweep pattern, then there will not be a large enough current amplitude offset from zero.
The same applied voltage was used for consistency across all data samples, except for the 1:1 3D printed sample due to fabrication techniques. If multiple composites were to be used in tandem to create a dual-purpose pressure sensor, then having one voltage for calibration would reduce the system complexity. The CV curves for the 3D printed samples show that there are greater variance and noise in the 3D printed samples compared to molded samples, which helps demonstrate that the FFF 3D printing process creates gaps/voids that increase the resistance and decrease the uniformity of the print. Last, the CV curve for the 1:1 3D printed samples shows that there is linearity at −0.2 V but due to the extremely low current at −0.2 V, the higher −0.5 V is required to provide a greater pressure detection range.
FFF 3D printed and molded pressure sensors
After determining the applied constant voltage and characterizing the composites mechanical properties, the molded and 3D printed samples with ratios ranging from 0.75:1 to 2:1 were tested to determine the pressure range that each sensor type could record. The molded samples were formed in a cylindrical mold and cut into the 12 × 12 × 2.54 mm samples, while the 3D printed samples were printed with a layer height of 0.6 mm and seven shells to print the 12 × 12 × 2.54 mm sensor. A layer height of 0.6 mm was the only successful printing layer since smaller layer heights caused large gaps to occur and a larger layer would cause the last layer to be drastically different from the lower layers. Once the samples were fabricated, the samples were placed on the pressure sensor fixture and calibrated masses were placed centered on top of the sensor (Fig. 2).
The FFF 3D printed shape presented here (Fig. 1) is the best quality that can be printed with current FFF technology. One of the main reasons is that when the filament is fed through the feeder gear and idler pulley, the filament begins to slip and becomes stationary during extrusion, in turn causing no filament to be extruded. The slippage is caused by the extremely soft, flexible, low-friction carbon-filled filament, and the backpressure seen at the extrusion nozzle causes the filament to slip or buckle in some situations.
To overcome this with current FFF feed system, the extrusion multiplier needs to be greater than one, baseline, to keep up the filament extrusion with the slippage. The extrusion multiplier causes the rate of extrusion from the feeder gear to be larger than the predefined software feed rate. Due to this higher rate of extrusion, the filament can come out during nonslippage points in larger volumes, which causes lobes to be printed instead of continuing the fine line. The presented 3D printed sensors still provided accurate results based on the slopes/trends and high correlation values shown in Figure 4 of the 3D printed versus molded samples, and that the overall shape has slight dimensional changes compared to the molded samples.
The printed sensors have an increased contact area of 5.4 and 0.4 mm2 for the 1:1 and 1.33:1, respectively, from the 150.2 mm2 baseline molded samples. This could theoretically cause an increase of 3.475% and 0.278% detectable pressure for the 1:1 and 1.33:1 3D printed sensors, but the trend in data shows that it has little impact in overall performance. Also, the printed sensors are fabricated on a glass plate, which causes the bottom of the sensors to be completely flat and with no gaps in material. The copper electrode placed on top is also not a plate, like the bottom electrode, and is a copper wire that allows the wire to conform to the top of the sensor if necessary.
To resolve these issues, a new filament feed system would need to be developed and tested. The system would need to replace the feeder gear and idler pulley with a double-sided vertical rubber belt feed system that can increase the contact area against the filament and support the filament in between the feeder system and heating nozzle to prevent slippage. Second, the distance between the feeder system and heating nozzle will need to be reduced to help prevent buckling within the feeder system. This will help provide a constant flow rate of filament and allow for the increased extrusion multiplier to go back to baseline.
Finally, we performed multiple extrusions tests before final printing and found that only printing with the currently showing printing parameters is successful. If the nozzle size is any smaller, the filament will slip and buckle constantly causing no filament to extrude. The filament can only be consistently extruded at 267°C, with a ±2°C tolerance, since there is little polymer matrix left in the composite causing the filament to only be flowable/workable at a small window. Any higher temperatures cause the polymer to expand rapidly, which forces the carbon against the heating chamber wall and causes the filament to get stuck and break off. Additionally, extruding at lower temperatures does not make the filament extrudeable and simply passes through the extrusion nozzle without becoming flowable. To ultimately overcome these issues, a new feeder system, described above, would need to be developed, fabricated, and tested.
Table 2 shows the minimum and maximum pressures each molded and printed sensor can detect along with the masses used to reach each pressure. From the table, we can see that there is a difference in the maximum and minimum pressures detected based on the ratio used. There are large differences between the lower and high ratio composites where the 1:1 and 1.33:1 are able to detect higher pressures than the 1.66:1 and 2:1 sensor composites.
Within the molded samples, the higher ratio sensors are able to detect between 0.0170 and 20.4375 kPa (0.25–300 g), whereas the lower 1.33:1 and 1:1 ratios are able to detect between 0.3406–20.4375 kPa (5–300 g) and 2.0438–47.6875 kPa (30–700 g) (Fig. 3). Where these sensors are able to detect a whole magnitude beneath a light touch on the human skin, and 370% over what is required for DAs.
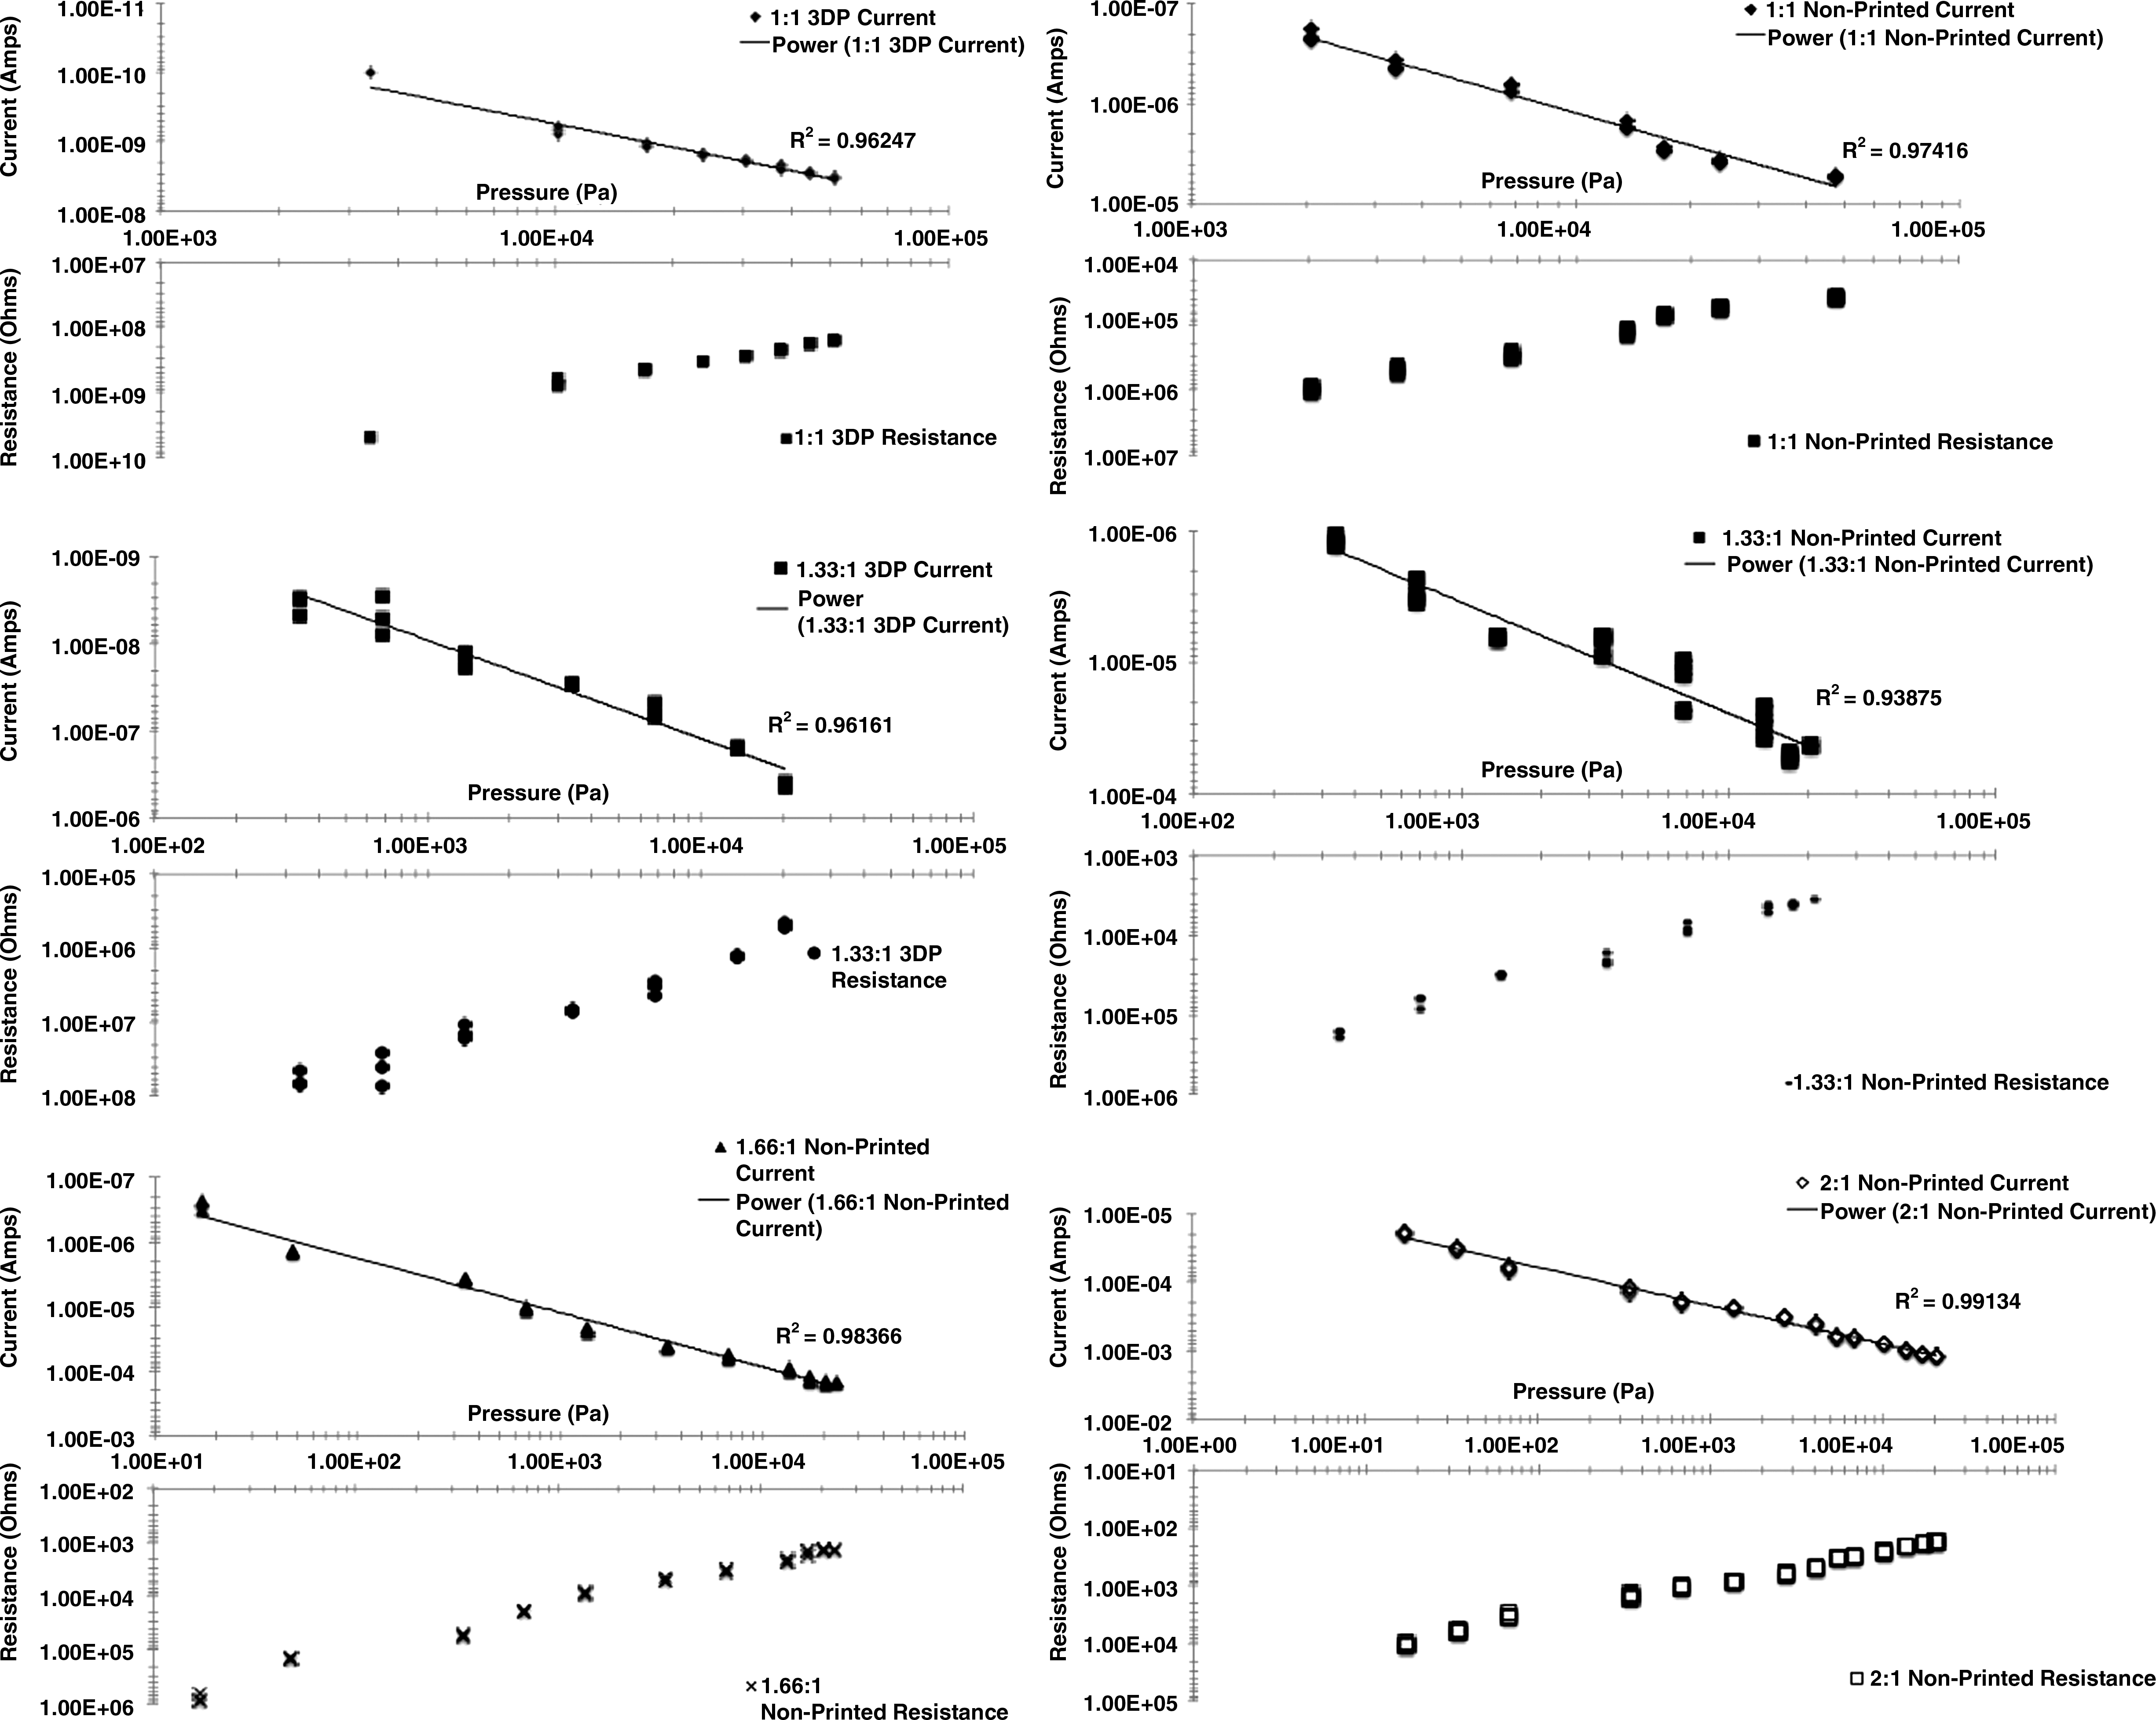
Pressure versus current and resistance data for FFF 3D printed and molded composite sensors from 1:1 to 2:1 ratios.
Within the 3D printed samples, there are only slight changes from the detectable levels for the composites that are 3D printable to the molded samples. For the 3D printed samples, only 1:1 and 1.33:1 sensors are able to be 3D printed due to thermal expansion and the large-volume fractions of conductive material within the matrix. The printed and molded pressure trends are compared in Figure 4 along with the response times and slopes for each mass at each percentage of applied load to develop a predictive response time system.
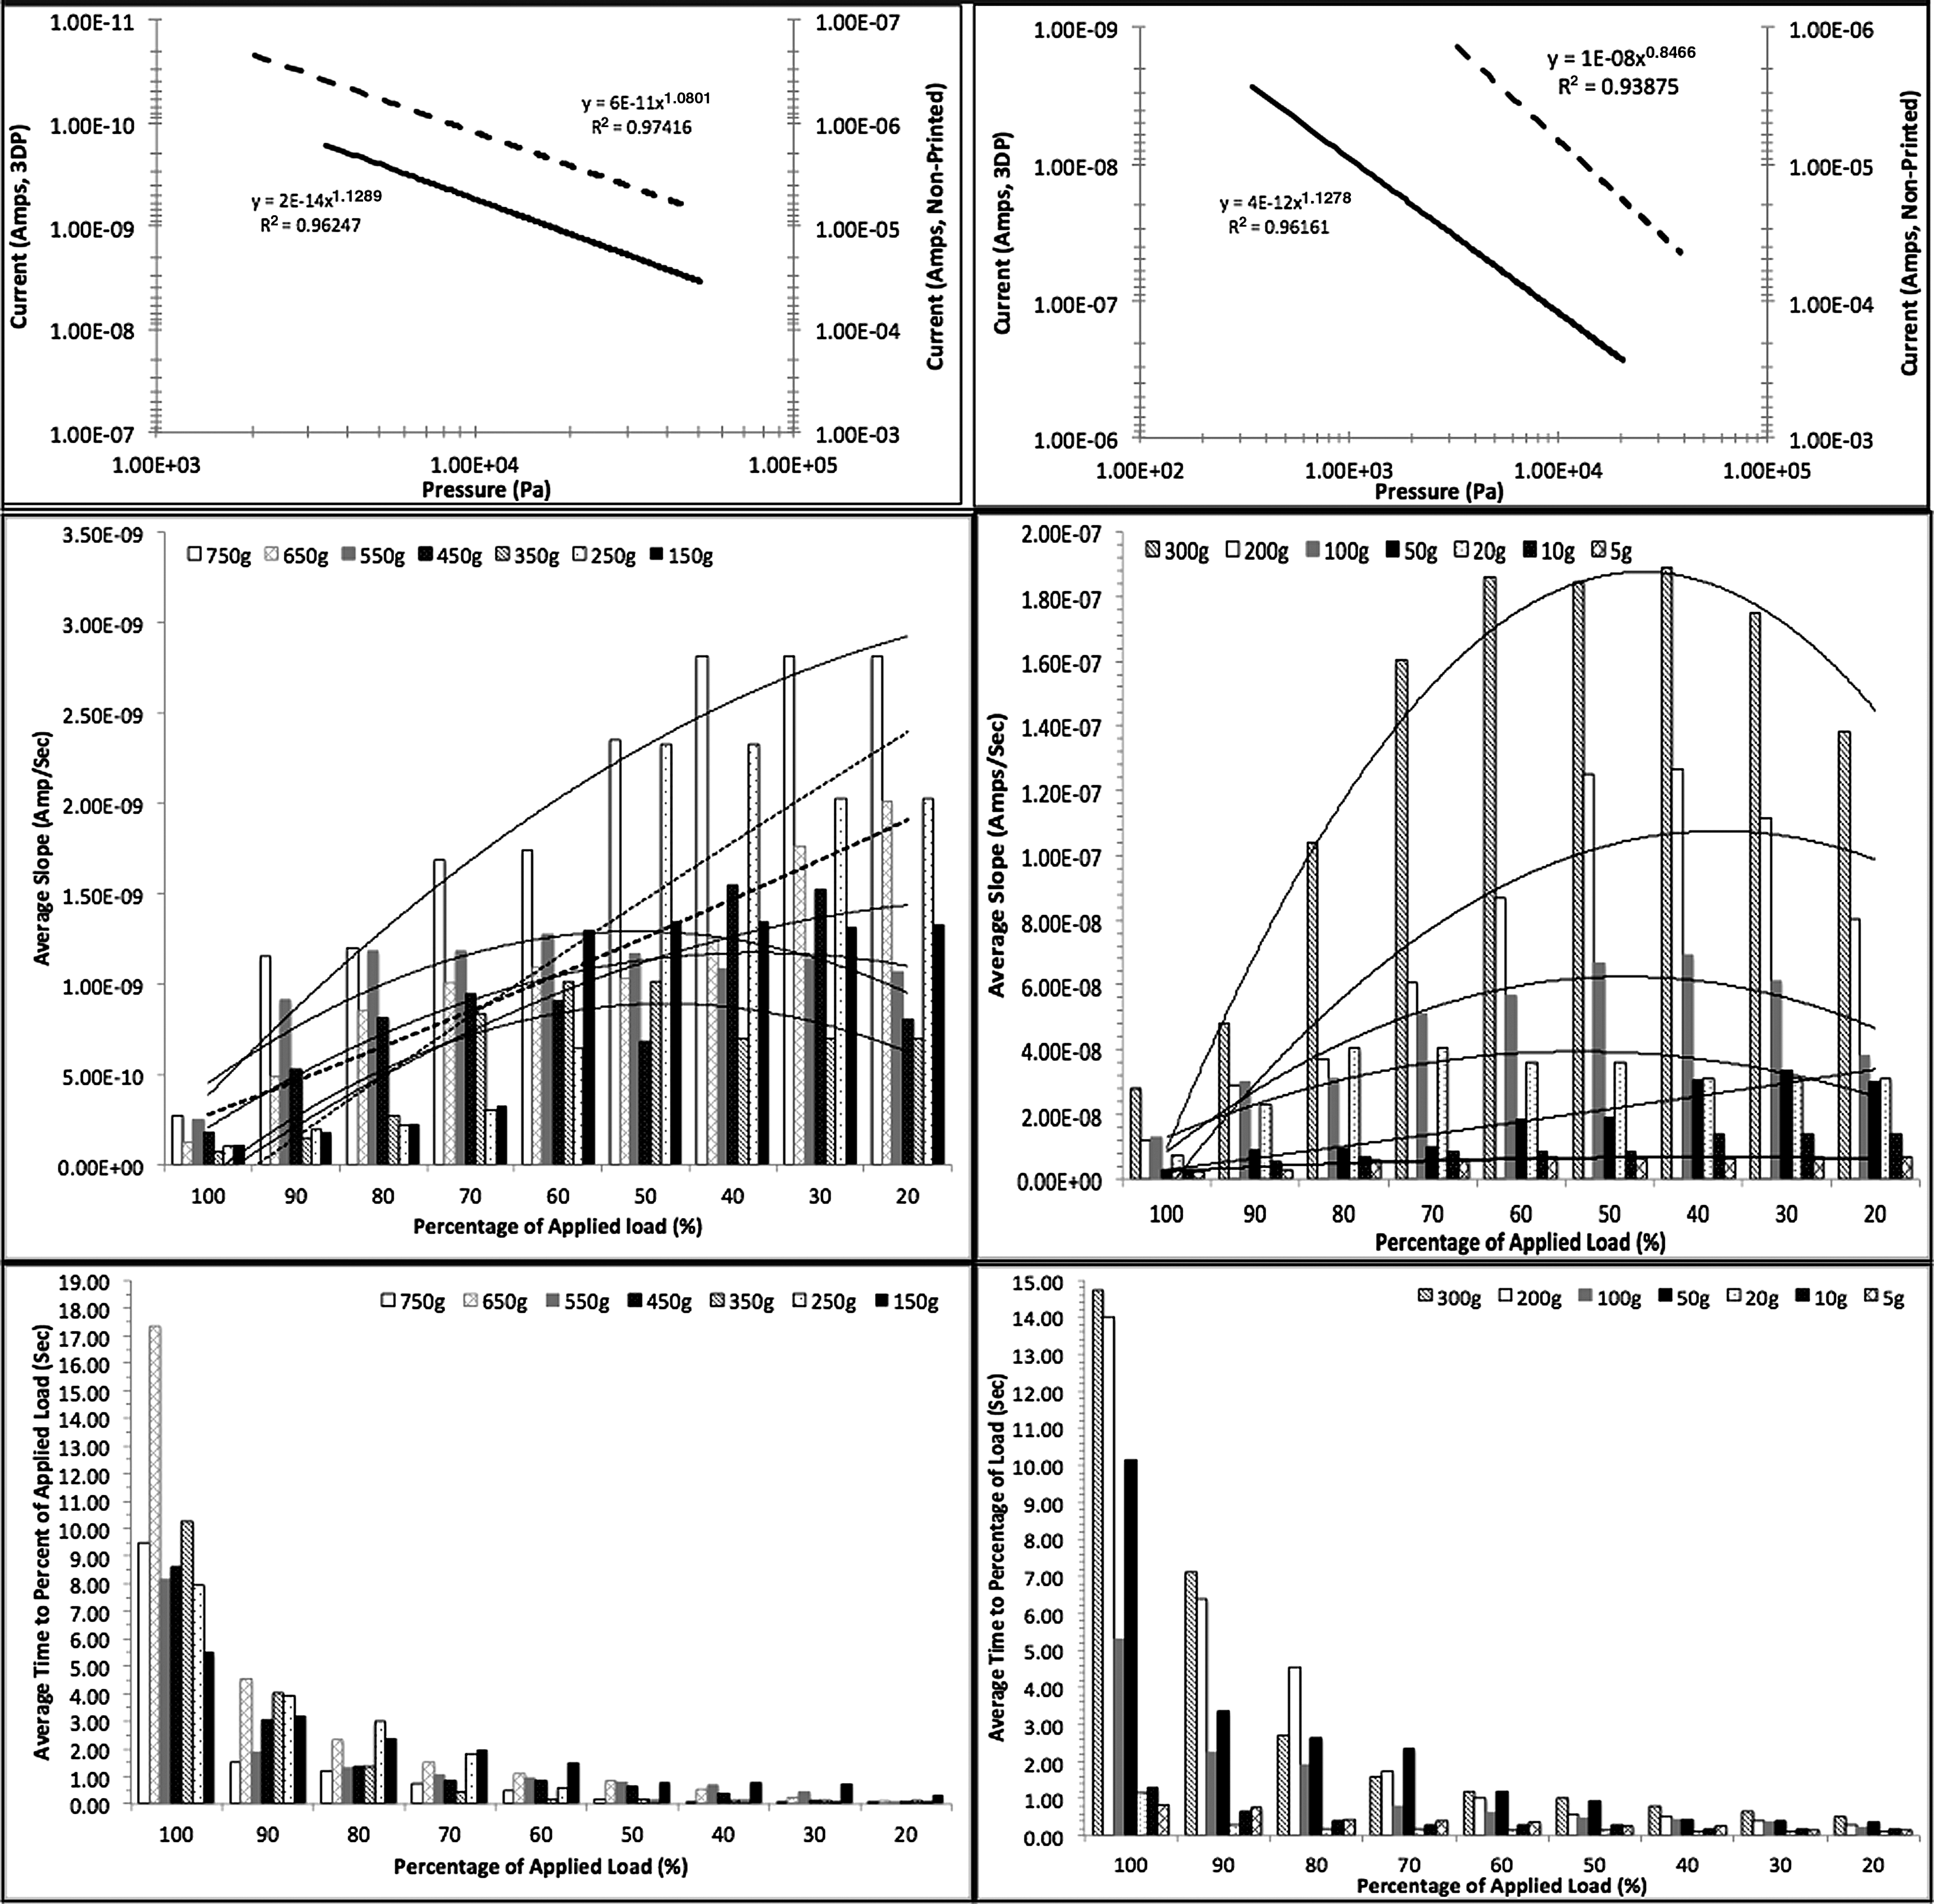
1:1 ratios on left and 1.33:1 ratios on right. Top row: Pressure versus current fitted power lines of 3D printed (solid lines) and nonprinted sensors (dashed lines) to demonstrate the similarity in data trend. FFF 3D printed samples have slight changes to their pressure detection ranges due to manufacturing fabrication. Center row: Average slope versus percentage of applied load. Bottom row: Average time to percentage of applied load.
The 1:1 sensor is able to detect between 3.4063 and 51.0938 kPa (50–750 g) and the 1.33:1 sensor has the same range as its molded equivalence. The reason for change in detectable range is that, during the printing process, there are gaps or spaces that occur between each layer causing a greater compression needed to compress the graphite particles closer together to make an initial path for the current to travel across. In addition, the conductive particles could be slightly rearranged during the printing fabrication and cause there to be gaps or voids within the composite causing a break in the current path. This needs to be studied in further detail to confirm our hypothesis, but for the 1:1 printed sample, an applied voltage of −0.5 V was needed for testing, to point toward the addition of voids/spaces caused by FFF 3D printing.
The data for the pressure sensors are plotted on a log10 graph, Figure 3, with resistance and current shown. The data follow a linear trend with high R2 values with a power analysis, R2 ≥ 0.93 for all samples. At each pressure value shown, a sample size of N = 3 was used to show the variation in data with the same pressure applied.
When the 3D printed sensors are compared to their molded equivalent, we can see that the samples follow similar trends differing only in their output current value, Figure 4. Where the 3D printed samples are operating on an output current value four magnitudes lower than the molded samples, this holds true for the 1:1 and 1.33:1 sensors.
For the 3D printed response times, the total response time to a complete steady-state value is greater than 5 s due to the design requirements for an FFF 3D printed flexible, compressible, piezoresistive sensor. To have response times <1 s, commonly seen for mass production strain gage pressure sensors at 90% of applied load, we need to use a predictive measuring system. Figure 4 shows the average slope versus the percentage of applied load, and the average time versus the percentage of applied load for the 1:1 and 1.33:1 sensors. For example, the percentage of applied load implies that at 100%, the sensor is at steady-state current levels for that particular mass.
These plots show that a response time for under 1 s can be determined by using the unique slope seen at 50% of applied load or by using the change in slope from 20% to 50% of applied load. For the masses 20 g and under for the 1.33:1 sensor, response times for below 1 s can be seen at 90% or less of applied load due to low pressure. This is valuable for fine motor control for prosthetics since performing fine motor tasks is ideal for increasing prosthetic performance.
Using a moving two-point average for the plots, black lines on bar graph, we can see a common parabolic, or inverted parabolic, curve trend for the 1.33:1 and 1:1 sensors. This curve represents the nonlinear uptake of pressure that shows an initial high rate of load detection and then a decline in rate when the pressure gets close to steady-state internal pressure. The two dashed (250 and 650 g masses) moving two-point average plots on the 1:1 sensor graph are the plots following a linear trend instead of the parabolic curve. These two curves still follow the initial high rate followed by the decrease in detection rate though. The overall trend between both sensors is that as the applied load decreases, the slope at each percentage of applied load decreases with a few data points that do not follow the trend shown.
FFF 3D printing with large nozzle diameter
For printing on an FFF device, it is difficult to force a weak and flexible material through the nozzle for extrusion. The difficulty is caused by the fact that the filament relies on the hot nozzle temperature along with pressure from the feeder gear that is located away from the heating chamber and nozzle. With the composites described here, the difficulty happens since the feeder gear is far away from the nozzle, causing buckling within the feeder tube, heating chamber, and nozzle (Fig. 1).
To combat this, the nozzle and heating chamber diameter was expanded to 1.58 mm, which is almost the same diameter as the filament, to decrease the chance of buckling within the system. When the filament is in our heating chamber, it expands to a diameter of 1.75 mm, now the nozzle diameter is only being reduced 0.17–0.22 mm from the filament diameter, where printing with ABS uses a 0.35 mm nozzle diameter and causes a diameter reduction of 1.4 mm. The larger nozzle opening allows for little back pressure on the filament and also compensates for the composite thermal expansion. Since the composite uses a filler material that is incompressible and nonflowable, when the polymer matrix expands it pushes the graphite particles outward and increases the diameter of the filament without having the particles transition to a molten state. Therefore, we have to apply mostly radiating heat with very little pressure and slow speeds to 3D printing the composites with large filler ratios.
Design impact/advantages
The FFF 3D printed pressure sensors presented here can be used as a pressure sensor for DAs and can be used to detect levels just above a light touch. Since the 1:1 or 1.33:1 3D printed sensors can detect between 3.4063–51.0938 kPa (50–750 g) and 0.3406–20.4375 kPa (5–300 g), with DAs and a light touch operating in the 10 kPa and 100 Pa range, the sensors presented here can be used in conjunction with one another to create a dual or zone sensor that can operate for the DAs and light pressures. This allows for a low-cost, simple fabrication and low-level detection pressure sensors that can be customized to the users' needs and wants. Figure 5 visually shows the sensors presented here compared to thick/thin film sensors and human skin pressure levels.
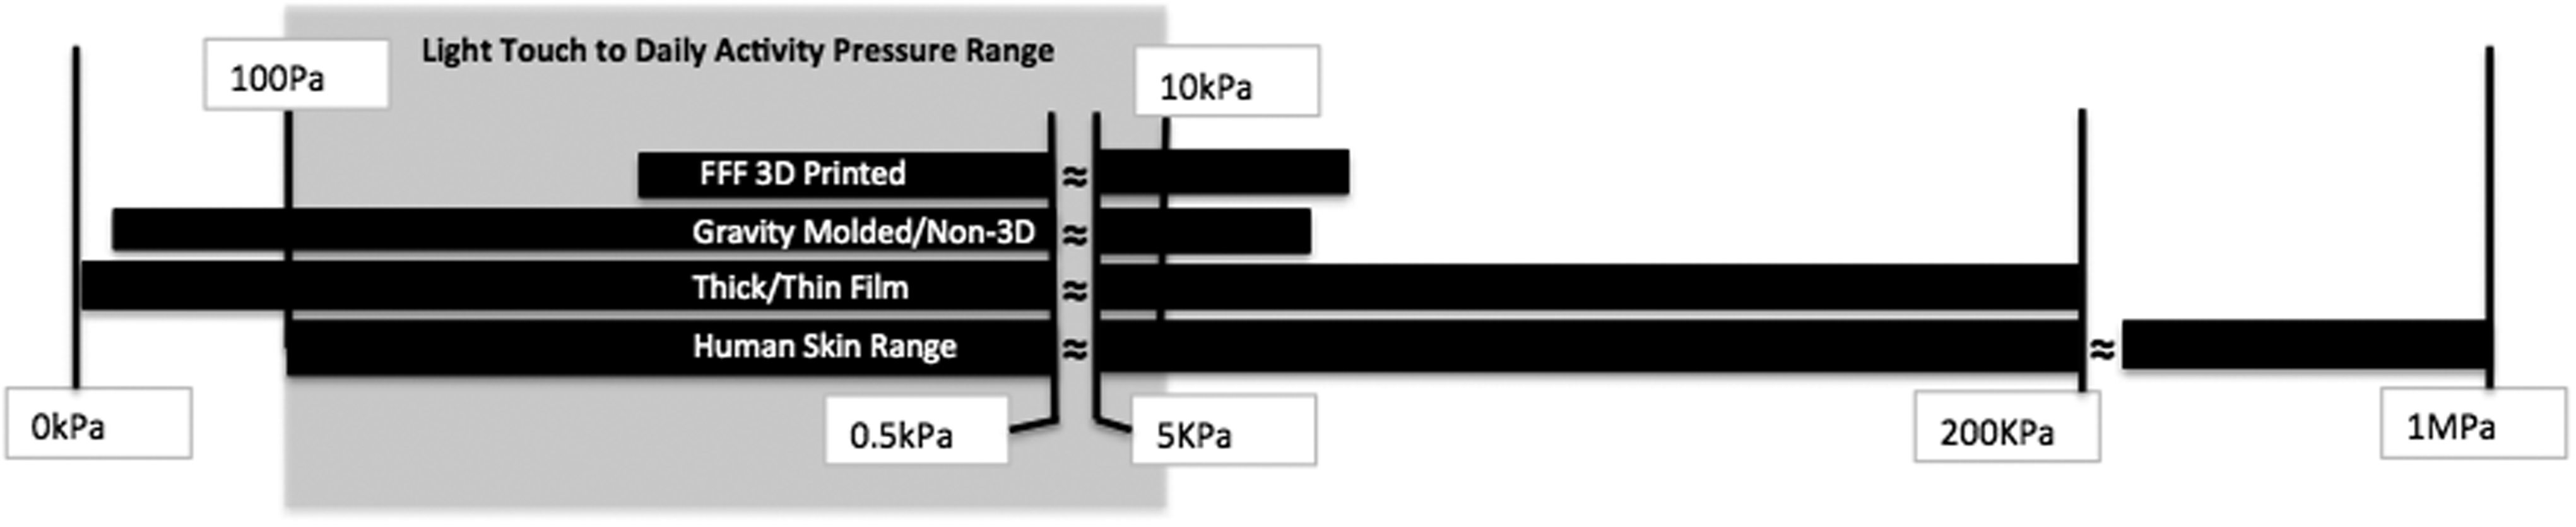
Pressure sensor ranges of the FFF 3D printed and molded sensors compared to current thick/thin film sensors and human skin detection limits.
The 3D printed sensors also have the ability to be embedded within a 3D printed part to allow for complex devices to be manufactured or create pressure sensors with unique geometries to be placed in locations that currently are difficult to place a sensor in. Being able to 3D print a fully function sensor without the needed for additional manufacturing or only being able to 3D print housing for a sensor will open up the opportunities for new and intelligent completely 3D printed devices.
In addition, the molded sensors can be formed in any 3D printed mold to also create unique geometries and ideal pressure sensor designs. These molded sensors will not have the same flexibility and ideal fabrication techniques, but they can allow for a low-cost, effective pressure sensor that can detect pressure values all the way down to 17 Pa, well below the pressure value for a light touch. Detecting values well below the light touch threshold will allow prosthetics to be able to detect the early onset of contact with an object, allowing the user to have feedback before a person without an amputation can detect.
Conclusions
We present here an alternative to the current strain gage and thick/thin film pressure sensors with a 3D printed piezo-resistive pressure sensor that can operate within the daily activity range and within the same magnitude as a light touch on human skin. We have also presented other advanced manufactured sensors that can form into a 3D printed mold and detect pressure ranges down to 17 Pa and up to 47 kPa.
The 3D printed sensors can be printed in one step with no postprocessing needed and has an approximate manufacturing cost of $0.125, ignoring equipment and manufacturing overhead. The sensor can also be embedded within a 3D printed prosthetic or part to create intelligent, one-step manufacturing devices. The option for creating embedded electronics will allow for improvements and help grow the area of 3D printing and medical devices. We have also demonstrated a type of radiating heat 3D printing with little nozzle pressure to create 3D printed parts with high filler composite filaments.
Future directions are to characterize the existing composites as shear sensors for prosthetic feedback systems, to further study this style of radiating heat 3D printing with other thermoplastics, thermosets, and filler materials, and to apply the technology to other medical devices and robotic grippers.
Footnotes
Author Disclosure Statement
No competing financial interests exist.