
Abstract
Abstract
Natural sedimentary rocks can be widely heterogeneous and often include discontinuities on many scales—no two samples are truly identical. This poses a major roadblock for geomechanical experiments since most of them are destructive in nature. Recent advances in additive manufacturing technology allow fabrication of identical sandstone analogs. The technology allows control over grain size, packing, mineralogy, cementing type and content, bedding orientation, and discontinuities. This article explored how curing temperature affects the strength of sand and furfuryl alcohol resin-based specimens. When cured at optimal oven temperature of 80°C, specimens reach unconfined compressive strength (UCS) of 19.0 MPa with only 1.1 MPa in standard deviation. Additionally, this article determines a minimal number of UCS test repetitions required to reach a desired degree of confidence in the strength results. Outcomes of this study can be used as a guide in preparing and strength testing of furfuryl alcohol resin and sand powder-based 3D printed rocks.
Introduction
E
Recent developments in additive manufacturing technology offer new prospects for producing consistent sedimentary rock analogs.7–9 Osinga et al. recently explored powder deposition-based 3D printing of geomaterials with furfuryl alcohol resin and sand, 10 generating sandstone analog samples with highly consistent strength. Fabrication of identical clastic rock samples can be a challenging task. The strength of rocks can vary greatly with average grain size,11–13 type and frequency of grain contacts,12,14–16 mineralogy, 12 cementing type and amount, 17 moisture content,14,18 bedding orientation,19,20 and rock discontinuities. 21
In this study, we investigated the impact of curing temperature on strength of 3D printed sandstones, while fixing other major parameters, such as grain size distribution, porosity, binder content, bedding orientation, and sample dimensions. At first, 97 furfuryl alcohol resin and sand-based samples were cured at different temperatures and tested for strength, uncovering an optimal curing temperature. Then, a statistical analysis was conducted on strength data of 51 optimally cured samples, elucidating required number of unconfined compressive strength (UCS) test repetitions for different degrees of confidence in experimental results. The resulting material exhibited UCS standard deviation of just 1.1 MPa, which is unprecedented in natural sandstone samples. This study can be used as a guide for preparation and UCS testing of furfuryl alcohol resin-based 3D printed sandstone analogs for geomechanical research.
Materials and Methods
Sandstone analogs were prepared using Binder Jetting technology with ExOne's MFlex 3D Printer, and the overall printing process consisted of three core steps: mixing sand powder with an acid catalyst, alternating deposition of sand and binder on print bed, and curing of the parts in the oven.
Premixing sand powder with acid catalyst was needed for full crystallization of the binding liquid. ExOne FA001 activator, mainly composed of P-toluenesulfonic acid was used as a catalyst. We combined 1.4 g of acid catalyst with every 1000 g of silica sand and mixed thoroughly for 2 min at 135 rpm before printing. This ensured that traces of acid were evenly distributed within the sand powder.
The sand powder was deposited in layers by a vibrating hopper, which moved at a constant recoating speed of 200 mm/s and fixed height of 6 mm above the powder bed. Every layer of the sand powder was 250 μm in height, which was only slightly greater than the typical diameter of used sand. Particle size distribution of the silica sand had D10, D50, D90 of 110, 175, and 220 μm, respectively.
Binder liquid was dispensed as a directed cloud of microdroplets from a print head with 4*256 piezoelectric nozzles. The printhead dispensed binding material on the powder bed in parallel lines spaced closely together. The nozzles were spaced to generate 64 μm spacing on the powder bed in x-direction. The 138 μm spacing of the binder in y-direction was obtained by printing at a rate of 200 mm/s at fixed frequency in dispensing droplets. Manufacturer estimate of the average droplet volume was 65 pL. The droplets would spread on the sand grains, whereas furfuryl alcohol surface tension minimized the liquid–air interfacial area. 22 Hence, binder mostly accumulated near the sand grain contacts and formed connecting bridges (Fig. 1). Since the sand powder layer height was only slightly greater than the size of typical sand grain, it is safe to assume that majority of the grains were directly in contact with binder, resulting in nearly uniform infiltration of the sand pack. The binding liquid used in this study (ExOne FB001) was composed mostly of furfuryl alcohol with traces of bisphenol A, resorcinol, and 3-aminopropyltriethoxysilane.
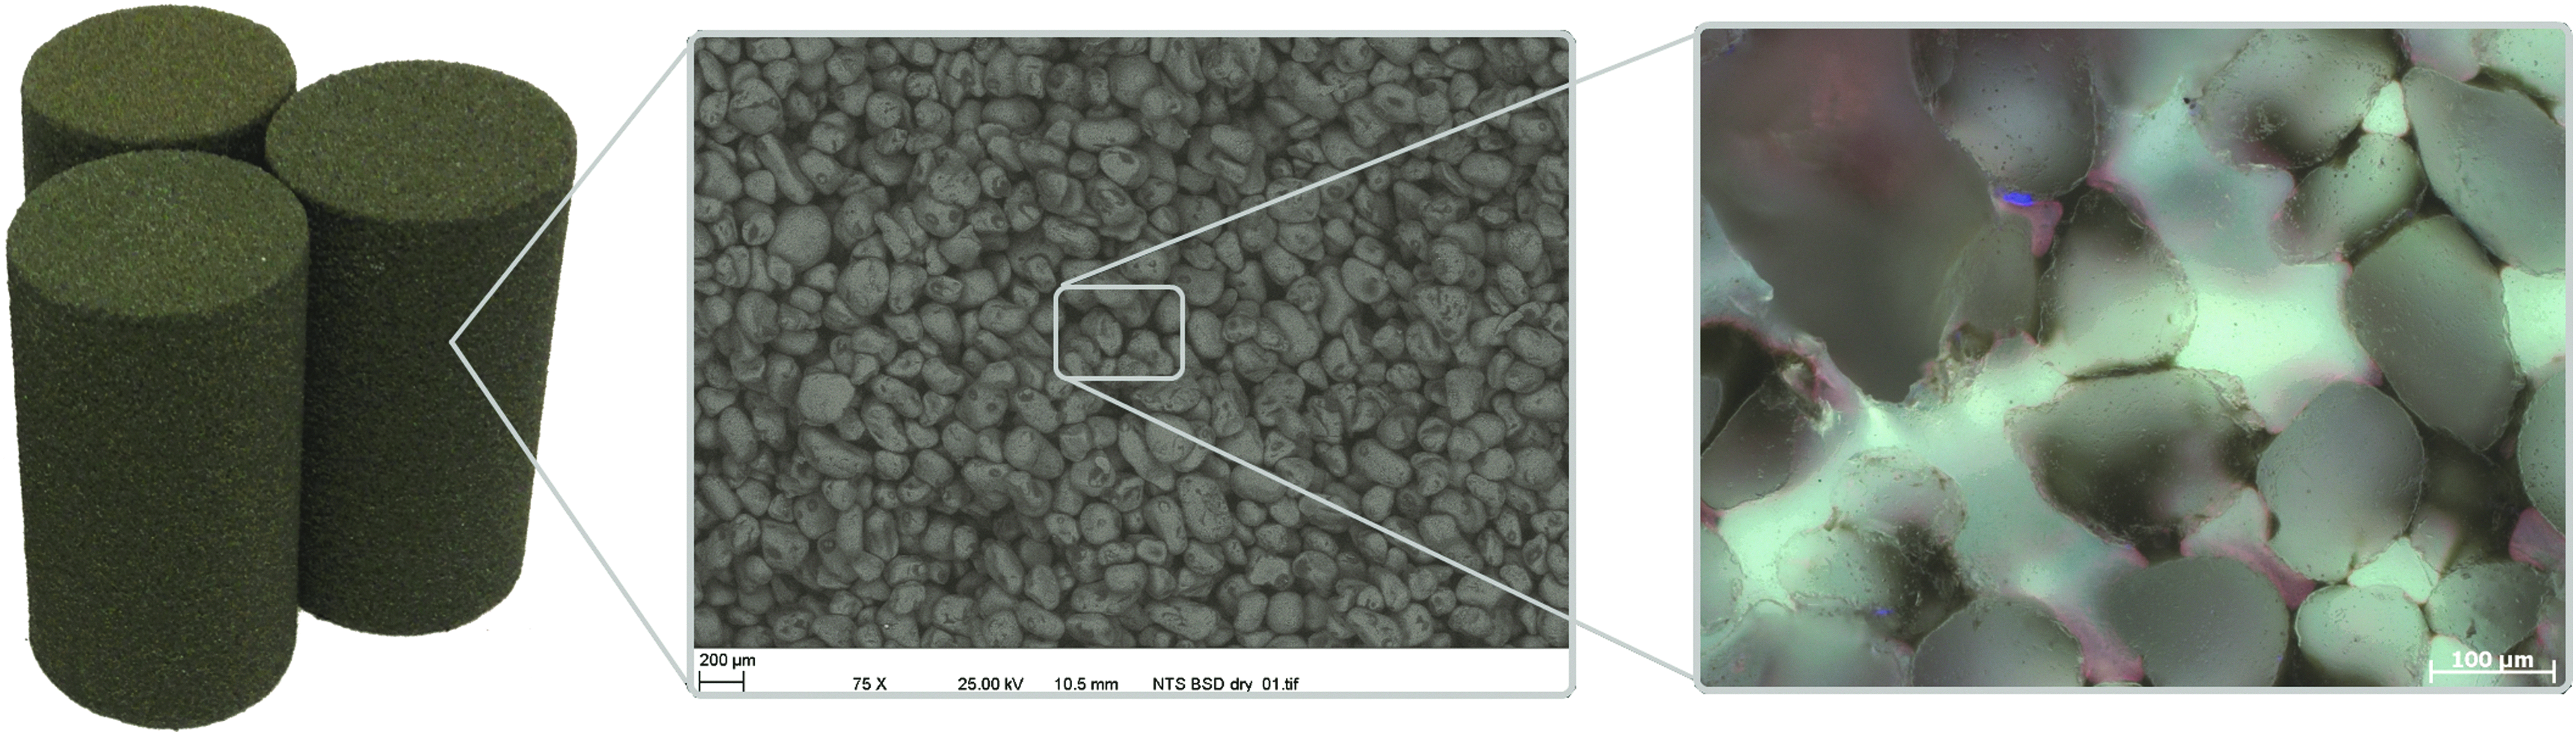
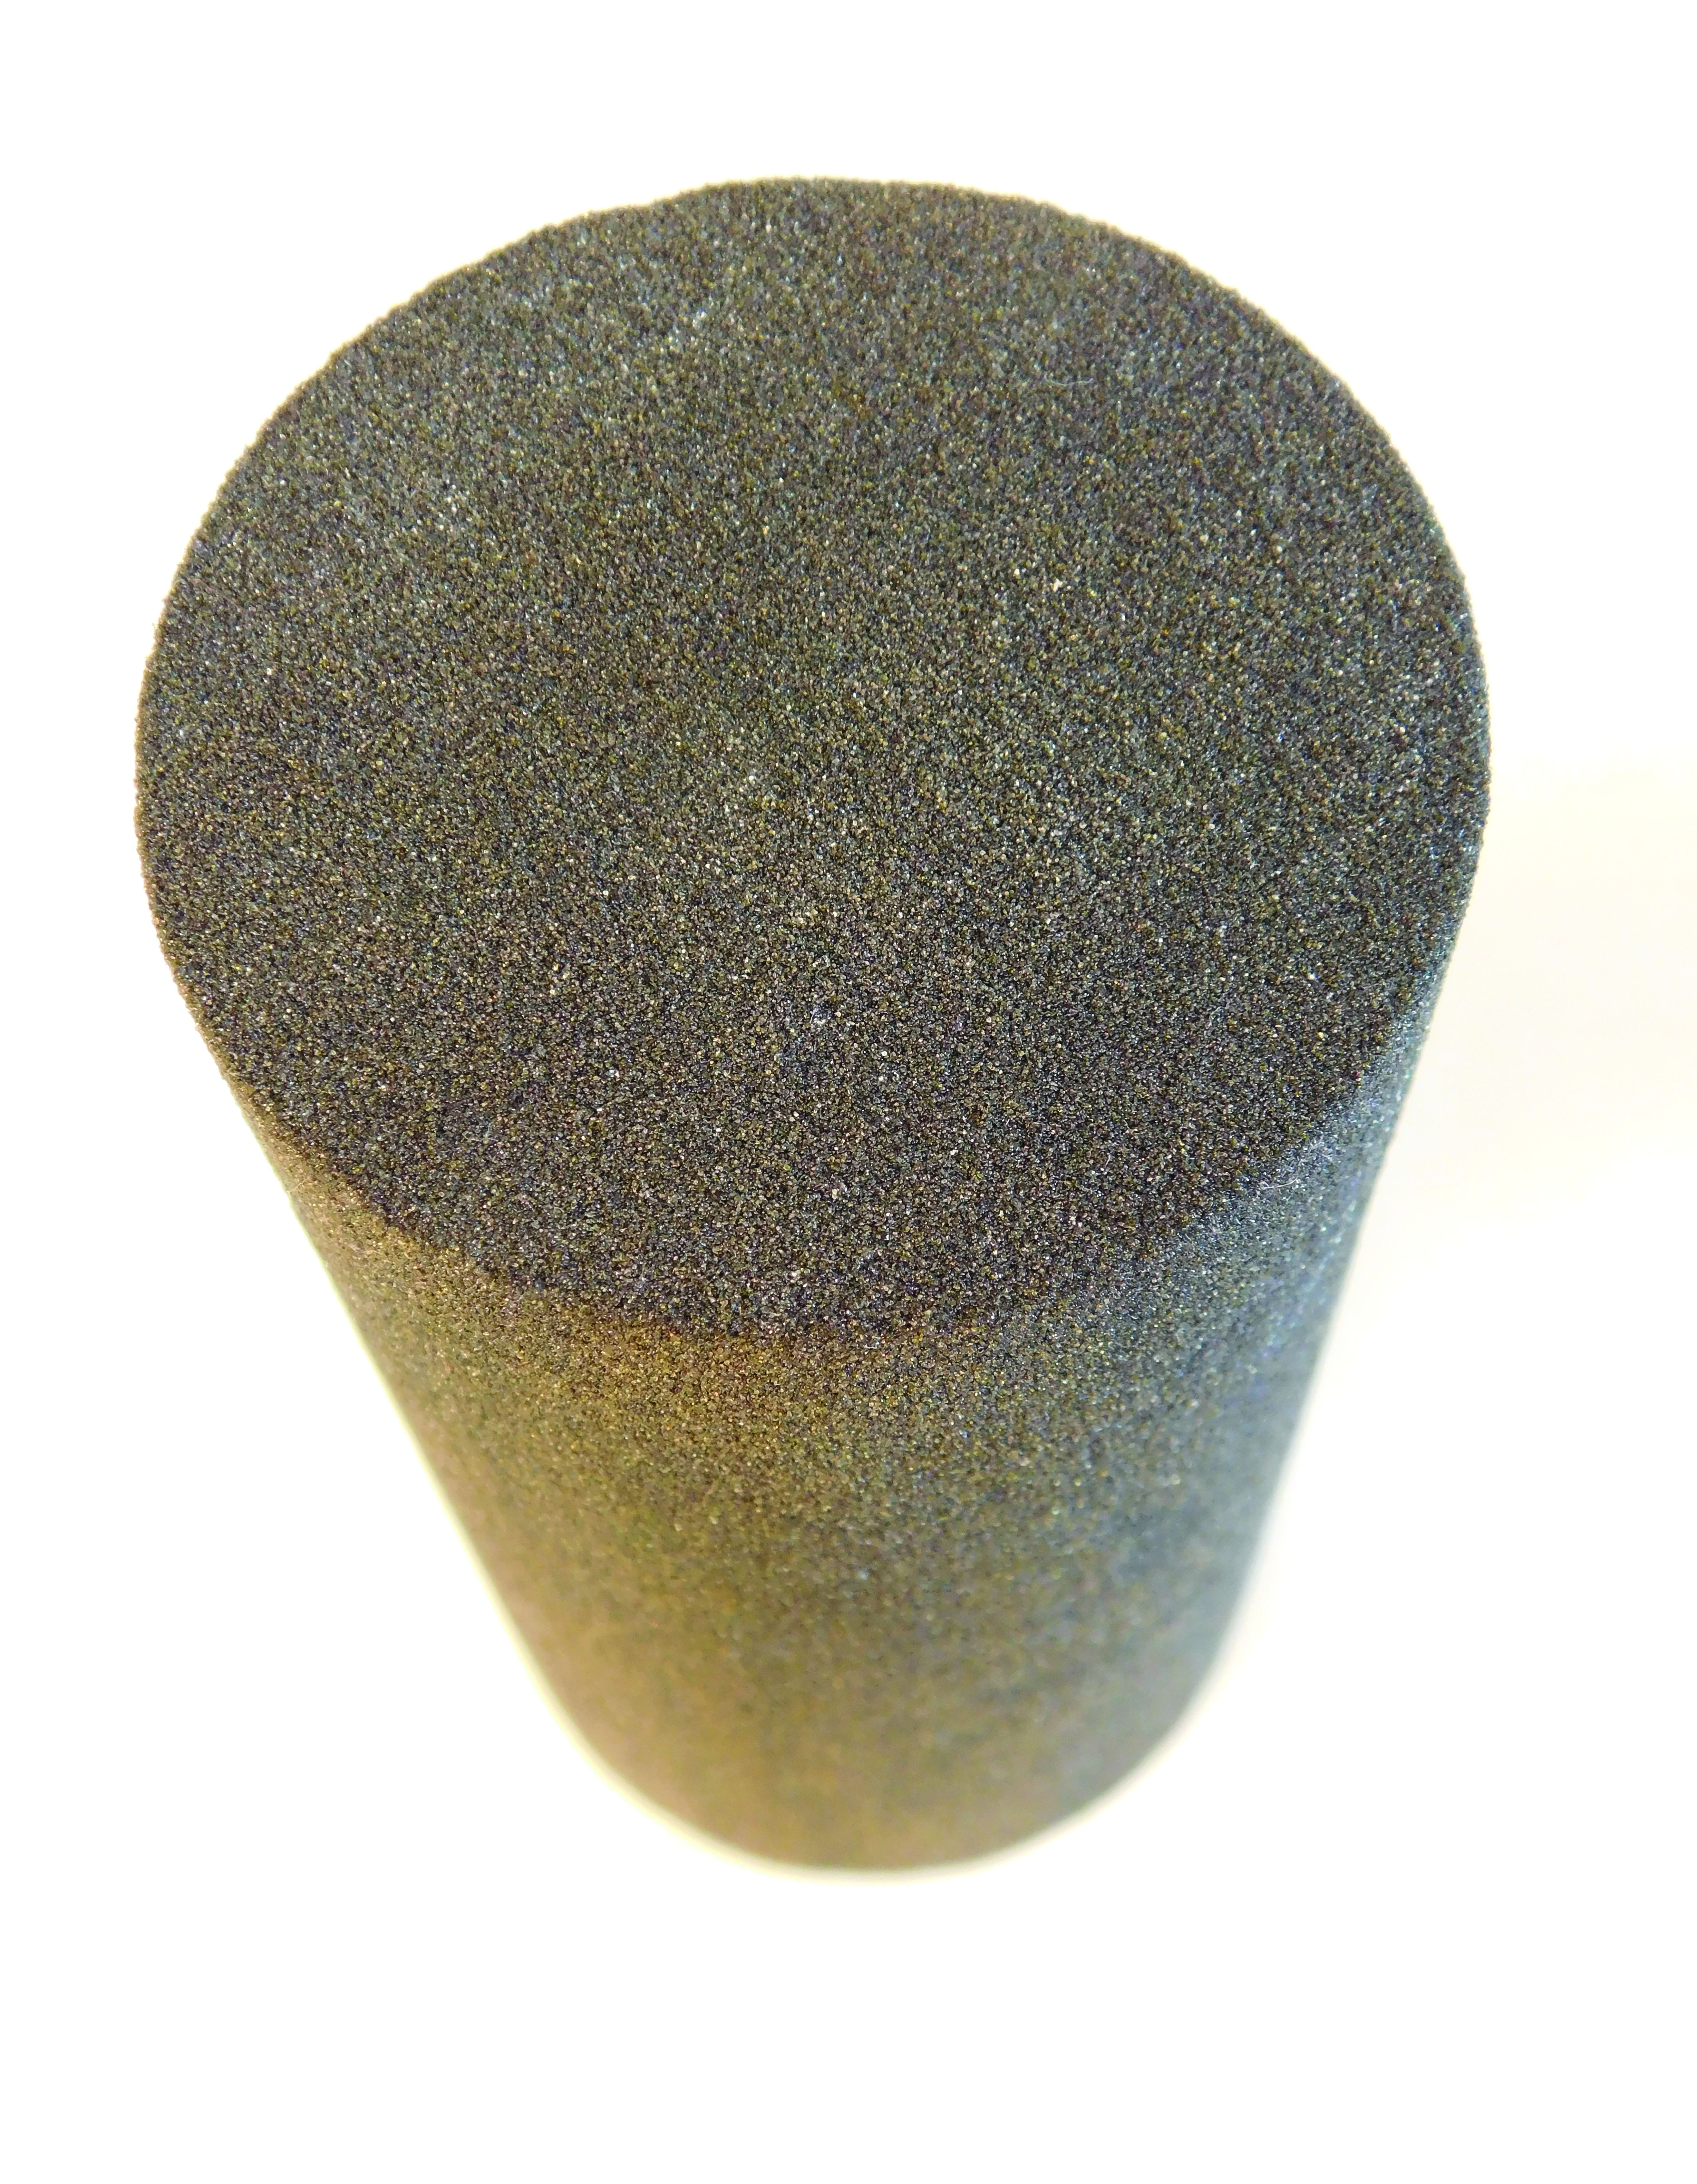
Left image: 3D printed cylindrical samples used for UCS tests. Central image: scanning electron microscopy image of the material grain structure. Right image: typical grain matrix of 3D printed sandstone analogs. Image was obtained on polished section of UV-fluorescent polymer-saturated sample. Color shades of sand, binder, and pore space (saturated with UV-fluorescent polymer) are dark blue (originally transparent), dark green, and light blue. UCS, unconfined compressive strength; UV, ultraviolet.
Samples were cured at 60°C, 80°C, 115°C, 150°C, and 200°C. Ambient conditions were tested at 25°C. Groups of three specimens were removed from oven over varying time intervals, where they were allowed to cool to room temperature. Once cooled, their weight and dimensions were recorded.
UCS tests were conducted following ASTM 23 on 400 kN INSTRON 5988 load system and resulting measurements were recorded digitally to obtain stress and strain data. Cylindrical samples measured 2 inch in height and 1 inch in diameter, and were compressed at a rate of 0.25 mm/min until failure. All samples underwent preloading before UCS tests to establish close contact between the sample and INSTRON frame platens—samples were preloaded to 1 kN axial load and back to 0 kN. Tangential Young's modulus 23 was calculated by a user-generated MATLAB function, which measured the slope of the stress–strain curve at 50% of the peak strength. That is, for every stress–strain curve, we would find the point that was at 50% of the peak strength, select a range of its nearest neighbors (20 points on average), and fit a straight line through the selected data.
Porosity was measured by removing binder from the samples. A small oven was brought to 800°C to provide sufficient heat to evaporate all cured binder. Once heated for 3 h, samples were removed and left to cool. The overall change in mass of the printed samples was measured and recorded, which allowed for calculations of binder content and porosity in 3D printed samples. Porosity values reported in this work are the porosity of the sand grain matrix only (matrix does not include binder). This was done because we were primarily interested in porosity measurements as a characterization of the grain packing.
Results and Discussion
3D printed sandstone characterization
It was important to ensure that adequate control was achieved for all strength defining parameters of 3D printed sandstones. With that in mind, we conducted a simple statistical analysis of the sample dimensions, sand grain matrix porosity, and binder saturations. A narrow distribution of these measurements around their mean values indicates that we could consider those parameters essentially fixed (Table 1).
UCS results are known to depend on the rock sample dimensions, 20 hence we fixed our specimen height and diameter at (51.63 ± 0.71)mm and (25.79 ± 0.09)mm accordingly, maintaining ASTM recommended height/diameter ration of 2:1. Moreover, all samples were printed with a fixed bedding orientation (i.e., perpendicular to direction of axial loading).
Another set of parameters that could have a significant control over measured sample strength were average grain size,11–13 packing,12,14–16 minerology, and amount of binding material. We could consider the average grain size and sample minerology fixed, since we used clean and well-sorted silica sand of fairly narrow particle size distribution with D10, D50, D90 of 110, 175, and 220 μm, respectively.
Furthermore, the degree of sand powder packing was kept constant by the M-Flex printing technique. Sand powder was dropped on the print bed at a constant rate from a fixed distance above the bed. This resulted in a consistent sample grain matrix porosity of (43.80 ± 0.71)%, which is a characteristic value for loose random packing of rounded grains. 24
Finally, the amount of binding material can have a significant effect on specimen strength and it will be discussed in detail elsewhere (Gomez-Ramirez J, Zambrano-Narvaez G, Ardila N, Chalaturnyk R. Article in preparation). In this study, binder amount was controlled with M-Flex printer settings. The resulting cured resin saturation in 3D printed samples was within (5.50 ± 0.31)% of the pore space. Therefore, we can safely assume that quality of furfuryl alcohol resin binder was the primary factor affecting final specimen strength in our study.
Optimal curing temperature
Although furfuryl alcohol-based resins are widely used for matrix bonding of fiberglass materials 25 and foundry sand molds, 26 the strengths of resulting composites are not frequently discussed in literature. To understand the mechanisms behind observed strength/temperature/time trends in our 3D printed sandstone analogs (Fig. 2), it is helpful to highlight key processes that take place during material curing.

Curing map for furfuryl alcohol binder within sandstone analogs. The plot shows temporal evolution of peak strengths of samples cured at 25°C, 60°C, 80°C, 115°C, 150°C, and 200°C. The black line represents the sample strength evolution with time at 80°C.
Freshly printed cylindrical samples are initially soft and cannot withstand applied stresses, meaning that the binding material is still in liquid state at the end of printing—samples need time to cure and gain mechanical strength.
With time, liquid furfuryl alcohol (that sits mainly between the sand grains, see Fig. 1) crystallizes and forms solid grain–grain contacts. The polymerization reaction is quite complex and it proceeds in several quasi stages. 25 Pure furfuryl alcohol, mainly composed of monomers, spontaneously forms linear polymer chains expelling heat and water 26 –liquid gains in viscosity and acquires a darker color. Addition of catalysts (FA001 activator) aids polymerization process; the chains become crosslinked, generating a crystalline structure of the resin.
Throughout binder crystallization, water builds up within the pore structure and needs to be removed. In the later stages of curing, buildup of produced water can lead to ring hydrolysis of the monomers 26 as well as formation of macropores within the resin 27 —both processes diminish mechanical strength of the binding material between sand grains. Applying heat accelerates water evaporation, and since our sandstone analog samples are highly porous, vapor easily escapes from the pore space. Therefore, curing conditions can have significant impact on the overall quality of furfuryl alcohol resin.
A set of UCS tests was conducted on a population of 97 sandstone analogs to map the impact of curing conditions on the rock strength. The samples were cured at temperatures ranging from 25°C to 200°C and curing times of up to 149 h. The plot of UCS sample strengths against curing temperature and time is presented in Figure 2, demonstrating how different curing strategies can lead to markedly different quality of polymer crystal bonds between the grains. By increasing the curing temperature from 25°C to 80°C, we were able to improve the UCS of the rock from 12 to 19 MPa. At the same time, overheating the samples proved to be detrimental for the composite material strength, resulting in degradation of the binding resin.
In fact, Gaefke et al. 27 showed that thermal degradation of the resin causes breakdown of chemical bonds and increased resin porosity. The crystal structure was shown to start degrading at temperatures above 100°C with an increased percentage of deterioration for temperatures approaching 450°C, where vital bonds were broken. 27 These findings are consistent with the UCS data in Figure 2, where signs of furfuryl alcohol resin degradation are observed at temperatures above 100°C.
The strongest sandstone analog samples were obtained when cured at 80°C. This temperature was high enough to allow accelerated removal of water from the pore space, yet low enough to obviate appreciable resin degradation for up to 114 h in the oven.
A closer look at the mechanical response of samples cured at 80°C to UCS tests revealed that the rock reaches its full strength within first 30 min of curing (Fig. 3a). The degree of furfuryl alcohol crystallization at the grain–grain contacts had an incremental effect on both UCS peak stress and Young's modulus. * Overall, our 3D printed analogs exhibited stress–strain relationship idiosyncratic to sandstones, where rock initially exhibits linear response to mechanical loading, and follows a nonlinear path to peak strength and failure.
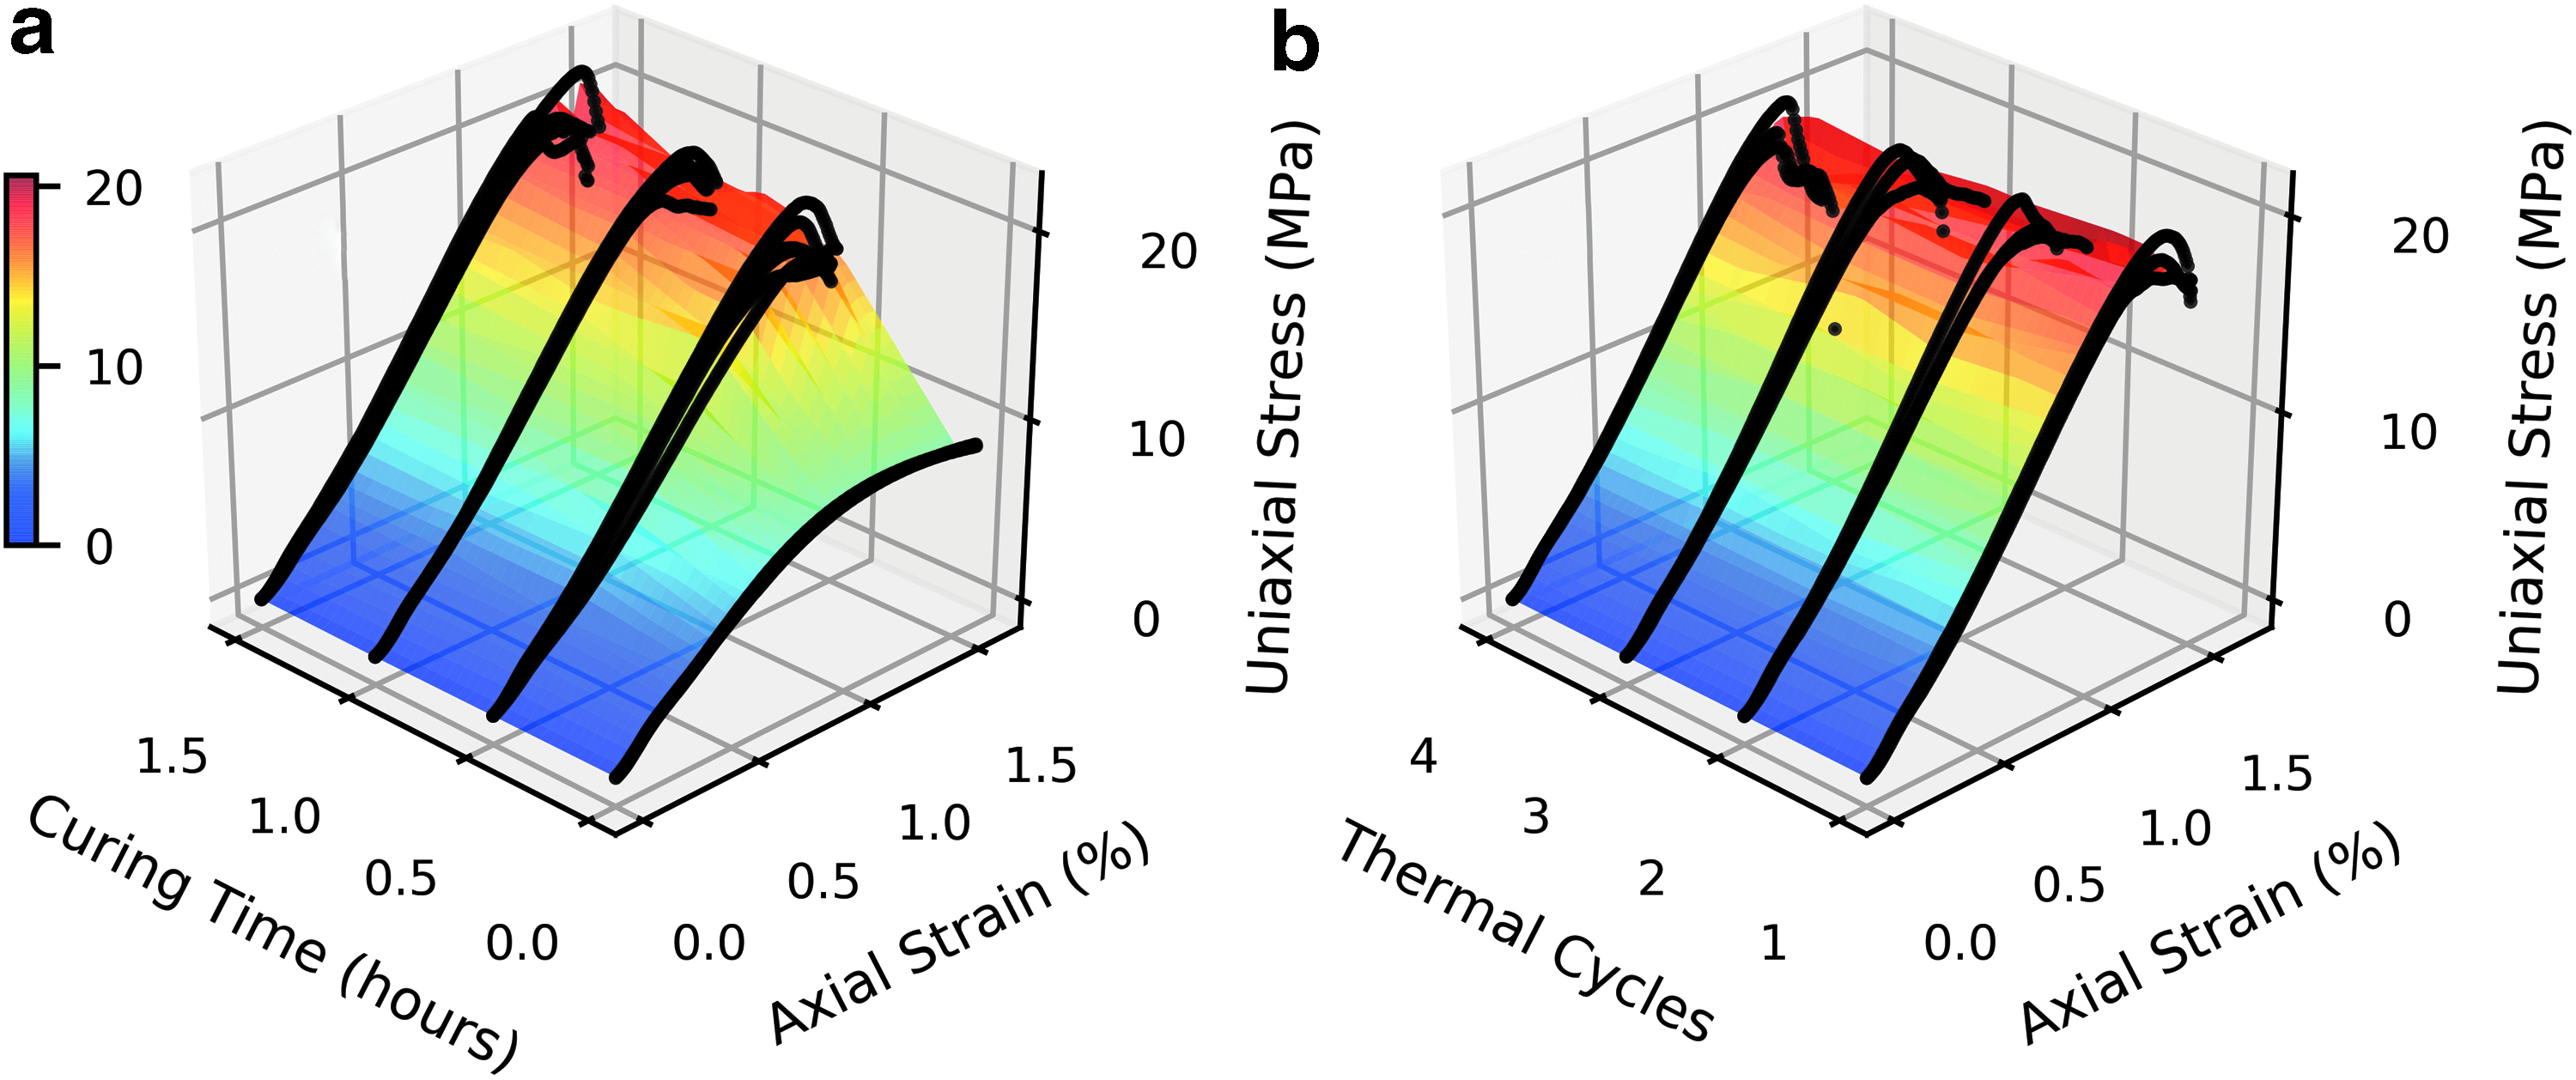
Additionally, we wanted to assess how sensitive these optimally cured samples were to thermal cycles. Often the contact interface of binder with sand grains can be the weakest link within the rock matrix. In fact, a gradient in quality of epoxy resin polymerization was detected in similar environments, showing that binder material in up to 60 μm proximity of the interface was significantly weaker than the bulk resin.28,29 Exposing samples to multiple rapid cooling and heating cycles could cause failure at these weaker interfaces due to differences in binder and sand thermal expansion coefficients. 3 Hence, we had to check if our sandstone material was robust enough to withstand regular laboratory handling temperature shocks—that is sharp changes from room temperature (25°C) to 80°C and back. By placing our samples into 80°C oven for 30 min (1.8°C/min heating rate on average) and taking those out to room temperature for another 30 min intervals up to four times, we confirmed that regular laboratory handling of rock matrix does not affect the rock strength (Fig. 3b). This is likely due to the organic nature of acid catalyst and presence of 3-aminopropyltriethoxysilane in binder solution; both insure stronger bonding between sand and resin.
Number of samples for UCS confidence intervals
Finally, 3D printed sandstone analogs presented in this study will be used to verify various geomechanical numerical models. Many of the tests would measure the material strength with predefined fissures and weakness planes. Hence, it is of great value to first evaluate the degree of confidence corresponding to different number of UCS test repetitions on homogeneous 3D printed specimens.
An assessment of consistency in specimen response to UCS loading can be made from stress–strain data of 51 samples in Figure 4. Both Young's modulus and peak UCS showed a very narrow spread. Young's modulus had a mean value of 1.79 GPa and a standard deviation of 0.09 GPa. Peak strength of the 3D printed sandstones averaged at 19.0 MPa with standard deviation of 1.1 MPa. Consistency in strength of 3D printed sandstone analogs by far exceeds the quality of reported natural sandstone samples. For example, reported UCS standard deviations include 24.6 MPa for Fell sandstone, 6 17.9 MPa for Berea sandstone, 4 36.9 MPa for Island Creek sandstone, 4 23.5 MPa for Red Jacket sandstone, 4 3.8 MPa for Donetsk sandstone, 5 and 3.0 MPa for carefully inspected Berea sandstone. 2

Consistency of sandstone analog response to UCS tests and quantile–quantile plots for sample peak strength and Young's modulus.
The quantile–quantile plot in Figure 4 confirmed that specimen strength follows the normal distribution. Hence, it was safe to use either “t-based confidence interval” or “decision on the sample number” approaches to find the required number of UCS repetitions for desired degrees of confidence.2,30,31
In the “decision on the sample number” approach, groups of n samples were picked randomly from the whole population of the peak UCS values, with repetitions allowed. Then, 95% confidence intervals were calculated for each subgroup. The steps were repeated while n increased from 3 to 51. For each n, extreme bounds of confidence intervals were plotted in Figure 5. Intersection between higher and lower bounds of 95% confidence interval value extremes with allowable deviation from the UCS mean (dotted lines in Fig. 5) gave the minimum number of required strength tests. If 10% deviation from the mean UCS is allowed, then one needs to conduct between four and six UCS repetitions to remain within 95% confidence interval bounds.
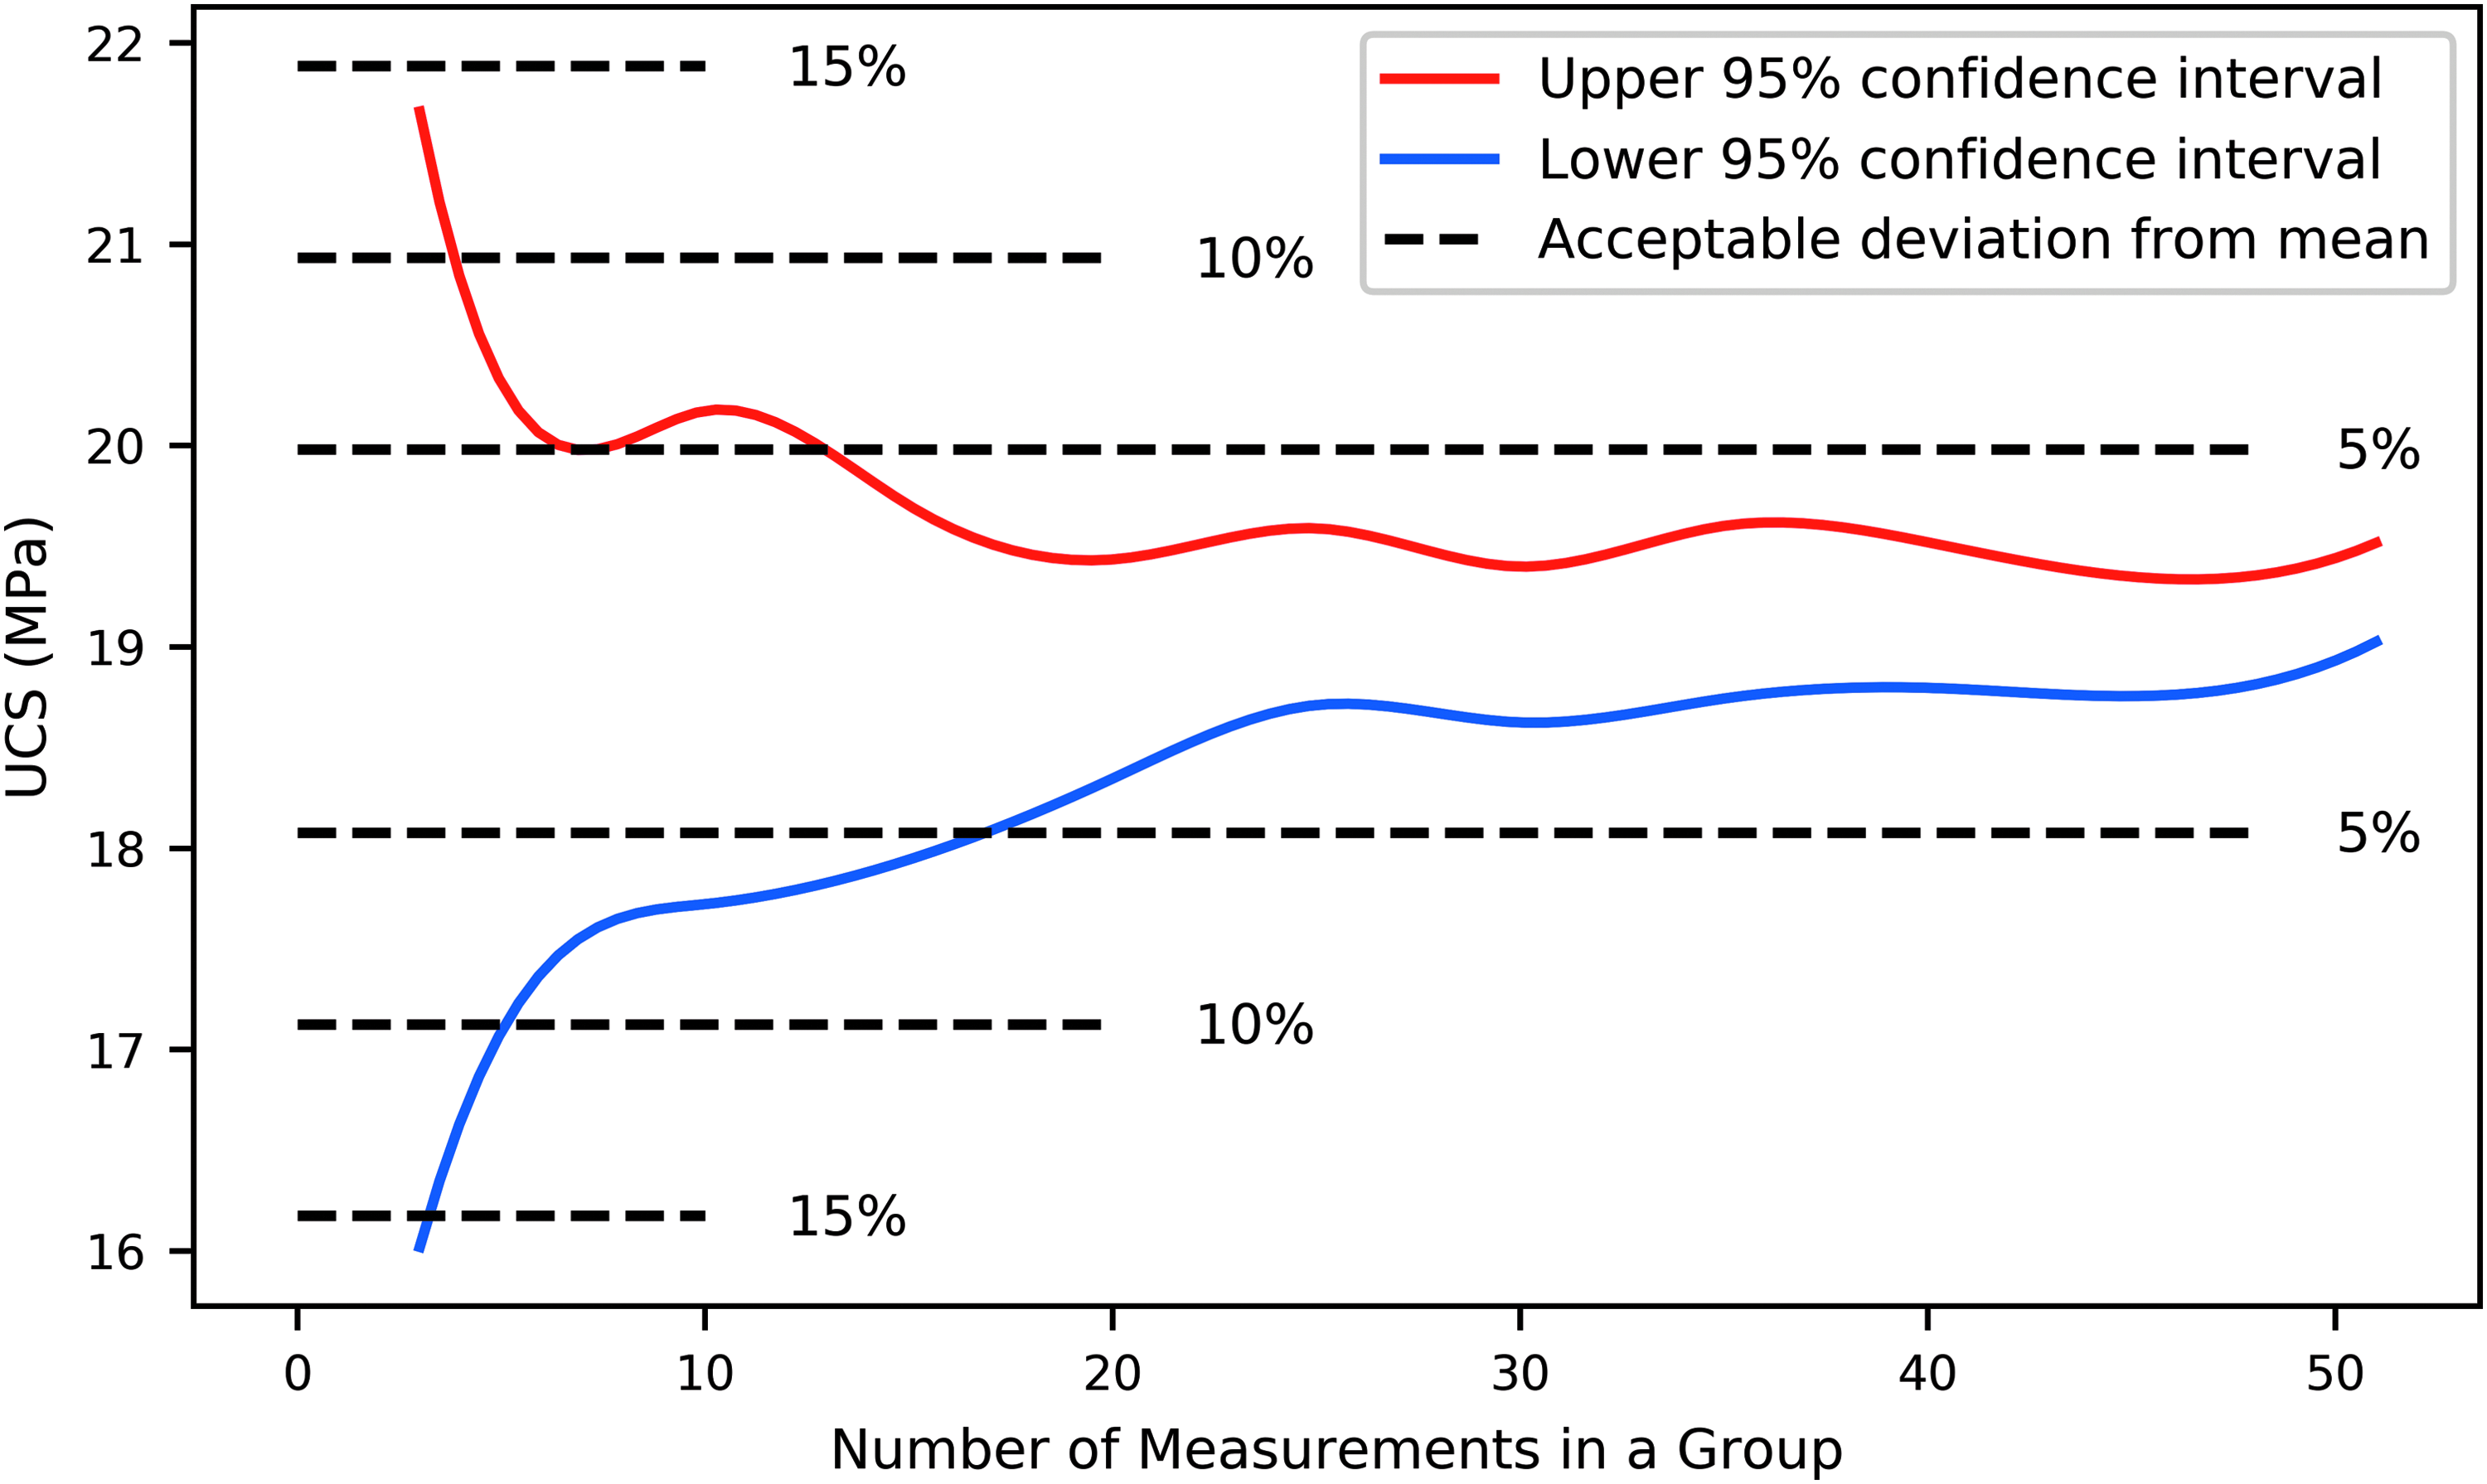
95% confidence interval extreme values plotted against the number of UCS measurements.
Similar results were obtained through more conventional “t-based confidence interval” approach. In this study, confidence intervals were calculated from the t-distribution using
Conclusions
The objective of this study was to explore the effects of curing temperature on furfuryl alcohol resin and sand-based rock analogs. To isolate the effects of curing temperature on the quality of binding material, we fixed major rock strength controlling parameters such as its dimensions, bedding orientation, average grain size, packing, and binder saturation. By curing samples at different temperatures and conducting UCS tests we found that approaching 80°C improves the strength of the composite material. Going above recommended 80°C results in furfuryl alcohol resin degradation and reduces the strength of 3D printed sandstones.
Samples cured at optimal 80°C showed a degree of consistency in strength that is unprecedented in natural sandstones. Each specimen had a particle size distribution with D10, D50, D90 of 110, 175, and 220 μm, respectively. Samples were printed with bedding orientation perpendicular to major axis, and their sizes were (51.63 ± 0.71)mm and (25.79 ± 0.09)mm in height and diameter accordingly. All samples were found to have porosity values of (43.80 ± 0.71)% and resin saturation of (5.50 ± 0.31)%. For this configuration, the specimen strength was 19.0 MPa with standard deviation of 1.1 MPa.
We recommend that at least 7 (4 or 3) UCS test repetitions are conducted to have 95% confidence result that would be within 5% (10% or 15%) deviation from the true mean strength of 3D printed sandstone samples presented in this study. The result of this work can be used as a guide in generating and strength testing furan resin and sand powder-based rock analogs in future geomechanical research.
Footnotes
Acknowledgments
This work was supported by the Foundation CMG Industrial Research Consortia on Reservoir Geomechanics for Unconventional Resources. The authors would like to thank Kevin Hodder and Prof. J.A. Nychka for the sectioning and photographing of the specimens. They would also like to thank Gilbert Wong, Hope Walls, and Keivan Khaleghi for their support in this project.
Author Disclosure Statement
No competing financial interests exist.
*
In this study, measurements of Young's modulus relied on external rather than internal strain gauges. Hence, Young's modulus values reported in this article are likely underestimated.