
Abstract
Abstract
Material jetting, commonly referred to as (inkjet) 3D printing, of polymers offers multiple advantages over other processes, such as a high resolution and multi-material capability. Most published research investigates the macroscopic properties of inkjet printed parts. This work studies the mechanical properties on the micron scale, in which metallurgical sample preparation and nanoindentation have proved to be appropriate tools for investigating parts with stiffnesses ranging over three orders of magnitude. First, interfaces in single-material parts that are created through jetting of material in layers and through nozzles are investigated. Visual inspections of the samples show a uniform layer thickness for rigid materials and irregular layers for flexible materials. The hardness and modulus near the layer interfaces show similar values to those further away, indicating a uniform curing throughout the layers. Second, the on-the-fly material mixing of the printer is investigated and shows a dominating base material with elongated features induced from the secondary material. This shows that the mixing is an introduction of particles, rather than molecular mixing. As a consequence, the local material characteristics differ strongly from the global properties of printed structures. Third, interfaces of dissimilar materials are investigated and show a smooth transition in the mechanical properties from one material to another.
Introduction
F

Setup of the printed parts with the investigated planes indicated as XY, XZ, and YZ
The first part addresses single-material parts. The inkjet printing process allows for a high resolution and provides stiffness and strength values comparable to conventional processes, but it induces a high anisotropy.5–8 Multiple researchers investigated this phenomenon and found that the weakest mechanical properties are found when loads are applied perpendicular to the layers.6,7,9 As only load directions along the printer's main axes X, Y, and Z were investigated, this initial research is inconclusive. Mueller and Shea 5 looked into all the possible load orientations and found the weakest mechanical properties when the part is oriented at angles between 45° and 60° with respect to the axes. The reason for the anisotropy is suspected to be due to three types of interfaces, that is, between layers, nozzle outlets, and neighboring printhead passes. 6 However, all those papers have in common that they describe the macroscopic properties, and no work on the local, microscopic properties has been found. It is, therefore, still unknown how the individual layers adhere to each other, and how the stiffness and strength vary across the layers and their interfaces.
The inkjet process also allows on-the-fly mixing of different base materials. The user interface of the Connex3 discretizes the space into 14 steps (Fig. 1c), but manual configuration enables any combination to yield a continuous transition between the two base materials. This feature is particularly interesting for design and structural optimization, which can greatly enhance a part's performance. Further, it enables methods that require continuous material properties as inputs.4,10,11 Stanković et al.10,12 mechanically tested all the possible material mixtures for two fundamentally different base materials: a strong, acrylonitrile butadiene styrene (ABS)-like and a flexible, rubber-like material. They found that the mechanical properties of mixed materials are bi-modally distributed around the base materials, rather than equally splitting the space in between the base material's properties. It is, however, unknown what the reason for this phenomenon is, how exactly the material mixes, and what effect the mixing has on the mechanical properties. The second part of this work, therefore, addresses the mixed materials with the aim of finding an explanation for these effects.
In the third part, the interfaces of parts made up of materials from opposite spectrums of the elastic modulus are investigated, that is, a stiff and a rubber-like material. On a macro scale, Bass et al.13,14 studied the variations in the mechanical properties of such parts tested in tension. Vu et al. 15 explored the interfacial strength of parts printed with two discrete materials on double cantilever beam specimens, and so did Kumar and Alvarez 16 on single-lap joints. Lin et al. 17 characterized the shear strength of multi-material interfaces in dogbone specimens. Moore and Williams 18 looked into the fatigue properties of multi-material interfaces. As before, no-one looked into the local properties, which could differ significantly from the global properties that also include the flaws in their measurements.
Materials and Methods
The main tests consist of two parts: visual inspection and nanoindentation. Visually through a light microscope and scanning electron microscope (SEM), the printed cross-sections of single material blocks of VeroWhitePlus (VW) are investigated for each plane, XY, XZ, and YZ, where the former provides insight into the in-plane behavior, and the two latter into the out-of-plane behavior. The results are then compared with blocks of TangoBlackPlus (TB). VW behaves like ABS and is one of the strongest commercially available materials for the material jetting process, whereas TB is soft and rubbery, and one of the most flexible printing materials available. 4 Those materials have been chosen to cover the largest possible range in terms of the elastic modulus and hardness. Further, mixed materials of a VW primary material are investigated for all possible mixing ratios. With nanoindentation, each of the three cross-section planes is investigated for single material blocks to see whether areas close to the interfaces provide considerably different material properties when compared with areas further away. Nanoindentation is also used to measure interfaces between blocks of TB and VW.
Sample fabrication and preparation
The test specimens are fabricated with material jetting on a Stratasys Objet500 Connex3. The printer contains eight parallel printheads, of which six are allocated to three base materials, and two to a gel-like support material. Each printhead contains 100 nozzles, linearly aligned along the Y axis and equally spaced. To deposit the material and cover the printable space, the assembly moves back and forth in X direction before it moves in Y (Fig. 1a). Rollers and UV lights mounted on either side of the printhead flatten the printed surface to form a smooth substrate for the next layer, and they immediately cure the photo-curable material. Three specimens of each of the three types are fabricated in analogy to Figure 1b.
1. For both base materials, that is, VW and TB, three homogeneous blocks of size 14 × 12 × 10 mm3 are printed to analyze the layers of a single material and their geometrical constitution—one block for each spatial direction X, Y, and Z.
2. Blocks with material gradients are printed for each base-material group. The sub-block thicknesses are chosen to be multiples of the printer's minimum layer thicknesses, yielding block dimensions of 14 × 10 × 11.2 mm3, of which the 11.2 mm consist of 7 blocks of 100 layers with a thickness of 16 μm.
3. Two-material blocks, of which one-half consists of VW, and the other half consists of TB. Three specimens are printed to have the interfacial plane aligned with each of the three planes in the coordinate system, that is, XY, XZ, and YZ.
Each specimen has been printed in a separate print job in the xmin/ymin corner of the platform with identical print parameters to prevent uncontrolled effects. The samples for the nanoindentation tests are postprocessed by using a standard metallurgical sample preparation procedure. For better handling, the samples are cold embedded in Demotec 35, a self-compacting and low-temperature cured polymer. Then, the surface is ground with SiC abrasive papers in decreasing roughnesses (grids 500/1200/2500/4000) on a grinding machine (Struers RotoPol-21). A polishing step with a suspension of alumina particles (50 nm) on a polishing disk follows until no scratches are left. Due to the softness of TB, the preferable grinding and polishing direction is parallel to the layers and interfaces, to prevent material dragging across the interfaces. This is also true for the stiffer VW, although not as critical. For all materials, the temperature during the grinding and polishing steps should be kept to a minimum to prevent softening, which would increase the aforementioned effect and other effects that might (thermally) alter the properties.
Light microscopy and nanoindentation
The surface quality is inspected under a light microscope (Polyvar Met from Reichert) after polishing. A scanning electron microscope (SEM, Vega3 from Tescan) is used to visualize the surface of the samples. The SEM samples are coated with a thin gold layer and fixed on a sample holder with a double-sided adhesive copper band to ensure conductivity.
The nanoindentation measurements are carried out on an Ultra Nanoindentation Tester (UNHT) from Anton Paar TriTec (Fig. 2). The distance between the reference ball and the tip is 3 mm. The reference and tip can be individually adjusted in height, so that the reference is always first in contact with the sample. Because of the small contact area and the simple data processing, the pyramidal-shaped Berkovich tip is used in all experiments. For all tests, the Oliver–Pharr method is applied. 19 As the polymer material has a very low hardness, only small forces can be used. To ensure an accurate measurement, the contact force is set to 5 μN for the tip and 50 μN for the reference. The maximum indentation force is set to 200 μN, with a loading rate of 500 μN/min and an unloading rate of 5000 μN/min. In the soft materials, a 30-s hold segment is introduced at the maximum load to get reliable stress-strain curves. The distance between two measurements is 50 μm if not stated otherwise. Further, a profile is recorded to investigate the properties over a larger length scale and especially over the interface. Therefore, the distance between two indents is decreased to 10 μm to increase the resolution. The resolution is further increased by measuring in parallel and slightly shifted lines. The shift in measurement direction is 2 μm, that is, a property profile with a resolution of 2 μm is recorded (Fig. 2c).
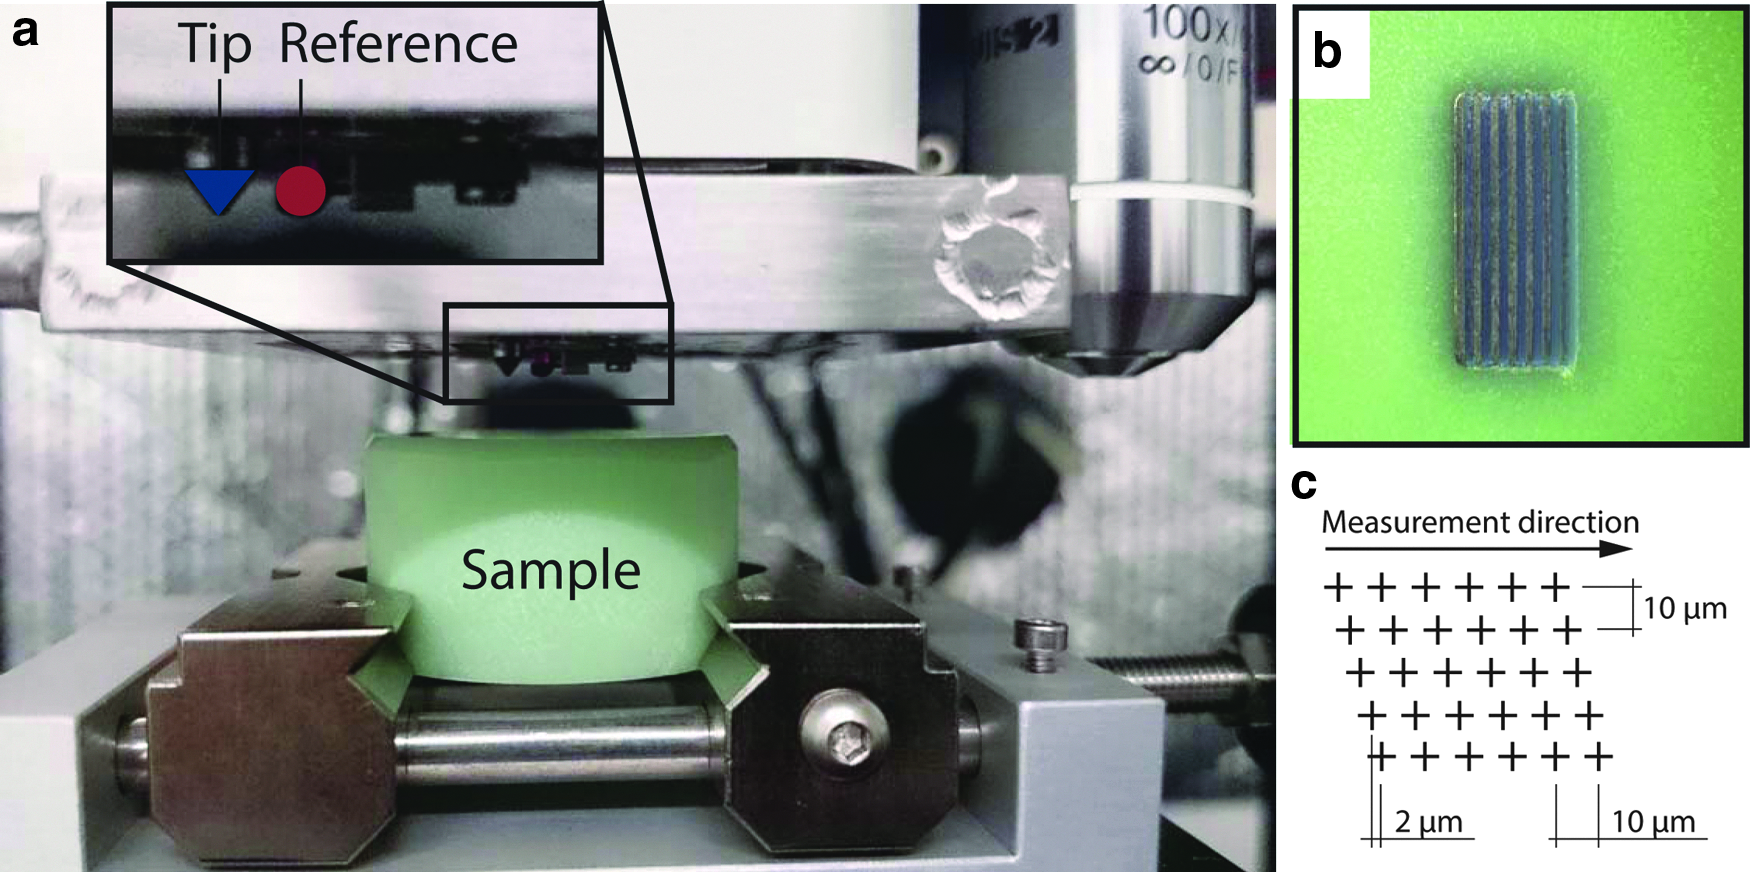
Measurement procedure.
Results and Discussion
The metallurgical sample preparation yielded a smooth and shiny surface, indicating a surface roughness much smaller than the tip size of the nanoindenter for both the soft (TB) and the hard (VW) material. Inclusions could be clearly seen and avoided during the tests.
Single-material interfaces
For the first part of the results, the three different orientations of a pure VW sample in as-printed and polished state are shown in Figure 3. In the polished state, the XY surface is smooth yet wavy, which originates from a combination of imperfections in the printing process and a small misorientation in the embedding and grinding (Fig. 3a, b). To minimize this visual effect, a deviation in parallelism of the layers and the machining table much smaller than the layer thickness is required. Further, the rollers of the printheads flatten each layer after being deposited, either for a better surface finish or for the forthcoming layer. This process postulates that material is being dragged along the moving direction of the printhead. Even small deviations of the mean height across the print head's nozzles (Y direction) yield a waviness. The layered structure is visible on both out-of-plane surfaces (Fig. 3c–f). The thickness of the sublayers is 16 μm and constant over the length in the XZ direction; the YZ direction shows higher variations, but it yields the same mean thickness. This is due to the layer-wise approach, which deposits, flattens, and hardens each layer before depositing the next layer. Since the cured layers below are magnitudes stiffer than the liquid, deposited ink, the layers keep their shape even if the deposited material distribution is nonuniform, forcing the excess material to squeeze out on the sides. This can be seen in the images showing the samples' nontreated outside surface. A possible explanation for the slightly higher variations in layer thickness along the Y directions is that there is still deformation going on during the deposition process.

Interfaces in single-material parts. As-printed surfaces (
The VW yields layers of uniform thickness in the out-of-plane orientations, whereas the layers of the TB are nonuniform in thickness, but yield the same average of 16 μm. This is due to the stiffness of TB being orders of magnitudes lower than of VW, even in the cured state. The rollers, mechanically flattening the layers, therefore, experience less resistance when spreading the material across the surface, potentially deforming the formerly printed layers to a larger extent. As the outer dimensions of the parts are not affected by these effects, there are no design considerations to account for.
In all cases, no defects in the form of holes are seen. This shows that a very low porosity is reached, which is often considered a measure of quality in 3D printed parts, where added porosity often lowers the mechanical properties, such as stiffness and strength. 20 Porosity can also induce a higher degree of anisotropy, which is, therefore, prevented. To get the local, mechanical properties for all three spatial planes, the hardness and stiffness profiles of pure VW blocks are measured by nanoindentation (Fig. 3i–k). For both the hardness and the stiffness, the means and deviations, that is, magnitudes and amplitudes, are comparable. None of the graphs show distinct trends within the length or peaks at a distance of the respective printer resolution, that is, 600 dpi in-plane and 1600 dpi out-of-plane. This has been confirmed through a fast Fourier transform analysis, which does not show any peaks at the expected lengths and suggests that the mechanical properties are uniform across the layers. In addition, no delamination of the layers is observed during the tests, suggesting that the resulting material is homogeneous.
On-the-fly mixing of materials
An additional level of complexity is added with multi-material printing (Fig. 4). The finely dispersed nozzles of the printer in combination with the print heads that are aligned in parallel behind each other deposit the secondary material into the material matrix formed by the primary material. Light microscope images of all the possible VW mixtures are shown in Figure 4a. Starting with pure VW on the left, the TB ratio increases from layers 1 to 7. The elongated features' shape, which reminds one of fibers or whiskers, is suspected to be created due to a combination of factors. First, the relatively fast movement of the print heads does not allow a punctual deposition. Second, the deposited droplets are dragged behind due to the rheology of the ink. Third, due to the rollers being mounted on both sides of the print head, the surface is flattened for the next layer. As opposed to conventional composite materials, where the inclusions strengthen or stiffen a given base material, 21 in material jetting they can also be used to reach the opposite, for example, a softer and more flexible material. An increased mixing ratio yields more inclusions, and the inclusions' characteristic sizes are limited to the inner nozzle diameter.
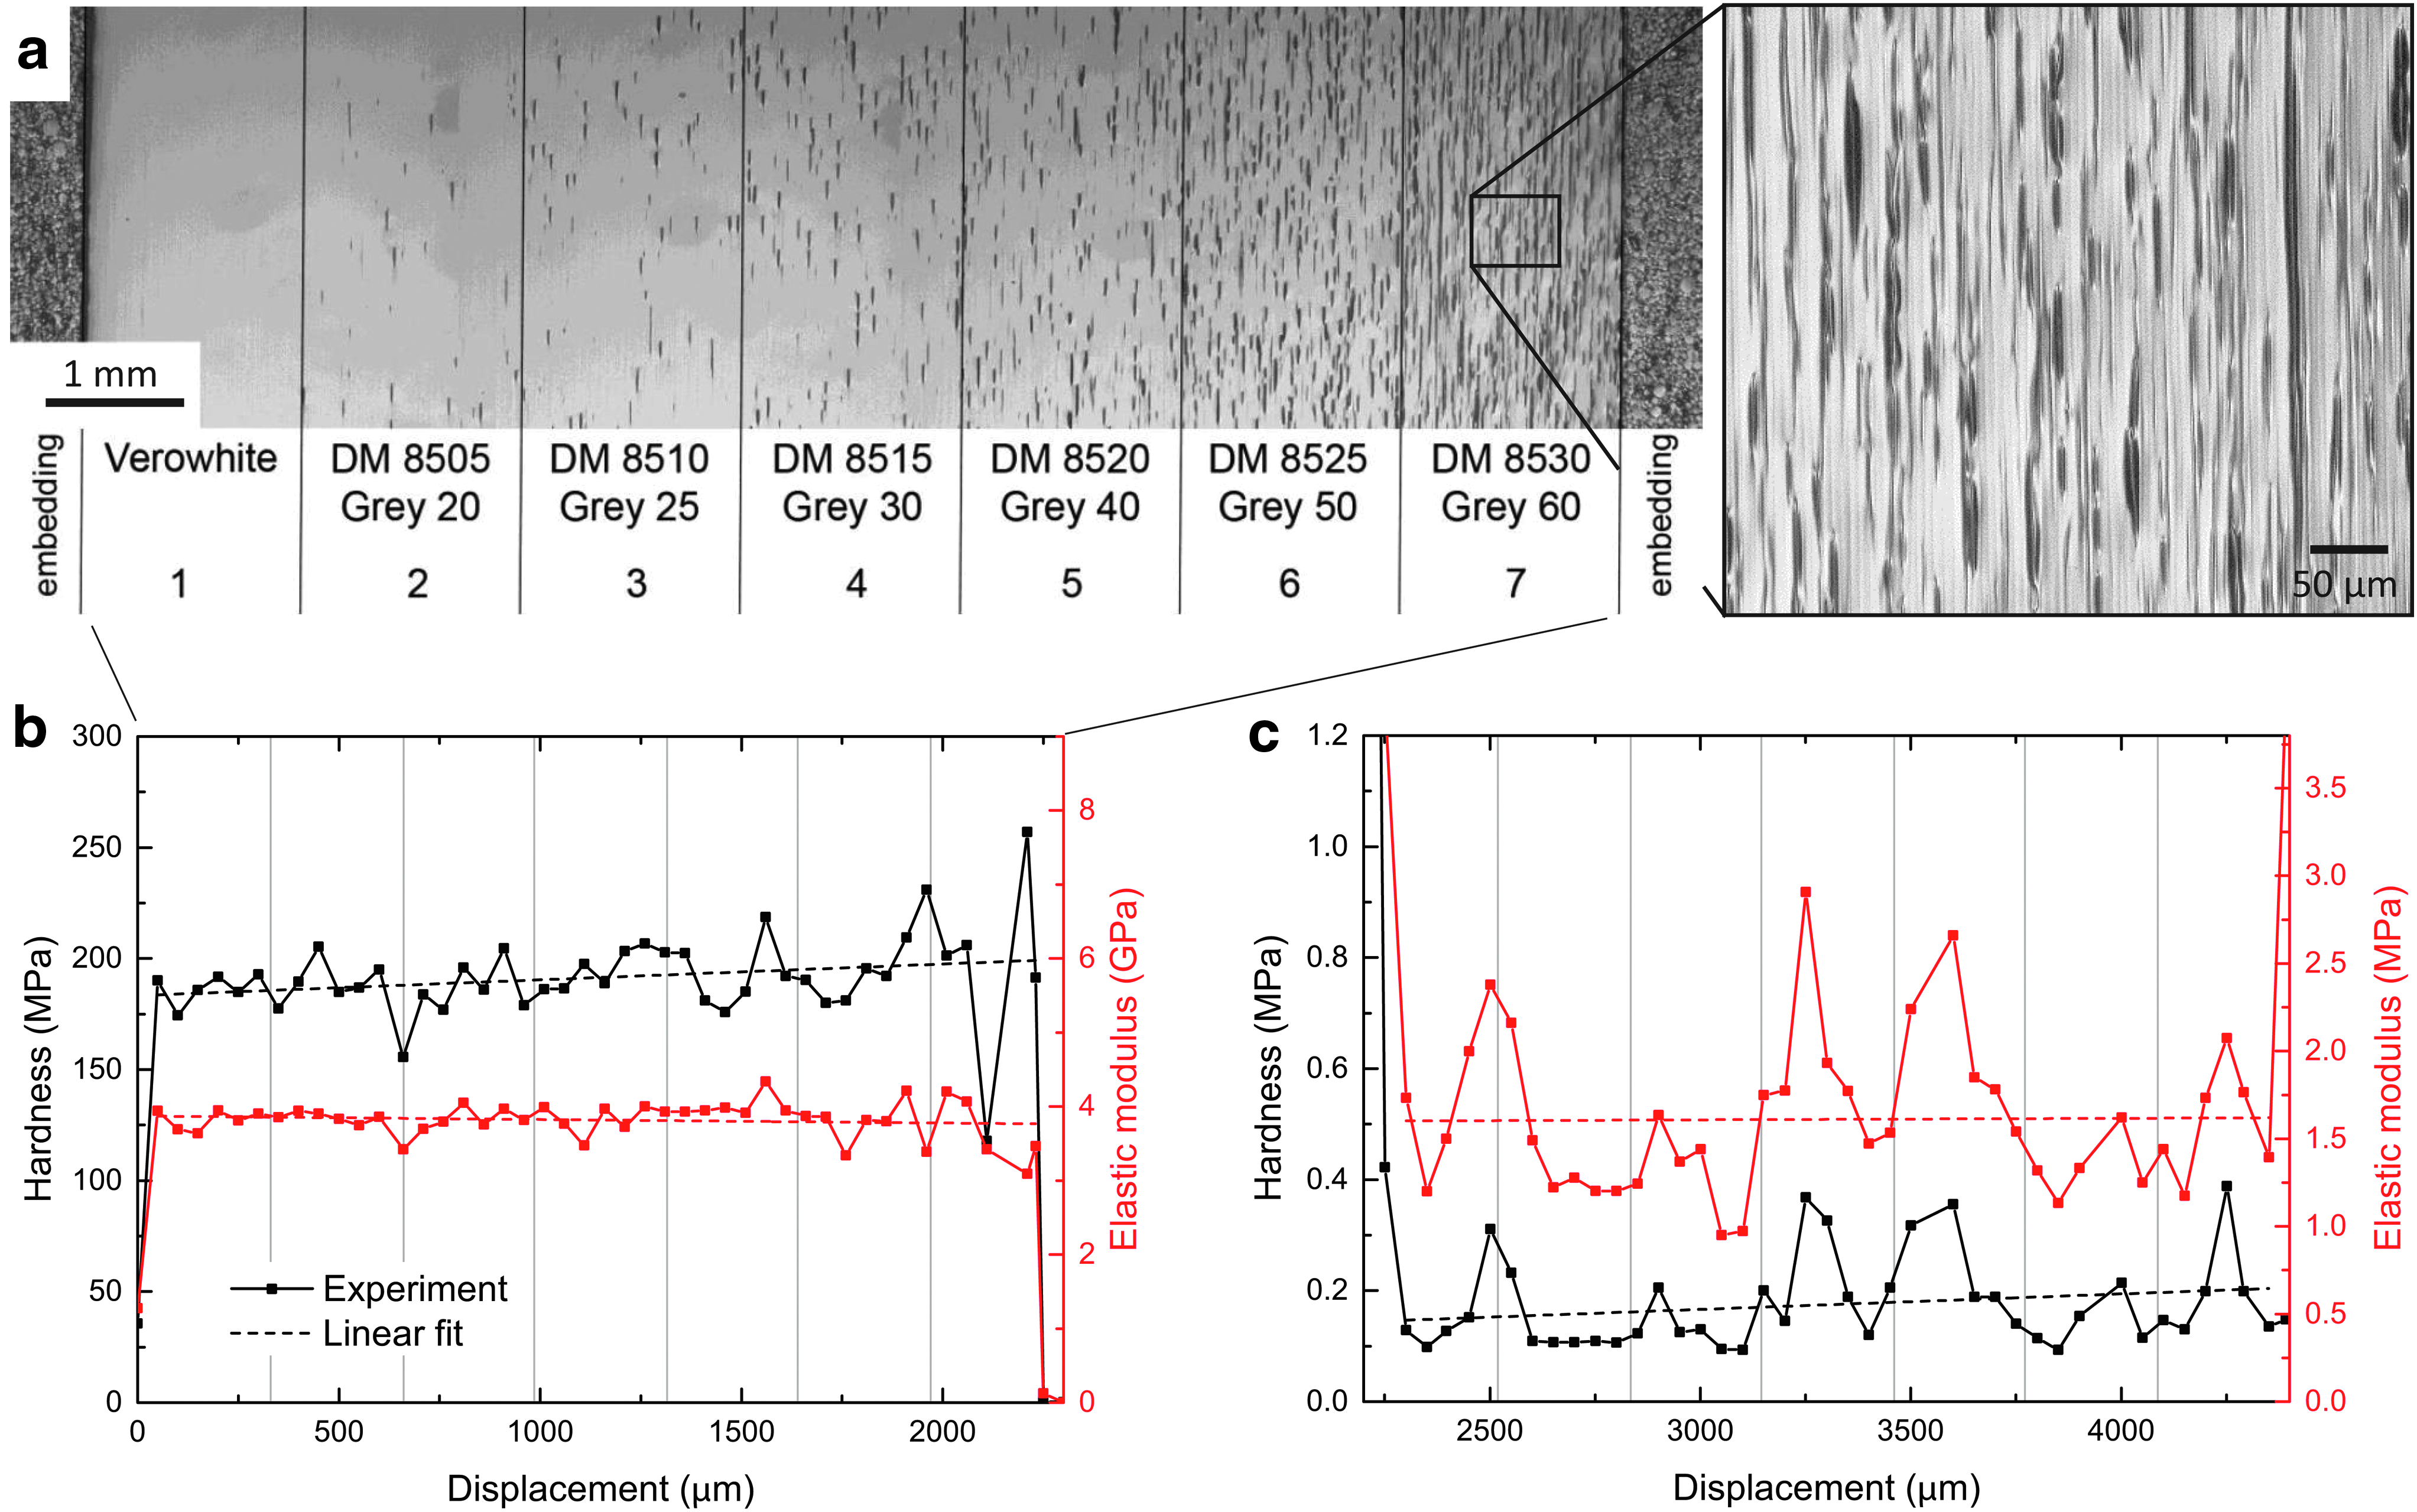
Mixed materials.
Figure 4b and c shows property profiles of VW and TB. It starts with pure VW on the left of Figure 4b, and it continues with an increasing ratio of TB toward the right until pure TB is reached on the right of Figure 4c. The distance between two indents is 50 am. In both cases, the hardness and stiffness values are constant with no statistically significant trend, rather than decreasing, as one would suspect. This is due to the particles being randomly dispersed and, therefore, only randomly hit by the indenter, which has been verified visually. As the ratios are relatively low, even in the case of the highest mixing ratio, the chances are high that the indenter mostly hits the matrix material of constant properties. Further, especially in the case of TB, where the hard (VW) particles are supported by a soft matrix, the indenter is likely to move the whole particle rather than purely measuring its local properties. The latter argument is strengthened by the fact that the indentation depth in TB needs to be much higher to measure the same force as in VW, reaching almost 63 μm in the pure case.
For anyone who uses mixed materials printed via material jetting, the findings suggest that design guidelines similar to conventional, (short-)fiber-reinforced composite materials apply. 22 In particular, the size of the designed parts or features needs to be much larger than the inclusion size of about 5 to 100 μm.
Multi-material interfaces
The analysis across the interface of VW and TB is shown in Figure 5, where Figure 5a shows the actual surface as seen by a light microscope. Visual observations show that the indents are small on VW and larger at the interface. The indents on the TB side partially overlap and touch the VW, which is seen by the shifted indents on the interface. This can also be seen when looking at the mechanical properties, which decrease continuously from one phase into the other (Fig. 5b). The mean elastic modulus and hardness for the pure materials are found to be 1.081 and 0.095 MPa for TB, and 4463 and 285.2 MPa for VW, respectively—more than three orders of magnitude in difference (Fig. 5c). No delamination has been seen in any tests near the surface, indicating a bonding well enough to be stronger than the weaker base material for the given load case. Those results are in accordance with the findings of Libonati et al., 23 who reported a perfect bond on macro-scale tests.
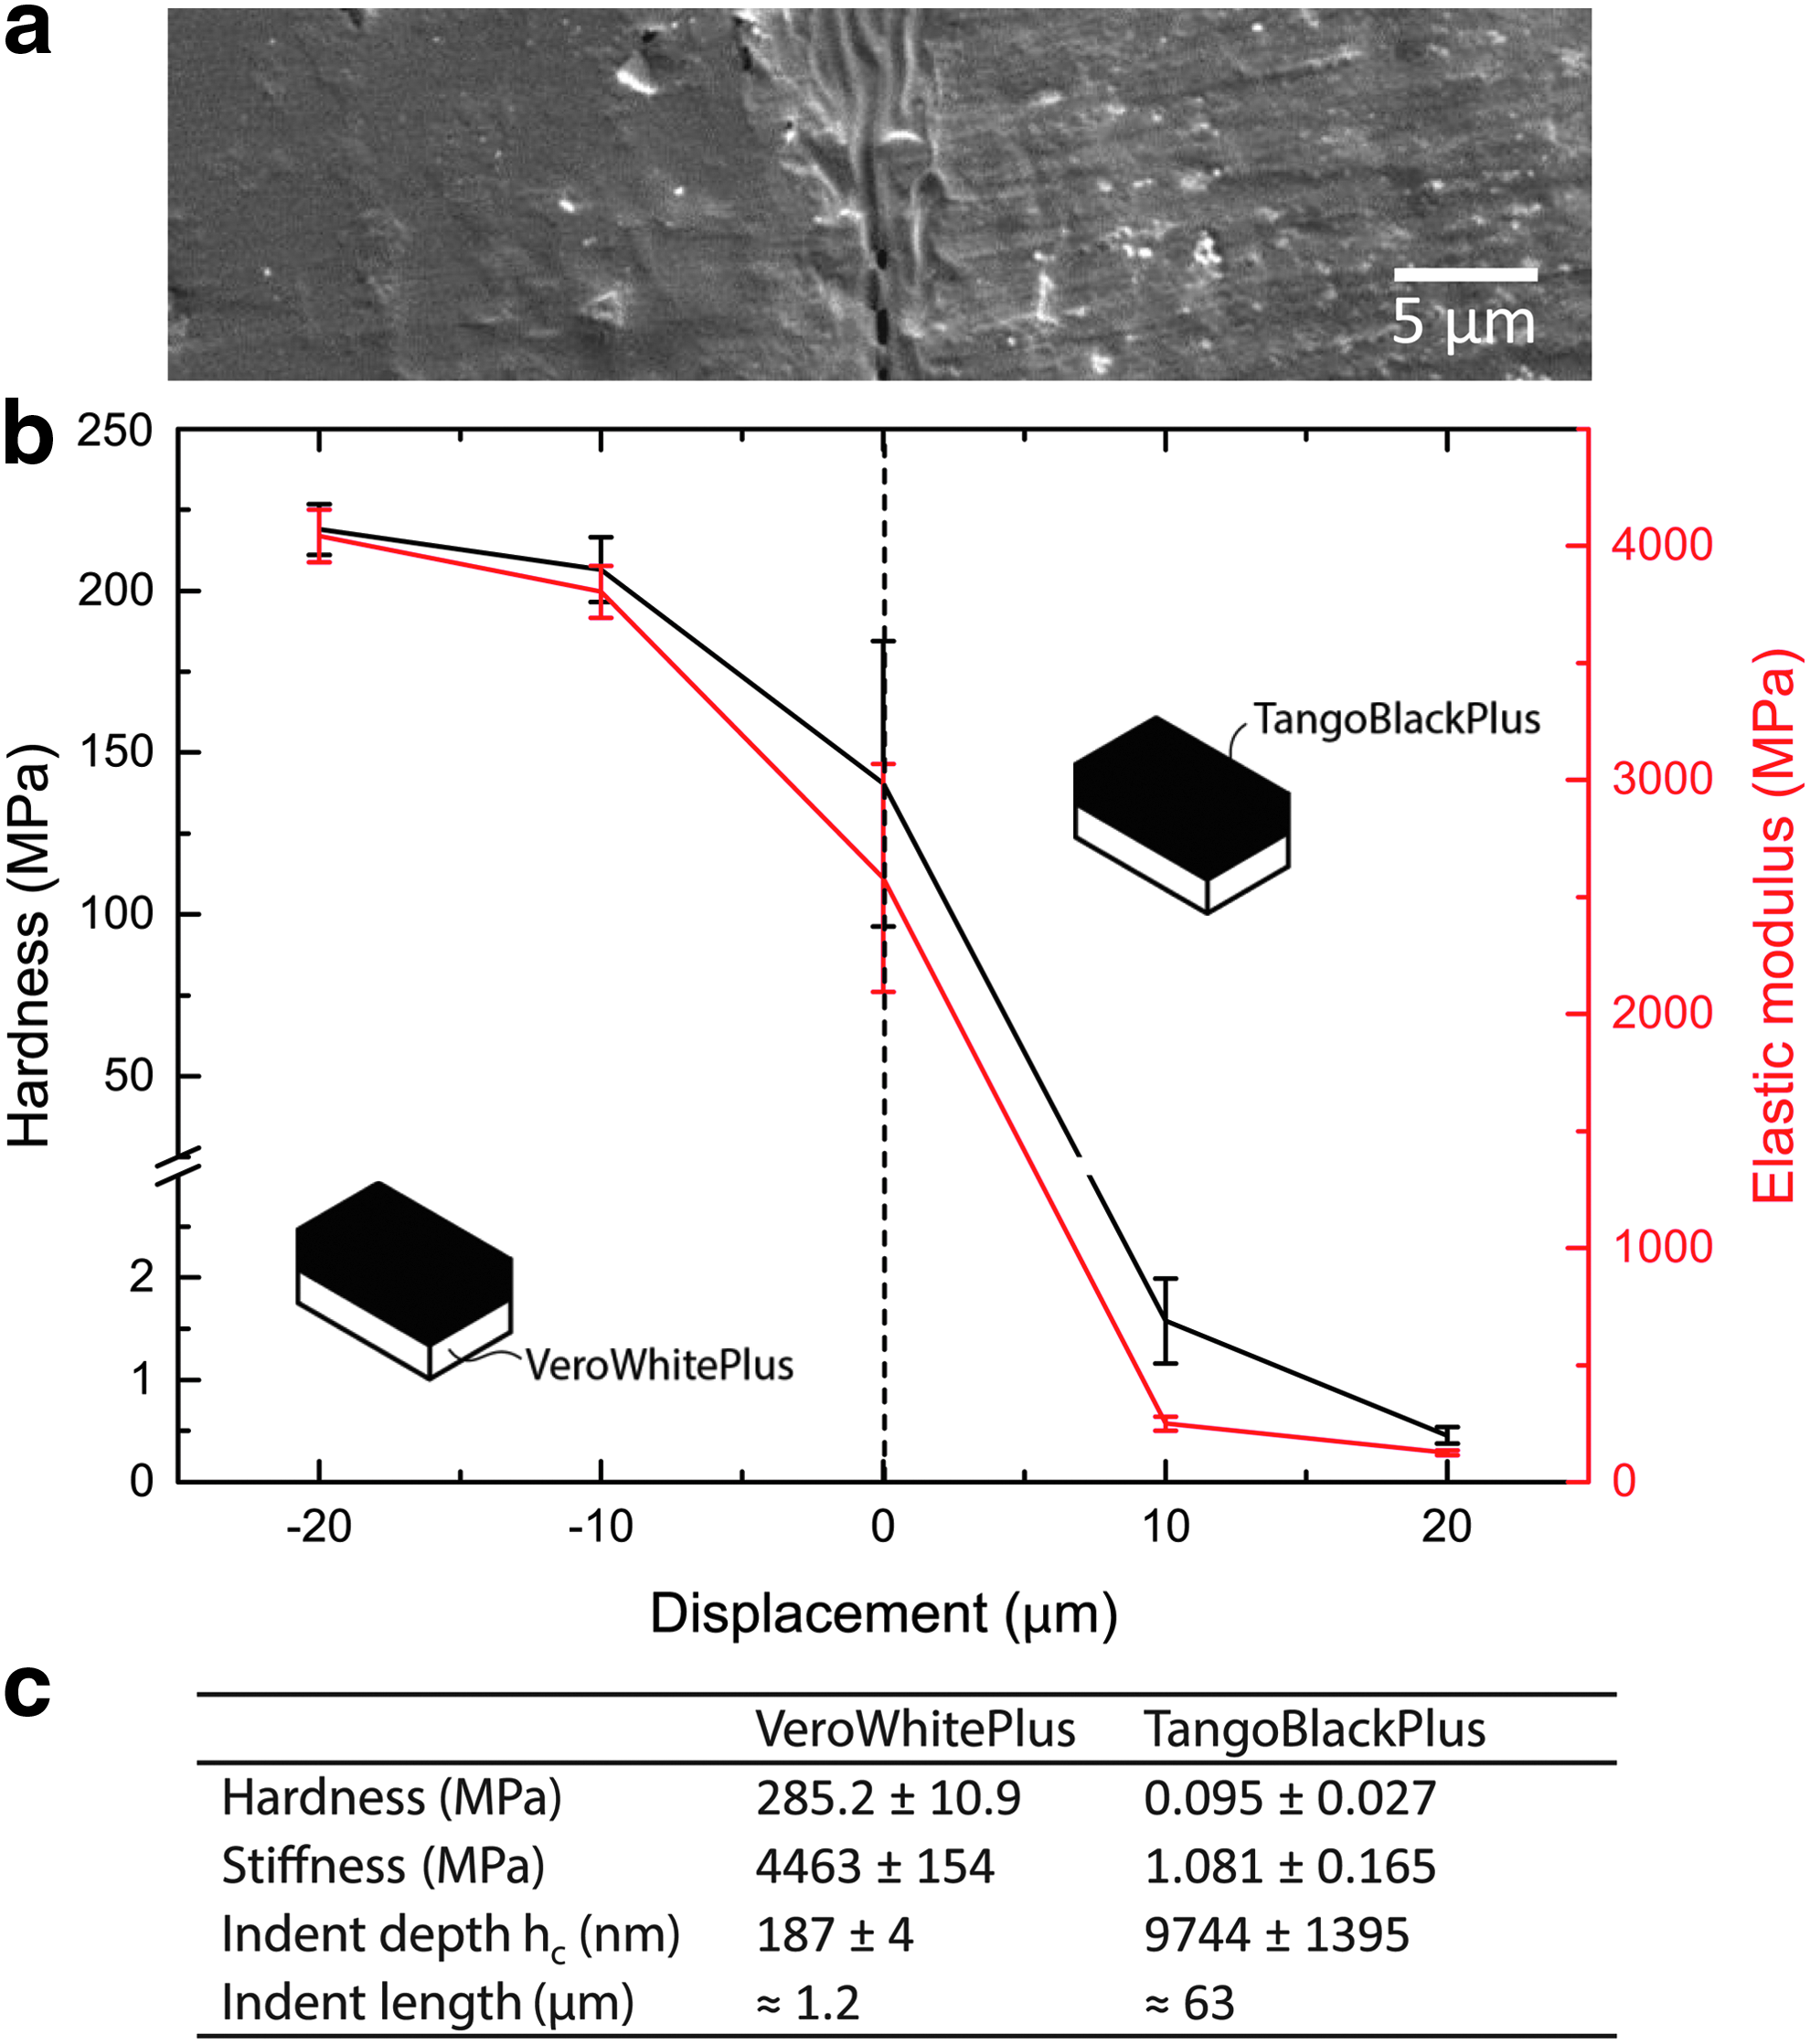
Multi-material interfaces.
In terms of the mechanical properties measured through standardized tensile tests, Stanković et al. 10 found similar moduli for the TB, but smaller moduli for the VW material (0.989 and 3085 MPa, respectively). Similar values are reported by Stratasys, that is, 0.8 to 1.5 MPa for the TB, and 2000 to 3000 MPa for the VW material. 4 Measurements on the micron scale, as used in those works, investigate purely the local and actual material properties; whereas macro-scale tests average over everything, including local imperfections and flaws that can act as stress concentrations. This also explains the larger discrepancy of the stiffer VW material (3085 to 4463 MPa, i.e., 31%), which is much more prone to such stress concentrations than the softer TB (0.989 to 1.081 MPa, i.e., 9%).
The findings suggest that the interface does not need to be considered a weak spot. In addition, the higher moduli found on the micro scale when compared with the reported values are in accordance with what has been reported in literature and do, therefore, not imply a need for specific consideration in the design process.24,25
Conclusion
Rather than a molecular mixing, the mixing of materials in material jetting is found to be comparable to the mixing in conventional composite materials, where stiff fibers are embedded in a soft material matrix. This has multiple consequences. First, it is not possible to reach a continuous material distribution, even if the supplier software allowed users to set user-defined ratios. Second, a local anisotropy is introduced that differs from the global anisotropy introduced by the printer. Third, the composite effect of the digital materials is only effective if the size of the part or feature is much larger (i.e., two orders of magnitude) than the inclusion size, which ranges from about 5 to 100 μm. It is, hence, inapplicable to use mixed materials for parts and features that are smaller than 5 mm.
In terms of single-material interfaces, hard materials produce layers of uniform height, which is opposed to soft materials. No deviation in the elastic modulus or hardness is found when comparing regions near the interface with regions away from it, which suggests that the macroscopic anisotropy is due to flaws and imperfections in the boundaries. Metallurgical specimen preparation generally proved to be appropriate for inkjet 3D printed polymeric parts, even for the soft material. In multi-material interfaces, no evidence has been found that the bonding of the interface is weaker than the bonding within the base materials.
The implications on the design of 3D printed parts using this AM process are twofold. For single-material parts and parts consisting of blocks of materials, designers can use the properties of the selected materials with a high certainty that they are valid, even for small parts and features. This is due to the negligible effect of the interfaces in the experiments. For mixed-material parts, however, the threshold above which the composite effect comes into play needs to be found and varies among different material combinations, load directions, and mixing ratios.
Footnotes
Acknowledgments
The research is supported by the ETH Zurich, Seed Project SP-MaP 02–14, “Additive Manufacturing of Complex-Shaped Parts with Locally Tunable Materials.”
Author Disclosure Statement
No competing financial interests exist.