
Abstract
Abstract
This article is the second in a two-part series describing a process for conformal 3D printing onto inflated substrates. The article describes the design and build of a custom-built four-axis 3D printer with the ability to measure the shape of any uneven substrate, and to then accurately extrude a thixotropic silicone onto the substrate by using Direct Ink Writing techniques. Details of strategies for 3D scanning a double-curved tubular inflated substrate using an industrial triangulation laser measurement device are given. Methods to import scan data and create a digital representation of the surface within the parametric design software Grasshopper 3D are explained. Geodesic print paths are created over the surface of the computed substrate, and these are the basis for calculating 3D printer toolpaths. A constant surface linear velocity strategy is developed, allowing the printer to move the print nozzle at a varying speed over the substrate surface. The change in speed is correlated with changes in the surface linear velocity of a fourth axis rotation of the variable radius balloon substrate. This ensures that the extruded bead maintains a constant thickness, even while using a constant flow rate deposition. The process is achieved by adapting cartographic techniques to re-project to the desired print paths. The efficacy of this technique is analyzed by 3D scanning a printed patterned balloon, then measuring and comparing multiple cross-sections of the extruded beading.
Introduction
A
This article fully describes a novel method to scan and extrude on double curved surfaces, focusing on a substrate that is a stretched and inflated balloon-like membrane (described in Part 1 of this article), mounted on a rotating fourth axis within the printer gantry. This series of papers expands and fully explains the techniques exposed in Ref. 6 There are numerous applications for such techniques, including the creation of 3D printed medical devices such as 3D printed collapsible stents 8 mounted directly on removable inflatable substrates, the fabrication of Dielectric Elastomer Actuators, 9 or, more specifically, Dielectric Elastomer Minimum Energy Structures, 10 along with Pneumatic Artificial Muscles 11 and other soft robotic applications. The techniques also have applications beyond inflatable structures—any non-uniform tubular substrate can be printed on, and this has great potential in bio-fabrication and bio-plotting applications, 12 along with printed electronics in robotics and structural monitoring. 13
In additive manufacturing, it is necessary to maintain a strict constant velocity of the print nozzle over the substrate surface (this is in contrast to subtractive manufacturing techniques, where four-axis CNC milling is common14–16 ). If the substrate is a constant radius cylinder, this is straightforward to achieve. By aligning the rotating axis (θ) along the system X axis and then positioning the print nozzle directly over that axis, there is no need for any further X movements. The printer can then be treated as a θYZ system, where θ is a fixed distance value in mm (equivalent to the rotational angle in degrees).
An inflated tubular substrate tends to bulge at the center, meaning that the circumference is variable along the length of its rotational axis. Depending on the height of the print nozzle as the mandrel rotates beneath it, the surface linear velocity of the substrate will increase proportionally to the radius of the substrate at that point. This would not be difficult to accommodate if the printed lines were always along the length of the axis—where no speed change would be necessary—or alternatively perpendicular to it, where the surface velocity would be a proportional function to the radius at that point. Difficulty arises when attempting to print at an angle in between those two, or worse, when the requirement is to print a variable spline or arc across the curvilinear surface.
This article describes a method developed to maintain a constant linear velocity of print head over the surface of a nonuniform, nonaxially symmetric surface. This has similarities to “Iso-planar toolpath generation” regimes used in subtractive manufacturing,17,18 but it includes a number of important steps, such as the creation of a variable toolpath speed per segmented line, depending on the angle of that line and its distance from the rotational axis of the substrate.
Non-contact 3D acquisitions of solid object geometries have become well researched and commercialized in the last number of years. There are numerous low-cost solutions on the market that can create stereolithography (STL) files from scanning objects. The preferred requirements for object scanning are opacity and Lambertian (diffuse/matt) reflectance. Generally, sensors function by either measuring the angle of reflected light (triangulation), 19 time of flight 20 or measuring the distortion of a projected structured light grid. 21 In this work, an industrial triangulating laser measurement setup is used.
Creating computational models and form finding of inflated structures are discussed in detail in Ref. 22 It is suggested that different forms of inflated structures require varying strategies to describe their shape accurately—for example, a pillow-like “envelope” structure is best described by using multiple long profile curves, whereas tubular or cigar-like shapes are better described by using co-axial rings.
Materials and Methods
Printer hardware setup
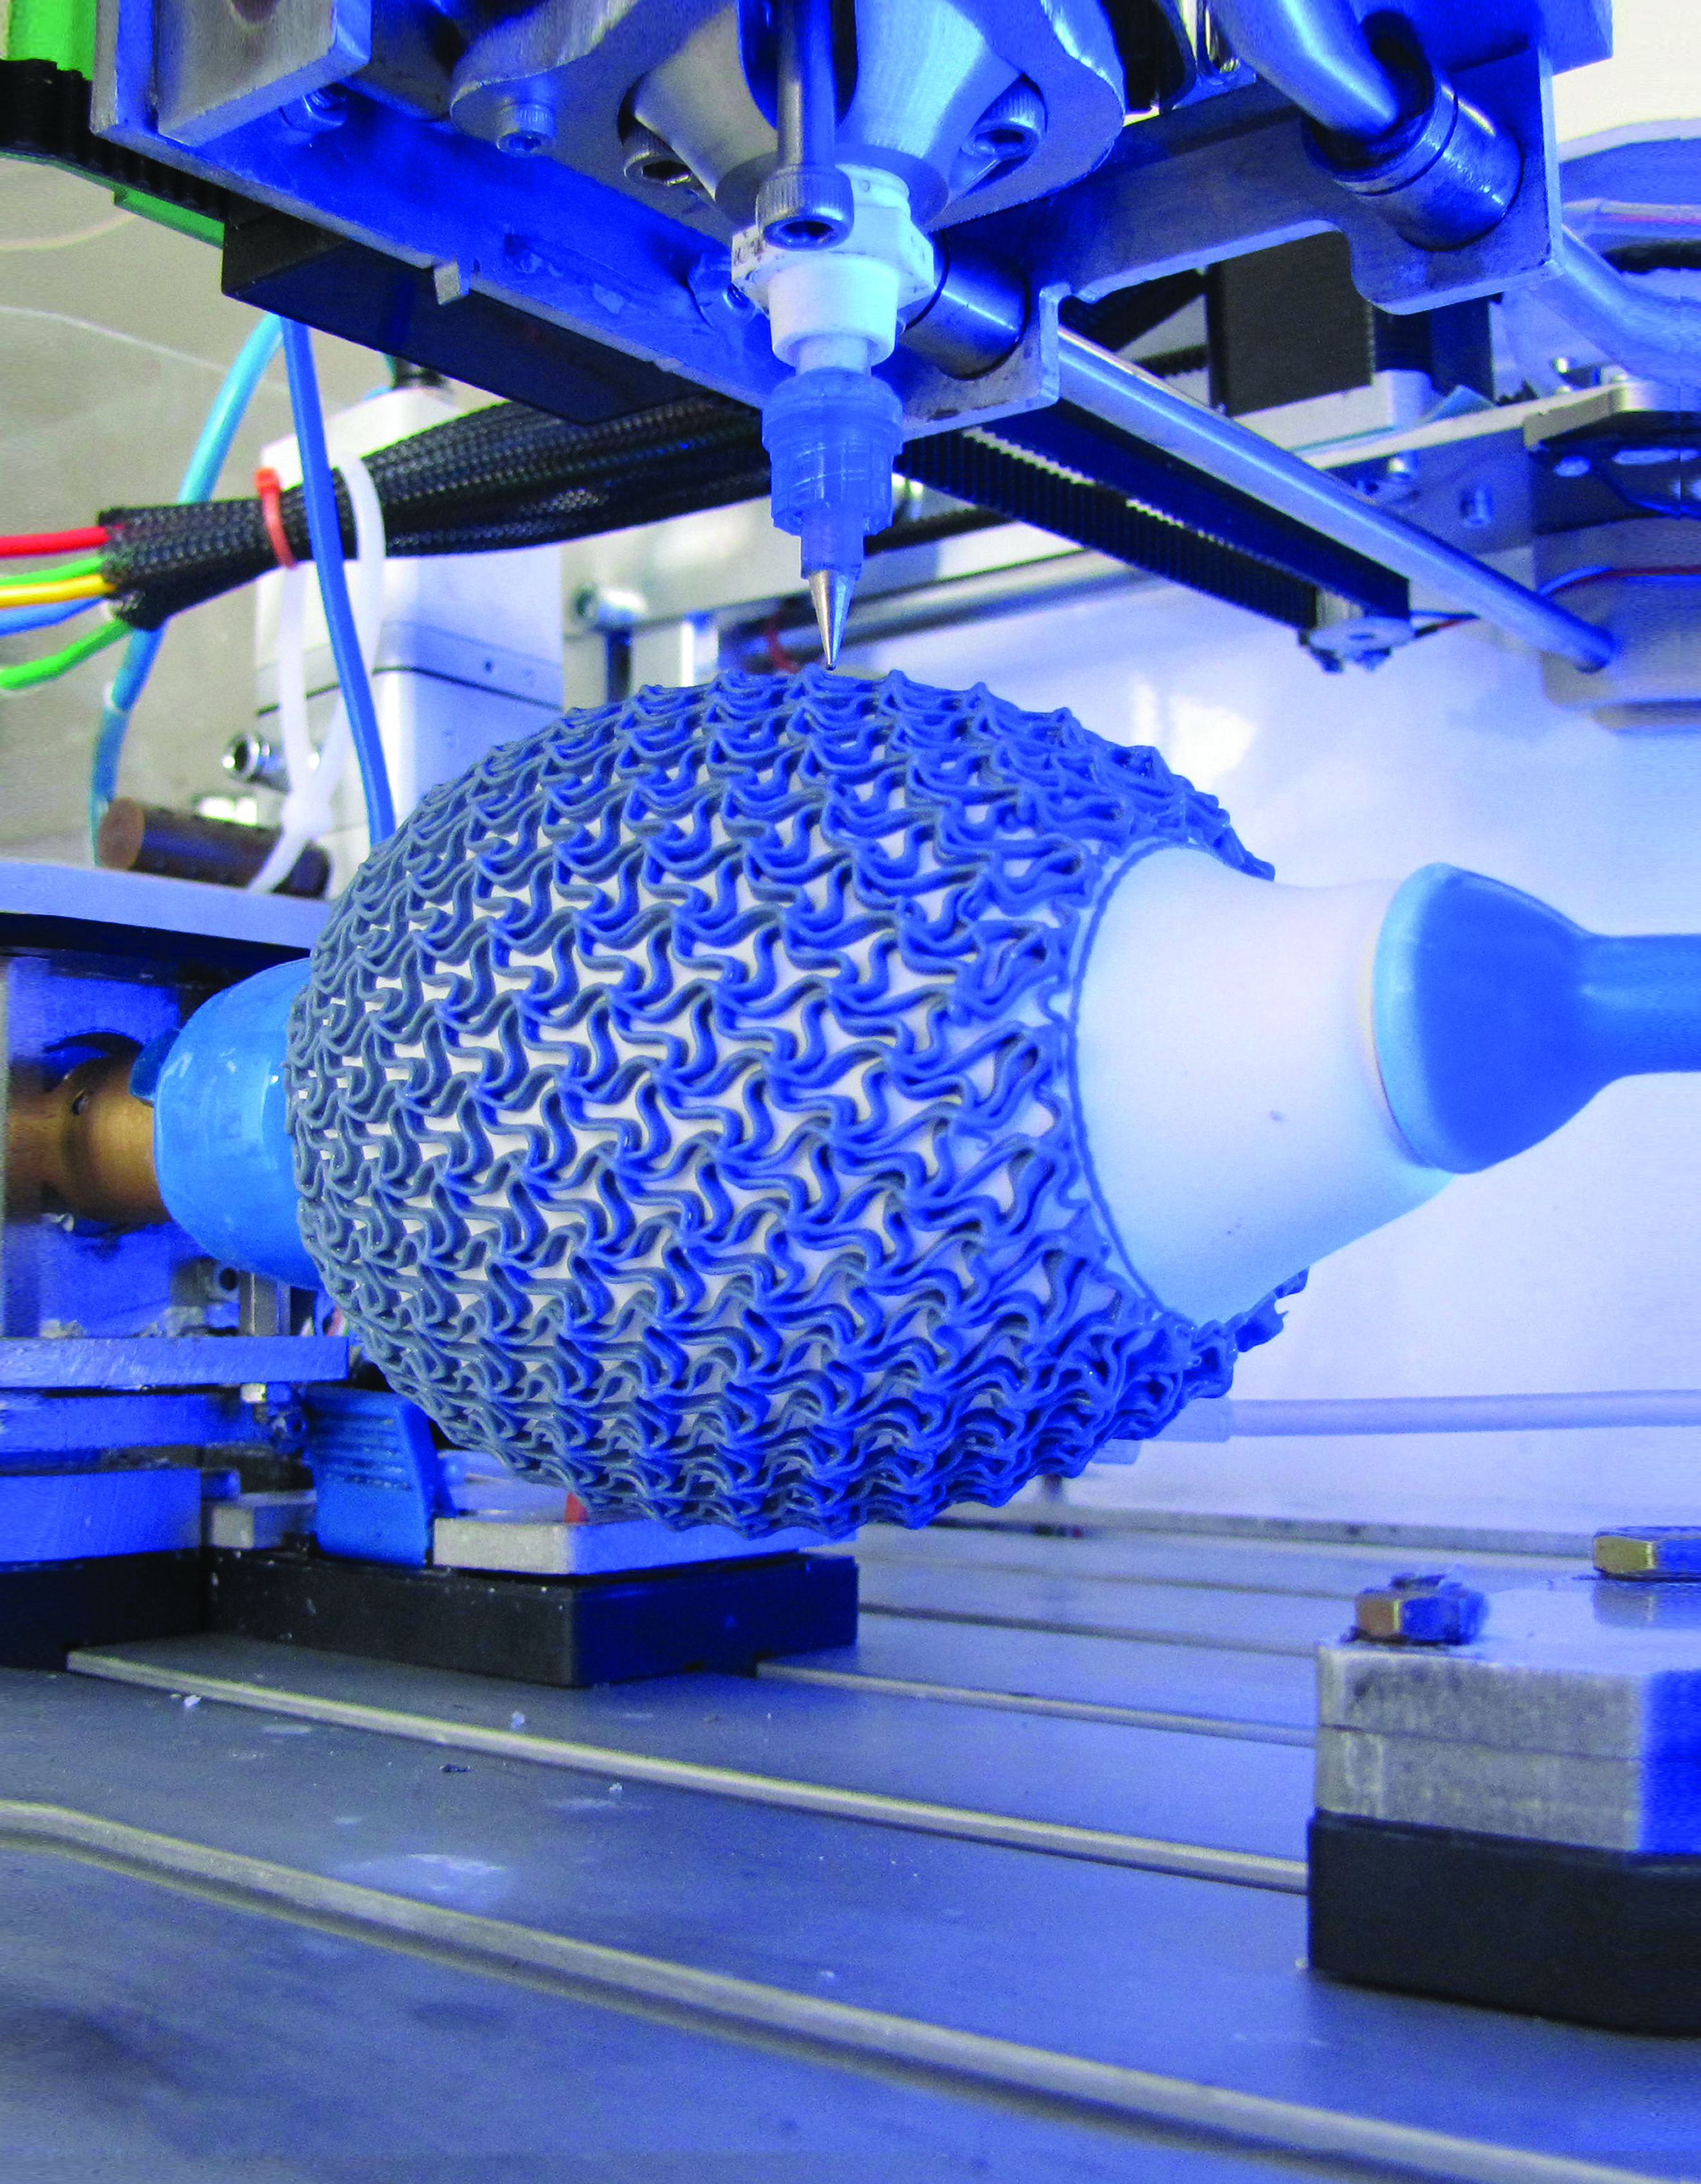
A 3D printer gantry (Leapfrog Creatr) was purchased and modified for the joint purpose of 3D scanning an inflated balloon membrane surface together with the extrusion of elastomeric paste material onto inflated substrates (Fig. 1). The hot end filament extruder of the original printer was removed from the print carriage (which is a standard design H-Gantry with a belt-driven X- and Y-axis). In its place was mounted a triangulation laser measurement device (Banner Engineering L-GAGE LG10A65PIQ) together with a pneumatically driven spool valve (Techcon Systems TS941), which allowed deposition of high-viscosity pastes such as a thixotropic silicone. The dispensing nozzle used was a 21-Gauge (Fisnar Precision Micron-S) cone.

The focal point of the laser measurement device was aligned with the extrusion nozzle along the Y-axis where the offset between the two was as small as possible—in this case 60 mm. The quoted accuracy for the device is 10 μm at a refresh rate of 100 ms. 23 The laser output signal was sampled by using an Arduino Uno microcontroller. To increase the precision of the Arduino's inbuilt 10-bit analog-digital converter (ADC), a high-resolution 4–20 mA Arduino Shield with a 16-bit ADC (Erdos Miller EM420) was integrated into the system. This is shown in Figure 1b.
As discussed, by rotating the substrate beneath the deposition nozzle, it is not necessary to move the X axis during a print. This means that the stepper motor driver usually used for X-moves can be repurposed for θ rotational movements instead. This was useful as it meant that a minimum number of changes were required for the printer firmware and hardware (in this case an RAMPS system 24 ), while still being able to maintain consistent three-axis coordinated movements.
Neither the hardware nor firmware natively supports an angular θ axis control, so a “hack” was implemented whereby the printer was fed a standard XYZ co-ordinate. The X in this case was configured to one rotation for every 48.004 mm. The mandrel angle θ is a simple function of this revolution per mm setting.
To reconstruct scanned surfaces, calculate print toolpaths, and generate GCode, the parametric modeling plugin Grasshopper 3D 25 for Rhino3d was used. Figure 1a shows a schematic of the overall system.
Materials
The inflatable substrates used were the balloons that were created in Part I. The silicone used for these was Ecoflex 00–30 (Smooth-On, Macungie, PA) with white pigment added (0.2%), The balloon surface was dusted with a thin layer of talc to reduce specular reflection. Such reflection tends to distort measurements made by using a visible light laser.
The silicone patterns were extruded by using a hard Shore 73A addition cure silicone (Thomtastic 73, Thompson Bros, Newcastle England). The material was mixed with hardener at a 10:1 ratio, and with colored pigment at 0.1%. It was vacuum degassed at 2 × 10⁻³ mBar at room temperature for 10 min.
It was made thixotropic by mechanical mixing with fine ground kaolin (aluminum silicate hydroxide) powder (supplied by Sigma Aldrich), at 5% by weight powder to silicone. It was put into a 55-mL dispensing tube and then centrifuged for 4 min at 4000 RPM. This removed the majority of air bubbles introduced during filling.
The dispensing tube was attached to the spool valve, and it was pressurized to 0.5 MPa. This silicone does not crosslink at room temperature (it requires elevation to 80°C for 15 min) but can only maintain a constant viscosity for ∼90 min—its pot life. Beyond this time, the material flow rate becomes variable, and, therefore, printing cannot continue.
For this reason, scanning of the balloon and computation of toolpaths was generally completed consecutively with preparing the material.
Scanning and creating surfaces
To scan the dimensions of the inflated balloon substrate created in Part 1 of this article (also shown in Fig. 1c), measurements were taken by moving the focus of the measurement device over specified points of interest on the substrate. The measurement device outputs a varying 4–20 mA signal in response to a reflected angle of incidence from a projected red laser. The output signal current is related linearly to the distance of a surface from the device focal lens. This measured height corresponds to the unknown Z-axis height value, for each known Θ and Y co-ordinate.
Two different methods can be employed to measure an inflated substrate. The first method involves traversing the laser along the Y axis while sampling as often as possible, resulting in an approximate axial profile shape of the substrate. The balloon is then rotated by a known angle, and the process is repeated multiple times. Here, this is referred to as “Longitudinal Scanning.”
An alternative method is to measure a series of cross-sectional rings by holding the laser static above a specified point on the Y-axis and rotating the balloon underneath. After each ring is fully measured, the laser is jogged a known distance along the Y-axis and the process is repeated. This is referred to as “Co-axial scanning.”
Both methods were tested, and results were compared in this work.
Longitudinal scanning
The height deflection laser output values were read as often as possible in accordance with the laser refresh rate—in this case, every 100 ms. The speed of movement (feedrate) was extrapolated by specifying the required resolution along the axis (every 0.5 mm) against the refresh rate, resulting in an F speed of 300 mm/min in this instance.
Following a complete profile measurement, the mandrel was rotated, and the process was repeated. During measurement, height data were continually sampled by the Arduino scanner ADC and sent to a bespoke data acquisition program written in Java. These data were saved to a text file, which was then read in to a Rhino Grasshopper script for conversion to an NURBS (non-uniform rational B-spline) surface. For brevity, each point was only sampled once.
Computing the virtual representation of the surface was achieved in the Grasshopper 3D environment. First, the height-data file was split into separate lists (or “branches” in Grasshopper nomenclature), each corresponding to a single profile line. These values were converted from the mA output of the ADC into mm heights, by using a mapping function (The upper and lower limits mA values were previously measured in a calibration routine). Cartesian points were created by combining the mapped height values with their corresponding Y value calculated according to the scan frequency and resolution. It was then rotated around the Y-axis to the angle that corresponds with their branch number (Fig. 2a). In this instance, there were 8 lines, each of 240 data points, and each rotated 45° to its previous. When rotated, the lists fully describe the surface within an X, Y, and Z coordinate space.
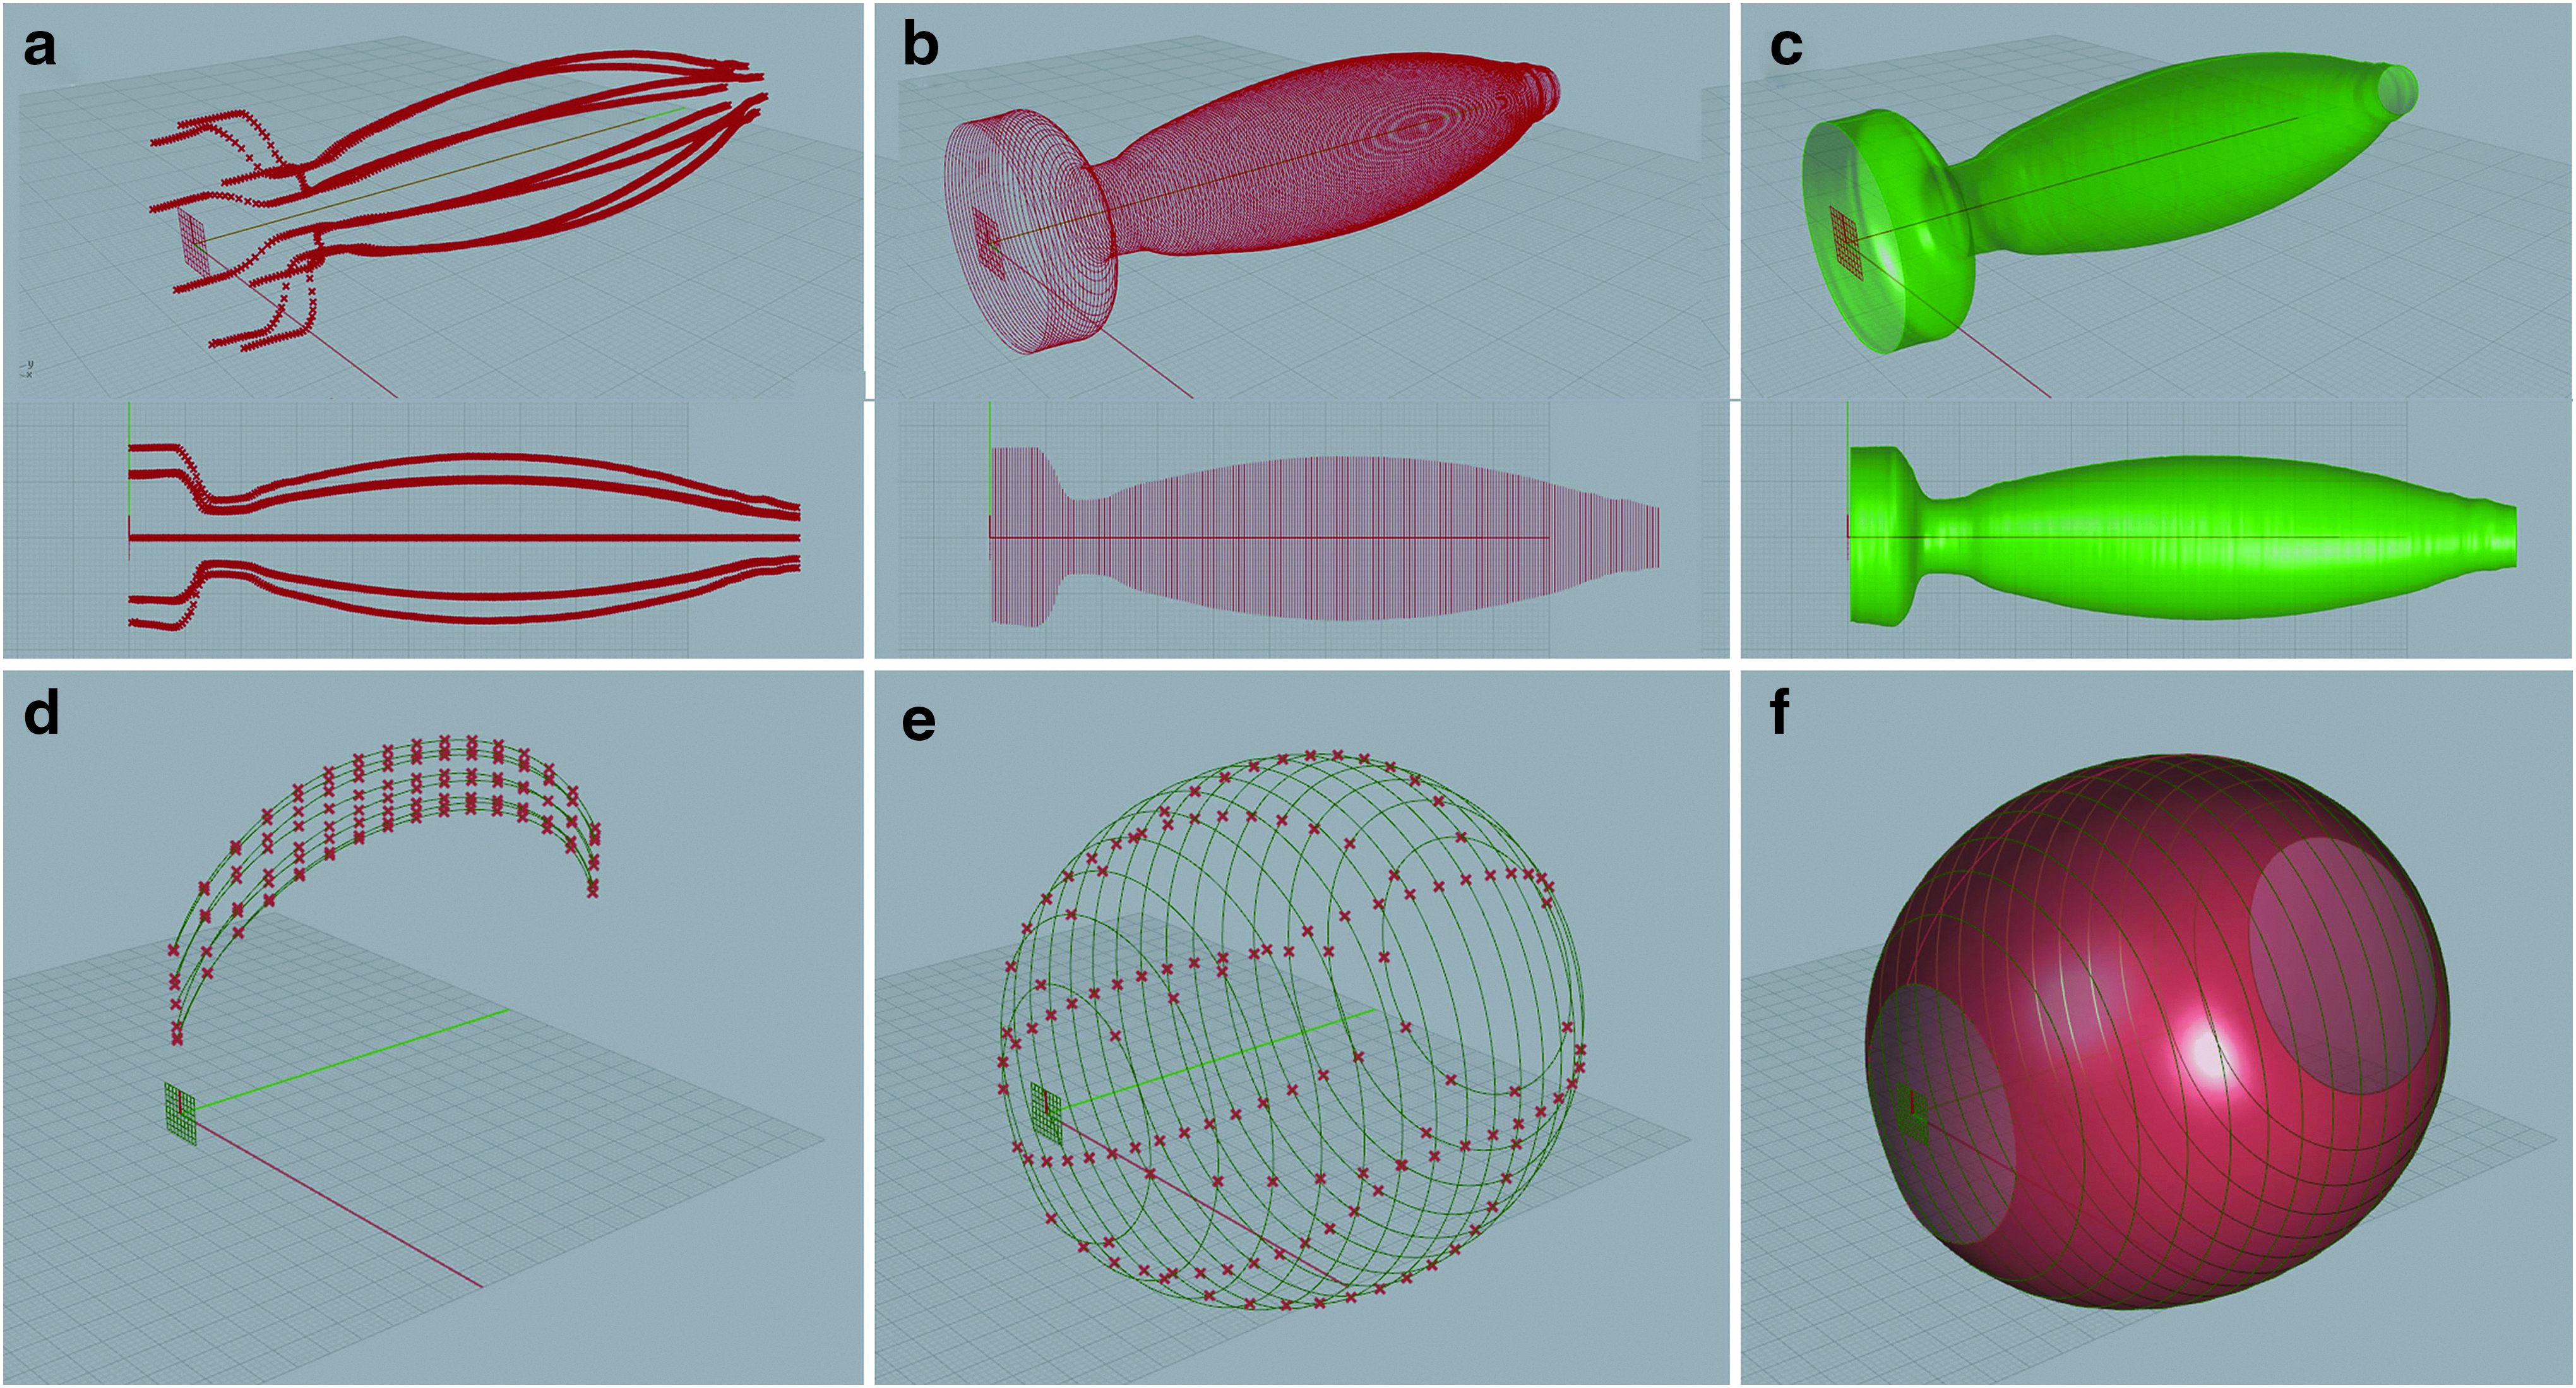
To create an NURBS surface from these points, the matrix of 8 × 240 points was transposed to become an array of 240 × 8, and it was then interpolated with a periodic closed line, creating a series of coaxial rings (Fig. 2b). These rings were lofted to create a surface representation (Fig. 2c).
Co-axial scanning
An alternative method of scanning an inflated structure is to sample the substrate at prescribed coaxial cross-sections. Parallels can be drawn to Maffei et al., 22 as described in the background section of this article.
As with the longitudinal method, the scan density was specifiable. It was experimentally found that a minimum of eight points per cross-sectional rings was sufficient to describe the smooth curves of an inflated tubular substrate. The distance between each ring was specified by stipulating the length of the substrate to scan and the number of concentric rings.
The scan height data were split into separate branches and the Z heights were remapped to mm, as per the longitudinal method. These Z values were then combined with their corresponding Y values. Figure 2d shows these points connected by an interpolated line, which is included here only to illustrate their order. The points were rotated around the central axis according to the sequence in which they were measured, resulting in Cartesian points. Figure 2e shows the concentric rings resulting from interpolation of these points. This set of curves was then lofted to create a surface (Figure 2f).
Creating geodesic toolpaths on curved surfaces
Creating seamless and continuous wrapping toolpaths over the surface of the balloon was achieved by subdividing the surface in the parametric space—U and V, where U represents a chosen number of longitudinal frames and V indicates the desired number of circumferential frames. In essence, these divided the surface into a grid of planes that lie normal to the surface. Figure 3a shows an example of these frames.

Print toolpaths were created by connecting the frames in a desired order by using geodesic lines over the surface. Having created a print pattern, the curve components were assigned an order and direction, so they could be converted into an efficient and continuous printer tool path. It was desirable to achieve a minimum number of valve on/off commands, achieving the longest possible continuous extrusions while at the same time ensuring all vertices were traversed only once. Figure 3b shows a sample helical toolpath composed of geodesic lines.
Converting Grasshopper geometry into toolpaths
When the desired continuous geodesic tool path was created, it was necessary to convert to CNC “GCode.” The methods devised to achieve this are analogous to the procedures used in cartography, whereby the globe is projected into various planar forms. Figure 4 shows the basic algorithmic flow chart describing how this is achieved.
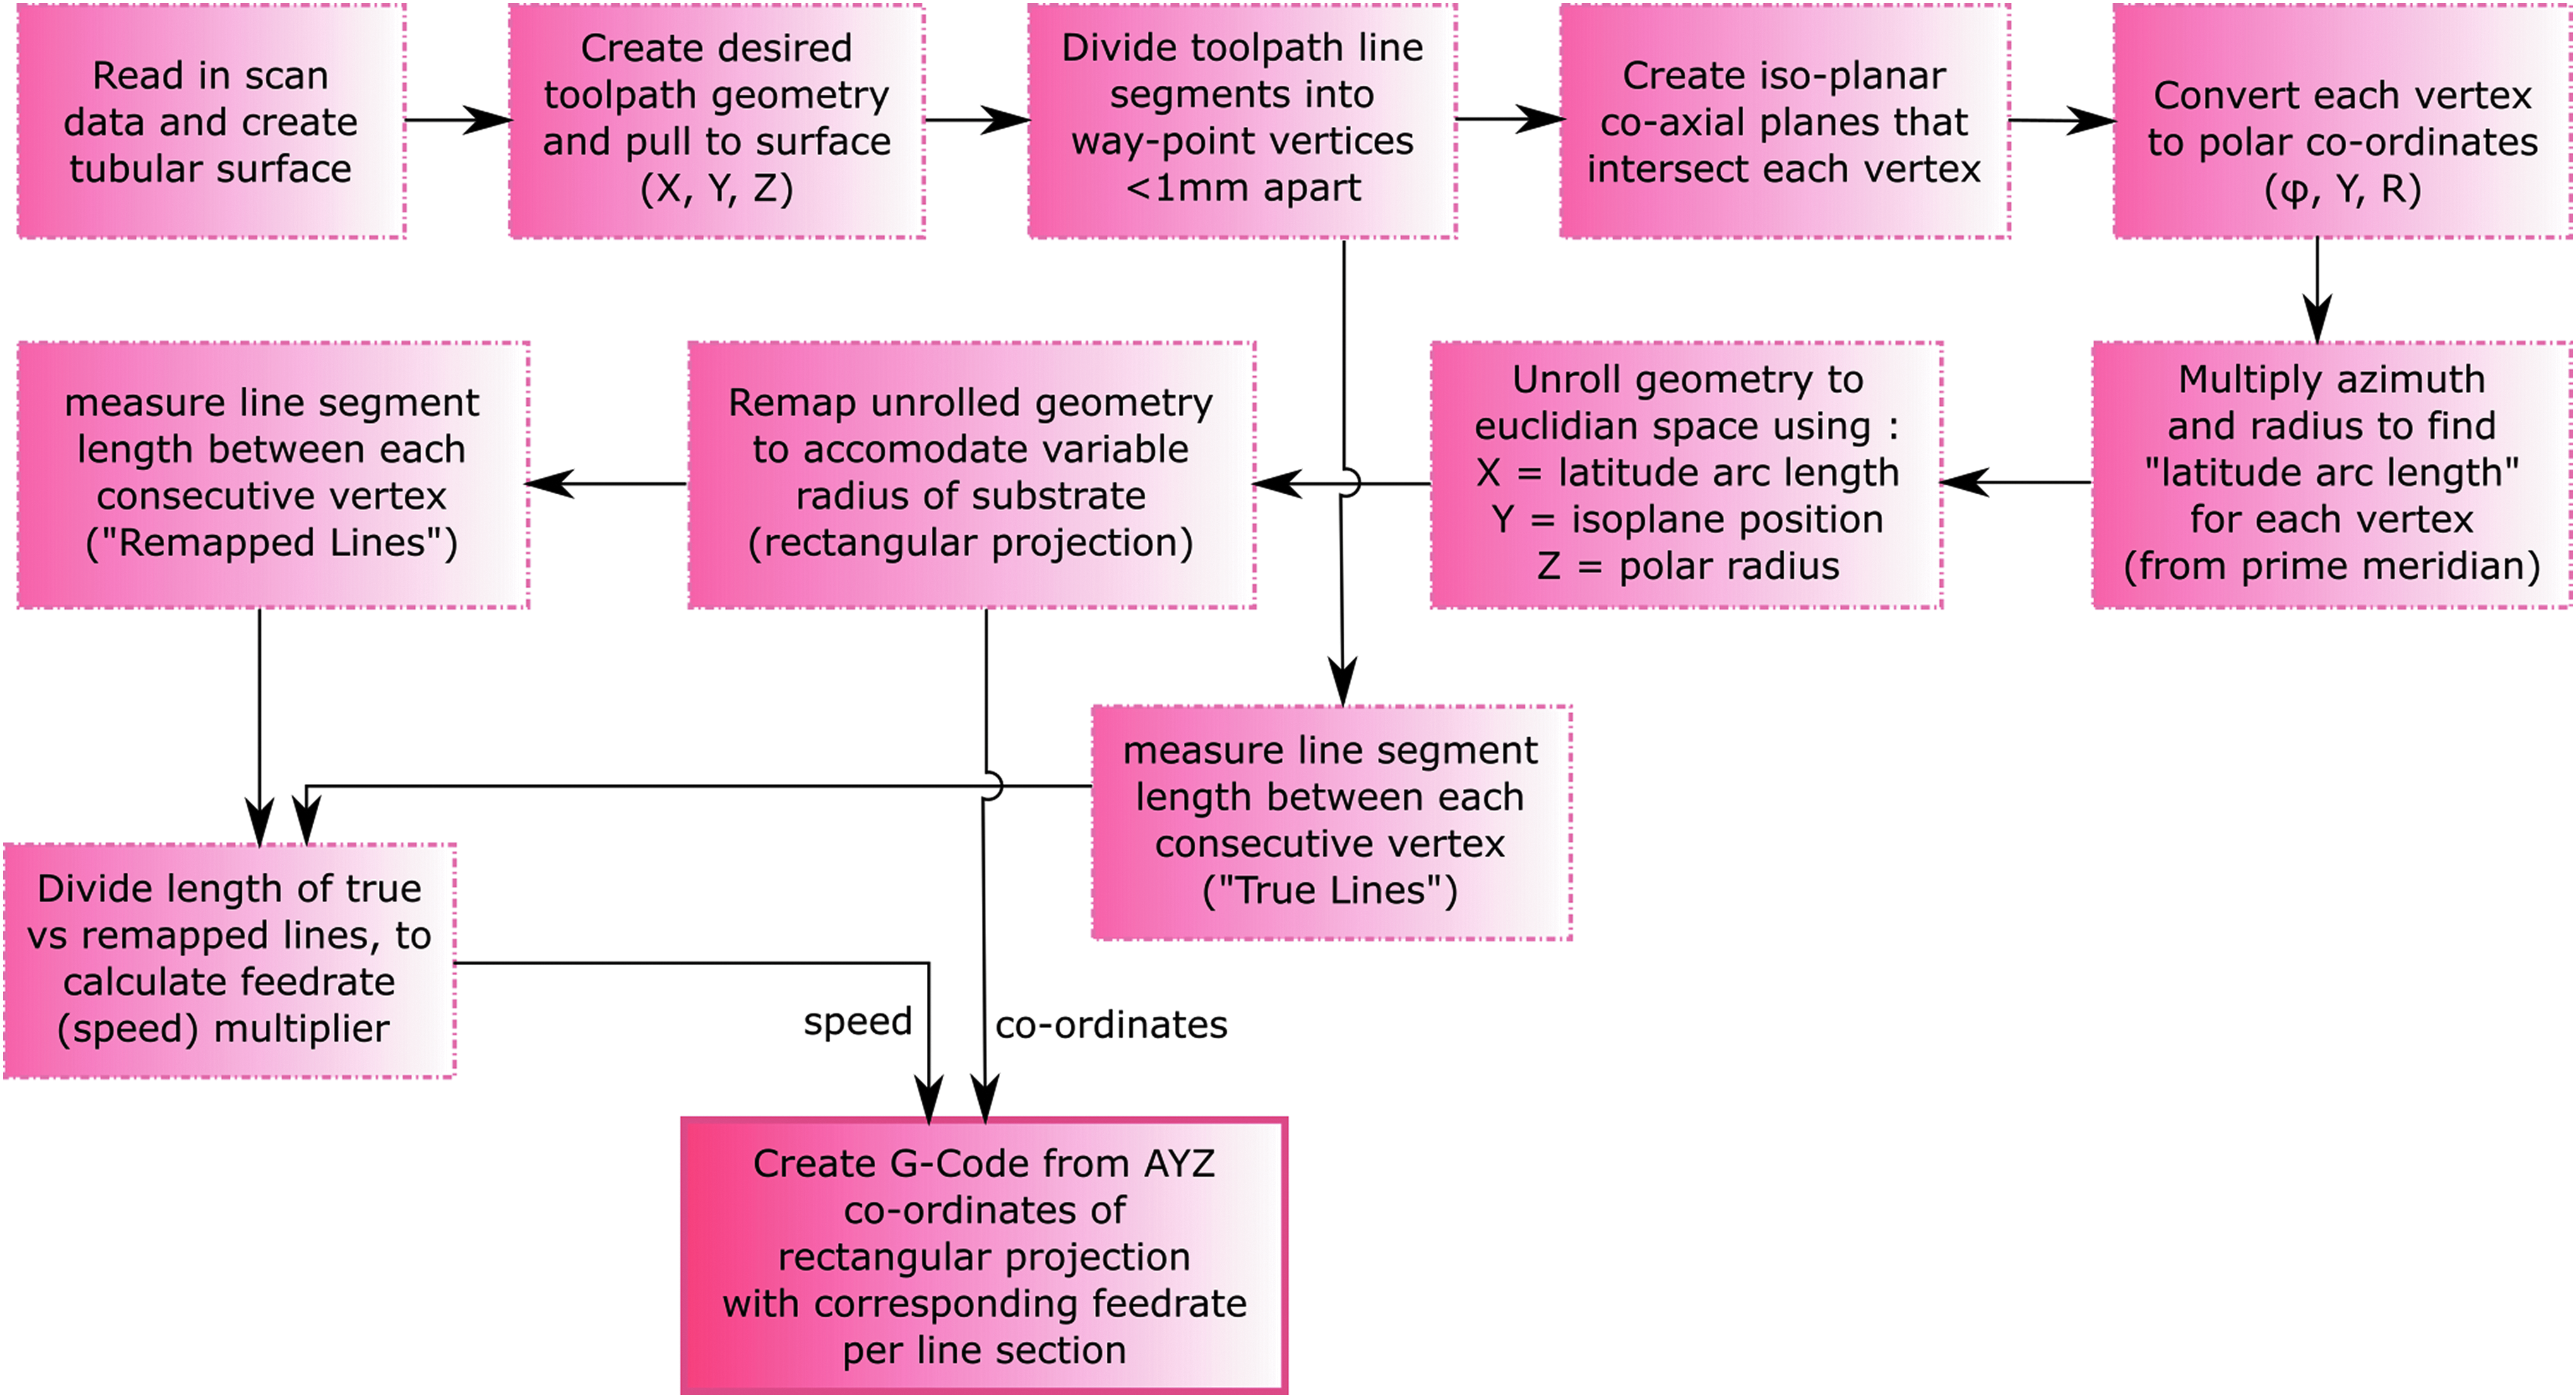
Program flow for calculating fourth-axis movement with a constant surface linear velocity.
The cylindrical geometry wrapped around the virtual surface can most accurately be expressed in polar notation. This geometry must be “unrolled” from its polar form into Cartesian notation that the machine GCode understands.
As the rotational axis of the printer is unaware of a changing circumference on the substrate at any point, a single rotation of the axis can result in a variable arc length on the substrate surface depending on the circumference (i.e., latitude) at that point. To compensate for this, the unrolled Cartesian form must be “rectified” or projected into a rectangular form (akin to the Mercator projection).
To overcome the variable surface linear velocity of the rotating substrate, a method was devised that calculates a variable feed rate (i.e., print-head movement speed) according to a comparison of length between corresponding line segments in their original geodesic form and after their mapping to a rectangular projection.
Some confusion could arise here in the naming conventions of co-ordinate vertices when swapping between the various notations and projections. In this article:
Converting geometry to polar co-ordinates and “unrolling”
Iso-planar intersection techniques are commonly used in four-axis toolpath calculations for subtractive freeform surface machining. A modified version of the technique was developed for this Direct Ink Writing purpose.
The first step involved taking each line segment of the desired toolpath, a simple example of which is shown in Figure 5a. Each line segment was sub-divided into an ordered list of rectilinear waypoints, in this case less than 1 mm apart (per Figure 5b). It was found experimentally that segmenting these lines in divisions more than twice the dispensing nozzle aperture introduces a perceivable faceting on curves and arcs. The print nozzle used here was a 21-Gauge cone with an inner diameter of 0.51 mm.

The Cartesian waypoints were then converted to polar notation. Although this could be done by using standard trigonometric conversion, Grasshopper features a function that can calculate the polar angle
The linear distance from the Y-axis (i.e., the radius) was then multiplied with its respective angle
This calculated arc length was used to unroll and find an X value equivalent in the Cartesian space. Cartesian was required as this is the co-ordinate system that the RAMPS firmware works in.
If the “A” angle co-ordinate were left simply as a product of the arc length, the resulting path would end up looking distorted, as seen in Figure 5d. Although this path looks distorted, it can actually be considered an equal-area, “pseudo-cylindrical” projection, akin to the geographic “Mollweide projection.”
This projection was rectified to a rectangular form, so the revolution of the substrate corresponds to the correct polar angle, irrespective of the substrate's cross-sectional circumference at that specific point. This rectification was achieved by “remapping” the unrolled arc length (latitude) value of each waypoint from the domain (zero to the cross-sectional circumference at that point), to the domain (zero to firmware assigned mm per revolution). The former domain will vary according to each waypoint, whereas the latter will be constant, and in this instance is 0–48.004 mm (as discussed earlier).
The result of this remapping is seen in Figure 5e. Note that only the “A” value is remapped here and the Y and Z values are kept unchanged.
Although this rectified set of points will result in the print-head moving to the geometrically correct position throughout the course of the print, a variable linear velocity of the underlying substrate will result in a material deposition with a varying thickness. The extruded bead will get thinner both as the substrate radius increases and as the angle of printed line moves more toward perpendicularity with the Y-axis. This can be overcome by changing the speed of print-head movement in proportion to these variables.
Creating GCode with constant linear velocity
To calculate the corrected speed per substrate radius, a method was devised that compares the length of each individual line's segment from where it is wrapped on the virtual balloon surface (i.e., its actual length), against its corresponding segment after unrolling and rectification (i.e., its rectangular projection).
The ratio between these two values when multiplied by the chosen print-head carriage speed represents a robust method for keeping the extrusion speed constant while dealing with the continuously variable linear velocity of the underlying substrate. This speed ratio/factor is dependent on the angle of the line segment in relation to the Y-axis. If the extruded line segment lies exactly on the Y-axis, then its speed factor will be unity. This will change proportionally as the angle of the line tends toward perpendicular to the axis. The proportion is related to the amount of inflation in the balloon. A base speed of 800 mm/min (along the Y-axis) was used for printing, though this was reduced to as little as 170 mm/min when extruding a line perpendicular to the axis, at the maximum height of an inflated balloon, such as the one shown in Figure 8a.
Adding multiple layers and helical toolpaths
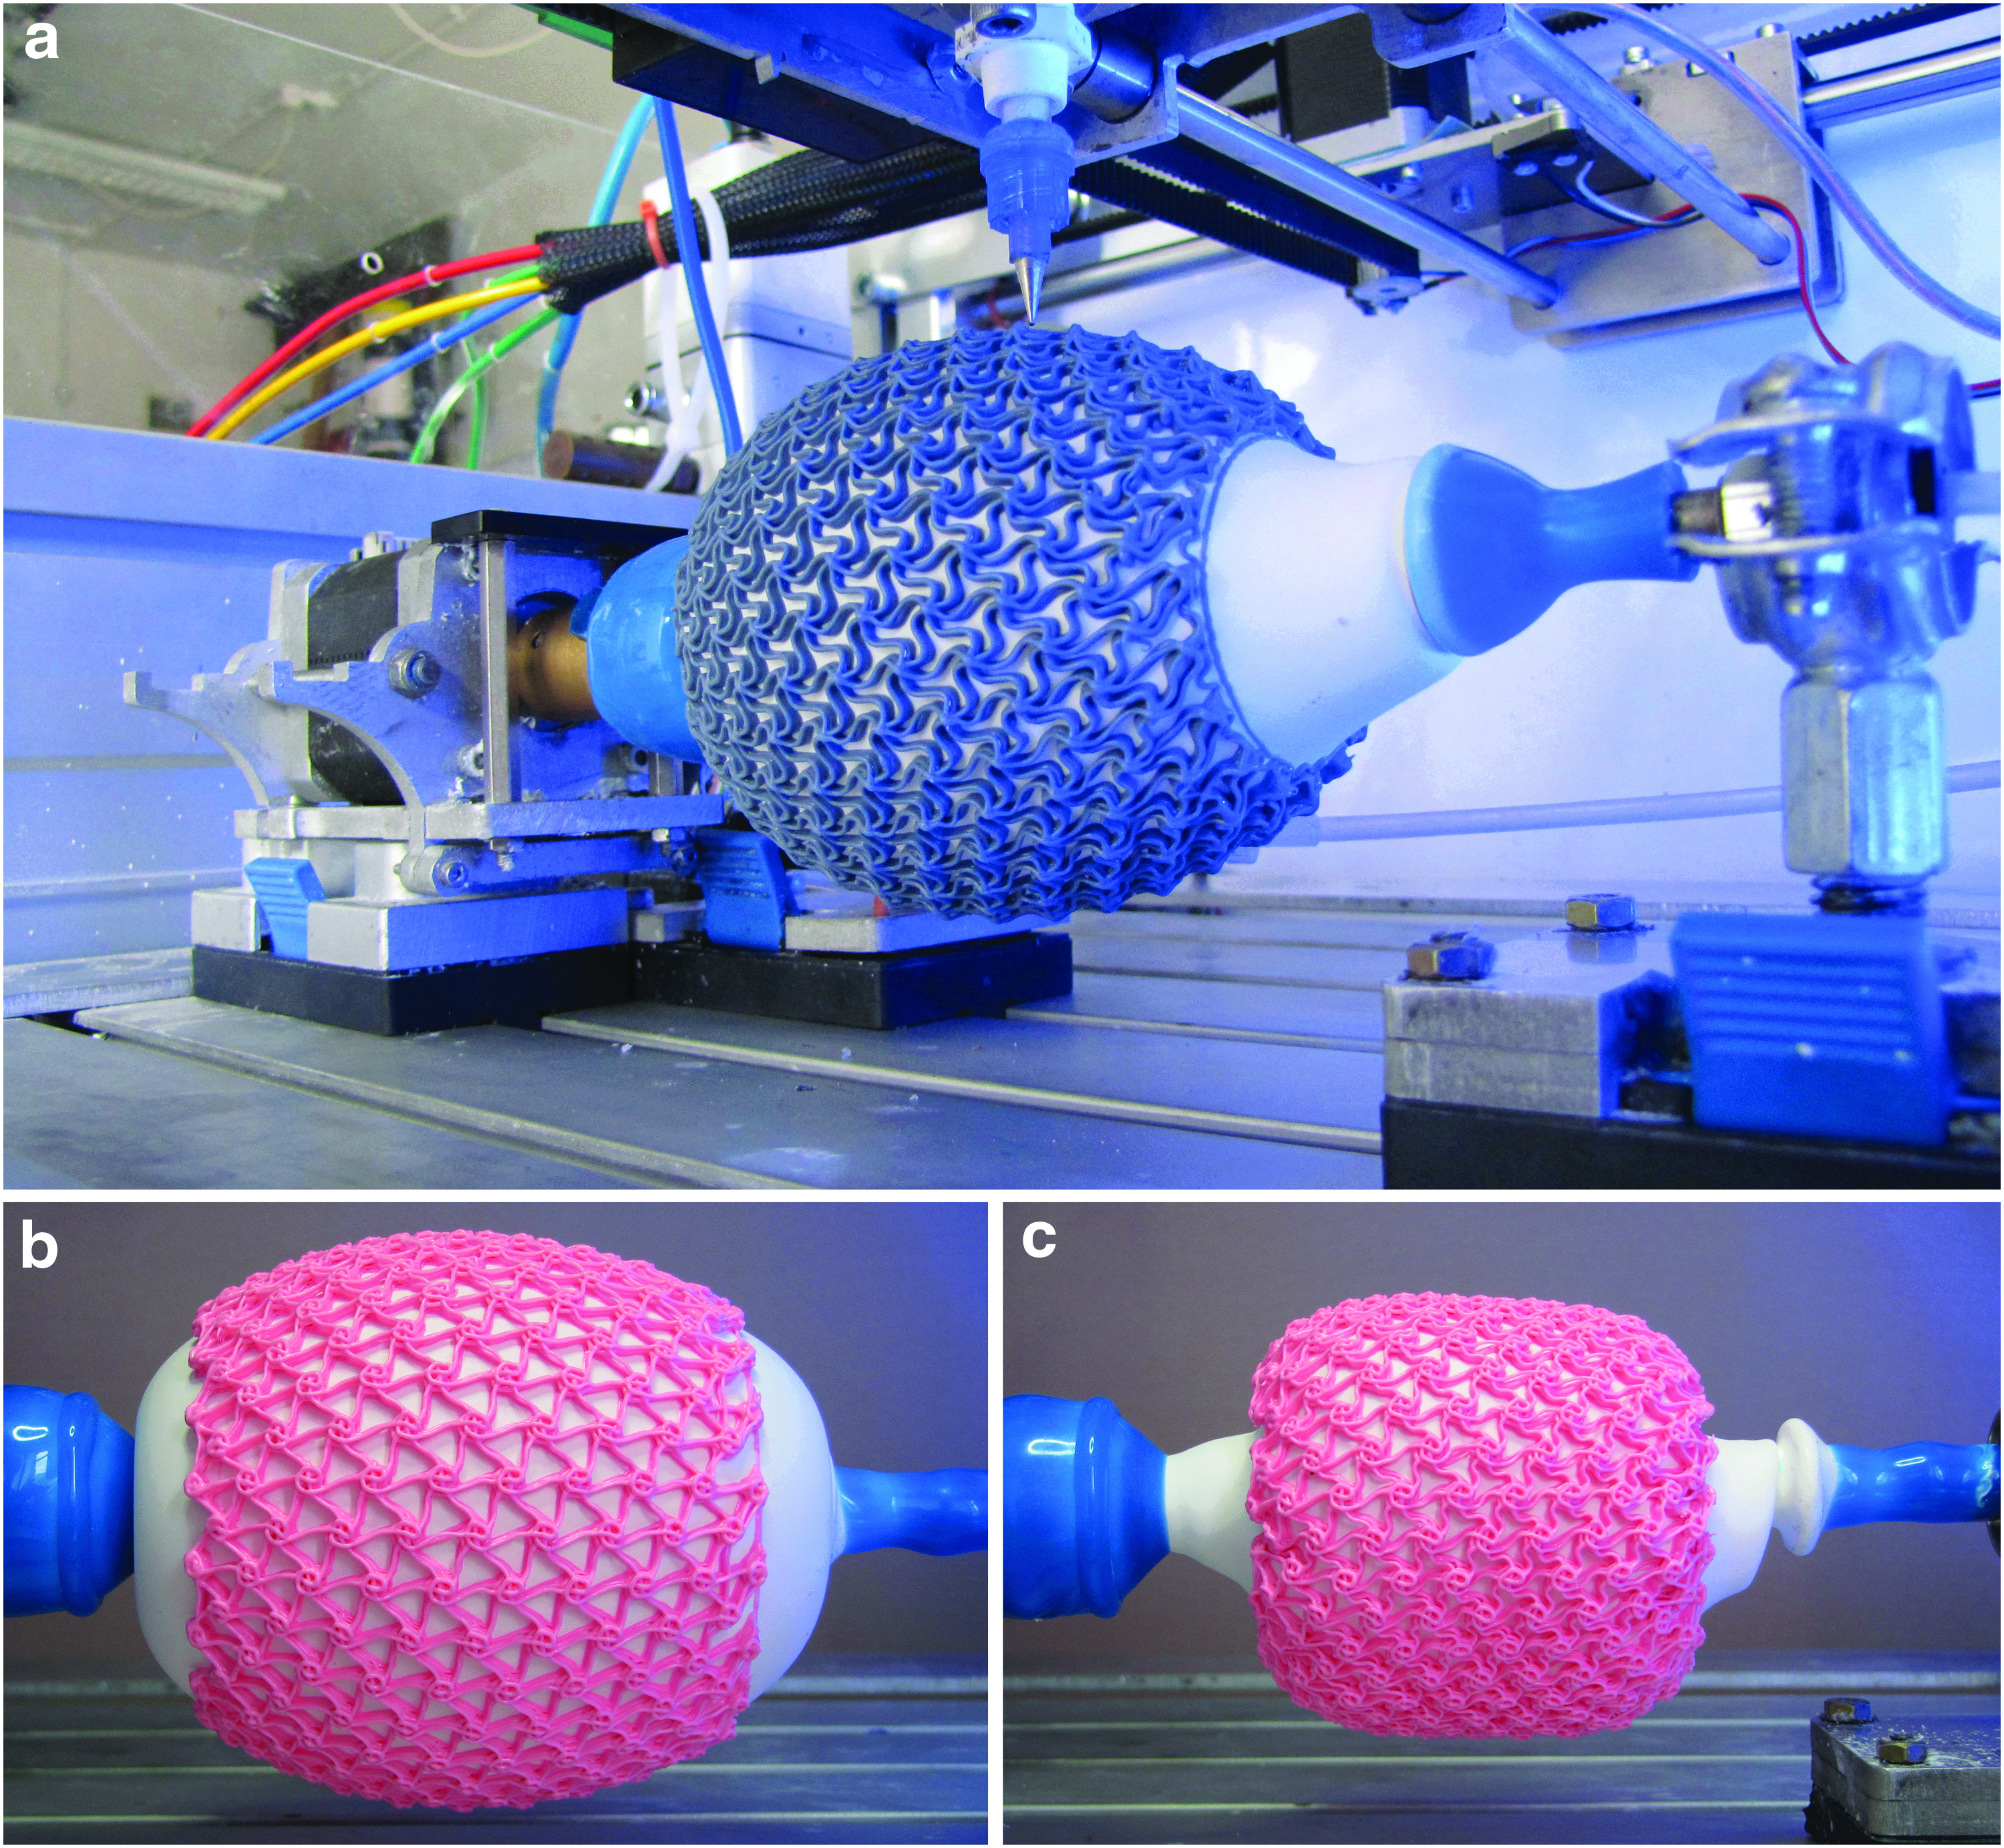
When more than one printed layer is required, it is essential to keep alignment of intersection node points on the respective layers. These nodes cannot simply be found by increasing the Z height, but instead they are calculated by offsetting the NURBS surface by the desired layer height (one offset per layer), and then recalculating the grid and geodesic toolpaths on that new surface. Figure 6a, b depict a set of five stacked toolpaths (from a complex pattern) that are wrapped on a mandrel, then unwrapped respectively. The printed output of these toolpaths is shown in Figure 6c.

The described method of “unwrapping” the toolpath geometry using polar notation creates continuous toolpaths that wind in a helical fashion around the mandrel. The prime meridian line is traversed numerous times in both clockwise and anticlockwise directions. The arc length or “A” component is reset to zero every time it traverses the meridian line. To fix this problem, a function was used, described by pseudo code:
The final step in creating the print paths was the concatenation of the two lists: (1) the normalized rectangular projection of vertices (A, Y, and Z co-ordinates) and (2) their corresponding feed speed (F value) into the machine-specific CNC GCode. Valve on/off (M-Code) commands were added where appropriate at the beginning and end of extruded lines, along with the appropriate machine-specific headers and footers (for example, initializing the stepper motors). All these data were exported to a text file that was read in by the 3D printer firmware.
Results and Discussion
Scanning of inflatable balloons
Two different approaches for measuring an unknown curved substrate are described in this article—“Longitudinal” profile and “Co-Axial” cross-sectional measurement. There are advantages and disadvantages associated with each method, depending on the shape of the surface and the changeability of curvature.
With longitudinal scanning, the laser is traversed along the axis at a constant speed, and measurements are made every 100 ms. Areas of sudden curvature change can be measured and described, without risk of missing surface features. This comes at the cost of accuracy and speed. This loss of accuracy has two sources. First, the print head vibrates while moving due to slackness in the belt drive system and in the consumer quality bearings. Second, the laser itself was found to have some jitter in the signal. Figure 2c shows that the resulting surface computed in the CAD model had a noisy and uneven surface. This could be potentially overcome by measuring several times for a given point and then averaging. However, such scanning would be extremely slow.
With a co-axial method of scanning, a small number of cross-sections of the substrate were measured. By experiment, it was found that eight points, each spaced 45° apart, were sufficient to accurately describe a near-circular cross-section in the balloons used. As the method described is asynchronous in measurement, multiple measurements of a single point were made before moving to the next. This removed much of the jitter associated with the laser device, along with the vibration during movements. Substrate cross-segments were measured every 10 mm as the inflated surface was smooth and had only gradual gradient changes. The resulting computed surface shown in Figure 2f was smooth and noise free. For this reason, co-axial scanning was the preferred method used when modeling inflated substrates to print on them.
Direct Ink Writing on Inflatable Substrates
Various seamless auxetic tessellations were printed on to inflated balloons, and the quality of extruded bead was examined, both qualitatively and statistically.
It was experimentally found that extruding on to a curved substrate was limited to printing on surfaces up to 45° from horizontal when using a four-axis system. Although it is possible to print on steeper gradients, the results become unstable for several reasons:
• The width of the nozzle can become a problem if the leading or trailing edge (whichever is closer to the substrate) scrapes or furrows the previous printed layer. • As the print nozzle is not normal to the surface but the calculated print paths are, the extruded walls begin to grow diagonally. This is illustrated by comparing Figure 7b(i) to (ii). This is especially problematical when printing silicone or any kind of thixotropic paste that does not solidify instantly. At a certain height (depending on material viscosity), the sloped paths will tend to slump or buckle due to gravity. • For the same reason, Figure 7b(iii) shows the commencement point of an extruded line overhanging the previous layer—effectively beginning in mid-air. This can result in a blobbing of material as layers build up. Figure 7c shows the complete side view of the corresponding toolpath.

For the reasons cited earlier, together with limitations due to pot life of the silicone, no more than six stacked layers were printed in this work. This resulted in an average wall height of 1.4 mm. The first layer was printed at 0.2 mm above substrate, and every subsequent layer was offset by 0.25 mm above the last. Print time was ∼75 min.
As both the inflated substrate and extruded material were addition cure silicone, they chemically bonded during vulcanization. It was noticed, however, that the bonding of the two materials was much better if the balloon was freshly produced and cured just before printing on it. This could be due to the surface energy of silicone dissipating with time when exposed to oxygen, making it less prone to bonding with subsequent layers.
Another issue with inter-material bonding came from the surface dusting of talc, which was used to remove the specular reflection for scanning. It was found not to be a problem if the crosslinking of extruded material with heat was delayed for several hours after deposition. It is supposed that this time allowed the talc to be somewhat absorbed into the extruded silicone.
Statistical analysis of constant linear velocity approach to printing
To test the efficacy of the constant linear velocity approach to extrusion on a curved surface, the homogeneity of line thickness and line heights were measured on the printed balloon shown in Figure 8a. The balloon was inflated, and it was then 3D scanned by rastering a 2D profilometer (Micro-Epsilon scanCONTROL 2950BL) along the balloon axis. Profiles were measured every 50 μm along the axis, with data points spaced ∼78 μm apart (1280 data points were captured across a focused width of 100 mm). An STL file of the scanned surface (Fig. 7d) was output from the profilometer measurements, and it was imported into Rhino3D software.
Here, a series of planar notional surfaces were created—30 per balloon, 10 each per angle of extruded bead. Three of these are shown in Figure 7d; they were labeled as having angles of 30°, 150°, and 270°. The intersection of these notional surfaces with the measured mesh resulted in a profile curve for the bead at coincidence. Each profile was exported as a set of 60 points, enabling their characteristics to be analyzed. An example profile curve interpolated from these points is shown in Figure 7e. These profiles were determined at random positions across the balloon and at various substrate circumferences; this ensured that all variations in print speed were examined. Profiles were always created by intersecting the notional surface perpendicular to the extruded bead.
Each of the 60 points consisted of an X and Z coordinate, that is, a position and a height along the notional surface used to create it. These were processed in Excel to enable the bead to be defined by two measurements, the width1/2, that is, the width at half height and the peak height. Summary statistics for the width1/2 of the 30 profile curves are given in the left-hand section of Table 1. The overall mean width1/2 of the bead was 0.804 mm with a standard deviation of 51 μm.
SE, standard error; SD, standard deviation.
The set of 30 values for width1/2 was statistically analyzed by Analysis of Variance (ANOVA) (Table 2) to test whether the bead width varied with the angle of the profile. The ANOVA table shows that the differences between groups (scan angles) are not significant; this supports the hypothesis that printing on the balloon surface by extrusion of six layers of silicone gave a bead width that did not depend on whether the extrusion nozzle was traveling axially, whether the balloon was rotating, or both.
SS, sum of squares; df, degrees of freedom; MS, mean square.
The right-hand side of Table 1 shows summary statistics of bead height. The overall mean height was 1.371 mm with a standard deviation of 93 μm. The ANOVA table is shown in Table 3. Again, differences between bead heights at different scan angles were not significant, supporting the hypothesis that the bead characteristics on the balloon surface were independent of whether the print nozzle was moving axially, whether the balloon was rotating, or both.
Conclusions
The custom-built four-axis 3D printer, together with the additive manufacturing method described in this article, is capable of creating arbitrary-shaped structures. In combination with the techniques described in Paper 1 of this series, the creation of a single, multi-material 4D printed object is possible through the extrusion and bonding together of a thixotropic silicone pattern onto a soft silicone inflated balloon with multiple levels of mechanical strain throughout the printed body. The techniques described are equally relevant to printing onto removable and sacrificial substrates along with other Direct Ink Writing applications such as in printed and stretchable electronics.
Different methods of 3D scanning of inflated tubular substrates by height deflection (triangulation) laser have differing advantages depending on the shape of the substrate being modeled. Scanning longitudinal profiles above the axis of the mandrel is useful if there are areas of steep gradient or a complex manifold to print on. A downside to this method is the creation of a “noisy” surface due to machine vibration and inaccuracies in the laser measurement device.
An alternative scan method where a number of equi-spaced co-axial rings are measured results in a lower vertex count and, thus, a smoother virtual surface. This is more useful if the substrate has small changes in curvature, such as seen in an inflated balloon. It is advantageous to minimize the number of vertices when recreating the surface in the software package Grasshopper3D, as it is computationally laborious to calculate complex toolpaths on a noisy surface.
The algorithm described for converting the desired toolpaths to a CNC GCode is robust and maintains a reasonably constant thickness and height of extruded bead, irrespective of the changing linear surface velocity of the underlying rotating substrate caused by the changing radius along its axis. This extrusion process requires a series of steps that mirror cartographic projection techniques. The resulting projection is an equal-area pseudo-cylindrical representation, which, when converted to a rectangular style projection, is geometrically suitable for printing on a four-axis system.
Multiple printed layers can be successfully stacked by using the offset surface function in Grasshopper. The toolpaths must be recalculated for each increase in radius measured from the axis. However, the four-axis printer is limited in the number of stacked layers that it can achieve, due to the print nozzle being constantly perpendicular to the mandrel axis, rather than normal to the surface. Nonetheless, up to six layers can be achieved easily and the printed bead maintains a constant height at all parts of the printed range. Trial and error shows that errors tend to occur beyond six layers in areas of steeper curvature.
That the bead wraps around the full circumference of the balloon without breaks or any stepping is a measure of the versatility and quality of this printing method.
Footnotes
Acknowledgments
All experimental work was completed at, and funded by, Nottingham Trent University, School of Architecture, Design and Built Environment. Measurements for results were performed in University College Dublin, Medical Device Design Group.
Author Disclosure Statement
No competing financial interests exist.