
Abstract
Abstract
A linear resistive temperature sensor has been 3D printed through fused deposition modeling using a conductive filament based on polylactic acid (PLA) and graphene nano rods (GNR) composite. The sensor is capable of measuring temperature variations based on the change in resistance of the printed pattern. As PLA is insensitive to and insoluble in water, the sensor can be used both in air and under water without any need of encapsulation. Graphene nanorods give the printed patterns a conductive property, while the PLA acts as a binder matrix. When the temperature rises, there is physical expansion of the polymer matrix at microscopic level that reduces the contact between the conductive GNRs and the resistance increases. On cooling down, the physical properties are retained and the resistance drops again. The sensors show excellent linearity and stability when tested both in air and under water up to 70°C. Beyond this temperature, the deformation in the polymer matrix is permanent and the resistance does not return to its initial value. To minimize hysteresis, the recommended operation temperature is up to 60°C. The effect of pattern width and length has also been investigated that shows a direct relationship of resistance with the length, while an inverse relationship with the width as expected. The sensitivity of the linear sensors was calculated to be ∼13 Ω/°C, while the response and recovery times were 6 and 14 s, respectively. Based on their performance, the sensors can be efficiently used for general aquatic and terrestrial environmental monitoring.
Introduction
E
Researchers try to achieve these goals by using different approaches such as changing the sensor materials, device structure, working mechanism, and fabrication process. A majority of research on temperature sensor development for target-specific applications focuses on resistive sensors based on thermocouples and meander-type electrodes.17–21 Researchers try to change the materials of the electrode and their dimensions to achieve the required performance parameters such as wider detection range and higher sensitivity.22–25 The major drawbacks of this design include high processing temperature for fabrication, complex fabrication, low sensitivity, failure on exposure to water, and complicated integration and conformability with 3D-printed and arbitrary structures.26–28 There is a lot of room available to solve these issues and develop sensors that can be seamlessly printed along with the main device or robot body.
Advancement in 3D printing and additive manufacturing has enabled the fabrication of electronic sensing devices that were not possible through conventional methods.29,30 They allow liberty in design and specifications and make it possible to fabricate embedded devices such as sensors, organic light emitting diodes, field effect transistors, and actuators inside a printed 3D structure. 31 A detailed review on 3D-printed sensors has been presented in Ref., 32 which sheds light on the possibilities that this technique possesses in the field of printed electronics and functional device printing. Various printing methods and materials have been used by researchers to fabricate devices such as accelerometers, electrocardiography electrodes, optical sensors, pressure sensors, tactile sensors, displacement sensors, temperature sensors, biosensors, chemosensors, gas sensors, flow sensors, humidity sensors, and antennas. Novel materials possessing properties such as conductivity33,34 and piezoelectric charge, 35 compatible with 3D printing, have been developed to give functionality to the printed structures rather than fabricating nonfunctional 3D models. 36
Graphene and polymers such as polylactic acid (PLA) have been used in the form of composites to synthesize conductive functional materials compatible with 3D printing, but their use has been mostly in applications to make conductive paths and circuit traces.37,38 Commercial conductive filaments based on graphene and PLA composites compatible with fused deposition modeling (FDM) are also available. In this research work, a graphene-based conductive filament has been used to 3D print embedded sensors inside a 3D-printed nonfunctional host structure. The resistance of the graphene-based conductive filament changes with the change in surrounding temperature that makes it ideal for its quantitative measurement. The fabrication approach makes it possible to manufacture functional robots in future for environmental and biomonitoring. These robots will be fabricated in a single-build printing process with embedded printed sensors and electronics. Moreover, the sensing materials are insensitive to water and can be used in rain and under water also.
Materials and Methods
The basic material for the fabrication of the active portion of the sensors was the commercially available conductive filament by BACKMAGIC3D with the diameter of 1.75 mm and volume resistivity of 0.6 Ω-cm. The filament formulation comprises a composite of PLA and graphene nano rods (GNRs), making it electrically conductive. It can be used to print any sort of patterns through FDM with a recommended nozzle diameter of 0.5 mm or higher. Single lines of conductive patterns were printed through FDM with the nozzle temperature of 200°C. Nozzle diameter and printing speeds were adjusted to control the diameter of the printed patterns.
AMMs single-build fabrication setup is a rotatable multihead 3D printer that can be fitted with multiple tool heads for faster fabrication of large, complex parts. The standard system has four print heads. Each head can be loaded with different printable materials. The printing system utilizes a customized software with collaborative multihead 3D printing technology that intelligently distributes tool paths between multiple print heads working in unison on a single printer. The conceptual illustration of the system and fabrication process is shown in Figure 1. The CAD model of basic head design is shown in Figure 1b. Two materials are used to fabricate the 3D printing sensor. Acrylonitrile butadiene styrene (ABS) is used to print the sensor body, and graphene filament is used to print the conductive pattern. Both materials used were in the form of filaments. The graphene patterns with two varying diameters were printed by varying the print head speed and extrusion speed.
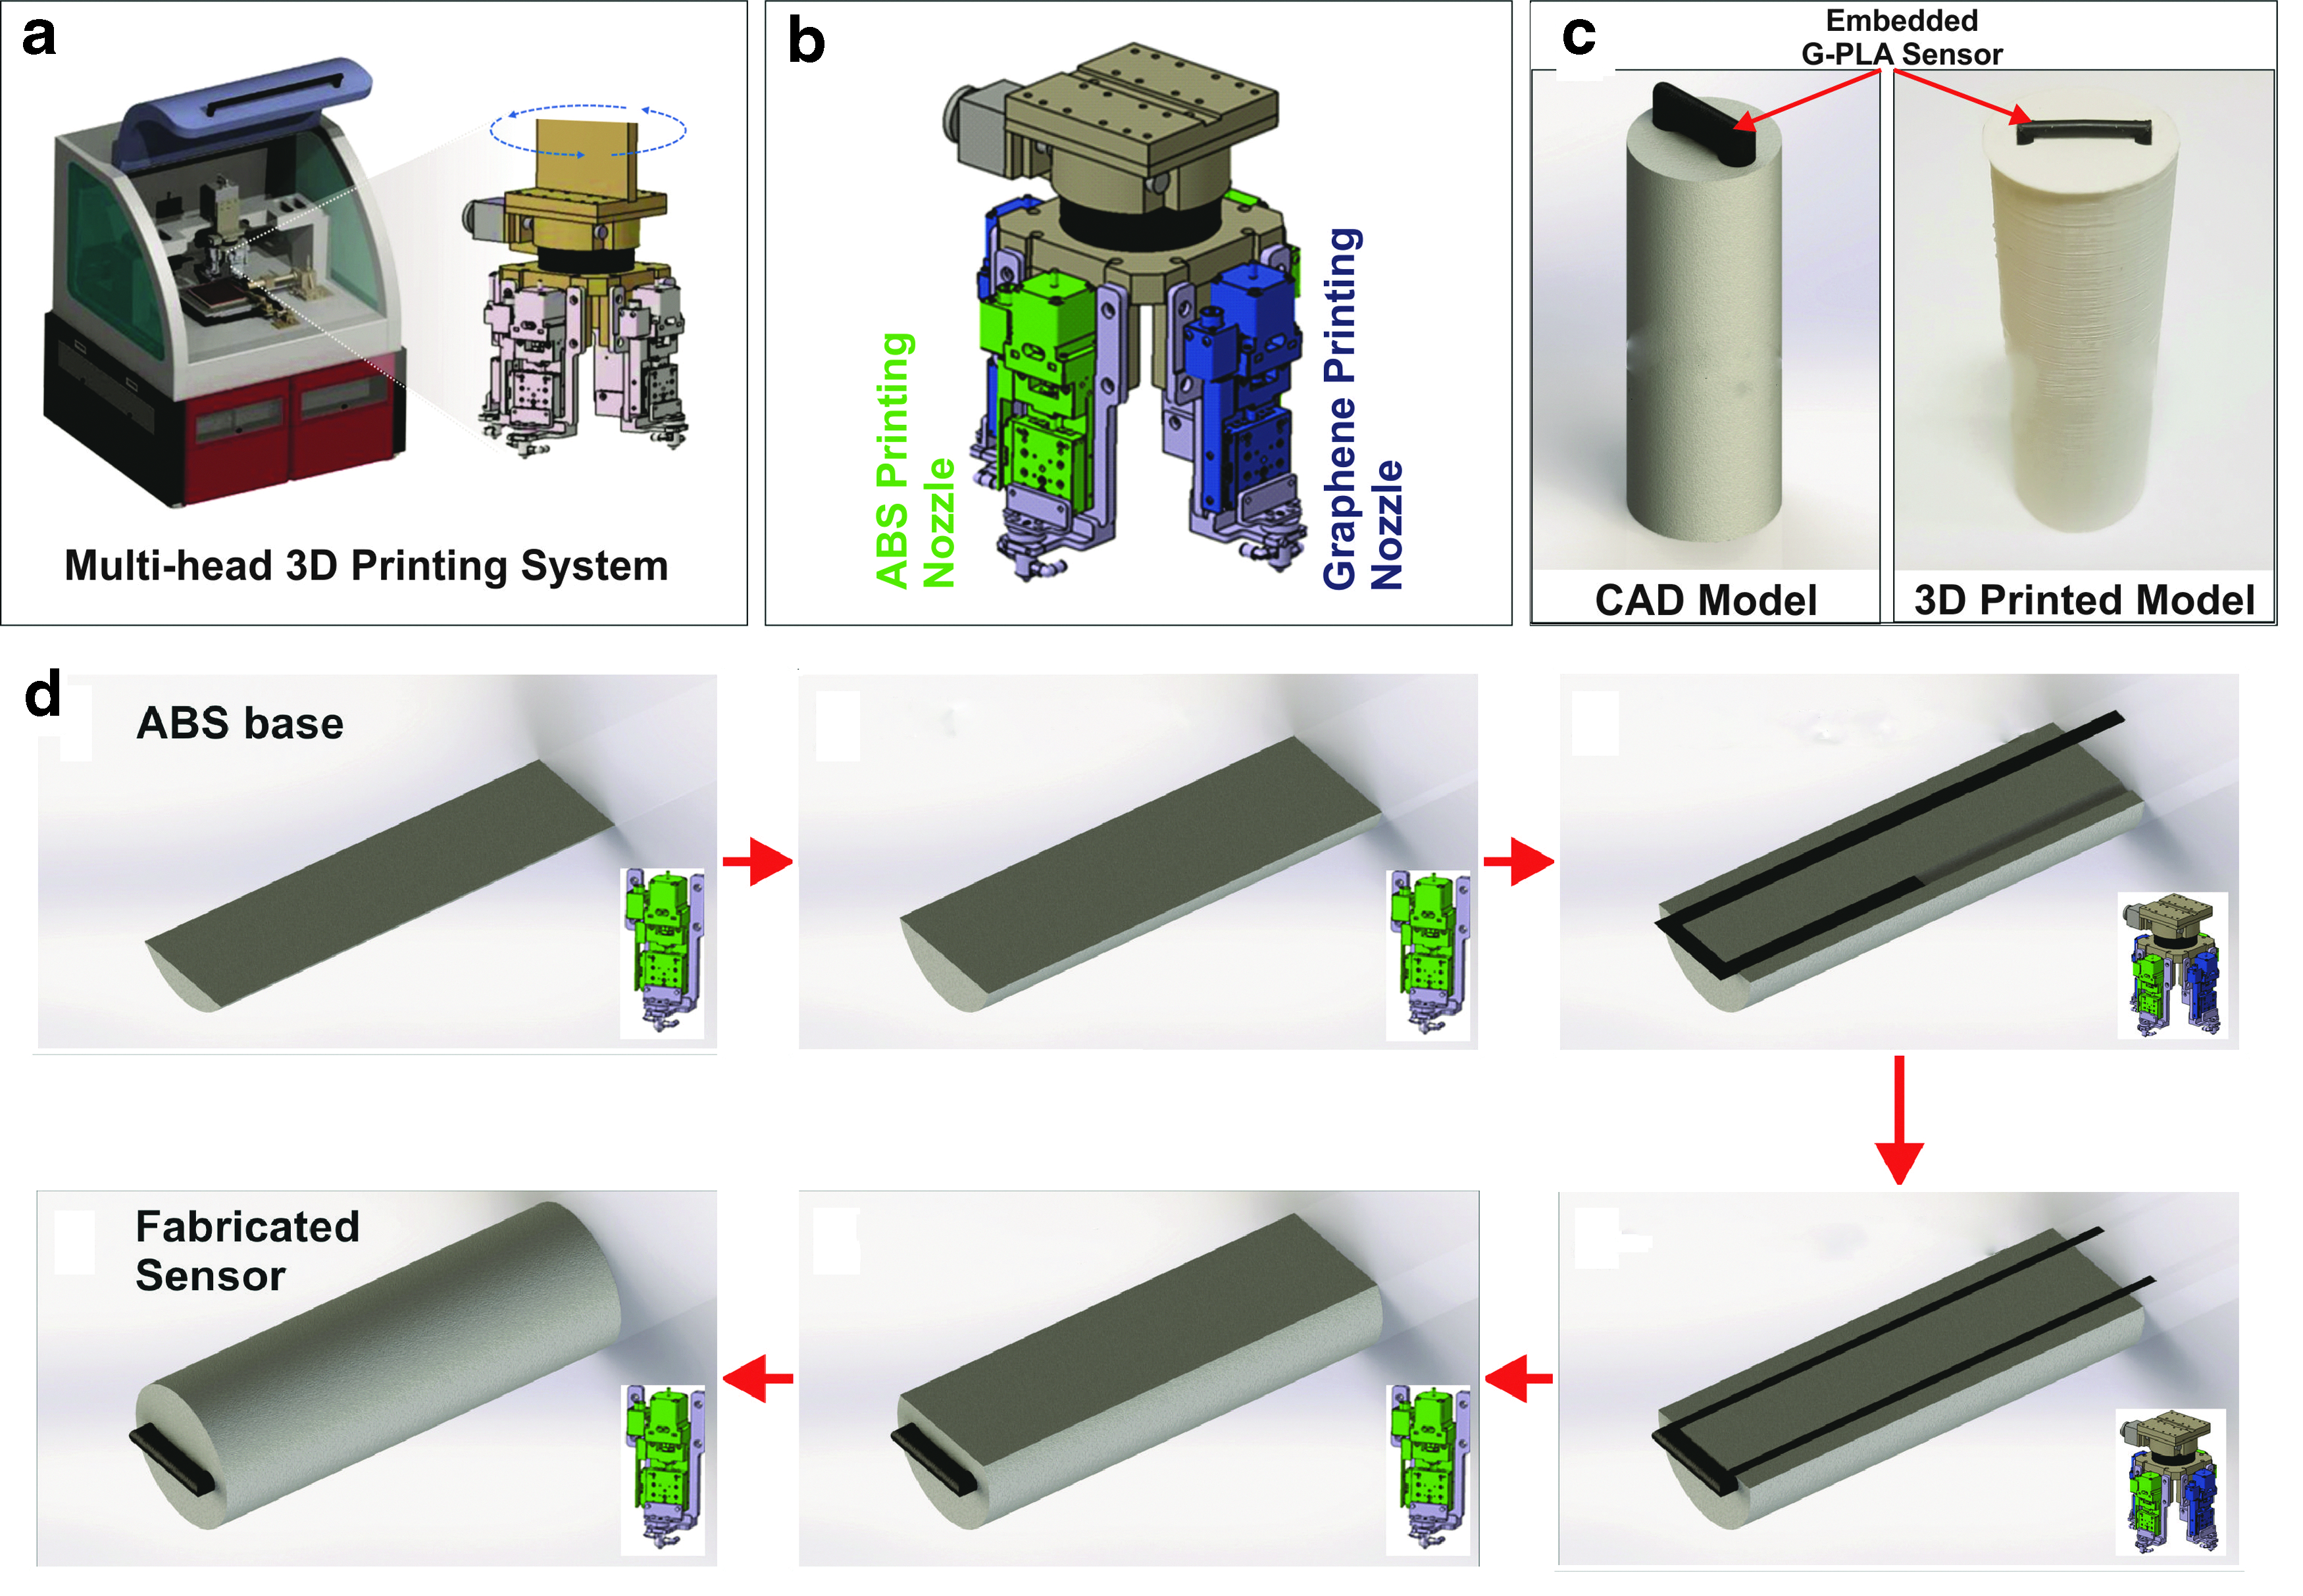
Step by step fabrication process of the embedded 3D-printed sensors
Two heads are used to print the temperature sensor. The green head shown in Figure 1b is used to print the ABS material, and the blue head shown in Figure 1b is used to print the graphene filament. First, the ABS base is 3D printed using green head till 45% height. In the second stage, the head rotation alignment is performed and in the third stage, both green and blue heads print ABS and graphene after one another. The fourth stage is the completion of graphene pattern printing inside the ABS body. The head rotation is performed again to normalize the dual print head mode. In the fifth step, the ABS is printed again using the green head, and the final sensor is ready in a circular chamber in the sixth step. The final printed sensor and CAD model are shown in Figure 1c, while the detailed step-by-step fabrication process is presented in Figure 1d.
Stand-alone patterns were fabricated with varying lengths and widths to investigate the effect of pattern dimensions on their intrinsic resistance. Fixed lengths of the patterns were exposed outside the ABS host body to the environment of the test chamber. As ABS is an insulating plastic, it makes sure that there is no effect of the remaining portion on the readings that is meant for making connections to the readout circuit. This method can be used in future in the development of all printed environmental monitoring robots with embedded sensors, fabricated through a single-build process.
After the fabrication of embedded sensing devices, the temperature dependence of the pattern resistance was investigated and recorded. The electrical characterizations were performed using an in-house developed setup to record the data of the sensors automatically. A water-resistant commercial temperature sensor (LM35: sensitivity 10 mV/°C, range up to 125°C) was used as the reference temperature sensor interfaced with Arduino microcontroller for real-time data plotting and logging into a computer. The fabricated sensors were connected with the built-in ADC of Arduino in a potential divider configuration with a comparable fixed reference resistance. The value of fixed resistance was 3 kΩ for the patterns with length of 4 mm and was 4 kΩ for the patterns with lengths of 6 and 7 mm. For measurements in dry environment, both sensors were placed on a hot plate and the temperature was slowly increased from 20°C to 70°C, while the data of reference temperature and fabricated sensor's resistance were continuously plotted on a computer. For decreasing the temperature, the hot plate was shifted onto ice packs and the data were recorded. Readings at 0°C were taken by placing the sensors directly on plastic ice packs. Multiple readings were recorded for each device for data validation. The data for aquatic environment were recorded by physically shifting the sensors between five different water beakers having known temperatures. Settling time was provided for the readings to become stable and the resistance was recorded. Response and recovery times were also recorded by quickly shifting the sensors between two liquids at different temperatures.
Results and Discussion
The morphological and chemical characteristics of the conductive filament were investigated using field emission surface electron microscopy (FE-SEM) and Raman spectroscopy. FE-SEM images presented in Figure 2 show the microscopic structure of the material. The first two images present the morphology of the filament surface and the filament cross section before printing. Graphene nanowires (GNWs) can be seen embedded inside the polymer matrix in random directions. 39 Cracks and di-oriented graphene ribbons can also be seen in the broken cross section of the filament before printing. Figure 2c presents the surface images of the conductive pattern after printing, which shows a little degree of alignment happening between the GNRs and polymer threads after passing through the heated extruder and also the formation of some cracks in the polymer matrix. The overall structure remains similar to that of initial one before printing. Figure 2d shows the cross-sectional image of the filament after printing that shows the disappearance of cracks due to melting of the polymer. It also shows some embedded graphene ribbons that seem to have been a bit aligned after printing as verified by the surface morphology of printed filament.
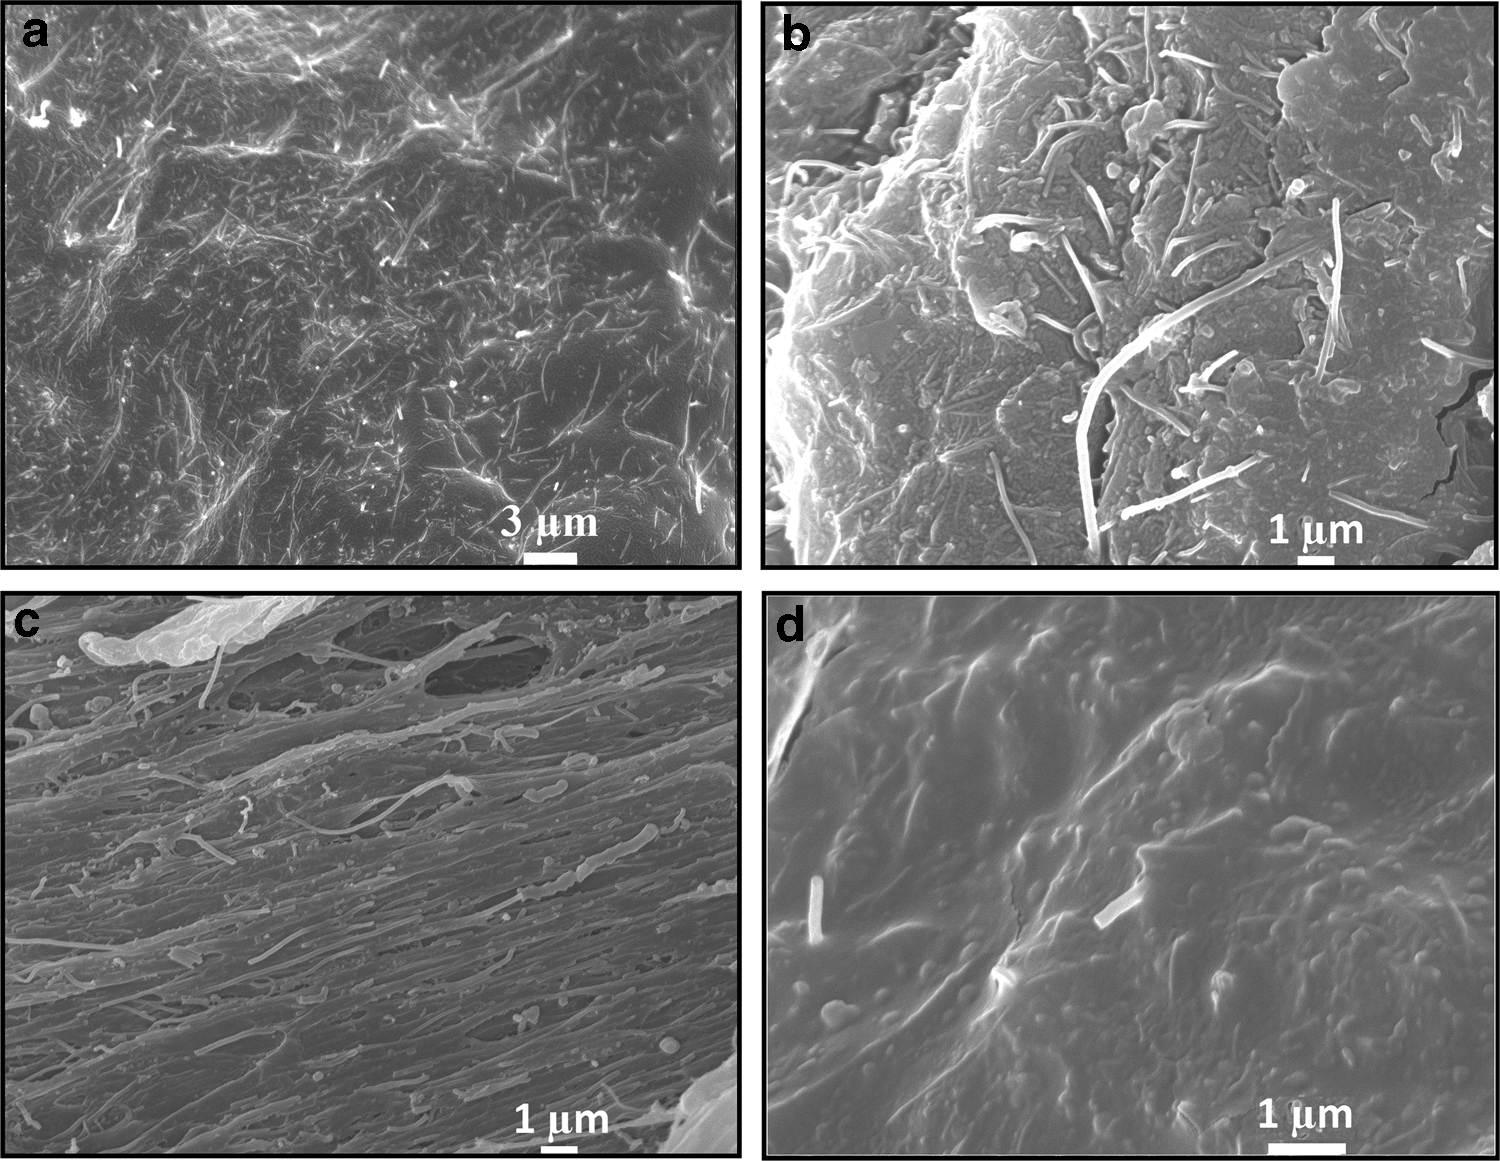
FE-SEM images showing morphology at different magnifications of
The chemical composition of the material was investigated by using Raman spectroscopy to confirm that the provided information is correct and ascertain the reproducibility of the work. Raman spectroscopy results are presented in Figure 3. The results show three very significant signature peaks of graphene at 2689 cm−1 (2D), 1575 cm−1 (G), and 1350 cm−1 (D).16,10,40,41 The difference in Raman spectroscopy data for the identification between graphene flakes, multi-walled carbon nano tubes (MWCNTs), and graphene ribbons lies in the intensity of the D band. 42 The intensity of D band in the case of MWCNTs is lower compared with the G and 2D bands, while in the case of graphene nanoribbons, the intensity of all the three signature bands is almost comparable.39,43 This confirms the presence of graphene in the form of nanoribbons in the composite that is ideal for high conductivity and strength for 3D printing applications. The other peaks in the spectrum correspond to different functional groups and bonds present in PLA. 44 The peaks are labeled in the figure that verifies the presence of PLA as the polymer matrix in the filament materials.45–47 The microscopic image of the filament is also presented in the inset of Figure 3, which shows that there is no burning of the material on exposure to the high-power laser of the spectroscopy equipment.

Raman spectroscopy data of the GNR-PLA 3D printing conductive filament showing the chemical structures and the different signature peaks of the two materials present in the composite. GNR-PLA, graphene nano rods-polylactic acid. Color images available online at www.liebertpub.com/3dp
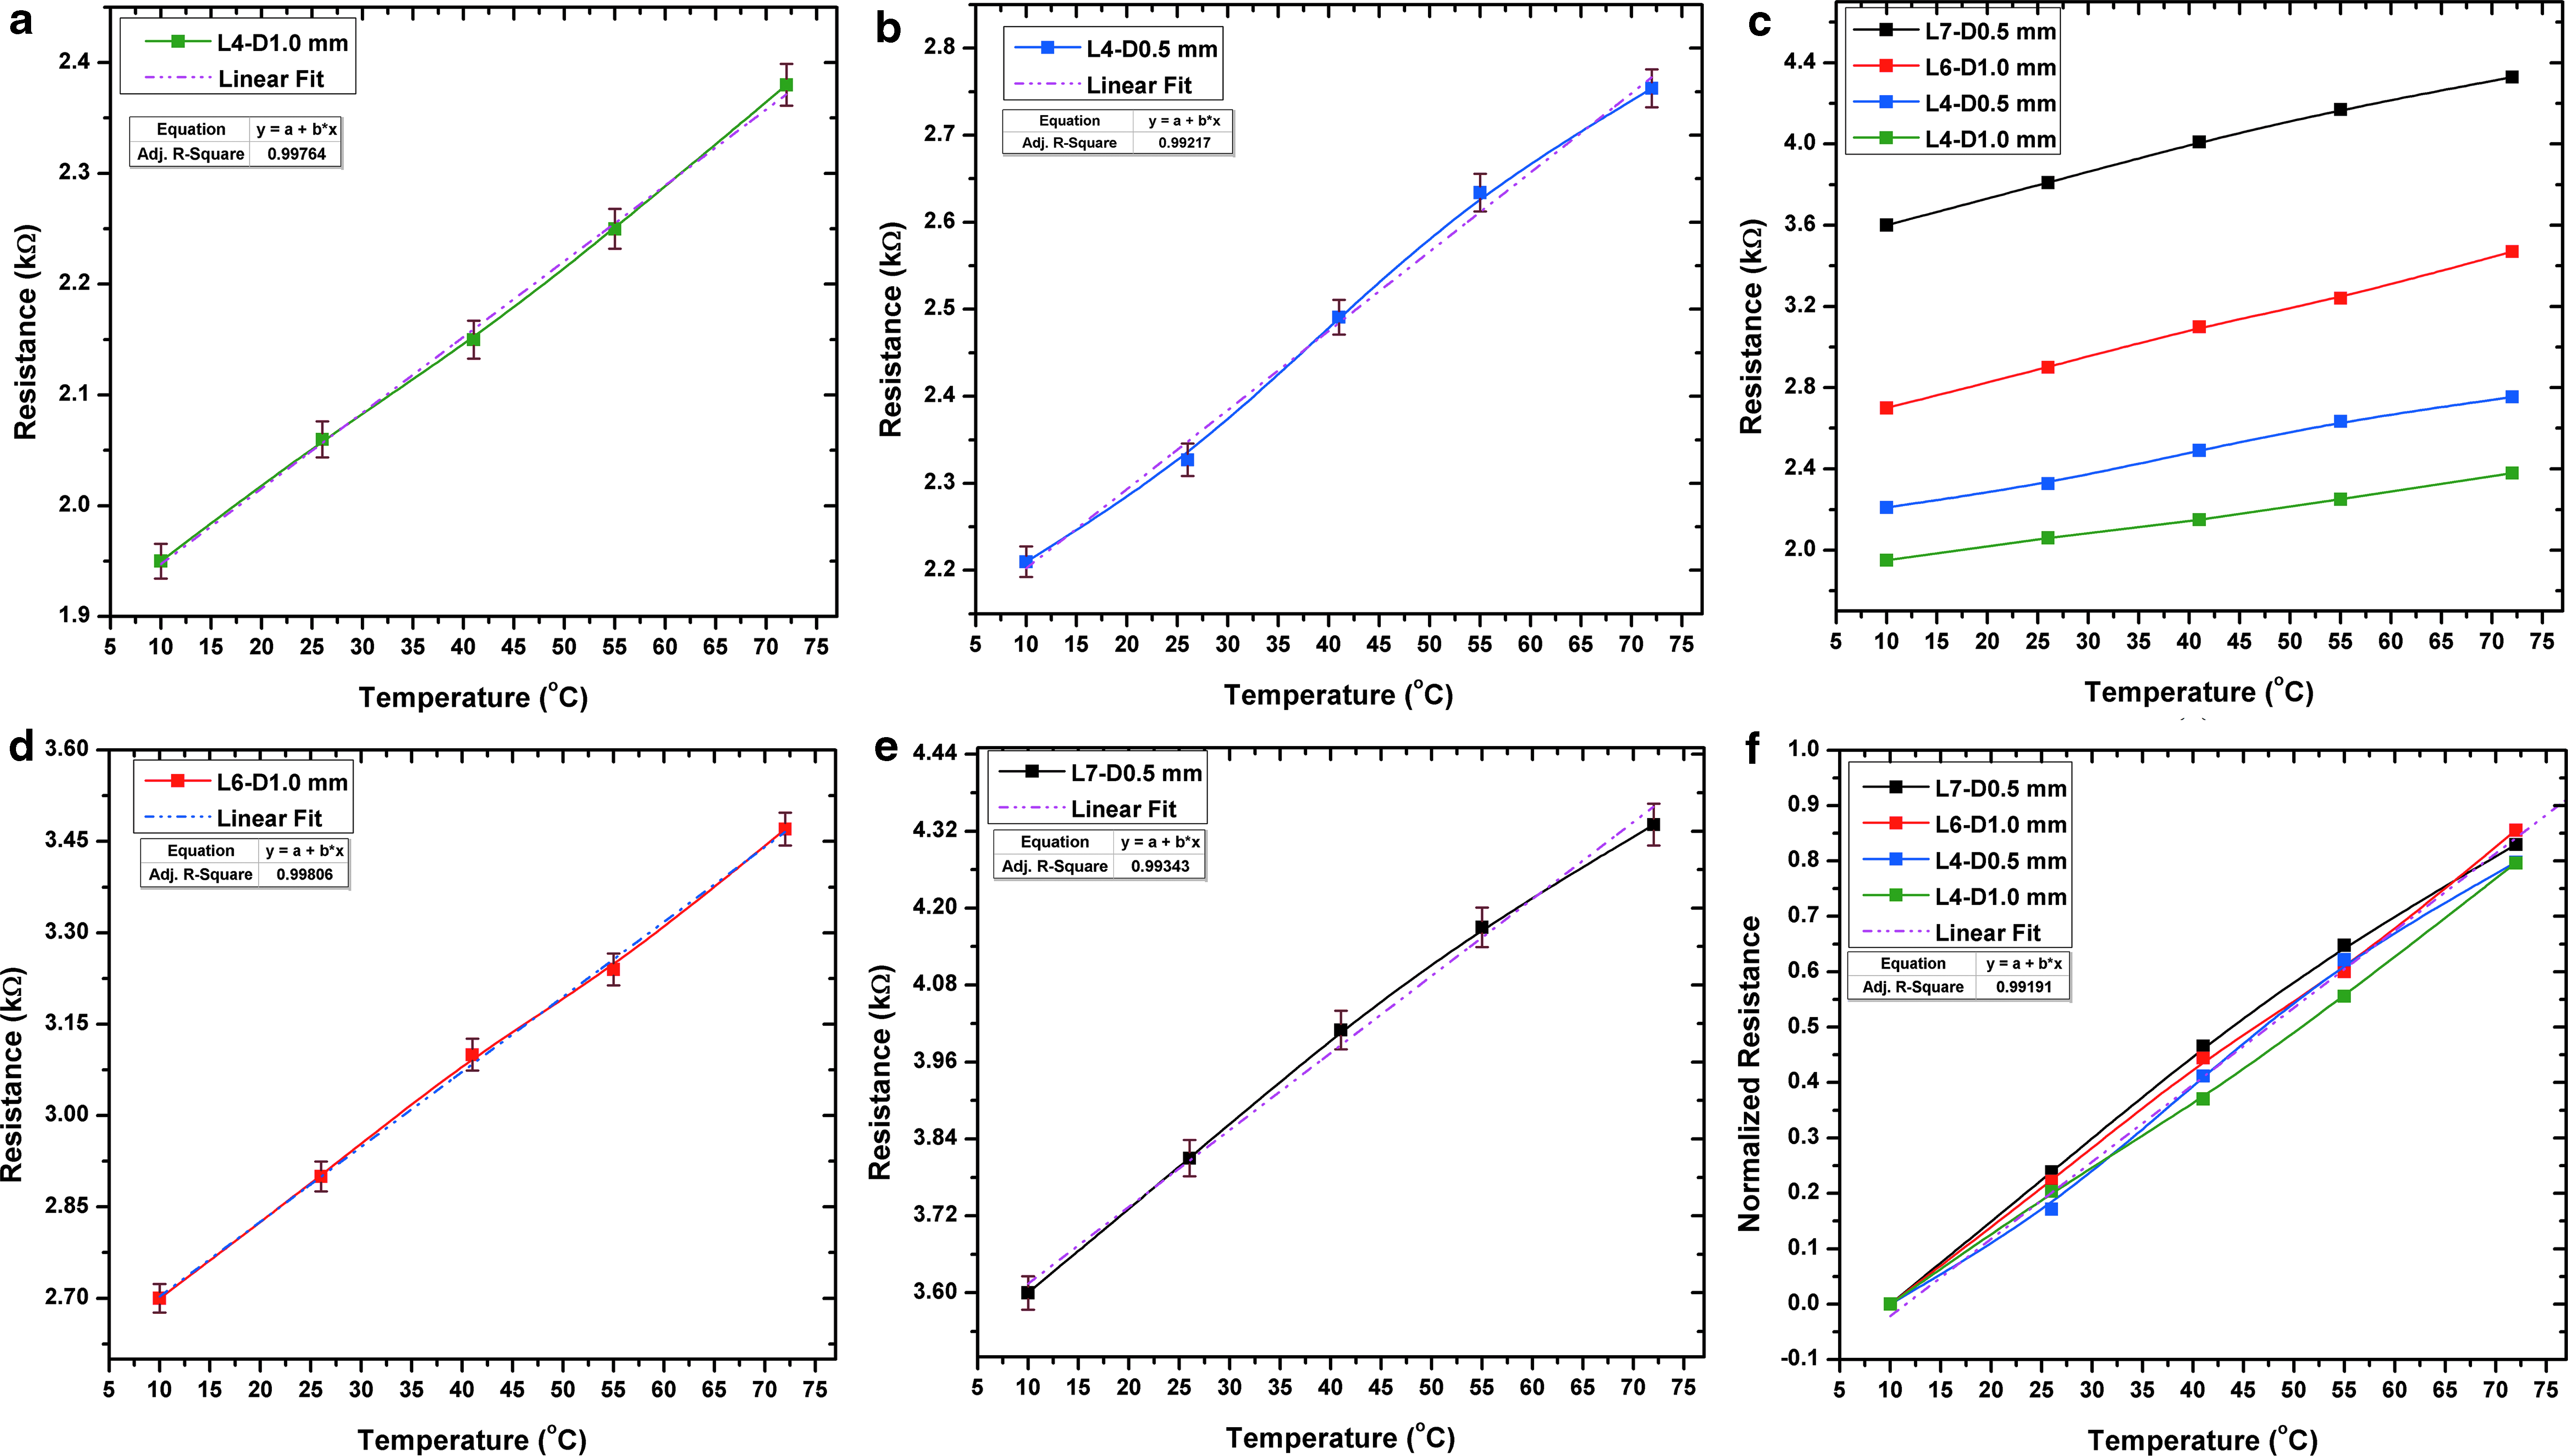
The results of the electrical characterizations of the sensors are presented in Figure 4. Four sensors with different dimensions were printed to investigate the effect of length and cross-sectional diameter on their sensing performance. Three sets of readings were taken for each sensing device to verify the repeatability and statistical significance of the data. Error bars are included on each point that indicates standard deviation of the readings. The magnitude of error bars indicates little error that is acceptable for the sensors in research. They also indicate that the readings of the sensors remain consistent and in the same range for repeated test cycles. The resistance of two sensors with an active region length of 4 mm and diameters of 1 and 0.5 mm lies between 2 and 3 kΩ approximately, while of those with lengths of 6 and 7 mm lies between 3 and 4 kΩ approximately. All sensors have approximately equal lengths of printed connector lines. As can be deduced from the results presented in Figure 4e, the major factor affecting the intrinsic/base resistance of the sensors is the length of the active region that is inversely proportional to the resistance. The diameter of the patterns has a direct relationship with the sensors on the contrary. The sensor with the smallest diameter and the longest pattern has the highest resistance, while the one with biggest diameter and shortest length has the lowest. Higher basic resistance results in higher sensitivity and vice versa. Absolute sensitivity per unit change of a linear sensor is the slope of the data and can be calculated using Equation (1).
48
The maximum recorded sensitivity for the fabricated sensors was ∼13 Ω/°C, while the minimum sensitivity was ∼7.2 Ω/°C.
Resistive response of the sensors under water showing
One can clearly note by looking at the curves that the overall resistance of all the devices increases linearly with increasing temperature. Irrespective of the magnitude of change, the normalized curves presented in Figure 4f show that all sensors have a similar response to the change in temperature. The results also show that if we keep increasing the length and decreasing the diameter, the curves slowly shifts from below the ideal linear line to above. A summary of the results is presented in Table 1 showing the effect of sensor dimensions on the output characteristics. The best results can be obtained by optimization of pattern length and diameter. The working principle of the sensors is based on physical changes in morphology of the polymer matrix holding the conductive graphene nanorods. On heating, the matrix expands and the conductivity reduces due to drop in the active contacts. 49 On cooling, the material returns to its hard state and the contact is restored to its intrinsic form. As the polymer matrix is based on PLA, the maximum operation temperature of the devices is limited up to 70°C beyond which there is a permanent deformation and the resistance does not return to its original value. As the glass transition temperature of PLA is near 58°C, the recommended operation temperature ranges up to and below 60°C to get the most stable results with low hysteresis.50,51 The operating temperature does not have any lower limit that makes the overall range well suitable for terrestrial and under water basic environmental and weather monitoring.
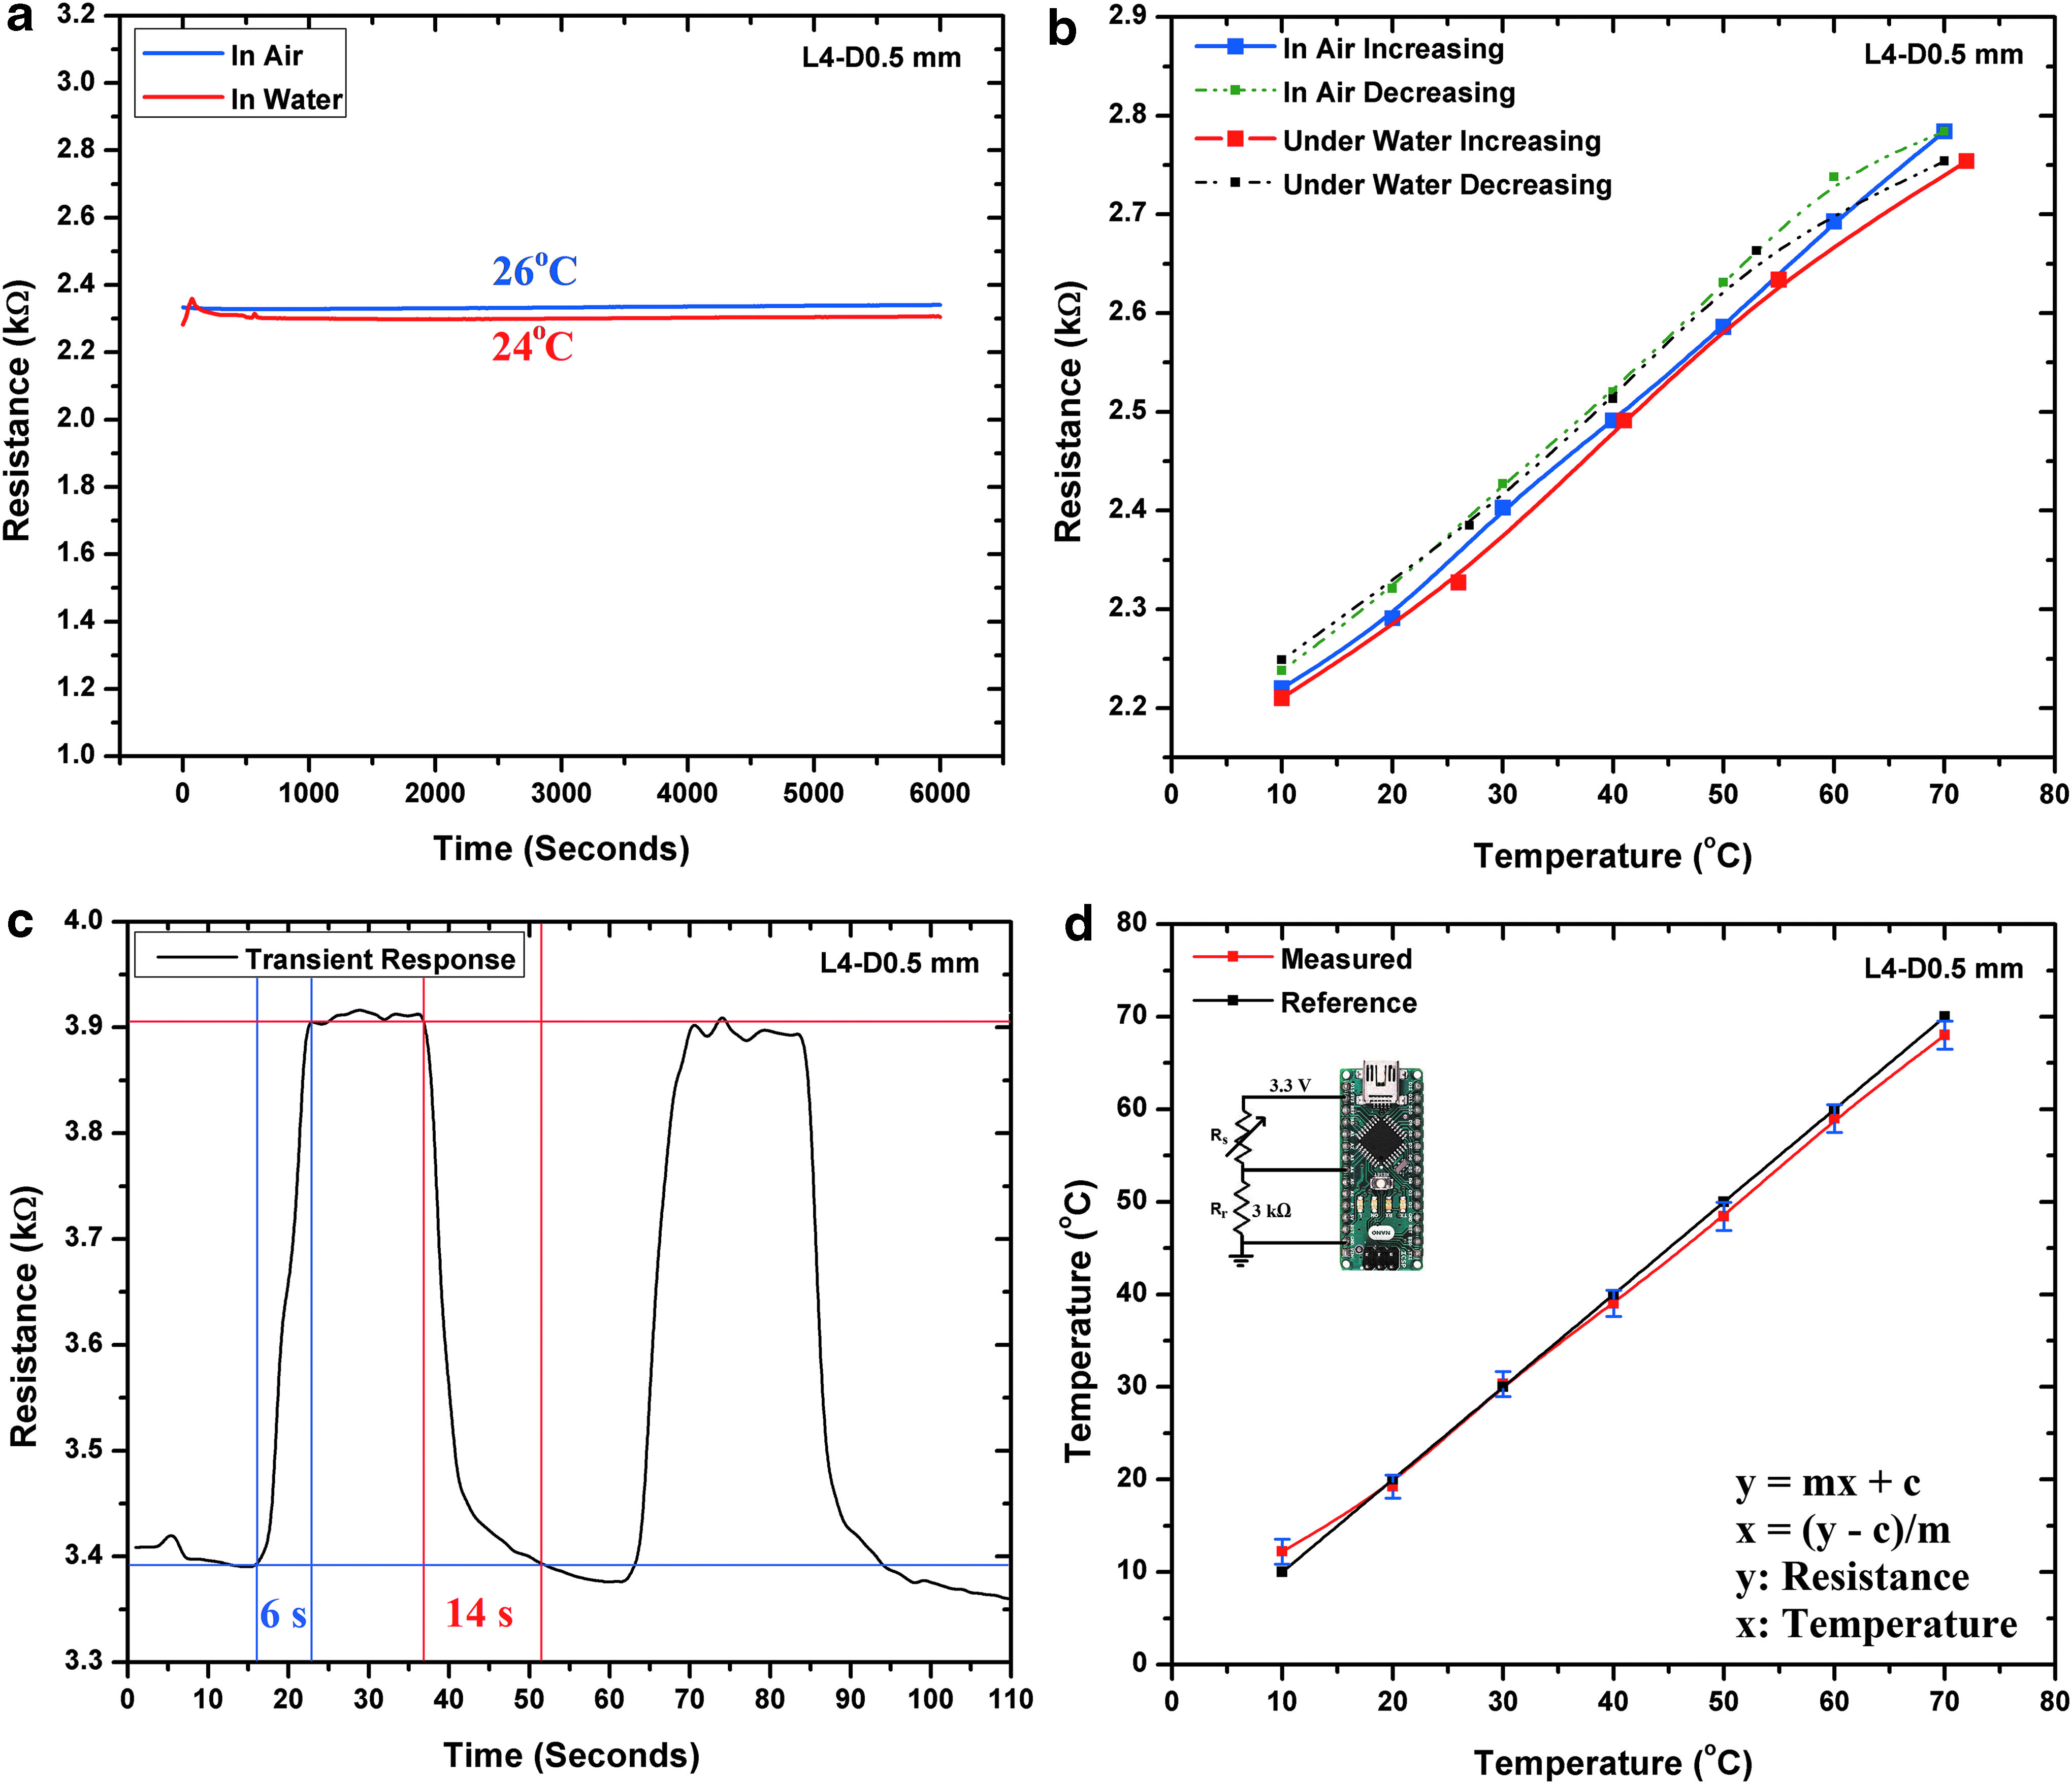
The device with length of 4 mm and diameter of 0.5 mm was used to test the stability and transient response of the sensors. The resistance of this particular device changes from around 2 to 3 kΩ. The stability data of the sensors for a continuous 100-min operation, presented in Figure 5a, show that the output of the sensors remains stable and is free of any noise and uncertainty. The hysteresis in the sensor readings was recorded and the results are presented in Figure 5b. The average percentage hysteresis was calculated using Equation (2)
52
and was found to be 5.43%. In this equation, “n” is the number of samples, “yk” is the measured value of the resistance and any given point, and “ymax” and “ymin” are the maximum and minimum values of resistance, respectively. The results show that the sensors have an acceptable level of small hysteresis that does not have a significant impact on the accuracy and is comparable to the high-performance devices developed previously.
Performance evaluation of the device showing
The transient response of the sensors presented in Figure 5c shows that the response time of the sensors to change their value from 10% to 90% of the maximum for 0°C to 50°C was 6 s, while the recovery time back to initial value was 16 s. Both these values are comparable to the high-performance sensors presented in the literature.
The fabricated sensors were connected in a potential divider configuration to an ADC input of an Arduino-based microcontroller circuit that converts the digital data first to voltage, then to the resistance of the sensors, and finally to temperature. Equation (3) was used to convert the resistive response of the particular sensor into temperature output. Here “D” represents the digital data output of the ADC, “Rref” represents the reference resistance, “m” shows the slope, and “c” represents the intercept. The fixed reference resistance used in the circuit was 3 kΩ, whereas the slope was ∼10 and the intercept was calculated to be ∼2100.
Figure 5d shows the curves of sensor's output in terms of temperature after solving the linear fit calibration curve equation in the microcontroller and converting the values of resistance into temperature. The response of the sensor was recorded and plotted against a commercial reference sensor for comparison and the results show highly stable and accurate operation of the device in real-life temperature measurement. A detailed comparison of the developed sensors with similar and well-recognized works in literature is presented in Table 2. The table covers the summary of all major performance parameters to evaluate the quality of the sensors and also includes the device structure, materials, and working principles. Information on similar commercial sensors is also included to give a better idea about the performance requirements of application-specific sensors in this category.
FET, field effect transistor; GNR+PLA, graphene nano rods+polylactic acid; GNW, graphene nano wires; RGO, reduced graphene oxide; CNTs, carbon nanotubes; HSMG, high strength metallurgical graphene.
The table indicates that the current sensor competed with the best of the sensors previously reported for the same applications. The sensor has better sensitivity than most of the previously reported devices, while the transient response is also among the best. The sensor can be operated in both dry and wet conditions, a better characteristic than most of the competitors. The limitations, however, are the smaller detection range and possibly less accuracy when compared to the commercial devices.
Conclusions
An all-3D-printed temperature sensor has been developed in this work aimed at environmental and weather monitoring for compatibility with both dry and wet conditions. The sensors have a high sensitivity (12 Ω/°C), quick transient response (6 and 14 s), low hysteresis (∼5.3%), linear output curve, and high accuracy for the ideal operating temperature range from 0°C to 60°C. The materials used in this work are commercially available for use in FDM-based conventional 3D printers and no separate system or material development is required. Sensors operate on the principle of increase in resistance with increasing temperature based on the physical expansion of the polymer matrix holding the conductive nanoribbons. The sensors show highly stable and linear responses toward change in temperature of the environment. The sensors can be included as a part in the multimaterial 3D CAD model of devices such as 3D-printed robots or their parts, and can be directly printed into the structure of the final device. This gives researchers room for embedding the sensing devices inside the bigger structures without any additional steps. This also opens up an opportunity for researchers to fabricate functional robotic devices for environmental and biomonitoring applications in future.
Footnotes
Acknowledgment
This work was supported by the Ministry of Trade, Industry & Energy (MI, Korea) under Industrial Technology Innovation program, No. 10079424, “Development of 3D multilayer-based organ on a chip platform as alternatives to animal testing.”
Author Disclosure Statement
No competing financial interests exist.