
Abstract
Abstract
Direct ink writing (DIW) is an additive manufacturing technology that has been widely used in many fields, including soft electronics, ceramic structures, and flexible biomedical applications. In DIW process, writing a trace with desired geometry is of fundamental importance to fabricate a three-dimensional model. In this article, a normalized geometry modeling method with bulge-free analysis for process planning in DIW is presented. The geometry prediction model is developed by converting conventional dispensing parameters to a dimensionless variable, speed ratio v*. The developed model is independent of tip gauge and feeding mechanism. To address the common bulge issue in DIW of low-viscosity fluids, the critical bulge-free printing range has been identified by characterizing the bulge formation process. The developed geometry prediction model and the identified bulge-free printing range are validated by experimental data of several different tips and inks. Finally, a DIW process planning method based on the developed geometry prediction model is demonstrated.
Introduction
Direct ink writing (DIW) is an additive manufacturing technique that was first invented for fabricating three-dimensional (3D) ceramic structures. 1 A wide variety of applications from flexible electronic fabrication to soft functional tissue printing have been demonstrated during the past 20 years.2–18 Compared with other additive manufacturing techniques such as fused deposition modeling and stereolithography, DIW widens the printable material range and achieves a higher manufacturing flexibility, especially in soft matter fabrication. 19 Conductive inks have been used to directly write stretchable and free-standing electronics, which is more environmentally friendly. Soft biological tissue implants and microscale patterns have also been successfully written in some medical applications. In the future, humans will benefit a lower risk in surgeries by using compatible artificial organs made by DIW technique.20,21
However, modeling the printed geometry is a grand challenge, because of the tip dependence and large variations in DIW systems such as ink properties (Newtonian or non-Newtonian fluids), syringe feeding mechanism (pneumatic or mechanical), substrate wetting properties, and tip gauges. Mainly, the current modeling methods for printed geometry prediction of extrusion-based additive manufacturing can be classified into three categories: (1) models originated directly from experimentation. For instance, Boley et al. have developed a printed trace geometry relationship for gallium–indium alloys. 22 This type of model is highly accurate and reliable, but it can only be applied to specific materials and substrates. (2) Models based on complicated physics analysis. An example is the generalized dispensing model developed by Zhao et al. 23 Although this type of model is not limited to a specific material, these models usually have some parameters that are difficult to be characterized in a DIW system. (3) Models derived from application-orientated variables. For example, Deng et al. have developed a computational conductivity estimation model for 3D-printed circuits. 24 Those models are very useful for the specific applications under certain conditions, because they are not developed for general DIW process. Hence, the downside is that those models are limited by the conditions used for developing them.
In addition, the printing stability is another long-term concern in extrusion-based additive manufacturing. It has been known that a line of liquid on a flat homogeneous substrate can form bulges, depending on the boundary conditions of the moving contact line. The unpredictable bulges significantly affect the printing quality. Early theoretical research on bulge formation was conducted by Davis and Sekimoto et al.25,26 A related experimental validation was later demonstrated by Schiaffino and Sonin. 27 However, the stability analysis given by Davis does not involve additive manufacturing-related process parameters. It is hence very difficult to be directly applied to DIW. Whereas the methods given by Duineveld and Stringer and Derby might be more appropriate for additive manufacturing.28,29 Duineveld has studied the stability of inkjet-printed trace of liquid with zero receding contact angle. Duineveld found that the line can form bulges when the contact angle of the liquid with the substrate is larger than the advancing contact angle. However, this condition is not a sufficient condition. From Duineveld's work, Stringer and Derby have further developed the stability boundaries, presented in graphical forms, to define a region of stability in an appropriate parameter space. However, for DIW applications, the bulge-free printing analysis is challenging, not only because of dramatic ink variations such as viscosity, surface tension, and contact angle but also due to the continuous printing mechanism rather than discrete droplets forming in inkjet printing. To authors' best knowledge, no study has been reported about the bulge-free printing conditions in the DIW process.
In this study, we introduced a normalized method for modeling the geometry of printed trace in DIW. The normalized model converts conventional dispensing parameters to a dimensionless variable, speed ratio v*. Our model offers two key advantages over the conventional methods. First, the normalized geometry model is applicable to any printable fluid and independent of the tip gauge. Second, parameters in our model are facile to be characterized. We also developed a method for identifying the stability boundary for bulge-free printing in DIW. The developed models could be applied to DIW process planning. The DIW process planning involving multiple tip gauges and different inks is presented in this article, using the developed trace geometry prediction model and the identified bulge-free printing stability boundary. Conclusions are given at the end of this article.
Methods
Normalized trace geometry prediction model
A DIW system is illustrated in Figure 1a, the main component in DIW system is the dispensing portion as shown in Figure 1b. In DIW, a 3D object is built by drawing two-dimensional slices line by line and then accumulating layers up to form the designed 3D geometry. Hence, the extruded trace is the building element that directly affects the printing resolution, accuracy, and speed. For a printed trace cross section, due to extremely small bond number, the influence of gravity is negligible compared with the surface tension.
28
Hence, the cross section can be described as a truncated circle with a width W, a height H, and a contact angle θ, as demonstrated in Figure 1c. The extruded ink volume

General DIW system.
where QA is the applied flow rate of the ink. The printed trace length in the time interval
where v is the substrate speed. Assuming no change in fluid density throughout the syringe and tip, the printed trace cross-sectional area A can be calculated by the following:
Stringer and Derby have derived a geometry prediction model for inkjet printing
29
:
where WInkjet is the predicted width of an ink-jetted trace, d0 is the initial droplet diameter, p is the droplet spacing, and
The predicted height of DIW-printed trace H could be further calculated by simple cross-sectional analysis:
The printed trace geometry is directly affected by the tip inner diameter. Hence, to develop a model independent of the tip size, we normalized the width W and the height H by dividing them by the tip inner diameter ID. In addition, we defined a dimensionless variable, speed ratio v*, as the ratio of the speed of the fluids exiting the tip to the substrate moving speed v:
As shown in Equation (7), the speed ratio v* replaces conventional dispensing parameters, including applied flow rate QA, substrate speed v, and tip inner diameter ID. By rearranging Equations (5) and (6) using v*, W/ID, and H/ID, the normalized geometry prediction model of DIW can be obtained:
Basically, they are functions of the speed ratio v* and the ink equilibrium contact angle
Bulge-free printing range identification
In extrusion-based additive manufacturing, bulges formed in printed traces are a common issue that greatly affects the printing quality and stability. Such bulges result in noticeable geometry defects, as shown in Figure 2a. To understand the formation of a bulge, Duineveld mainly considers two types of flow rates within a printed trace, applied flow rate QA and transported flow rate QT.
28
The transported flow rate QT is caused by the internal pressure difference ΔP. This pressure difference is generated from variations of contact angles at two separate locations. For example, as shown in Figure 2b, suppose the printing direction is from point P1 to point P2, and the contact angles at P1 and P2 are denoted as
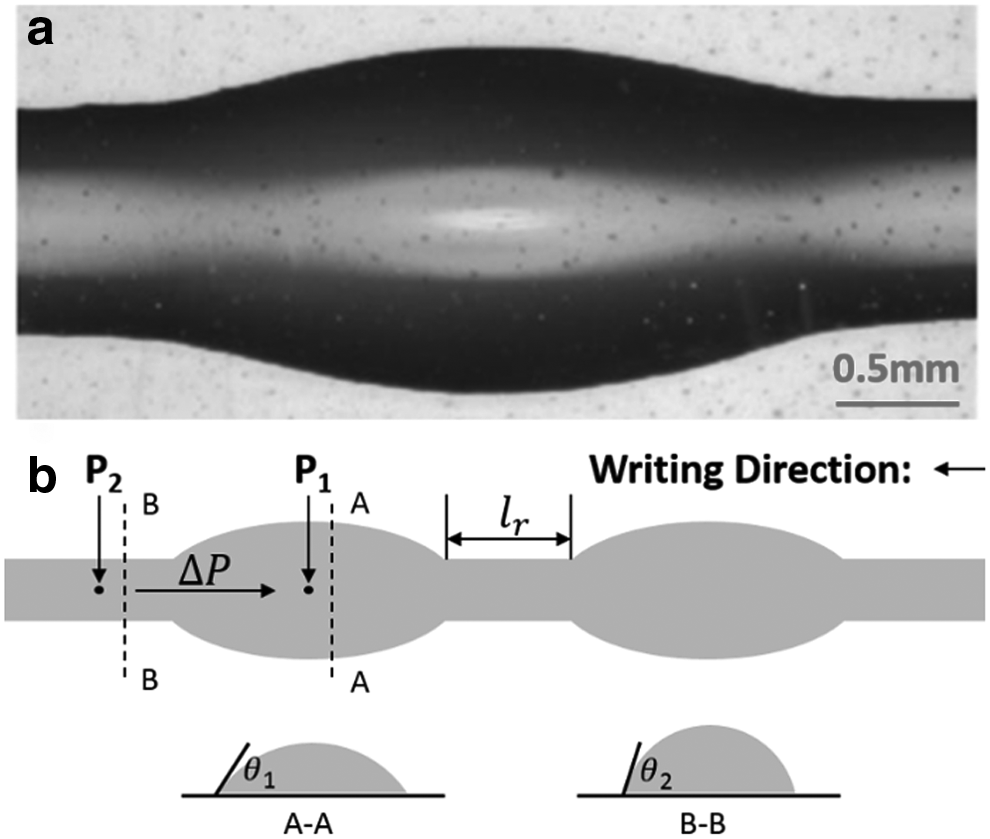
Analysis of bulges.
where K is a nonzero constant that can be characterized experimentally. The transported flow rate is given by Duineveld's work:
where S is the cross-sectional coefficient,
The pressure in a printed trace, P, with width W and contact angle θ can be written as follows:
To get the upper bound of the internal pressure difference,
where
As shown in Equation (15), the critical substrate moving speed for bulge-free printing is a function of material viscosity, surface tension, equilibrium contact angle, advancing contact angle, and the applied flow rate. It should be noted that K is a constant independent of the tip gauge and the applied flow rate. It only depends on the material and the substrate. Hence, the constant K could be first characterized with experimental data of a specific tip, and then, the critical substrate speed for other tips could be computed with the characterized K, using Equation (15).
By substituting Equation (7) to (15), the critical speed ratio for bulge-free printing is further obtained:
Similarly, the critical speed ratio for bulge-free printing is a function of material properties, applied flow rate, and tip size. In a normalized trace geometry prediction model, the speed ratio is significant, not only because it converts conventional dispensing parameters into itself but also it makes the tip size independent of the trace prediction model. Herein, the geometry predicted by the normalized trace geometry model under a certain speed ratio can be further verified for bulge-free trace features using Equation (16). Another application of the obtained critical speed ratio is to identify the suitable range of dispensing process parameters such as the applied flow rate and the tip gauge. Such process parameters could be adjusted accordingly to minimize the bulge formation.
Experimental Section
Ink preparation
Polyvinyl alcohol is widely used as an ink for printing soft electrolyte, and polyimide substrate is widely used as a flexible substrate in flexible electronic printing.30–32 To test the geometry prediction models and stability boundary developed in this article, we prepared two inks, polyvinyl alcohol compound I (PVA-I) and polyvinyl alcohol compound II (PVA-II). PVA-I was prepared by adding 6 g PVA powder (Mowiol® 18–88; Sigma-Aldrich, mol. wt. ∼130,000) and 12 g lithium chloride powder (>99.0%; Sigma-Aldrich) to 40 mL deionized water, followed by mixing in a mixer (AR-100; Thinky) for 10 min at 2000 rpm, and storing at room temperature. The ink was prepared by loading the solution in a 10 cc syringe barrel (Nordson EFD, RI) and centrifuged at 3000 rpm for 5 min to degas. The barrel was fitted with various stainless steel tips with inner diameters ranging from 0.10 to 0.41 mm. PVA-II was prepared by diluting PVA-I using deionized water with a 1:2 dilution ratio. After dilution, the mixture was then mixed for 10 min at 2000 rpm and centrifuged at 3000 rpm for 5 min to degas. In addition to PVA-I and PVA-II, a flexible resin (FR) FLGR02 (Formlabs, MA) is also tested. FLGR02 is an elastomer that allows for bendable or compressible parts. After being fully solidified, it can achieve 80% elongation, 7.7–8.5 MPa tensile strength, and 80–85A hardness. In the following discussion, to validate that the normalized geometry prediction model is applicable to both Newtonian and non-Newtonian fluids, FR and PVA-I were tested. To validate the identified bulge-free stability boundary, we tested PVA-II, which is more likely to form a bulge due to its relatively low viscosity.
Ink characterization
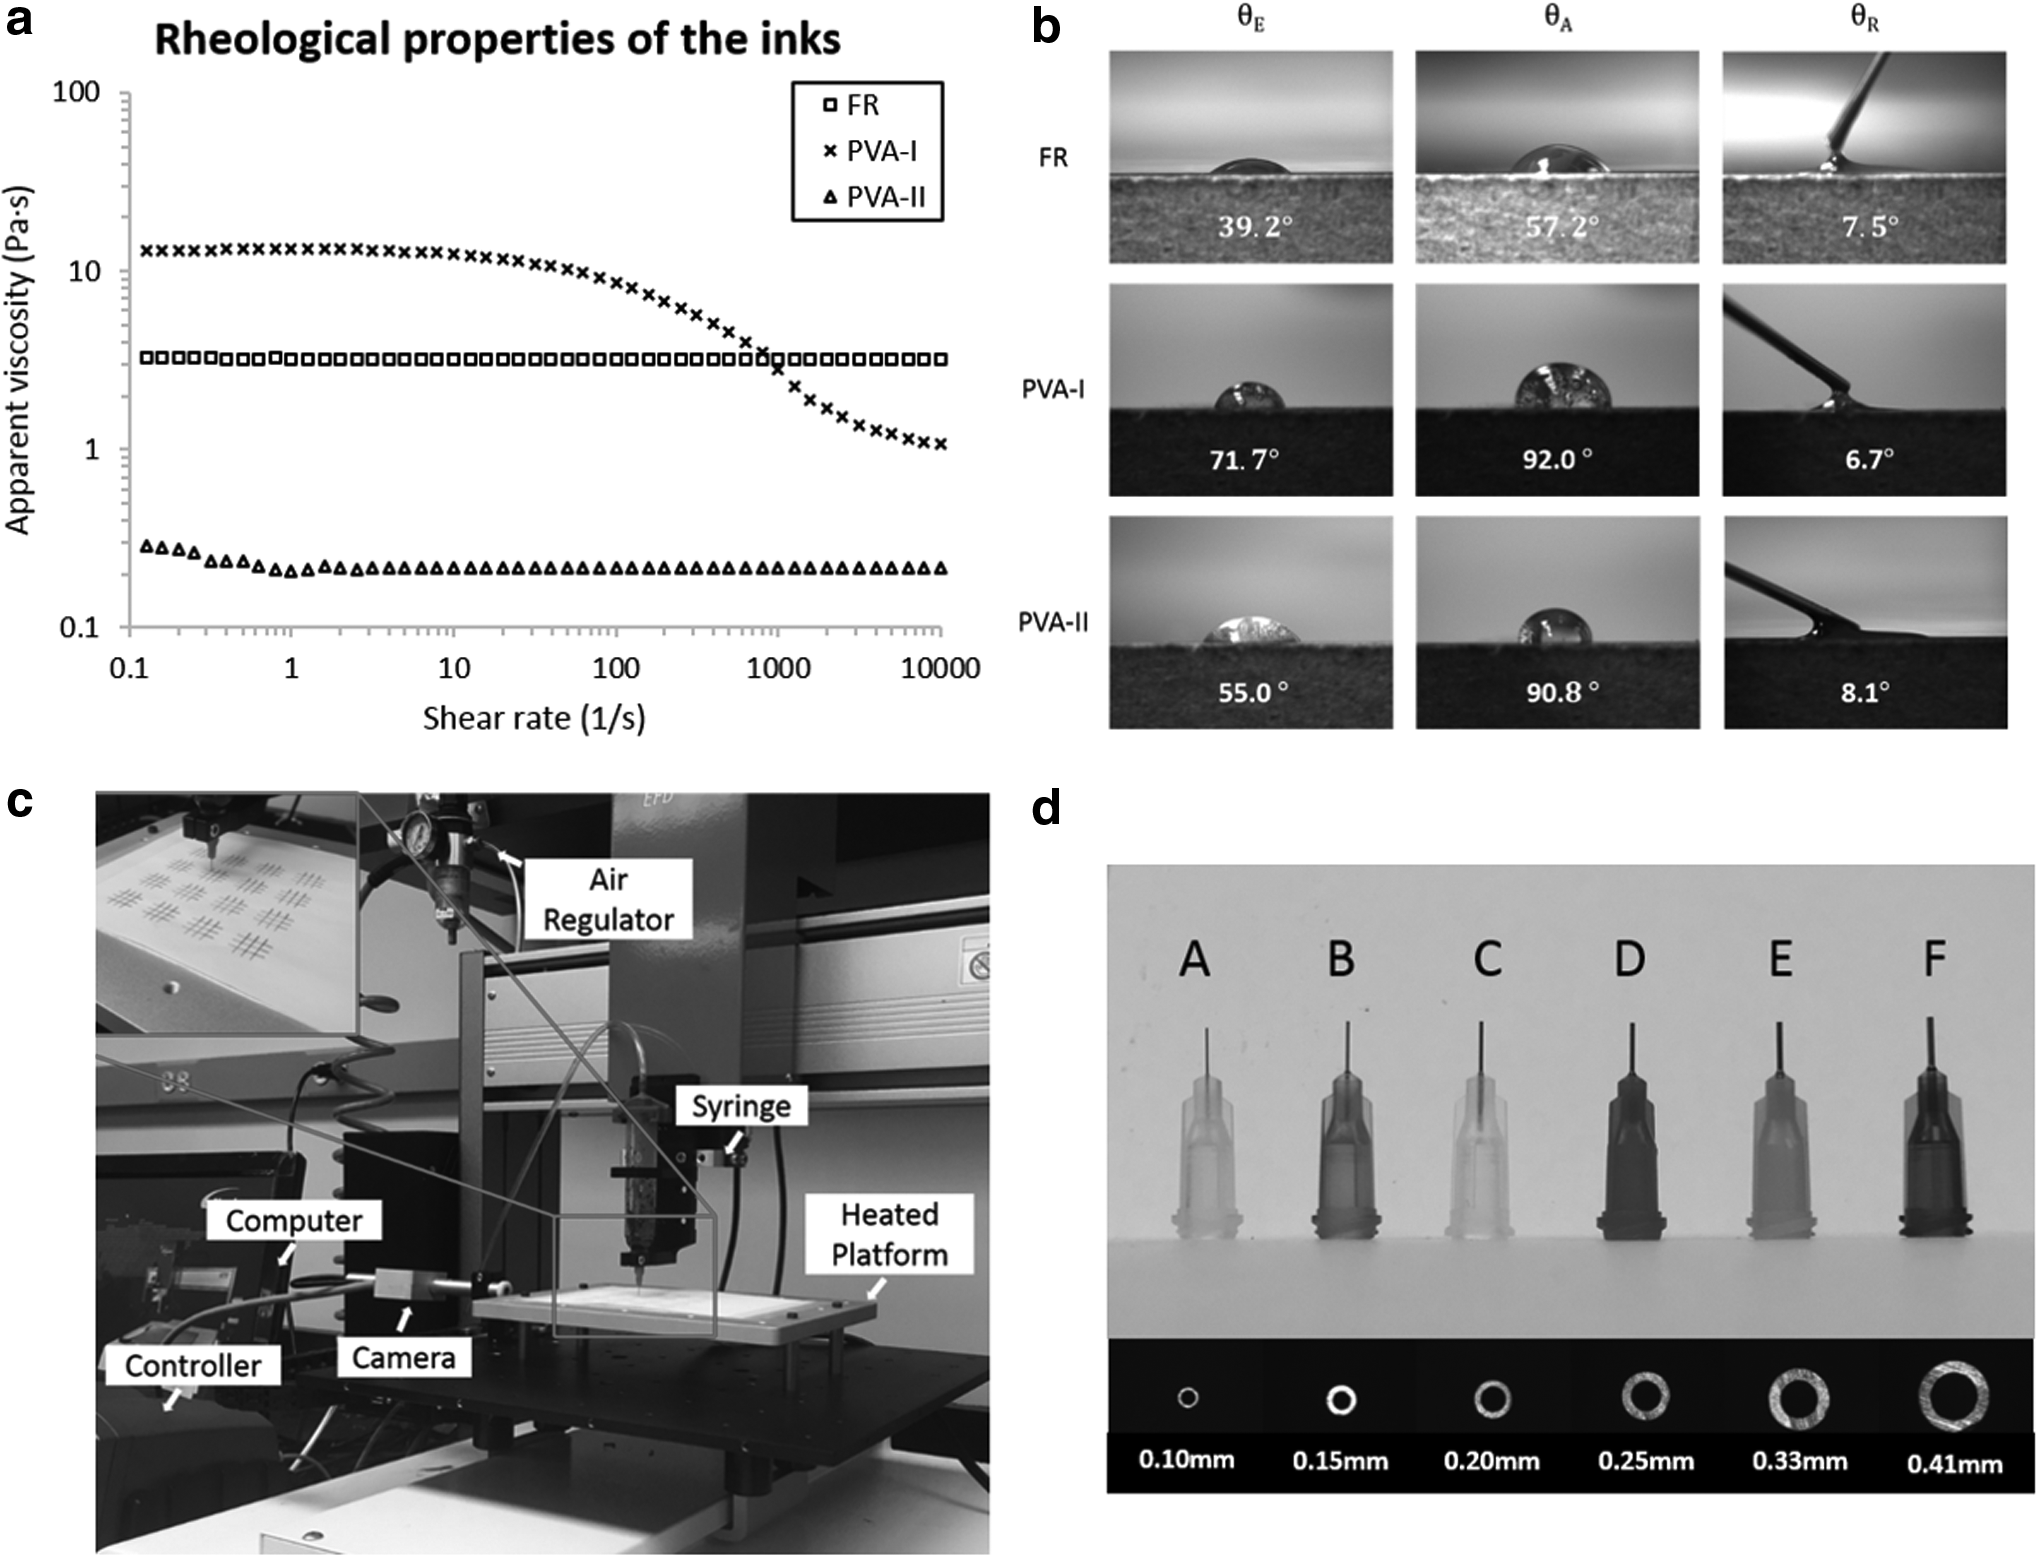
In this study, all rheological measurements were carried out using a rotational rheometer (Kinexus Ultra+; Malvern) equipped with a 25-mm-diameter plate geometry. The plate geometry is supported by a virtually frictionless air bearing and driven by an ultralow inertia motor, coupled to an ultrahigh precision position encoder. In all experiments, the inks were equilibrated at 25°C for 15 min before testing. The sample was then loaded into the gap of a fixed substrate and the plate geometry. Herein, the rheological characteristics of the sample can be determined by rotating, based on the controllable motor torque. The test runs a logarithmic sequence of shear rates and measures the apparent viscosity with a 25°C testing temperature for each material. The rheological properties of inks at various stages of the printing process are shown in Figure 3a. PVA-I is shear thinning as evidenced by a pronounced decrease in its apparent viscosity from 14.3 to 1.8 Pa·s as the shear rate increases from 200 to 2000 s−1. This flow behavior ensures that PVA-I can be easily extruded. Similarly, PVA-II undergoes noticeable shear thinning, in which the viscosity decreases by half of the magnitude as the shear rate increases from 0.1 to 1.0 s−1. It should be noted that when the shear rate exceeds the threshold 1.1 s−1, PVA-II exhibits Newtonian fluid's behavior with a stationary 0.2 Pa·s apparent viscosity. This is caused by the additional dilution process during PVA-II preparation, in which the added deionized water has a dramatic influence on viscosity. In addition, the Newtonian fluid's behavior of FR was observed, with a measured 3.3 Pa·s apparent viscosity as the shear rate increases from 0.1 to 10,000 s−1.
Inks, setup, and dispensing tips.
To differentiate the various contact angles, we introduce subscripts so that
DIW setup
The system used for DIW experiments is shown in Figure 3c. It was developed by modifying a dispensing robot (Nordson EFD). DIW was implemented by extruding inks through dispensing tips to a moving platform in a trace-by-trace and layer-by-layer way. Traces were directly written using various stationary blunt stainless steel syringe tips and a pump system coupled with a motorized XY stage. The experimental setup also consists of a pressure controller that can regulate the ink applied flow rate, a heat-controlled platform, and a CCD camera. The platform temperature was controlled by the direct writing software and can be adjusted from 25°C to 200°C. Usually, an elevated temperature is used for evaporating the moisture content to solidify the printed trace rapidly. In this study, the platform temperature during the DIW process of each material was set to 25°C. The syringe tip was fixed to a Z stage. The standoff distance was adjusted according to the tip gauge for each experiment. A CCD camera was used for visually detecting when the tip meets the substrate. The CCD camera was also used to monitor the dispensing process in real time. To initiate a printing job, the stage was reset to the origin point. On reaching the starting position of a trace, the preprogrammed applied flow rate from the pressure regulator began immediately after the start of the platform motion. The pressure regulator was stopped at the end of the trace.
To validate that the normalized geometry prediction model is independent of tip gauge, we tested several dispensing tips (Nordson EFD). As shown in Figure 3d, the inner diameters of them are 0.10 mm (A), 0.15 mm (B), 0.20 mm (C), 0.25 mm (D), 0.33 mm (E), and 0.41 mm (F).
Results and Discussion
Normalized geometry prediction model validation
To verify that the model is applicable to both Newtonian and non-Newtonian fluids, we tested FR (Newtonian) and PVA-I (non-Newtonian). Traces were printed onto polyimide substrate using three different tips for each ink. We measured the printed trace width W and height H. For each tip gauge, the measured results were further normalized by its corresponding tip inner diameter. The normalized results were compared with the predicted data given by Equations (8) and (9).
The distance between the substrate and the tip is standoff distance h. It should be noted that if h/ID is too small, the compression caused by the presence of the tip at a lower position will lead to a trace height saturation. On the contrary, a relatively large h/ID can result in noncontinuous traces. Figure 4a shows the predicted geometry of FR compared with the measured geometry of traces written on polyimide with a 0.75 h/ID. Similarly, Figure 4b presents the comparison between the predicted geometry of PVA-I and measured geometry of traces written on polyimide with a 0.85 h/ID. As expected, a relatively small 95% confidence interval indicates a polynomial effect of v* on trace geometry. These data all show excellent agreement with the prediction of the normalized geometry model, which validates the effectiveness of this approach for geometry predicting in DIW applications, independent of tip size or ink.

Experimental validation of normalized geometry prediction model and bulge-free printing range.
Bulge-free printing range identification
To identify the critical bulge-free printing speed ratio as shown in Equation (16), the nonzero constant K in the boundary condition was first characterized by experimental data of a specific tip. Herein, we flew PVA-II through tip E (0.33 mm ID) to characterize K. As shown in Figure 4c, the hollow dots are substrate speeds that produce bulge-free printing results, while the solid dots are substrate speeds that produce bulged traces. Based on these test samples, the stability boundary was calculated by MATLAB curve fitting toolbox, and K is calculated to be ∼3.67. Below this obtained stability boundary, it is a bulge-free printing range of PVA-II on the polyimide substrate. Moreover, the same constant K value could be applied to other tips and flow rates according to Equations (15) and (16).
The critical speed ratio for a bulge-free printing predicted by the fitted K was validated by experimental data of other tips. Here, we flew the ink through tip D (0.25 mm ID) and tip F (0.41 mm ID), as shown in Figure 4d. It needs to be noted that several samples above the stability boundary show stable printing results as the shear rate increases from 0.1 to 1.0 s−1. We believe this is due to the shear thinning behavior of PVA-II in this shear rate range, causing the critical substrate speed to slightly decrease. To summarize, the validation results suggest that the identified critical bulge-free speed ratio works for other tips and flow rates. Therefore, given a certain applied flow rate of PVA-II and the tip size, the critical speed ratio of polyimide substrate for bulge-free printing could be easily identified using the fitted K and Equation (16).
It should also be noted that the dimensionless speed ratio is capable to be converted back to the substrate speed, and the obtained critical speed ratio boundary could be inversely calculated as indicated in Equation (15). Hence, it gives us another way to characterize K and to validate the identification as shown in Figure 4e and f, separately. The range of the substrate speed for a bulge-free printing of PVA-II versus the applied flow rates on the polyimide is located above the stability boundary. Obviously, no matter using the speed ratio or substrate speed, the characterized K is the same.
DIW process planning
To improve the build speed and meanwhile ensure accuracy, a common process planning method is to fill the interior using a large tip with a fast speed, and draw the boundary using a small tip with a lower speed. It is desired to achieve increased build speed with a large tip without sacrificing the accuracy of the printed geometry. Hence, how to set process parameters to achieve the desired print trace width and height and how to avoid bulges are the key problems in process planning. The trace geometry prediction model and the bulge-free printing model developed in this study could be used to provide the fundamental knowledge to address this challenge.
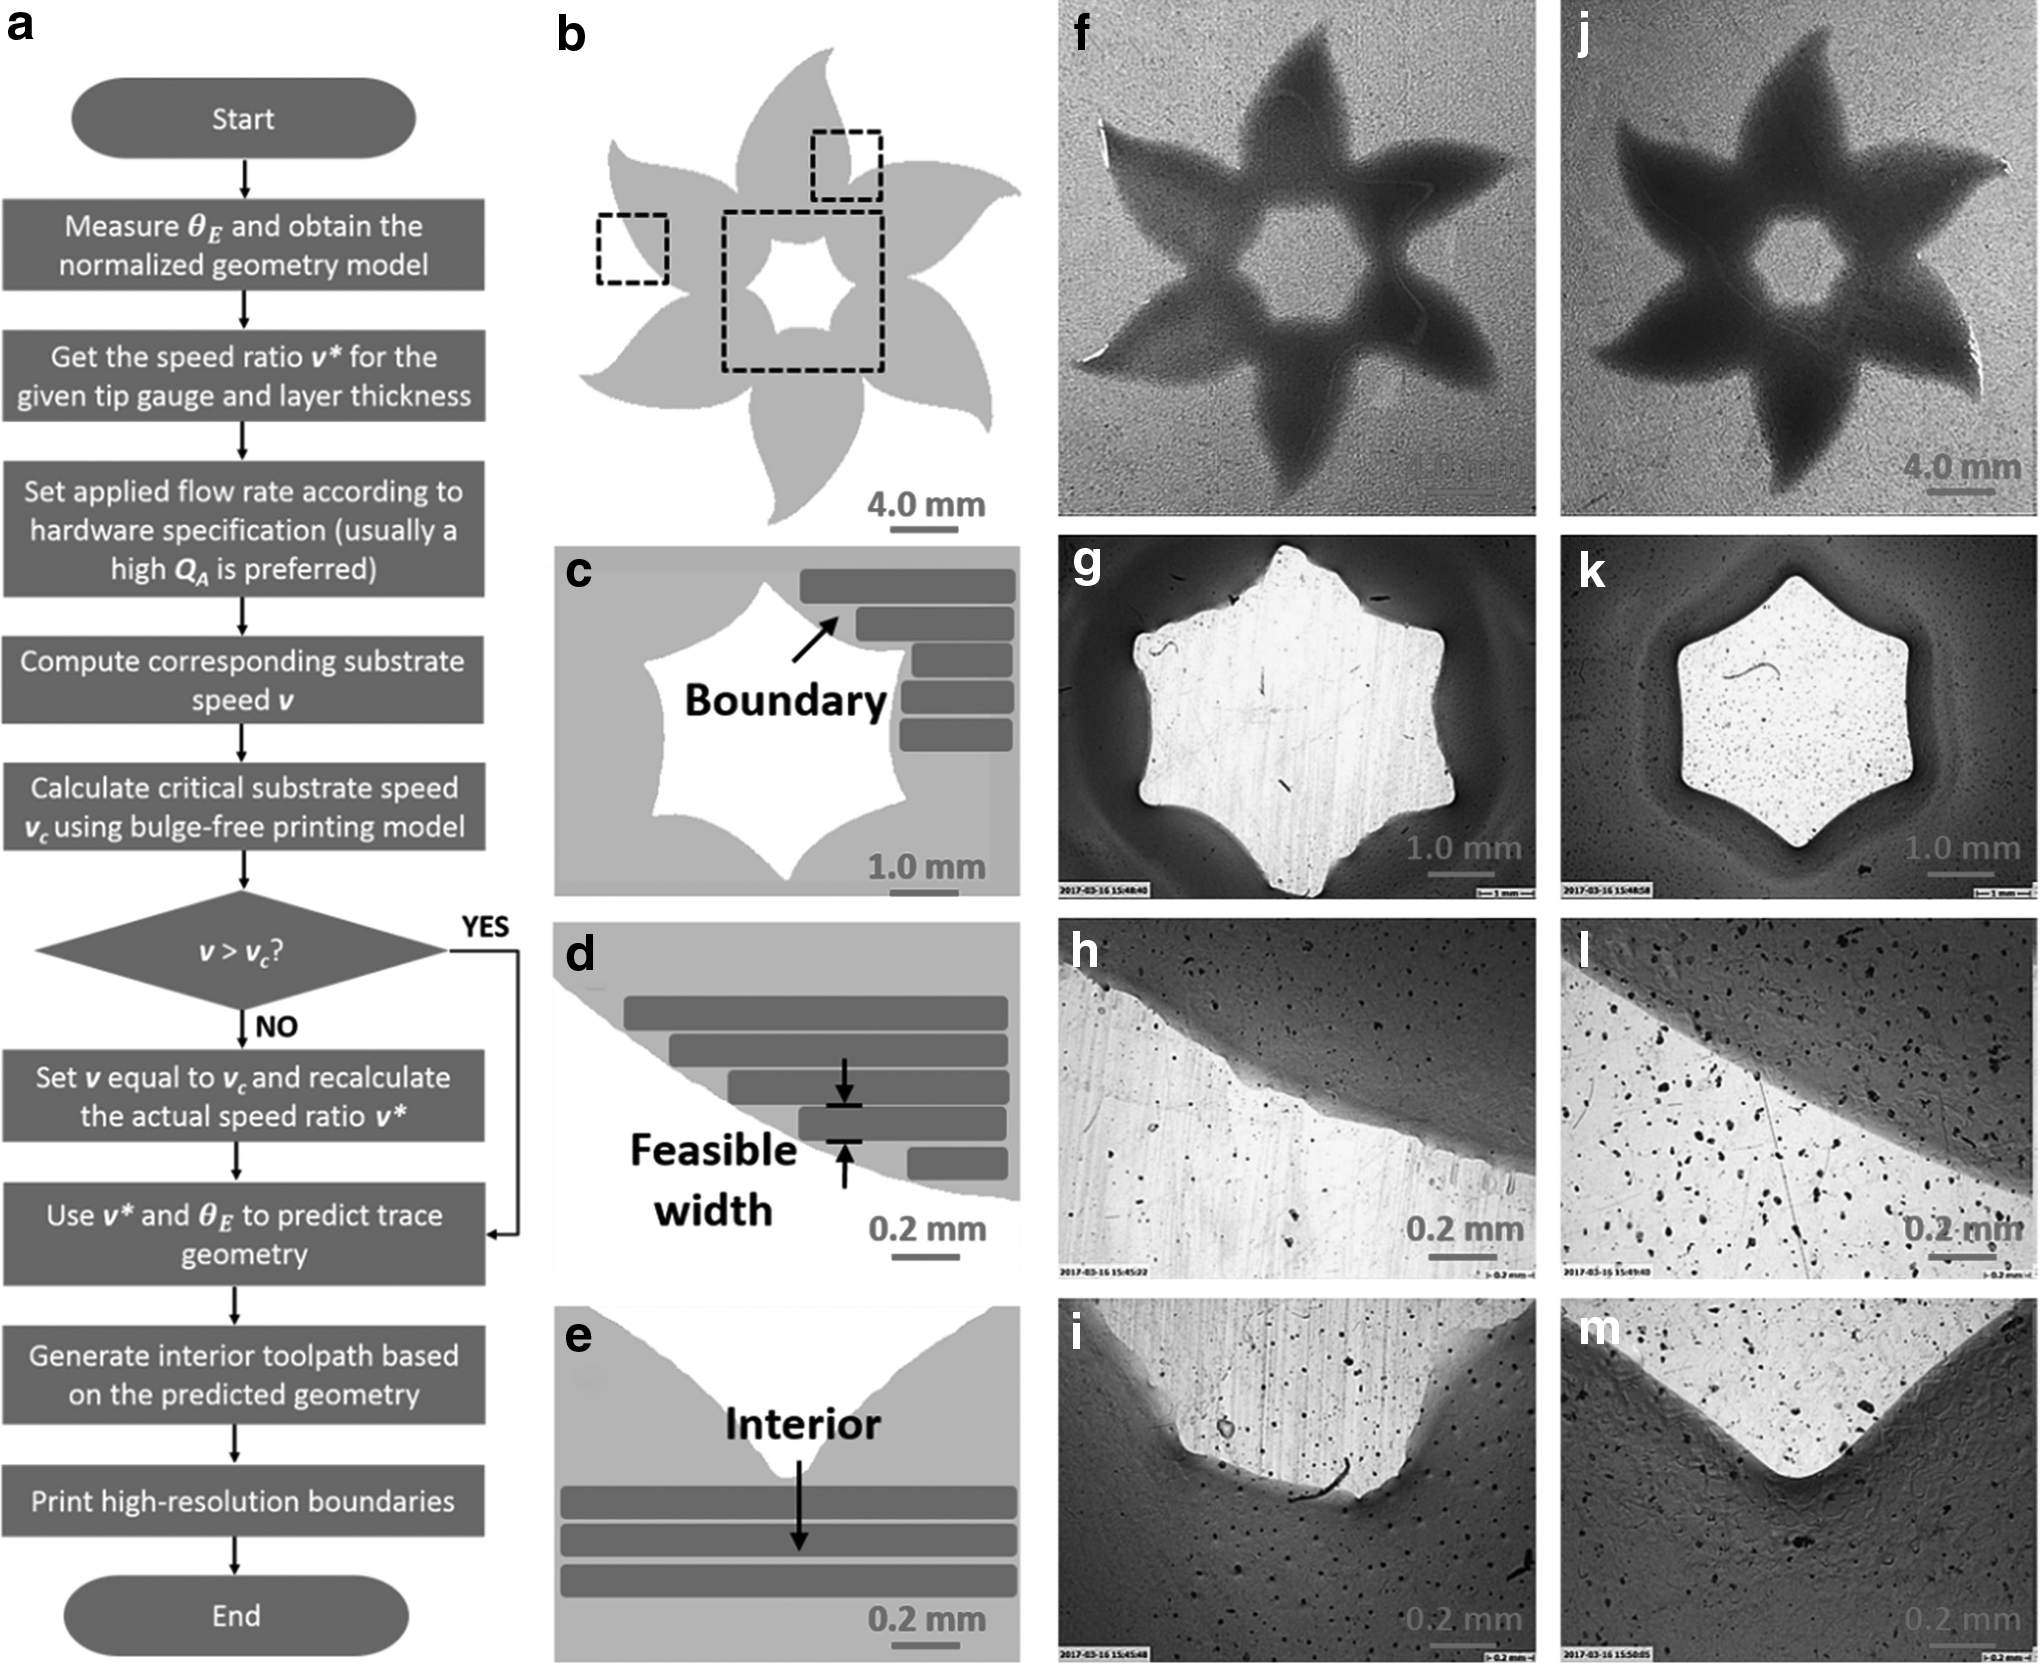
The geometry prediction model could be utilized to identify the feasible trace width as follows. First, the speed ratio is estimated based on the normalized height, which is the ratio of the desired layer thickness to the tip size. With an estimated speed ratio, the corresponding normalized width can be further found using Equation (8). Therefore, a feasible trace width of the interior is identified as shown in Figure 5c–e. It should be noted that the substrate speed could be reversely computed using tip size and speed ratio. To avoid bulges of printed traces, we refer to the developed bulge-free printing model to further check and modify the parameter settings. From Equation (15), it is known that given a certain speed ratio, a larger applied flow rate is less likely to form bulges. Since the speed ratio is a given constant by the geometry prediction model, we could first set the applied flow rate nearly to the machine limit. Hence, the critical substrate speed is calculated based on the applied flow rate. To determine whether bulge will be formed, it is necessary to compare the substrate speed previously obtained from the geometry prediction model with the calculated critical substrate speed. If the actual substrate speed does not reach the critical substrate speed, a bulge might form during the printing. In this case, the actual substrate speed should be increased to avoid bulges, meaning that the trace width needs to be narrowed to meet the bulge-free printing condition.
Direct ink writing process planning flowchart and a test case, FR on polyimide.
Therefore, to print a geometry G using material M with an equilibrium contact angle
Applied flow rate QA is related to the machine limit and is usually set as large as possible. With known v* and QA, the critical substrate speed vc and computed substrate speed v can be identified. It is necessary to make a comparison to tell whether the substrate speed is fast enough to avoid bulges. If v exceeds vc, the printing result would have no bulge as the bulge-free printing model indicated. However, if v is smaller than vc, to eliminate bulge formation, it should be increased to at least vc. Based on the computed v, the feasible toolpath for the interior of G is generated. A flowchart demonstrating our process planning method is shown in Figure 5a.
Here, we demonstrate a test case of the developed DIW process planning method as shown in Figure 5f–m. To print this flower, tip F (0.41 mm ID) was used for printing the interior with a 15 mm/s substrate speed as shown in Figure 5f–i, while tip B (0.15 mm ID) was used for printing the boundary with a 3 mm/s substrate speed as shown in Figure 5j–m. All the interiors presented some rough edges as expected. However, after writing the boundary using smaller tips, the accuracy of the printed geometry was highly improved. It should be noted that the applied flow rate of each tip was different in every test case. In this study, the accuracy of line width, curve smoothness, and corner radius was utilized to evaluate the printing quality as summarized in Table 1. It shows that the process planning based on the developed models is capable of creating accurate complicated features in a faster way. Compared with conventional DIW process planning, our method has increased the total efficiency by speeding up the interior printing as well as preserving the accurate boundary.
Printing Quality Comparison Between the Interior and Boundary
Conclusions
In this article, a novel direct writing modeling method for predicting printed trace geometry was developed. It could provide the foundation for predicting 3D geometry printed by DIW technique for soft material applications. The developed model is tip independent, applicable to both Newtonian and non-Newtonian inks, and based on existing DIW process parameters. Besides, to solve the common bulge problem in DIW process, the critical process parameter, substrate moving speed, under a certain dispensing flow rate was identified. Moreover, the developed geometry prediction model and the identified bulge-free printing range were validated by experimental data of several different tips and inks. Finally, a direct writing process planning procedure was demonstrated based on the trace model and bulge-free model. It was found that the developed models could provide a fundamental guideline for DIW process planning, through identifying appropriate process settings for achieving desired trace geometry.
Footnotes
Author Disclosure Statement
No competing financial interests exist.