
Abstract
Abstract
This article presents the results of monotonic tensile and fatigue tests conducted on commercial polylactide or polylactic acid (PLA). The results of fatigue tests for this material present in the literature are limited, especially for additive manufactured elements. The specimens were manufactured using the injection molding and the fused filament fabrication (FFF) method. The FFF specimens were divided into five subgroups, depending on the direction of filament deposition and infill density. The achieved results are aimed to verify the selected experimental method of fatigue testing of materials used in the additive manufacturing technology. It was considered an important issue, since there is no standard practice for fatigue testing of FFF- manufactured polymers, and research reported in the literature is usually obtained for a small number of specimens. In this work, over 20 specimens per S-N curve were used, which enables to classify them as reliability data type according to ASTM E 739 standard. It has been shown that the resultant fatigue lives can be related with applied nominal stress amplitudes using the classical S-N curve, described with Basquin-type power law function. This is evidenced, among the others, by the very similar scatter of results for both manufacturing technologies and the similar slopes of S-N curves. Some similar conclusions are hard to find in other works. The achieved results can also provide knowledge regarding the differences of monotonic and fatigue behavior of PLA, which is a commonly used biodegradable polymer, with respect to the technology of specimen's manufacturing method. They can be useful in the development of biodegradable implants and other devices used in tissue or biomedical engineering. It has been shown that, to some extent, the fatigue testing of FFF-manufactured parts can be performed in the similar way as parts manufactured by injection molding.
Introduction
The application of rapid prototyping and rapid tooling enables fast verification of new products at the design stage or manufacturing of small-batch products. Among the many fast prototyping methods, in case of polymer processing, the fused filament fabrication (FFF) technology has found wide application. Its progress, compared with traditional methods of polymer processing, such as injection molding, thermoforming, or extrusion, led to a production process improvement.1–6 It is also an aid for some of the scientific fields by enabling the preparation of three-dimensional (3D) models using reverse engineering.7,8 Depending on the user's requirements, various materials, such as acrylonitrile/butadiene/styrene copolymer (ABS), nylons (NY), polylactide or polylactic acid (PLA), or even materials modified using wood or metal powders, are used in the FFF technology.
Biodegradable polymers, such as PLA, are becoming even more popular. They are tested for possibility of being used for natural tissue reconstruction, such as bones9,10 or tendons.
11
PLA can be also successfully used in the food, automotive, or aerospace industries.
12
It is a nontoxic, aliphatic thermoplastic polyester occurring in three stereochemical forms: poly (
It is produced by polycondensation of lactic acid, anaerobic fermentation of carbohydrates, or ionic ring-opening polymerization of lactide. Due to its wide spectrum of synthesis possibilities using natural materials such as tapioca roots, sugarcane, starch, or corn starch, 13 PLA is the most popular biodegradable polymer. In terms of mechanical properties, PLA has relatively good strength parameters, but available experimental results concern the material processed by means of traditional methods, such as injection molding 7 or compression molding. 14 The properties of additive manufactured material are still poorly known. The published experimental results of mechanical testing of materials processed using this technology concern mostly ABS,15–17 polycarbonate, 18 or thermoplastic polycarbonate urethane (PCU). 19 In the case of mechanical testing of PLA, the results concerning only static16,20 or fatigue behavior apply to groups of small numbers and a limited number of loading cycles.21,22 Because of the increasing usage of additive manufactured biodegradable materials, there is a need to supplement the knowledge in the field of their monotonic and cyclic behavior.
A lot of available research results help to understand the fatigue behavior of metals, but more and more work is focused on trying to explain this phenomenon in polymers. In contrast to metals, polymers' viscoelastic properties significantly influence their fatigue behaviors. 23 The high frequencies of loads can cause the softening and melting of polymers, and therefore, fatigue damage can be accelerated by the influence of temperature factors. 24 According to the most accurate knowledge of the authors, only a small number of fatigue test results for polymers processed by additive manufacturing methods exist. For this reason, the method of investigating the high-cycle fatigue behavior of 3D-printed polymers (PLA) has been based on previous experience in the field of fatigue testing of metals,25–27 as well as trabecular bone, 28 and has been verified on the basis of previously published studies on polymeric materials such as thermoplastic PCU, 19 polylactide-co-hydroxyapatite, 29 polyether ether ketone, 30 neat, talc-filled and short fiber-reinforced polymer-molded polymer composite, 24 polycaprolactone (PCL), polyvinyl alcohol, and PCL-PVA composites, 31 or carbon fiber/flax/epoxy composites. 32
The present work is focused on the characterization of tensile and fatigue properties of a selected brand of the PLA filament through subjecting flat FFF specimens, each with one of five raster orientations or percentage infill, to static and cyclic loadings. Also, the aim of this work was to verify the experimental method of determining the mechanical behavior of FFF specimens, with reference to the results obtained for specimens manufactured by the injection molding technique.
Materials and Methods
Materials
The same specimen geometry, based on the recommendations of the ISO 527 standard, was used for all experiments. The specimen dimensions are given in Figure 1a. Specimens were manufactured by two processing methods.
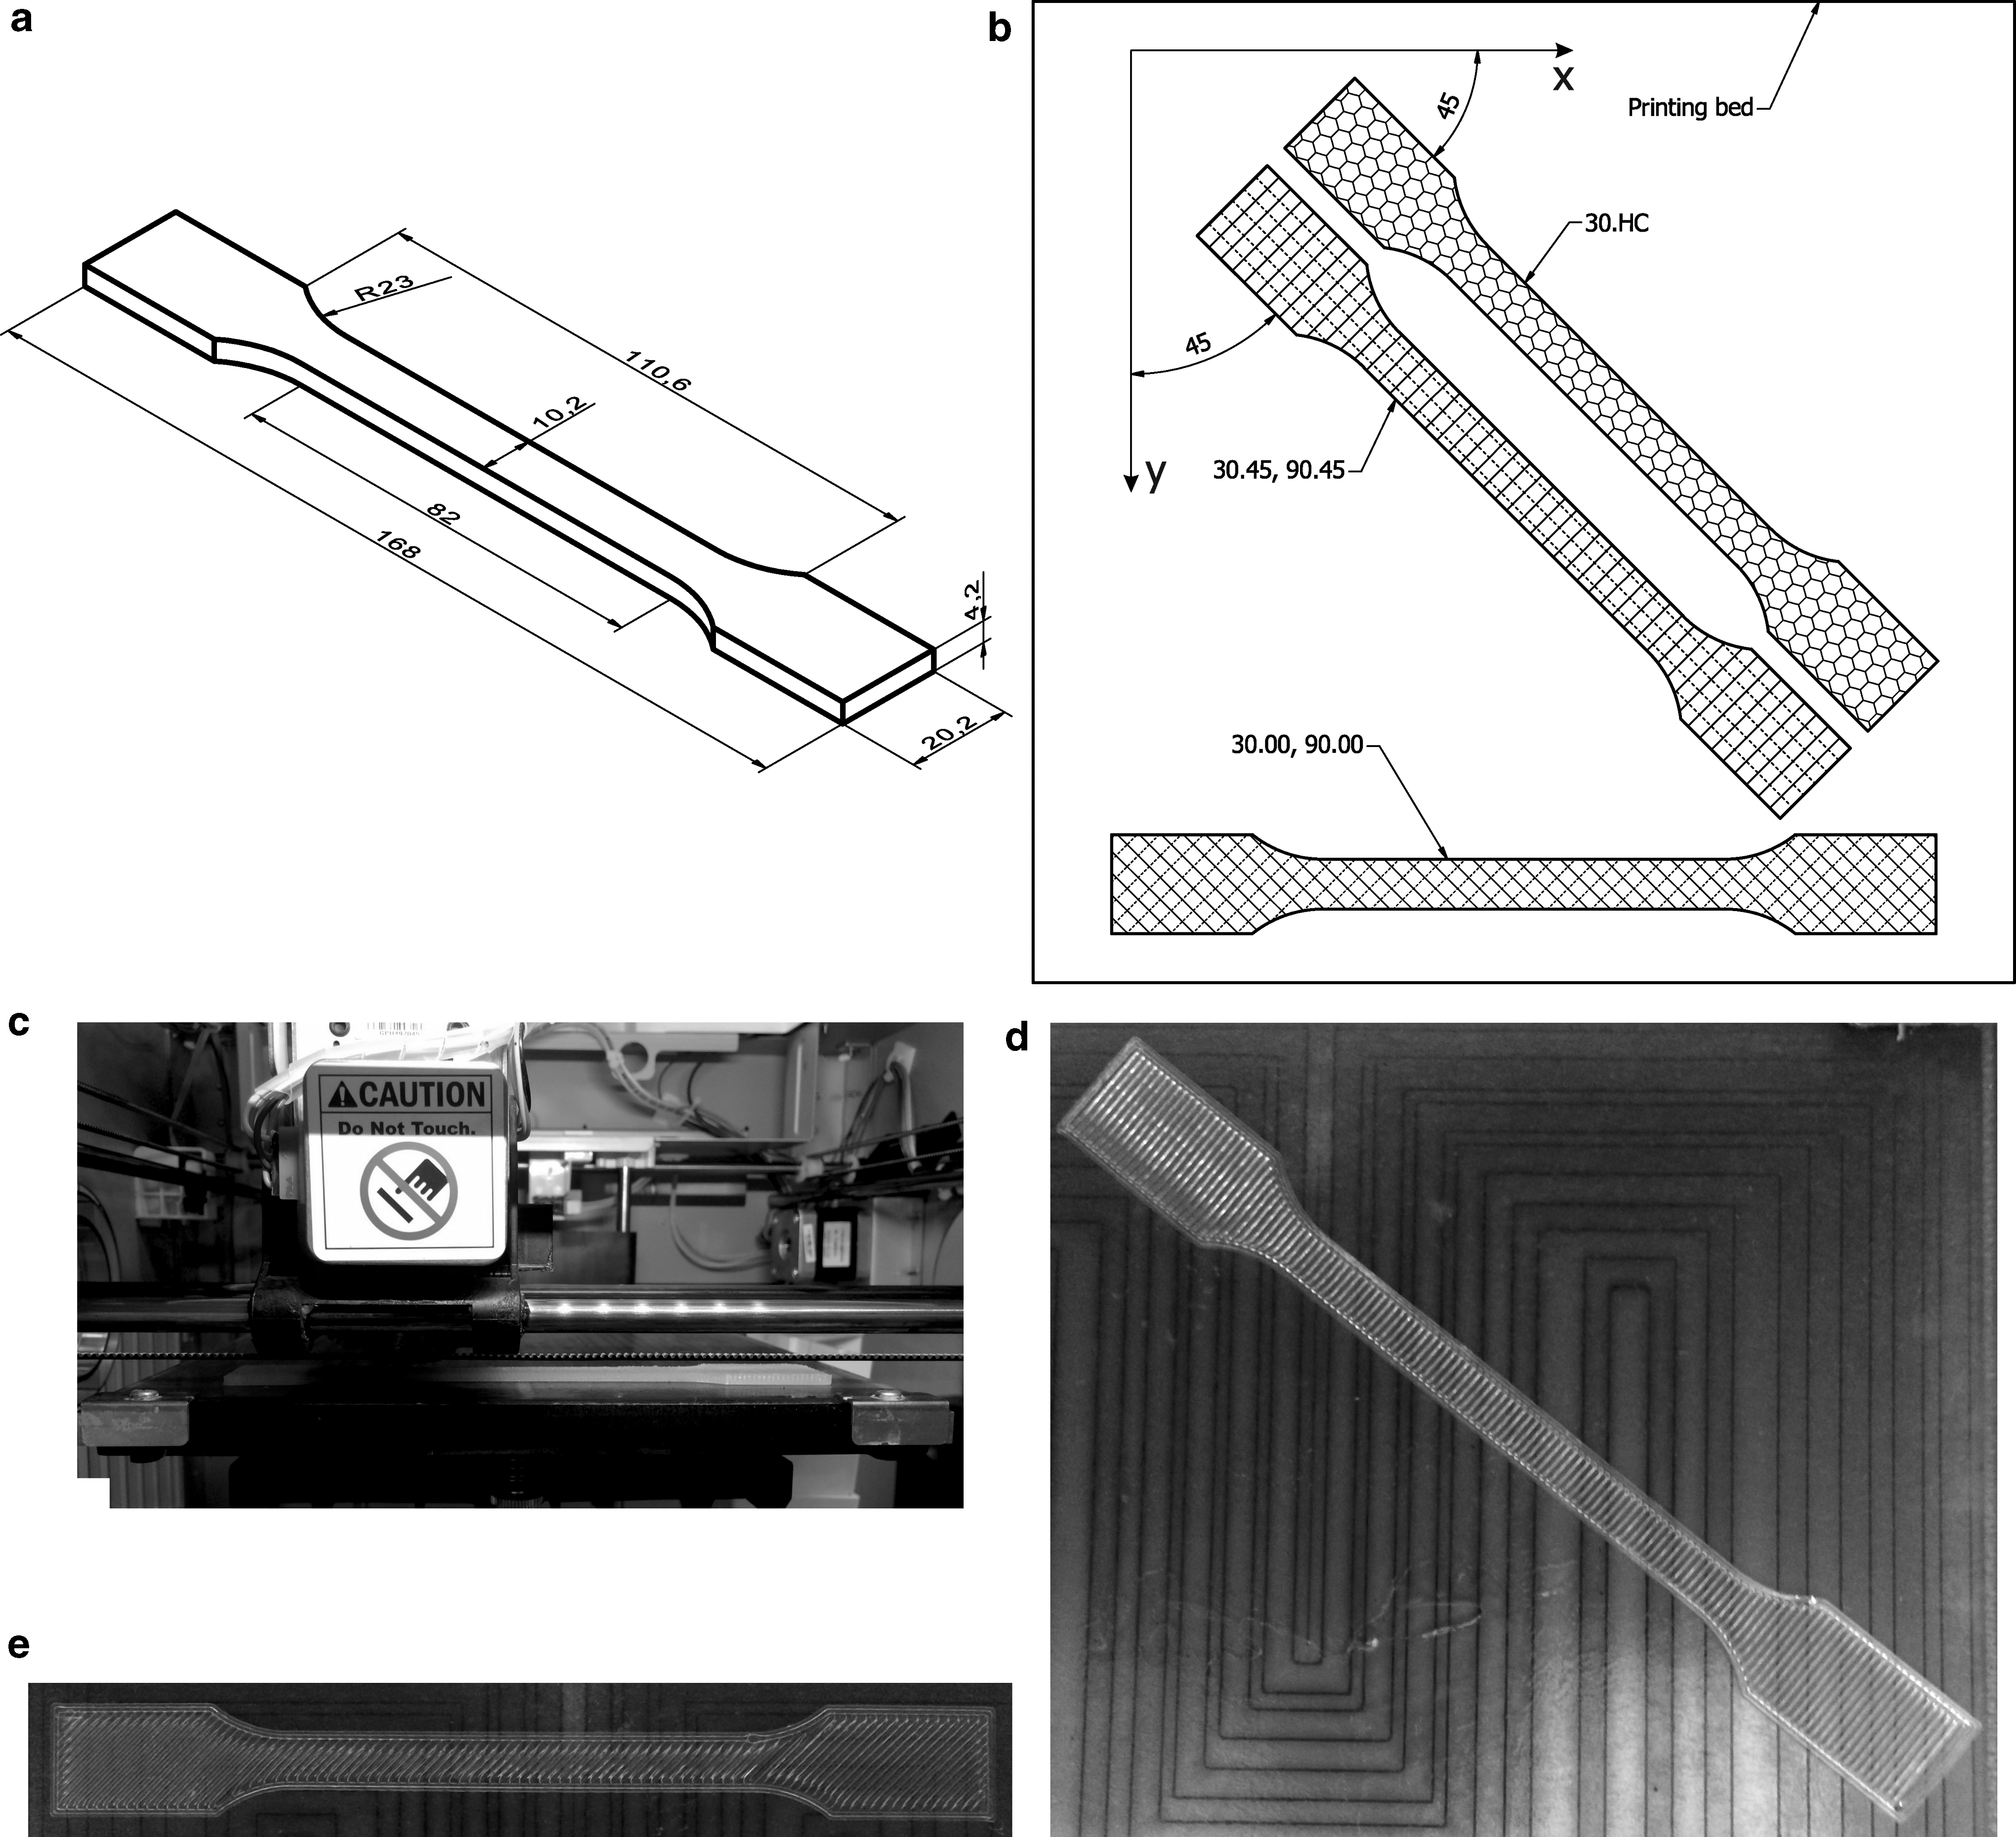
Specimen geometry
The first group was made by injection molding (Engel e-victory 310/110 injection molding machine) with medium viscosity PLA (Ingeo Biopolymer; NatureWorks, LLC). Polymer pellets were predried for 6 h at 80°C. The dried pellets were then subjected to an injection molding process. The injection molding parameters were adopted to obtain an amorphous material, that is, a mold temperature of 26° C and melt temperature of 200° C, an injection pressure of 598.6 bar, an injection time of 1.03 s, a press time of 19 s, and pressure of 400 bar. The injection-molded specimens are designated as injection-molding (IM).
The second group of specimens was prepared in the FFF process with a transparent PLA NATURE filament (XYZ Printing), with a 1.75 mm diameter (Fig. 1c).
All 3D-printed specimens were built on a DaVinci 1.0A machine. Specification of the 3D printing process is presented in Table 1. To ensure proper adhesion of the specimens to the printing bed, its glass surface was covered with a thin layer of an adhesive glue. The FFF process is influenced by many parameters such as nozzle temperature, print speed, direction of each print layer, and infill value. These parameters can significantly affect the properties of FFF-manufactured parts.
Specification of the Three-Dimensional Printing Process
3D, three dimensional.
The essence of the present study was not a detailed examination of each of these parameters, but the determination and comparison of the mechanical behavior of selected, exemplary specimen models built with optimal manufacturing parameters. XYZWARE printing software was used to generate the G-codes. The maximum infill value was determined by printer capabilities, and it was 90%. The 30% infill density was a minimal value to obtain assumed minimum quality of the specimens, related to the bottom and top closing layers. All specimens were printed at a layer thickness of 0.2 mm, an outer layer thickness (shells) of two tracks, a nozzle temperature of 200°C, and a printing bed temperature of 50°C. The fiber orientation in the bottom layers of specimens is presented in Figure 1c and d. Five types of FFF specimens were used:
30.45: 30% infill density, perpendicular parallel fiber orientation to the specimen axis, and +45°/−45° specimen orientation to the printing plane axes (Fig. 1b), 30.00: 30% infill density, +45°/−45° fiber orientation to the specimen axis, and 0°/90° orientation to the printing plane axes (Fig. 1b), 30.HC: 30% infill density, honeycomb pattern, and +45°/−45° orientation to the printing plane axes (Fig. 1b), 90.45: 90% infill density, perpendicular parallel fiber orientation to the specimen axis, and +45°/−45° specimen orientation to the printing plane axes (Fig. 1b), 90.00: 90% infill density, +45°/−45° fiber orientation to the specimen axis, and 0°/90° orientation to the printing plane axes (Fig. 1b).
Testing of monotonic mechanical behavior
Two specimen groups were investigated. The first group was injection-molded specimens and the second group was FFF specimens. The second group was divided into five subgroups, depending on the parameters described above. A minimum of five specimens were used in each test group. Monotonic uniaxial tension tests were conducted at a 1 mm/min velocity of grip displacement, using the electromagnetic INSTRON ElectroPuls™ E3000 testing machine with a force range of ±3000 N. Specification of the testing machine is presented in Table 2. A uniaxial extensometer was used to measure the strain. Its base was equal to 12.5 mm. The tests were preceded by measurement of the specimen's geometry and mass. The cross section of the specimens was measured with a screw gauge (micrometer) with an accuracy of 0.01 mm. The specimens were also weighed on the RADWAG analytical balance with an accuracy of 0.1 mg.
Specification of the Testing Machine
Testing of high-cycle fatigue behavior
Cyclic loading tests were performed to determine the fatigue curves for the tested material. Three specimens were tested at each loading level. The specimens were run till failure. Sinusoidal stress waveforms were utilized with a frequency of 5 Hz and a loading cycle asymmetry coefficient of R = 0.1 (R = Smin/Smax), where S is the value of the applied stress. 32 All tests were conducted in room temperature. The range of applied load amplitude is given in Table 3.
Tabulated Values of S-N Curve Parameters
Results and Discussion
Results of monotonic mechanical behavior testing
Before each mechanical test, cross section and mass of the specimens were determined. The average cross section of the printed specimen was 43 mm, while the injection-molded specimens were 42 mm. However, the specimen mass depends on infill density and was 7 g for 30.00, 30.45; 9 g for 30.HC, 11 g for 90.00, 90.45, and 12 g for IM. In all specimen groups, there were no statistically significant differences between each specimen, both for the cross section and weight. The coefficient of result variation was less than 10%.
The stress/strain curves for the injection-molded and 3D-printed specimens are presented in Figure 2. Based on the recorded histories of stress and strain, the ultimate tensile strength value σM, Young's modulus E, and Q for toughness were determined. The Young's modulus was determined according to the ISO 527 standard. The method involved the determination of the strain values of ɛ1 = 0.0005 and ɛ2 = 0.0025 and the corresponding stress.
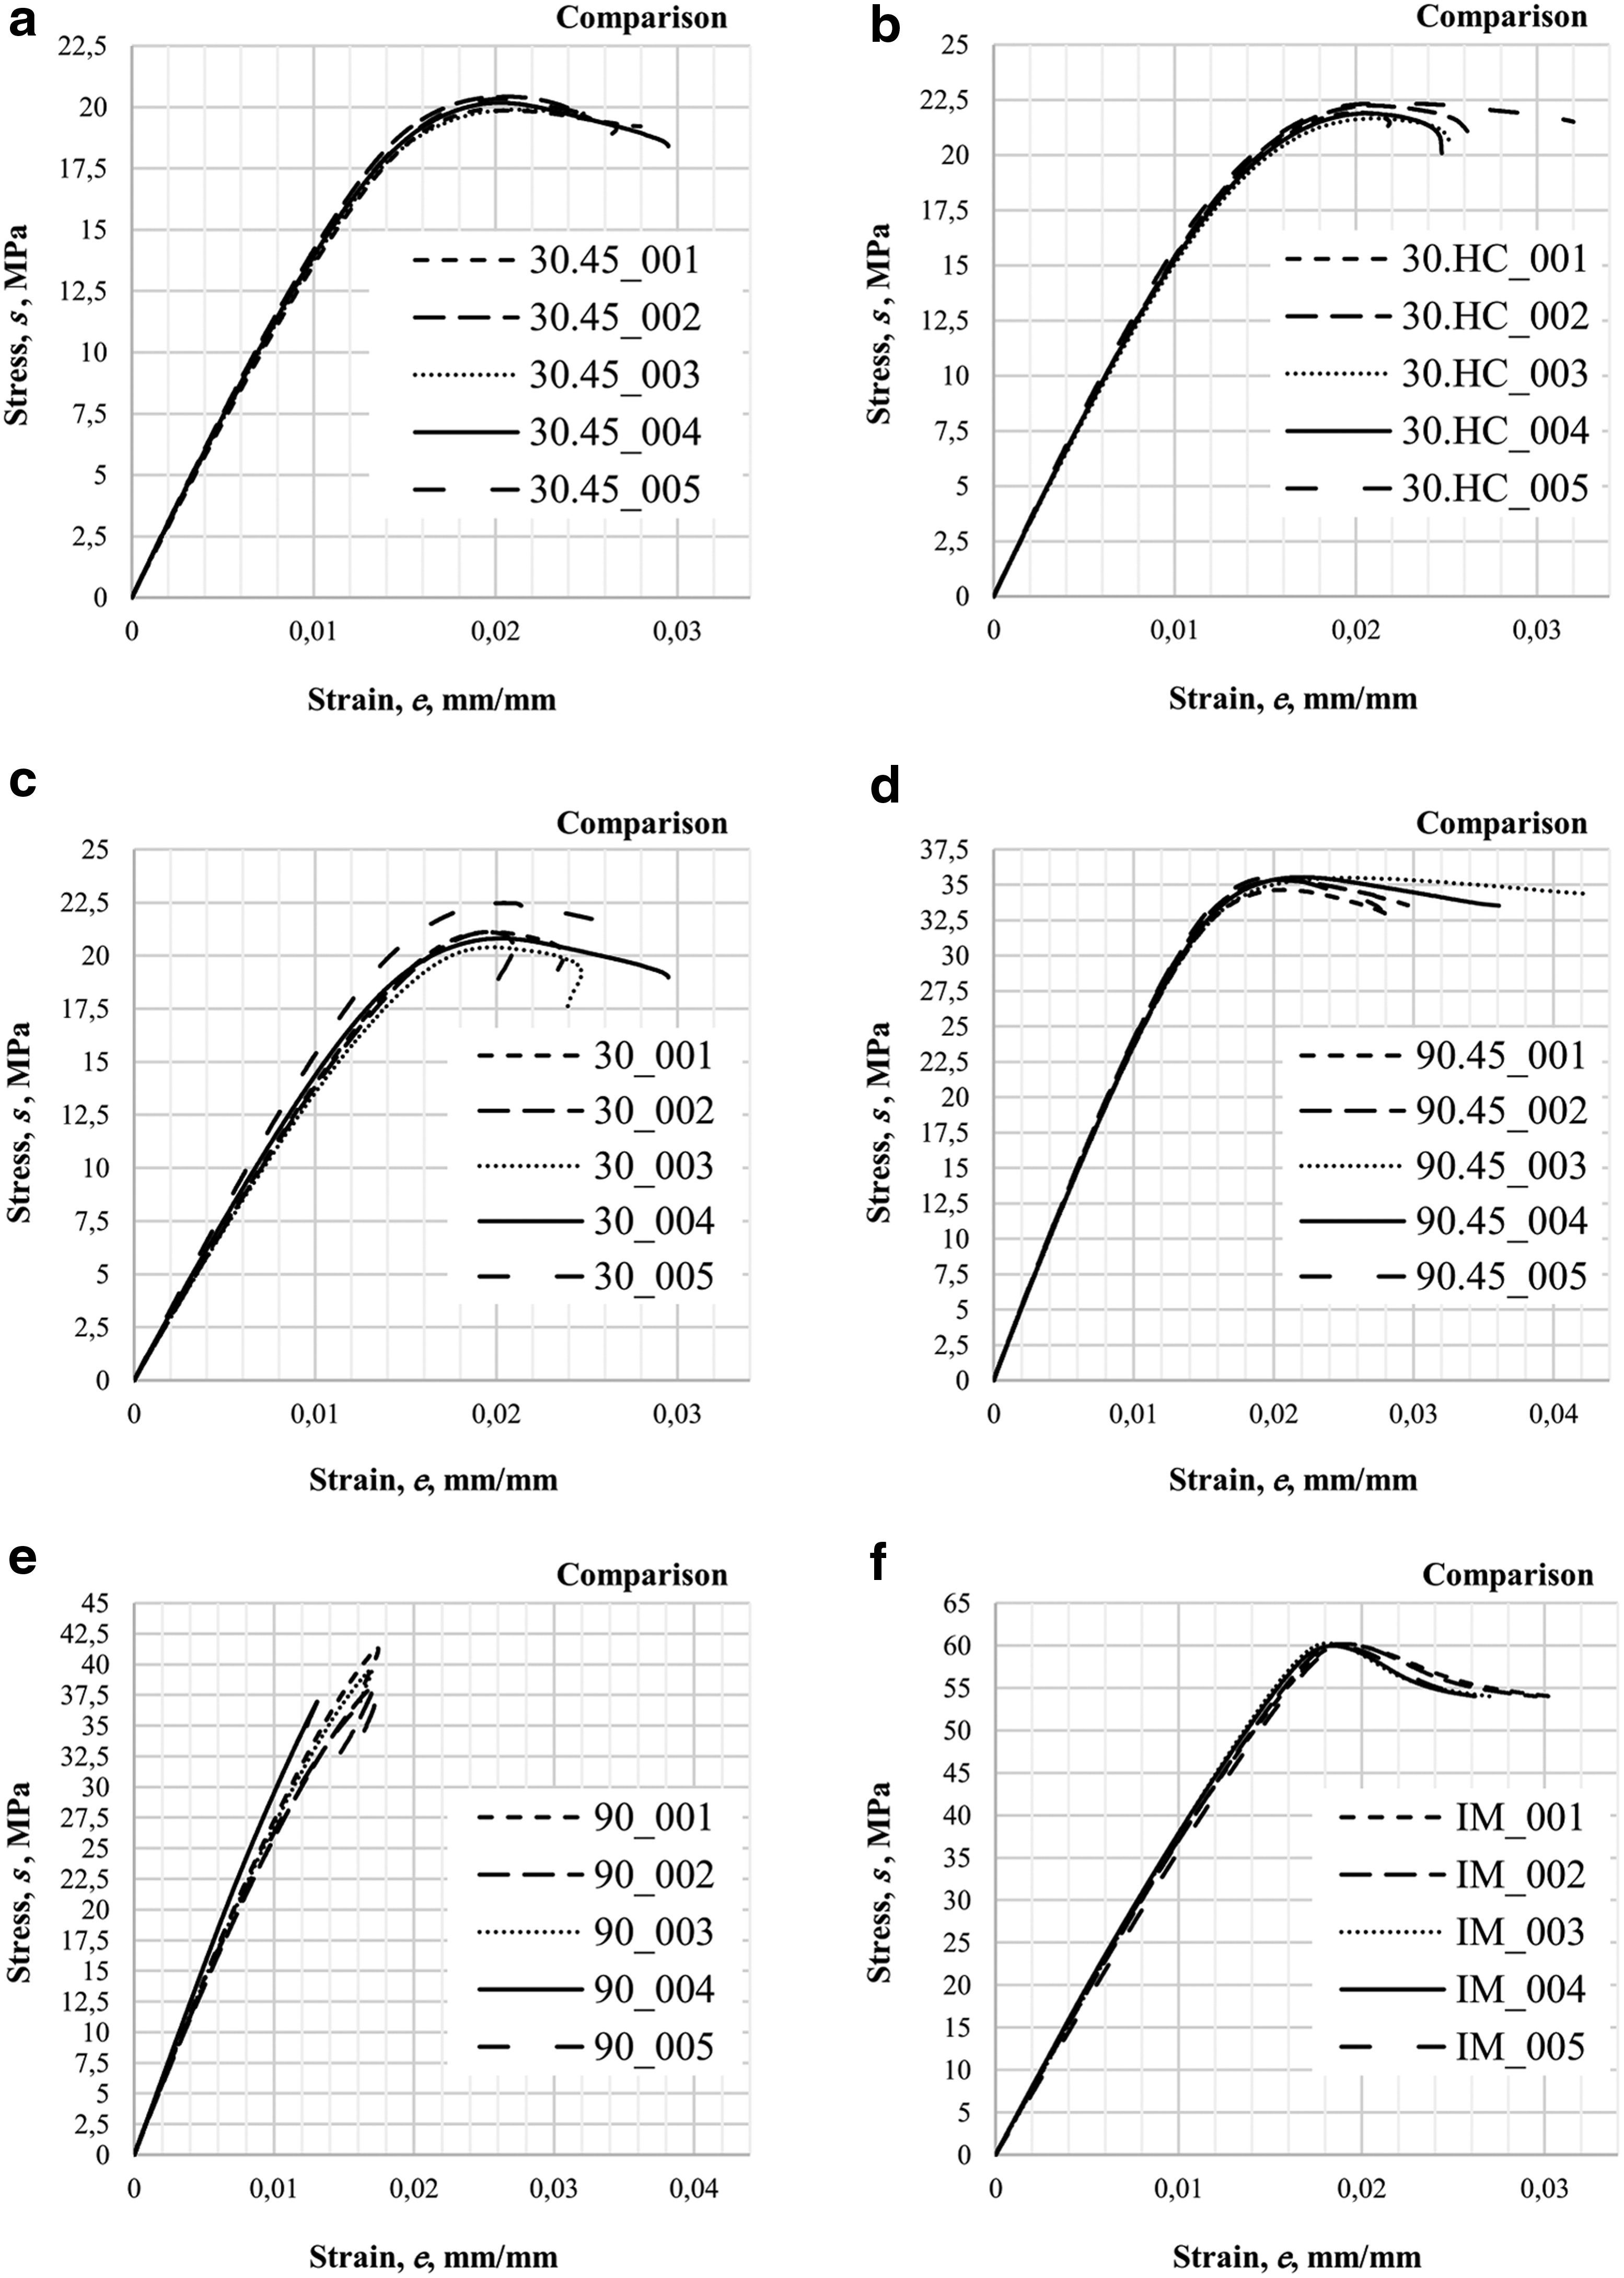
Stress/strain curves for the 3D-printed [30% infill
For better characterization of the specimens' mechanical behavior under monotonic loading, toughness was also determined. Toughness is a value of the strain energy required for specimen failure. It was assumed that failure occurs when the stress reaches maximum value, σM. The toughness is then given by the following:
The figures show a comparison of results in each specimen group. Figure 2a through f presents the stress/strain curves for specimens with 30% of infill density. The strain/stress curves for specimens in series 30.45 are presented in Figure 2a, while the results of specimens marked 30.HC are presented in Figure 2b, and the curves of specimens 30.00 are presented in Figure 2c. Likewise, Figure 2d through e presents the curves for specimens with 90% infill density, where the curves for specimen in series 90.45 are presented in Figure 2d, and other figures show the results of the second type of samples. The last group of specimens, presented in Figure 2f, is the results for IM specimens.
The results for all types of specimens are summarized in Table 4. Regardless of the specimen group, the low scatter of results can be observed. The values of the coefficient of variation are lower than 10% for σm and E. If this coefficient is lower than 10%, the difference of values indicates no statistical significance. In the case of Q, the coefficient of variation is higher than 10% for 90.00 and 90.45 specimens. It indicates that the scatter of the results is significant. The reason can be observed on the monotonic stress/strain curves (Fig. 2). The σm values vary for each specimen and the corresponding strains. Since the Q value depends on both of these quantities, the scatter rises.
Tabulated Values of Tensile Strength, Young's Modulus, and Toughness for Fused Deposition Modeled and IM Specimens (n = 5)
IM, injection-molded; SD, standard deviation.
In addition to comparing the coefficient of variation of the test results in single groups of specimens, the dependence of the obtained results between groups of specimens was determined. The two-way analysis of variance and post hoc test (LS Fisherman's LSD) were performed. Analysis was carried out at the significance level of p < 0.05.
The results between specimen groups for the tensile strength parameter were not statistically significant between the groups 30.45 versus 30.00 and 30.00 versus 30.HC. In other comparisons, statistically significant differences were obtained. However, in the case of longitudinal elastic modulus, only for comparison 30.00 versus 30.45, no statistically significant differences were found. When the Q parameter was compared, all types of specimens with 30% filling as well as 90.00 absorbed the same amount of energy. It means that the differences of values were not statistically significant. Only values obtained for samples 90.45 and IM in relation to the others were characterized by a significantly higher value of absorbed energy.
Results of fatigue testing
The results of the fatigue tests are summarized in Figure 3 and Table 3. Each point corresponds to the single specimen. The points were fitted with the Basquin equation 33 :
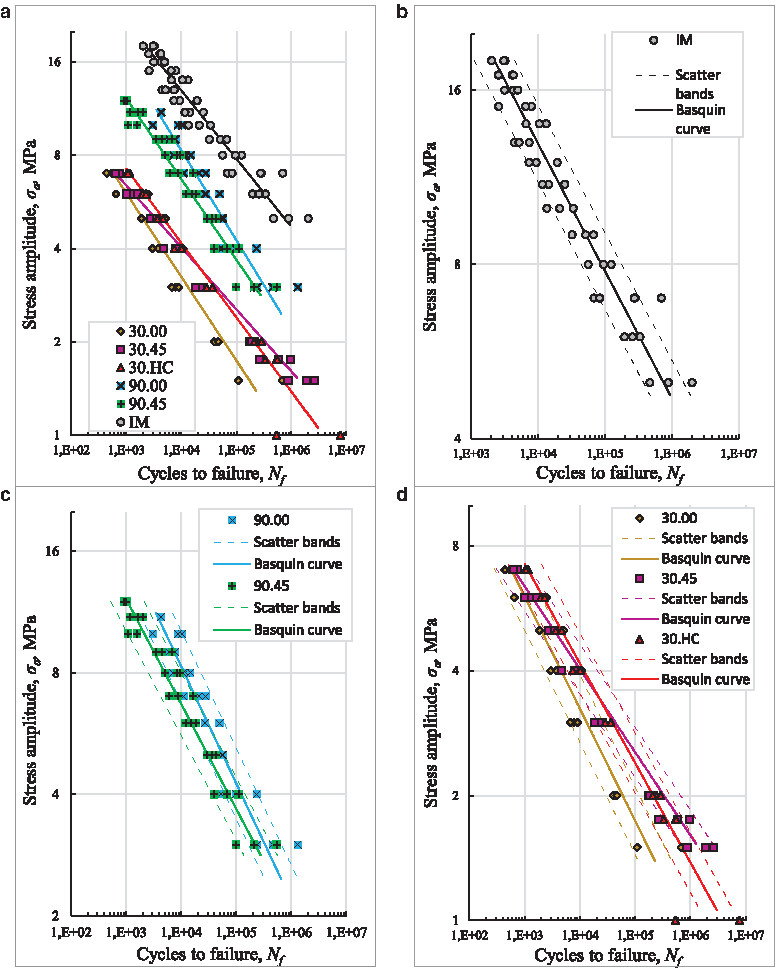
S-N curves for injection-molded and 3D-printed specimens: all test groups
where σa is stress amplitude, Nf is the number of cycles to failure, A is the fatigue strength coefficient, and b is the fatigue strength exponent. Values of A and b for each specimen group are given in Table 3. The fatigue curves are presented in a bilogarithmic coordinate system.
In the case of injection-molded specimens, the scatter of fatigue life increases with a decrease of loading amplitude. A similar general behavior can be observed for the FFF specimens.
The fatigue life points have been collected from S-N curves and the least-squares method for generating a line of best fit from the data was used. The regression line, according to Equation (3), was determined.

where
The equality of Pearson's linear correlation coefficients from independent populations was tested. The differences of values of the determination coefficient R2 (Table 3) were not statistically significant for specimens in groups 30.45, 30.HC, 90.45, 90.00, and IM. The value of the R2 was from 0.91 to 0.98. Only for comparison specimens, 30.45 versus 30.00 were statistically significant differences determined. Whereas for specimens 30.45, the determination coefficient was significantly higher.
Also, the equality of linear regression coefficients
For the injection-molded specimens, the total stress range (including mean values) varies from 11.11 to 40 MPa. Compared with the average value of monotonic tensile strength, it is from 18.5% to 66.7%, respectively. The fatigue lives for the IM specimens are longer for the same stress amplitude level than for any of the FFF specimens (Tables 3 and 4).
For the FFF specimens, the longest fatigue lives were observed for the 90.00 specimens.
They are ∼5.5 times shorter than for the IM specimens on the 11 MPa stress amplitude level and 13 times shorter for the 5 MPa stress amplitude level. The total stress range varies from 6.7 to 24.4 MPa, which is from 17.3% to 64% of the monotonic tensile strength. Shorter lives are observed for the 90.45 specimens. Compared with 90.00 specimens, they are about 2.5 times shorter for the highest common stress amplitude level, and 1.5 times for the lowest one. In the case of this group of specimens, the total stress range varies from 6.7 to 26.7 MPa, which is from 18.6% to 75% of the monotonic tensile strength. In case of FFF specimens with 30% infill, the longest fatigue lives were generally observed for 30.HC specimens. For the 30.45 specimens, the fatigue lives are slightly shorter. The S-N curves for both these kinds of specimen cross approximately in the middle of the investigated fatigue life range (Fig. 3). The shortest fatigue lives were observed for the 30.00 specimens. For all of the FFF specimens with 30% infill density, the fatigue lives are over 100 times shorter than for the IM specimens. The investigated total stress range varies from 1 to 7 MPa, which is about 7% to 30% of ultimate monotonic tensile strength.
To perform the analysis of the fatigue fracture surfaces, their photographs were taken using the optical microscope. In Figure 4, the fatigue fracture surfaces have been presented for selected, exemplary 90.45 and 30.45 specimens. Characteristic zones and features have been marked. In Figure 4a, the specimen with 90% infill density has been shown. In its case, the fatigue and fast fracture zones are visible. In the fatigue zone, the ratchet marks, which indicate the direction of fatigue crack propagation, can be observed. The fatigue crack propagated from the surface to the interior part of the specimen. The fast fracture zone is located on a slightly different height. In this zone, single fiber of the extruded material can be observed.

Exemplary fatigue fractures for specimens: 90.45
In Figure 4b, the surface of the fatigue fracture for the 30.45 specimen is shown. It is noticeably different from the fracture surface of the 90.45 specimen. Difference lies in the fact that in the case of the 90.45 specimen, single fibers of the material are located close enough to each other, so the fatigue zone is approximately uniform. Presumably, the fatigue crack propagated from one fiber to another. However, in case of the 30.45 specimen, one can observe that the fibers, which lie in the fatigue part of the fracture surface, have their own fatigue and fast fracture zones. Therefore, it can be assumed that the nucleation and propagation of fatigue crack took place in each fiber separately.
Based on statistical analyses, it should be stated that the specimens with infill density of 30%, under monotonic loading conditions, have statistically the same values of ultimate tensile strength, and their behavior was not significantly influenced by the raster pattern. However, in terms of the modulus of elasticity and absorbed energy, the most beneficial is the use of honeycomb infill. In case of specimens with infill density of 90%, significantly higher strength parameters were obtained for the specimens printed with the orientation of the material fibers at an angle of +45°/−45° to the sample axis. The S-N curves determined for all types of tested specimens are approximately parallel. Thus, the 3D printing process itself as well as its parameters did not strongly influence the slopes of the S-N characteristics. For this reason, optimal printing parameters could be clearly selected. Similarly to the case of monotonic loading, the best durability in the specimen group with 30% infill density had specimens with honeycomb raster pattern. In the group of specimens with 90% infill density, the higher fatigue life had specimens with an angular orientation of fibers (90.00).
The reason for differences in mechanical behavior of 3D-printed specimens with different printing parameters, namely raster pattern and infill density, is fiber structure and its various features. The reason for longer fatigue lives observed for 90.00 specimens, for which subsequent layers of material are inclined at an angle of +45°/−45° to the specimen axis, is possibly the way in which the loading is carried by the fibers of the material. For 90.00 specimens, in a single layer, the loading is carried both by the material fibers and interfiber bonding. In case of 90.45 specimens, for the layer with longitudinal fibers, the loading is carried by the fibers, while for the layer with perpendicular fibers, the loading is carried by the interfiber bonding. For the specimens with 30% infill density, the longest fatigue lives were shown by 30.HC specimens and similar for 90.45 specimens. For these groups of specimens, an important characteristic, besides the fiber orientation with respect to the stress axis, is their porosity and its influence on local stress concentration. Detailed fatigue damage mechanism requires further investigation.
Conclusions
The mechanical properties and fatigue endurance of specimens manufactured from PLA, processed using both injection molding and 3D printing (FFF), were investigated. The monotonic and fatigue strength properties for injection-molded specimens are higher than for the 3D-printed ones. In the case of 3D-printed specimens, with maximum available infill percentage (90%), the monotonic ultimate tensile strength is 1.6–1.7 times lower than for the injection-molded specimens. The observed fatigue lives were from a few to over a dozen times shorter than for injection-molded specimens. This level of reduction of monotonic and fatigue properties can still be considered nondramatic. In the case of 3D-printed specimens with 30% infill density and different raster paths, the monotonic tensile strength is about three times lower than for the injection-molded specimens. However, the reduction of fatigue life is much higher. It is above 100 times.
Another important observation is with regard to the applied testing methodology. The same classical dog bone-shaped specimens were successfully used for all the conduced monotonic and fatigue tests. Although the 3D-printed material is porous and heterogeneous, the application of simple engineering stress and strain quantities was enough to characterize the mechanical behavior of the materials. The scatter of results was quite similar both for injection-molded and 3D-printed specimens. The determination of classical S-N curves was also successful.
Footnotes
Author Disclosure Statement
No competing financial interests exist.