3D printing enables the manufacturing of complex structures with favorable properties for diverse applications. Here, we investigate 3D printed polymer lattices for tissue engineering, with the exemplary application of a spinal fusion cage. Four beam-based topologies with cubic unit cells were designed with specified beam diameters, porosities, and pore sizes. Measured porosities were generally higher than designed, with a maximum mean difference of 0.08. Measured elastic moduli increased for lattices with fixed porosity when beam diameter was increased and decreased for lattices with fixed beam diameter when porosity was increased. In vitro biocompatibility, cell adhesion, and tissue growth were demonstrated in lattices designed with 500 and 1000 μm pores of varied geometries. Spinal cage designs were fabricated with suitable properties for bone fusion, including 50% porous unit cells, 600-μm-sized pores, and up to 5.6 kN/mm stiffness. The study demonstrates the feasibility of polyjet printed scaffolds for tissue engineering and highlights the capabilities of 3D printed lattices for diverse applications.
Introduction
Advances in 3D printing are providing new opportunities for design and fabrication of biomedical devices, including high-performance tissue scaffolds with complex geometries.1–3 Tissue scaffolds are porous structures implanted in vivo that carry mechanical loads while supporting tissue growth, and are often used for facilitating bone growth.4–7 3D printing provides an opportunity to produce mechanically efficient structures, such as beam-based lattices, with a network of open pores necessary for distributing nutrients to growing tissue.8–12 Although these complex 3D printed structures show promising capabilities, there is a need for characterizing 3D printing processes for scaffolds with respect to manufacturing accuracy, biological compatibility, and mechanical performance to fully assess their suitability. Here, we provide new mechanical and biological testing results of lattices with diverse design and topology configurations constructed with polyjet printing. Findings are applied toward developing proof-of-concept polymer spinal cage devices with suitable stiffness for bone fusion applications.
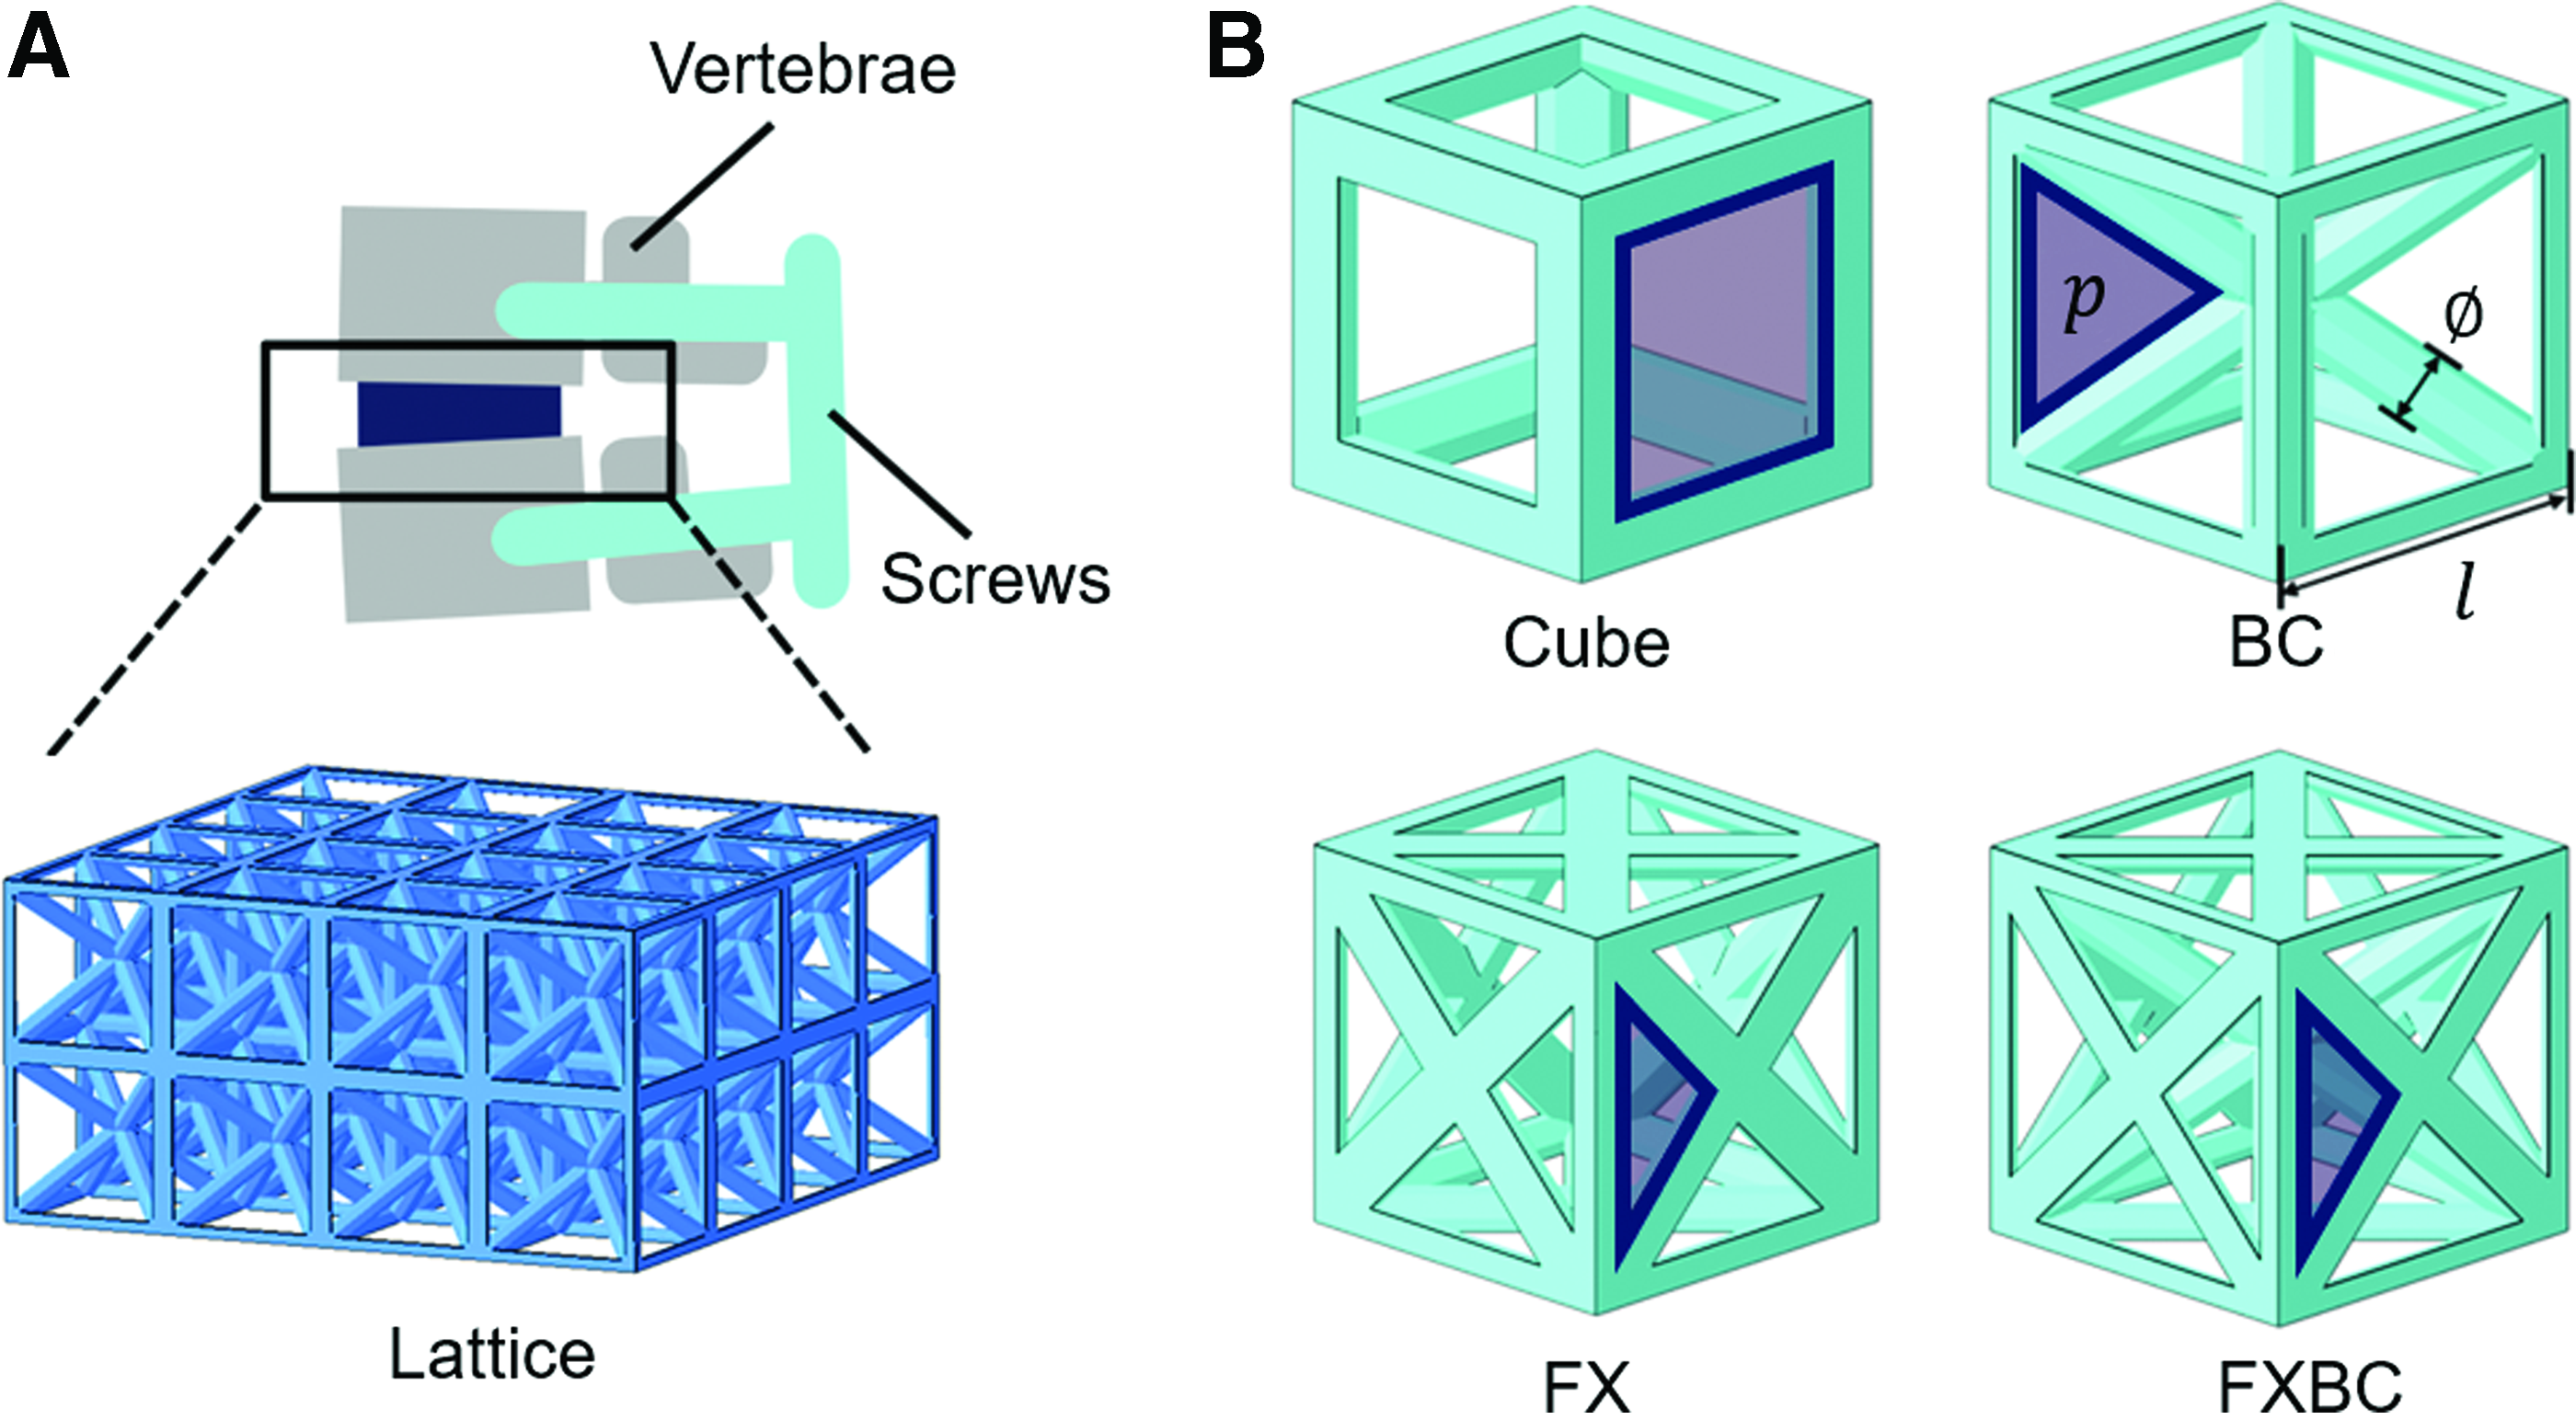
Polyjet 3D printing is a promising method for developing complex beam-based scaffold structures for bone tissue engineering. Polyjet printing builds plastic structures in a layer-by-layer fashion by depositing and curing liquid resin.13 It is possible to build complex geometrical arrangements of beams that form lattices by integrating support material in the fabrication process.14 The process produces structures that are potentially biocompatible,15 while also retaining a lower elastic modulus than titanium-based scaffolds, which may induce stress shielding and hinder bone growth.10 In spinal fusion, an interbody cage is used as a scaffold and inserted between adjacent vertebrae in place of a removed intervertebral disk. The cage carries spinal loads while maintaining spinal alignment and facilitating bone growth to fuse adjacent vertebrae. Such implants may be constructed by using beam-based lattices (Fig. 1A). The lower mechanical strength of plastics may be mitigated through inclusion of pedicle screws and supporting hardware that additionally bear load and provide stability, especially in torsion and extension.16–19
(A) Beam-based lattice with repeating unit cells for vertebral bone fusion. (B) Cube-based beam unit cells modified with additional body-centric beams (“BC”) or face-crossed beams (“FX”) with beam diameter \documentclass{aastex}\usepackage{amsbsy}\usepackage{amsfonts}\usepackage{amssymb}\usepackage{bm}\usepackage{mathrsfs}\usepackage{pifont}\usepackage{stmaryrd}\usepackage{textcomp}\usepackage{portland, xspace}\usepackage{amsmath, amsxtra}\usepackage{upgreek}\pagestyle{empty}\DeclareMathSizes{10}{9}{7}{6}\begin{document}
$${ \phi}$$
\end{document}, unit cell length l, and shaded areas to indicate pore size p. Color images are available online.
Spinal fusion may be used as an exemplary application for developing design and fabrication approaches to assess mechanical and biological tissue scaffold performance. Compression is the primary mechanical loading case in spinal fusion, with typical spinal loads being up to \documentclass{aastex}\usepackage{amsbsy}\usepackage{amsfonts}\usepackage{amssymb}\usepackage{bm}\usepackage{mathrsfs}\usepackage{pifont}\usepackage{stmaryrd}\usepackage{textcomp}\usepackage{portland, xspace}\usepackage{amsmath, amsxtra}\usepackage{upgreek}\pagestyle{empty}\DeclareMathSizes{10}{9}{7}{6}\begin{document}
$$1.65 \,{ \rm{kN}}$$
\end{document}.20 Scaffolds may be assessed via mechanical compression tests that measure force-displacement responses, and the derivation of their equivalent elastic moduli, to determine their mechanical suitability for spinal loading.21 Bone tissue growth typically requires at least 50% porous scaffold volume, in addition to a high surface area for cell attachment and proliferation.12 A scaffold's suitability for supporting tissue growth may be assessed through in vitro cell culture.22 Mechanical and biological design requirements often conflict, such as a greater porosity for tissue growth reducing mechanical strength, making it essential to consider a range of potential scaffold structures for specified applications. Once scaffold properties are characterized for a range of lattice designs, it is possible to use 3D printing processes to improve performance for specific cases, such as material reinforcements for cages supporting spinal loads.14
Unit cell topologies with varied beam organizations achieve contrasting properties (Fig. 1B), such as unit cells with beams aligned with compressive loading tending to have higher elastic moduli than unit cells with diagonally aligned beams.14 However, topologies with diagonally aligned beams may provide higher surface area and curvature that facilitates tissue growth,22–24 while also better resisting shear loading. To test the influence of beam number and orientation, unit cells can be generated with design parameters for beam diameter \documentclass{aastex}\usepackage{amsbsy}\usepackage{amsfonts}\usepackage{amssymb}\usepackage{bm}\usepackage{mathrsfs}\usepackage{pifont}\usepackage{stmaryrd}\usepackage{textcomp}\usepackage{portland, xspace}\usepackage{amsmath, amsxtra}\usepackage{upgreek}\pagestyle{empty}\DeclareMathSizes{10}{9}{7}{6}\begin{document}
$${ \phi}$$
\end{document} and unit cell length l, which dictate the pore size p. These design parameters provide a basis for altering unit cell designs to form lattices with properties similar to bone and intervertebral disks.25–27 Imaging followed by mechanical and biological testing is required to determine the extent of achievable scaffold properties using the polyjet printing process and to reconcile differences between model and experiment for design optimization.8,28 Once lattices are characterized generally, the hypothesis that polyjet printing processes are suitable for spinal fusion applications may be assessed by testing scaffold dimensions, biocompatibility, and load-bearing capabilities.
Materials and Methods
Design generation
Samples for mechanical and biological testing were designed using python code for automating Abaqus software to generate lattices with specified properties.14 Beam diameter \documentclass{aastex}\usepackage{amsbsy}\usepackage{amsfonts}\usepackage{amssymb}\usepackage{bm}\usepackage{mathrsfs}\usepackage{pifont}\usepackage{stmaryrd}\usepackage{textcomp}\usepackage{portland, xspace}\usepackage{amsmath, amsxtra}\usepackage{upgreek}\pagestyle{empty}\DeclareMathSizes{10}{9}{7}{6}\begin{document}
$${ \phi}$$
\end{document} and unit cell length l parameters were used to generate solid beams patterned as unit cells, which were then patterned as a repeating lattice. Four different unit cells were generated that include a Cube topology with beams on unit cell edges, a BC topology with added internal beams, an FX topology with added beams on unit cell faces, and an FXBC topology that adds both types of beams.
Porosity P was calculated as a unit cell's void volume to nominal volume ratio. Scaffolds have slightly different porosity than unit cells, since beams on a scaffold's border retain their entire cross-section to facilitate manufacturing (i.e., not cut off at the unit cell's nominal volume). Pore size p is calculated as the square root of the smallest planar area that does not intersect with any beams.9,24 Lattices for controlled experimental comparisons were generated by specifying \documentclass{aastex}\usepackage{amsbsy}\usepackage{amsfonts}\usepackage{amssymb}\usepackage{bm}\usepackage{mathrsfs}\usepackage{pifont}\usepackage{stmaryrd}\usepackage{textcomp}\usepackage{portland, xspace}\usepackage{amsmath, amsxtra}\usepackage{upgreek}\pagestyle{empty}\DeclareMathSizes{10}{9}{7}{6}\begin{document}
$${ \phi}$$
\end{document} and then scaling l until a specified P and/or p was reached.
Samples of each topology were designed with fixed \documentclass{aastex}\usepackage{amsbsy}\usepackage{amsfonts}\usepackage{amssymb}\usepackage{bm}\usepackage{mathrsfs}\usepackage{pifont}\usepackage{stmaryrd}\usepackage{textcomp}\usepackage{portland, xspace}\usepackage{amsmath, amsxtra}\usepackage{upgreek}\pagestyle{empty}\DeclareMathSizes{10}{9}{7}{6}\begin{document}
$$P = 0.5$$
\end{document}, \documentclass{aastex}\usepackage{amsbsy}\usepackage{amsfonts}\usepackage{amssymb}\usepackage{bm}\usepackage{mathrsfs}\usepackage{pifont}\usepackage{stmaryrd}\usepackage{textcomp}\usepackage{portland, xspace}\usepackage{amsmath, amsxtra}\usepackage{upgreek}\pagestyle{empty}\DeclareMathSizes{10}{9}{7}{6}\begin{document}
$$P = \;0.65$$
\end{document}, and\documentclass{aastex}\usepackage{amsbsy}\usepackage{amsfonts}\usepackage{amssymb}\usepackage{bm}\usepackage{mathrsfs}\usepackage{pifont}\usepackage{stmaryrd}\usepackage{textcomp}\usepackage{portland, xspace}\usepackage{amsmath, amsxtra}\usepackage{upgreek}\pagestyle{empty}\DeclareMathSizes{10}{9}{7}{6}\begin{document}
$$\;P = 0.8$$
\end{document} for \documentclass{aastex}\usepackage{amsbsy}\usepackage{amsfonts}\usepackage{amssymb}\usepackage{bm}\usepackage{mathrsfs}\usepackage{pifont}\usepackage{stmaryrd}\usepackage{textcomp}\usepackage{portland, xspace}\usepackage{amsmath, amsxtra}\usepackage{upgreek}\pagestyle{empty}\DeclareMathSizes{10}{9}{7}{6}\begin{document}
$${ \phi} = 800 \,{ \rm{ \mu m}}$$
\end{document} beam diameters and patterned with 3 × 3 × 3 unit cells for mechanical testing. These porosities span the range of values generally considered favorable for tissue growth, to ensure there is enough void area for efficient nutrient transport and to provide sufficient void volume for new tissue growth. It is necessary to consider several porosity values since a favorable tuning of porosity is dependent on trade-offs with other scaffold properties, such as pore size, stiffness, and tissue growth rates.3 Samples of each topology were also designed with fixed \documentclass{aastex}\usepackage{amsbsy}\usepackage{amsfonts}\usepackage{amssymb}\usepackage{bm}\usepackage{mathrsfs}\usepackage{pifont}\usepackage{stmaryrd}\usepackage{textcomp}\usepackage{portland, xspace}\usepackage{amsmath, amsxtra}\usepackage{upgreek}\pagestyle{empty}\DeclareMathSizes{10}{9}{7}{6}\begin{document}
$$p = 500 \,{ \rm{ \mu m}}$$
\end{document} for \documentclass{aastex}\usepackage{amsbsy}\usepackage{amsfonts}\usepackage{amssymb}\usepackage{bm}\usepackage{mathrsfs}\usepackage{pifont}\usepackage{stmaryrd}\usepackage{textcomp}\usepackage{portland, xspace}\usepackage{amsmath, amsxtra}\usepackage{upgreek}\pagestyle{empty}\DeclareMathSizes{10}{9}{7}{6}\begin{document}
$${ \phi} = 500 \,{ \rm{ \mu m}}$$
\end{document}. These contrasting beam diameters were chosen since they enable adequate tuning of pore sizes for the chosen porosity ranges, and there is a need to test whether beam diameter size may influence the mechanical stiffness of lattices for each topology.29 Fixed p samples had 3 × 3 × 3 patterning for mechanical testing or a topology-dependent patterning for the maximum unit cell number not to exceed \documentclass{aastex}\usepackage{amsbsy}\usepackage{amsfonts}\usepackage{amssymb}\usepackage{bm}\usepackage{mathrsfs}\usepackage{pifont}\usepackage{stmaryrd}\usepackage{textcomp}\usepackage{portland, xspace}\usepackage{amsmath, amsxtra}\usepackage{upgreek}\pagestyle{empty}\DeclareMathSizes{10}{9}{7}{6}\begin{document}
$$10 \,{ \rm{mm}}$$
\end{document} lattice length, to determine whether number of unit cells influenced elastic modulus. A 3 × 3 × 1 patterning with the single unit cell layer constructed parallel to the build platform (i.e., one unit cell height) was also fabricated by using fixed p samples for cell culture testing. Since a high proportion of 3 × 3 × 1 Cube and FX topologies fractured before cell culture testing, they were replaced with a Cube topology of p = 1000 μm and beam diameter ϕ = 1000 μm design for comparison to \documentclass{aastex}\usepackage{amsbsy}\usepackage{amsfonts}\usepackage{amssymb}\usepackage{bm}\usepackage{mathrsfs}\usepackage{pifont}\usepackage{stmaryrd}\usepackage{textcomp}\usepackage{portland, xspace}\usepackage{amsmath, amsxtra}\usepackage{upgreek}\pagestyle{empty}\DeclareMathSizes{10}{9}{7}{6}\begin{document}
$$p = 500 \,{ \rm{ \mu m}}$$
\end{document} BC and FXBC designs.
Spinal cages were designed to replace an intervertebral disk of \documentclass{aastex}\usepackage{amsbsy}\usepackage{amsfonts}\usepackage{amssymb}\usepackage{bm}\usepackage{mathrsfs}\usepackage{pifont}\usepackage{stmaryrd}\usepackage{textcomp}\usepackage{portland, xspace}\usepackage{amsmath, amsxtra}\usepackage{upgreek}\pagestyle{empty}\DeclareMathSizes{10}{9}{7}{6}\begin{document}
$$6 \,{ \rm{mm}}$$
\end{document} height, which is a typical height when considering the entire spine and representative of a small sample for interfacing with L5 vertebrae.30,31 Cages were generated by selecting a suitable unit cell design that was patterned to form a lattice with an approximate height of \documentclass{aastex}\usepackage{amsbsy}\usepackage{amsfonts}\usepackage{amssymb}\usepackage{bm}\usepackage{mathrsfs}\usepackage{pifont}\usepackage{stmaryrd}\usepackage{textcomp}\usepackage{portland, xspace}\usepackage{amsmath, amsxtra}\usepackage{upgreek}\pagestyle{empty}\DeclareMathSizes{10}{9}{7}{6}\begin{document}
$$6 \,{ \rm{mm}}$$
\end{document} and nominal cross-sectional area of \documentclass{aastex}\usepackage{amsbsy}\usepackage{amsfonts}\usepackage{amssymb}\usepackage{bm}\usepackage{mathrsfs}\usepackage{pifont}\usepackage{stmaryrd}\usepackage{textcomp}\usepackage{portland, xspace}\usepackage{amsmath, amsxtra}\usepackage{upgreek}\pagestyle{empty}\DeclareMathSizes{10}{9}{7}{6}\begin{document}
$$200 \,{ \rm{m}}{{ \rm{m}}^2}$$
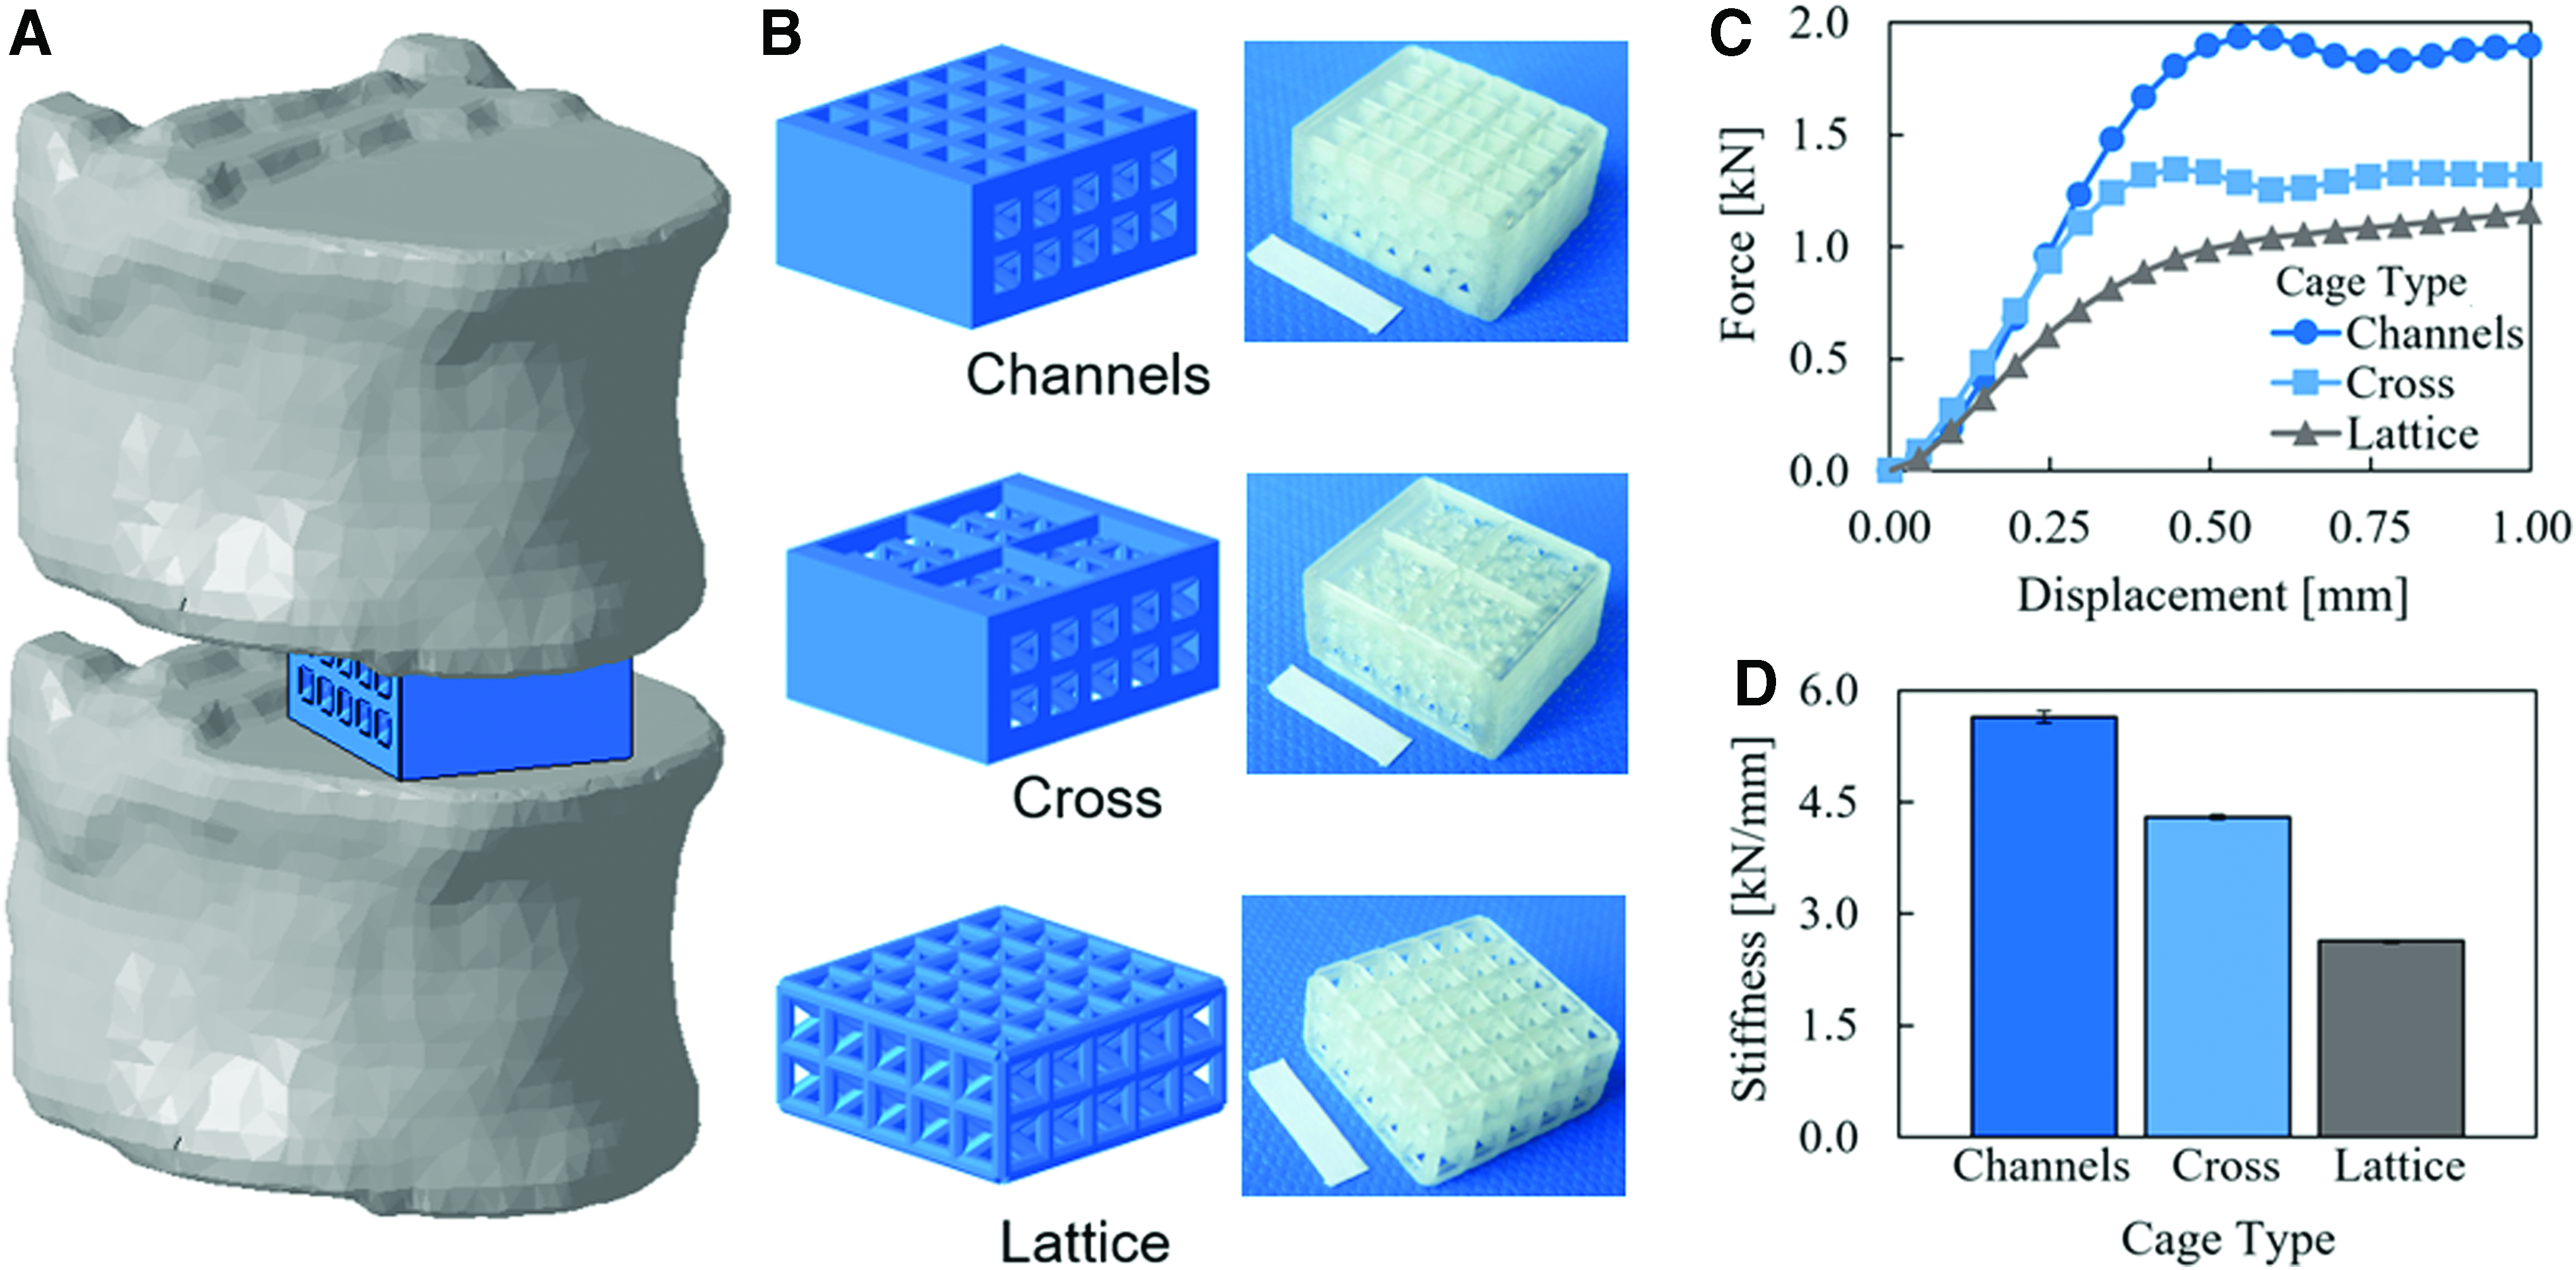
\end{document}. “Cross” and “Channels” cage designs were generated and fabricated for comparison with a base “Lattice” design as a control. Cage variations were designed by cutting lattice beams on faces in half to form a flat boundary. Solid walls were added to one set of opposing lattice faces and then either a cross-beam support for the Cross cage or extension of unit cell boundaries to form long channels with solid walls for the top/bottom face of the Channels cage.
Polyjet printing
Samples were fabricated with a Stratasys Objet500 Connex3 by using biocompatible MED610 polymer and SUP706 support material fully surrounding each sample.14,15 External support material was removed with a razor, whereas internal support material was removed by submerging samples in beakers of 2% NaOH:1% Na2SiO3 solution agitated at \documentclass{aastex}\usepackage{amsbsy}\usepackage{amsfonts}\usepackage{amssymb}\usepackage{bm}\usepackage{mathrsfs}\usepackage{pifont}\usepackage{stmaryrd}\usepackage{textcomp}\usepackage{portland, xspace}\usepackage{amsmath, amsxtra}\usepackage{upgreek}\pagestyle{empty}\DeclareMathSizes{10}{9}{7}{6}\begin{document}
$$60 \,{ \rm{rpm}}$$
\end{document} with intermittent stirring. Samples remained submerged until all dissolvable support material was removed (typically 3–8 h) and then rinsed with water. Dried samples were weighed to determine porosity based on the measured MED610 material density and then measured with calipers to determine nominal dimensions.
Six samples were fabricated for each mechanically tested design. An Olympus IX51 microscope was used to image sample faces. Beam diameters were measured from images with ImageJ software, using at least 10 samplings from multiple beams and points on each beam for each measurement. Select samples were imaged with a Scanco Medical μCT100 (\documentclass{aastex}\usepackage{amsbsy}\usepackage{amsfonts}\usepackage{amssymb}\usepackage{bm}\usepackage{mathrsfs}\usepackage{pifont}\usepackage{stmaryrd}\usepackage{textcomp}\usepackage{portland, xspace}\usepackage{amsmath, amsxtra}\usepackage{upgreek}\pagestyle{empty}\DeclareMathSizes{10}{9}{7}{6}\begin{document}
$$45 \,{ \rm{kVP}}$$
\end{document}, \documentclass{aastex}\usepackage{amsbsy}\usepackage{amsfonts}\usepackage{amssymb}\usepackage{bm}\usepackage{mathrsfs}\usepackage{pifont}\usepackage{stmaryrd}\usepackage{textcomp}\usepackage{portland, xspace}\usepackage{amsmath, amsxtra}\usepackage{upgreek}\pagestyle{empty}\DeclareMathSizes{10}{9}{7}{6}\begin{document}
$$88 \,{ \rm{ \mu A}}$$
\end{document}, \documentclass{aastex}\usepackage{amsbsy}\usepackage{amsfonts}\usepackage{amssymb}\usepackage{bm}\usepackage{mathrsfs}\usepackage{pifont}\usepackage{stmaryrd}\usepackage{textcomp}\usepackage{portland, xspace}\usepackage{amsmath, amsxtra}\usepackage{upgreek}\pagestyle{empty}\DeclareMathSizes{10}{9}{7}{6}\begin{document}
$$4 \,{ \rm{W}}$$
\end{document}, \documentclass{aastex}\usepackage{amsbsy}\usepackage{amsfonts}\usepackage{amssymb}\usepackage{bm}\usepackage{mathrsfs}\usepackage{pifont}\usepackage{stmaryrd}\usepackage{textcomp}\usepackage{portland, xspace}\usepackage{amsmath, amsxtra}\usepackage{upgreek}\pagestyle{empty}\DeclareMathSizes{10}{9}{7}{6}\begin{document}
$$10 \,{ \mathop{ \rm \mu m} \nolimits}$$
\end{document} voxel size). Pore sizes were measured by fitting geometrical shapes to imaged pores and calculating the square root of their area.
Mechanical testing
Mechanical tests were conducted with an Instron E10000 ElectroPuls, under quasi-static compression. Samples were loaded with in-plane layers (i.e., layers aligned with the build platform during fabrication) parallel to the loading plates. Samples were compressed to failure at a rate dependent on their initial dimensions, such that they reached 20% strain after 1 min of loading. Load and displacement data were interpreted by using python code to determine lattice elastic moduli, measured stiffness, and the \documentclass{aastex}\usepackage{amsbsy}\usepackage{amsfonts}\usepackage{amssymb}\usepackage{bm}\usepackage{mathrsfs}\usepackage{pifont}\usepackage{stmaryrd}\usepackage{textcomp}\usepackage{portland, xspace}\usepackage{amsmath, amsxtra}\usepackage{upgreek}\pagestyle{empty}\DeclareMathSizes{10}{9}{7}{6}\begin{document}
$$0.2 \%$$
\end{document} offset yield strength. Nominal sample dimensions were used to find the sample area for calculating these properties. Elastic moduli were calculated as the slope in the linear stress–strain region and reported with standard error. Solid \documentclass{aastex}\usepackage{amsbsy}\usepackage{amsfonts}\usepackage{amssymb}\usepackage{bm}\usepackage{mathrsfs}\usepackage{pifont}\usepackage{stmaryrd}\usepackage{textcomp}\usepackage{portland, xspace}\usepackage{amsmath, amsxtra}\usepackage{upgreek}\pagestyle{empty}\DeclareMathSizes{10}{9}{7}{6}\begin{document}
$$6 \,{ \rm{mm}}$$
\end{document} length cubes were fabricated to determine nominal material properties (\documentclass{aastex}\usepackage{amsbsy}\usepackage{amsfonts}\usepackage{amssymb}\usepackage{bm}\usepackage{mathrsfs}\usepackage{pifont}\usepackage{stmaryrd}\usepackage{textcomp}\usepackage{portland, xspace}\usepackage{amsmath, amsxtra}\usepackage{upgreek}\pagestyle{empty}\DeclareMathSizes{10}{9}{7}{6}\begin{document}
$$1.09 \,{ \rm{mg / m}}{{ \rm{m}}^{ \rm{3}}}$$
\end{document} density and 1800 MPa elastic modulus). Mechanical testing results of lattices reflect mean results from six printed samples, and mechanical testing results for printed cages reflect mean results from four printed samples.
Biological testing
To ensure biocompatibility of MED610, its cytotoxicity was tested by direct contact according to ISO norm 10993-5. Specimens were scraped from MED610 samples and sterilized by soaking in \documentclass{aastex}\usepackage{amsbsy}\usepackage{amsfonts}\usepackage{amssymb}\usepackage{bm}\usepackage{mathrsfs}\usepackage{pifont}\usepackage{stmaryrd}\usepackage{textcomp}\usepackage{portland, xspace}\usepackage{amsmath, amsxtra}\usepackage{upgreek}\pagestyle{empty}\DeclareMathSizes{10}{9}{7}{6}\begin{document}
$$70 \%$$
\end{document} EtOH, followed by 12 h UV light exposure, washing in phosphate-buffered saline (PBS), and soaking in DMEM-F12 for 48–72 h. MED610 samples were compared with untreated controls. Saos-2 cells (human osteosarcoma cell line) were seeded into six-well plates with a seeding density of 150,000 cells per well, cultured in Dulbecco's modified Eagle's medium (DMEM-F12: Gibco; #31330-38, Sigma, St. Louis, MO), and supplemented with 10% fetal calf serum (F7524; Sigma) and 1% antibiotics-antimycotics (15240062; Gibco, Carlsbad, CA) at 37°C/5% CO2 for 24 h before exposure to the MED610. After 48 h, cell viability was determined by MTT assay as previously described32 and calculated relative to untreated control cells that were cultured identically, but without addition of MED610 ( = 100%). The experiment was repeated three times (n = 3).
To determine cell adhesion, scaffolds were sterilized as described earlier. Fibronectin solution (human plasma fibronectin, purified protein; Millipore FC010; \documentclass{aastex}\usepackage{amsbsy}\usepackage{amsfonts}\usepackage{amssymb}\usepackage{bm}\usepackage{mathrsfs}\usepackage{pifont}\usepackage{stmaryrd}\usepackage{textcomp}\usepackage{portland, xspace}\usepackage{amsmath, amsxtra}\usepackage{upgreek}\pagestyle{empty}\DeclareMathSizes{10}{9}{7}{6}\begin{document}
$$0.01 \,{ \rm{mg / mL}}$$
\end{document} in PBS) was added with sufficient volume to cover the scaffold (0.5–1.0 mL) that was then placed for 1–3 days in a cell culture incubator (\documentclass{aastex}\usepackage{amsbsy}\usepackage{amsfonts}\usepackage{amssymb}\usepackage{bm}\usepackage{mathrsfs}\usepackage{pifont}\usepackage{stmaryrd}\usepackage{textcomp}\usepackage{portland, xspace}\usepackage{amsmath, amsxtra}\usepackage{upgreek}\pagestyle{empty}\DeclareMathSizes{10}{9}{7}{6}\begin{document}
$$37^ \circ { \rm{ / }}5 \% \;{ \rm{C}}{{ \rm{O}}_2}$$
\end{document}). After removal from fibronectin solutions, scaffolds were incubated up to 1 week in complete culture medium, with one to two medium exchanges. Pretreated scaffolds were seeded by dropping 40–50 μL Saos-2 cell suspension (1.7 × 10⁷ cells/mL; 680,000–850,000 cells) on an in-plane scaffold face, based on the largest volume of liquid possible to remain contained within the scaffold. Scaffolds were then drip-dried on sterile gauze. Saos-2 cells were chosen because they facilitate efficient experiments and possess properties similar to osteoblasts that are the basis of bone growth.33,34 Freshly seeded lattices were placed in the cell culture incubator for 20–30 min before adding complete cell culture medium. Seeded samples were left in the incubator with regular exchanges of medium every 3–5 days. After 2 and 5 weeks culture time, scaffolds were stained overnight at 4°C with Phalloidin Alexa Fluor® 568 (#A12380; ThermoScientific) in the concentration of \documentclass{aastex}\usepackage{amsbsy}\usepackage{amsfonts}\usepackage{amssymb}\usepackage{bm}\usepackage{mathrsfs}\usepackage{pifont}\usepackage{stmaryrd}\usepackage{textcomp}\usepackage{portland, xspace}\usepackage{amsmath, amsxtra}\usepackage{upgreek}\pagestyle{empty}\DeclareMathSizes{10}{9}{7}{6}\begin{document}
$$1 \,{ \rm{ \mu L}}$$
\end{document} (\documentclass{aastex}\usepackage{amsbsy}\usepackage{amsfonts}\usepackage{amssymb}\usepackage{bm}\usepackage{mathrsfs}\usepackage{pifont}\usepackage{stmaryrd}\usepackage{textcomp}\usepackage{portland, xspace}\usepackage{amsmath, amsxtra}\usepackage{upgreek}\pagestyle{empty}\DeclareMathSizes{10}{9}{7}{6}\begin{document}
$$200 \,{ \rm{U / mL}}$$
\end{document}) per \documentclass{aastex}\usepackage{amsbsy}\usepackage{amsfonts}\usepackage{amssymb}\usepackage{bm}\usepackage{mathrsfs}\usepackage{pifont}\usepackage{stmaryrd}\usepackage{textcomp}\usepackage{portland, xspace}\usepackage{amsmath, amsxtra}\usepackage{upgreek}\pagestyle{empty}\DeclareMathSizes{10}{9}{7}{6}\begin{document}
$$500 \,{ \rm{ \mu L}}$$
\end{document} PBS supplemented with 1% bovine serum albumin to highlight stress fibers with DAPI (#62248; ThermoScientific; 1:10,000) to highlight nuclei (n = 4). Stained cells were imaged with a TCS SP8 confocal microscope and processed with ImageJ.
Results
Lattice measurements
Samples printed with fixed porosity P and pore size p were fabricated. However, there were frequent failures for \documentclass{aastex}\usepackage{amsbsy}\usepackage{amsfonts}\usepackage{amssymb}\usepackage{bm}\usepackage{mathrsfs}\usepackage{pifont}\usepackage{stmaryrd}\usepackage{textcomp}\usepackage{portland, xspace}\usepackage{amsmath, amsxtra}\usepackage{upgreek}\pagestyle{empty}\DeclareMathSizes{10}{9}{7}{6}\begin{document}
$$P = 0.65$$
\end{document}/\documentclass{aastex}\usepackage{amsbsy}\usepackage{amsfonts}\usepackage{amssymb}\usepackage{bm}\usepackage{mathrsfs}\usepackage{pifont}\usepackage{stmaryrd}\usepackage{textcomp}\usepackage{portland, xspace}\usepackage{amsmath, amsxtra}\usepackage{upgreek}\pagestyle{empty}\DeclareMathSizes{10}{9}{7}{6}\begin{document}
$$P = 0.8$$
\end{document} Cube topologies and 3 × 3 × 1 Cube/FX topologies (Fig. 2).
Fabricated samples with porosities \documentclass{aastex}\usepackage{amsbsy}\usepackage{amsfonts}\usepackage{amssymb}\usepackage{bm}\usepackage{mathrsfs}\usepackage{pifont}\usepackage{stmaryrd}\usepackage{textcomp}\usepackage{portland, xspace}\usepackage{amsmath, amsxtra}\usepackage{upgreek}\pagestyle{empty}\DeclareMathSizes{10}{9}{7}{6}\begin{document}
$$P = 0.5$$
\end{document}, \documentclass{aastex}\usepackage{amsbsy}\usepackage{amsfonts}\usepackage{amssymb}\usepackage{bm}\usepackage{mathrsfs}\usepackage{pifont}\usepackage{stmaryrd}\usepackage{textcomp}\usepackage{portland, xspace}\usepackage{amsmath, amsxtra}\usepackage{upgreek}\pagestyle{empty}\DeclareMathSizes{10}{9}{7}{6}\begin{document}
$$P = 0.65$$
\end{document}, and \documentclass{aastex}\usepackage{amsbsy}\usepackage{amsfonts}\usepackage{amssymb}\usepackage{bm}\usepackage{mathrsfs}\usepackage{pifont}\usepackage{stmaryrd}\usepackage{textcomp}\usepackage{portland, xspace}\usepackage{amsmath, amsxtra}\usepackage{upgreek}\pagestyle{empty}\DeclareMathSizes{10}{9}{7}{6}\begin{document}
$$P = 0.8$$
\end{document} for Cube/FX topologies and pore size \documentclass{aastex}\usepackage{amsbsy}\usepackage{amsfonts}\usepackage{amssymb}\usepackage{bm}\usepackage{mathrsfs}\usepackage{pifont}\usepackage{stmaryrd}\usepackage{textcomp}\usepackage{portland, xspace}\usepackage{amsmath, amsxtra}\usepackage{upgreek}\pagestyle{empty}\DeclareMathSizes{10}{9}{7}{6}\begin{document}
$$p = 500 \,{ \rm{ \mu m}}$$
\end{document} for BC/FXBC topologies (1 cm length indicator). Color images are available online.
Typically, failures occurred due to a layer of in-plane beams breaking from out-of-plane beams (Fig. 2, far right Cube sample) during support material cleaning or cell culture preparation. Due to the low number of surviving samples for these designs, their measurements were excluded from this study. Elastic moduli were determined with standard error and tabulated with dimension and porosity measurements that had negligible standard error (Table 1).
Measurements for Fabricated Samples
Lattice design
Mean measurements
Topology
Diameter (μm)
Length (mm)
Porosity (—)
Length (mm)
Height (mm)
Weight (mg)
Porosity (—)
Elastic modulus (MPa)
Porosity controlled
Cube
800
5.8
0.48
5.8
5.8
94.2
0.56
118.0 ± 7.7
Cube
800
8.6
0.66
—
—
—
—
—
Cube
800
10.1
0.80
—
—
—
—
—
BC
800
8.6
0.50
8.6
8.7
303.2
0.57
117.0 ± 2.8
BC
800
10.7
0.64
10.8
10.8
414.3
0.70
43.2 ± 2.3
BC
800
15.2
0.80
15.2
15.4
632.3
0.84
16.3 ± 0.5
FX
800
10.0
0.51
10.1
10.1
500.8
0.55
155.7 ± 9.9
FX
800
12.7
0.65
12.8
12.8
709.9
0.69
84.8 ± 3.0
FX
800
17.6
0.80
17.7
17.9
1043.5
0.83
21.9 ± 3.2
FXBC
800
12.2
0.50
12.3
12.4
901.3
0.56
140.7 ± 1.7
FXBC
800
15.3
0.65
15.4
15.6
1197.4
0.70
63.6 ± 3.7
FXBC
800
22.4
0.81
22.5
22.8
1902.1
0.85
17.8 ± 1.5
Pore size controlled
Cube
500
3.5
0.53
3.5
3.6
22.2
0.54
38.0 ± 2.6
Cube
500
9.5
0.54
9.6
9.7
419.0
0.57
52.3 ± 7.1
BC
500
6.1
0.59
6.1
6.1
94.0
0.62
39.3 ± 1.9
BC
500
9.8
0.58
9.9
9.9
379.7
0.64
39.4 ± 1.8
FX
500
7.1
0.58
7.2
7.2
152.5
0.62
25.8 ± 10.1
FX
500
9.3
0.60
9.4
9.4
314.9
0.65
23.8 ± 3.3
FXBC
500
7.1
0.44
7.2
7.2
196.0
0.52
73.3 ± 2.9
FXBC
500
9.3
0.45
9.4
9.4
427.7
0.53
84.0 ± 1.3
Measured nominal dimensions of samples were generally accurate, with \documentclass{aastex}\usepackage{amsbsy}\usepackage{amsfonts}\usepackage{amssymb}\usepackage{bm}\usepackage{mathrsfs}\usepackage{pifont}\usepackage{stmaryrd}\usepackage{textcomp}\usepackage{portland, xspace}\usepackage{amsmath, amsxtra}\usepackage{upgreek}\pagestyle{empty}\DeclareMathSizes{10}{9}{7}{6}\begin{document}
$$3 \%$$
\end{document} being the greatest difference between measured and designed dimensions. Samples were at most \documentclass{aastex}\usepackage{amsbsy}\usepackage{amsfonts}\usepackage{amssymb}\usepackage{bm}\usepackage{mathrsfs}\usepackage{pifont}\usepackage{stmaryrd}\usepackage{textcomp}\usepackage{portland, xspace}\usepackage{amsmath, amsxtra}\usepackage{upgreek}\pagestyle{empty}\DeclareMathSizes{10}{9}{7}{6}\begin{document}
$$0.1 \,{ \rm{mm}}$$
\end{document} larger in length and \documentclass{aastex}\usepackage{amsbsy}\usepackage{amsfonts}\usepackage{amssymb}\usepackage{bm}\usepackage{mathrsfs}\usepackage{pifont}\usepackage{stmaryrd}\usepackage{textcomp}\usepackage{portland, xspace}\usepackage{amsmath, amsxtra}\usepackage{upgreek}\pagestyle{empty}\DeclareMathSizes{10}{9}{7}{6}\begin{document}
$$0.4 \,{ \rm{mm}}$$
\end{document} larger in height than designed, and no scaffolds had smaller nominal dimensions than designed. Measured porosity ranged from \documentclass{aastex}\usepackage{amsbsy}\usepackage{amsfonts}\usepackage{amssymb}\usepackage{bm}\usepackage{mathrsfs}\usepackage{pifont}\usepackage{stmaryrd}\usepackage{textcomp}\usepackage{portland, xspace}\usepackage{amsmath, amsxtra}\usepackage{upgreek}\pagestyle{empty}\DeclareMathSizes{10}{9}{7}{6}\begin{document}
$$0.01$$
\end{document} to \documentclass{aastex}\usepackage{amsbsy}\usepackage{amsfonts}\usepackage{amssymb}\usepackage{bm}\usepackage{mathrsfs}\usepackage{pifont}\usepackage{stmaryrd}\usepackage{textcomp}\usepackage{portland, xspace}\usepackage{amsmath, amsxtra}\usepackage{upgreek}\pagestyle{empty}\DeclareMathSizes{10}{9}{7}{6}\begin{document}
$$0.08$$
\end{document} higher than designed, with an average difference of \documentclass{aastex}\usepackage{amsbsy}\usepackage{amsfonts}\usepackage{amssymb}\usepackage{bm}\usepackage{mathrsfs}\usepackage{pifont}\usepackage{stmaryrd}\usepackage{textcomp}\usepackage{portland, xspace}\usepackage{amsmath, amsxtra}\usepackage{upgreek}\pagestyle{empty}\DeclareMathSizes{10}{9}{7}{6}\begin{document}
$$0.05$$
\end{document}.
Microscopy of in-plane lattice faces (i.e., face constructed parallel to build platform) and out-of-plane faces were analyzed to determine mean beam diameter measurements, with beams grouped according to their relative orientation. FXBC samples designed with ϕ = 800 and 500 μm were chosen as representative samples (Table 2). Mean beam diameter measures are plotted in Figure 3 for each beam orientation, with corresponding microscopy images.
Mean Beam Diameter Measurements with Standard Error
Lattice design
Mean diameter measurements
Topology
Beam diameter (μm)
Out-of-plane 0° (μm)
Out-of-plane 45° (μm)
Out-of-plane 90° (μm)
In-plane 0° (μm)
In-plane 45° (μm)
FXBC
800
740.3 ± 9.3
710.1 ± 8.8
752.8 ± 20.1
759.0 ± 9.4
729.3 ± 4.5
FXBC
500
421.6 ± 6.9
425.0 ± 6.7
522.5 ± 6.3
566.7 ± 6.1
476.9 ± 10.6
(A) FXBC out-of-plane and in-plane faces (500 μm scale bars). (B) Measured mean beam diameters categorized by relative angle, with standard deviation. Color images are available online.
Out-of-plane beams were grouped as \documentclass{aastex}\usepackage{amsbsy}\usepackage{amsfonts}\usepackage{amssymb}\usepackage{bm}\usepackage{mathrsfs}\usepackage{pifont}\usepackage{stmaryrd}\usepackage{textcomp}\usepackage{portland, xspace}\usepackage{amsmath, amsxtra}\usepackage{upgreek}\pagestyle{empty}\DeclareMathSizes{10}{9}{7}{6}\begin{document}
$$0^ \circ$$
\end{document}, \documentclass{aastex}\usepackage{amsbsy}\usepackage{amsfonts}\usepackage{amssymb}\usepackage{bm}\usepackage{mathrsfs}\usepackage{pifont}\usepackage{stmaryrd}\usepackage{textcomp}\usepackage{portland, xspace}\usepackage{amsmath, amsxtra}\usepackage{upgreek}\pagestyle{empty}\DeclareMathSizes{10}{9}{7}{6}\begin{document}
$$45^ \circ$$
\end{document}, and \documentclass{aastex}\usepackage{amsbsy}\usepackage{amsfonts}\usepackage{amssymb}\usepackage{bm}\usepackage{mathrsfs}\usepackage{pifont}\usepackage{stmaryrd}\usepackage{textcomp}\usepackage{portland, xspace}\usepackage{amsmath, amsxtra}\usepackage{upgreek}\pagestyle{empty}\DeclareMathSizes{10}{9}{7}{6}\begin{document}
$$90^ \circ$$
\end{document}, such that \documentclass{aastex}\usepackage{amsbsy}\usepackage{amsfonts}\usepackage{amssymb}\usepackage{bm}\usepackage{mathrsfs}\usepackage{pifont}\usepackage{stmaryrd}\usepackage{textcomp}\usepackage{portland, xspace}\usepackage{amsmath, amsxtra}\usepackage{upgreek}\pagestyle{empty}\DeclareMathSizes{10}{9}{7}{6}\begin{document}
$$90^ \circ$$
\end{document} beams were constructed with layers perpendicular to the build platform. Mean out-of-plane beam diameters were between 47 and 81 μm smaller than designed, with the exception of \documentclass{aastex}\usepackage{amsbsy}\usepackage{amsfonts}\usepackage{amssymb}\usepackage{bm}\usepackage{mathrsfs}\usepackage{pifont}\usepackage{stmaryrd}\usepackage{textcomp}\usepackage{portland, xspace}\usepackage{amsmath, amsxtra}\usepackage{upgreek}\pagestyle{empty}\DeclareMathSizes{10}{9}{7}{6}\begin{document}
$$90^ \circ$$
\end{document} beams for the \documentclass{aastex}\usepackage{amsbsy}\usepackage{amsfonts}\usepackage{amssymb}\usepackage{bm}\usepackage{mathrsfs}\usepackage{pifont}\usepackage{stmaryrd}\usepackage{textcomp}\usepackage{portland, xspace}\usepackage{amsmath, amsxtra}\usepackage{upgreek}\pagestyle{empty}\DeclareMathSizes{10}{9}{7}{6}\begin{document}
$${ \phi} = 500 \,{ \rm{ \mu m}}$$
\end{document} sample measuring \documentclass{aastex}\usepackage{amsbsy}\usepackage{amsfonts}\usepackage{amssymb}\usepackage{bm}\usepackage{mathrsfs}\usepackage{pifont}\usepackage{stmaryrd}\usepackage{textcomp}\usepackage{portland, xspace}\usepackage{amsmath, amsxtra}\usepackage{upgreek}\pagestyle{empty}\DeclareMathSizes{10}{9}{7}{6}\begin{document}
$$23 \,{ \rm{ \mu m}}$$
\end{document} larger than designed. The \documentclass{aastex}\usepackage{amsbsy}\usepackage{amsfonts}\usepackage{amssymb}\usepackage{bm}\usepackage{mathrsfs}\usepackage{pifont}\usepackage{stmaryrd}\usepackage{textcomp}\usepackage{portland, xspace}\usepackage{amsmath, amsxtra}\usepackage{upgreek}\pagestyle{empty}\DeclareMathSizes{10}{9}{7}{6}\begin{document}
$$0^ \circ$$
\end{document} and \documentclass{aastex}\usepackage{amsbsy}\usepackage{amsfonts}\usepackage{amssymb}\usepackage{bm}\usepackage{mathrsfs}\usepackage{pifont}\usepackage{stmaryrd}\usepackage{textcomp}\usepackage{portland, xspace}\usepackage{amsmath, amsxtra}\usepackage{upgreek}\pagestyle{empty}\DeclareMathSizes{10}{9}{7}{6}\begin{document}
$$90^ \circ$$
\end{document} in-plane beams were grouped together since they are not differentiable by build layer artifacts. For the \documentclass{aastex}\usepackage{amsbsy}\usepackage{amsfonts}\usepackage{amssymb}\usepackage{bm}\usepackage{mathrsfs}\usepackage{pifont}\usepackage{stmaryrd}\usepackage{textcomp}\usepackage{portland, xspace}\usepackage{amsmath, amsxtra}\usepackage{upgreek}\pagestyle{empty}\DeclareMathSizes{10}{9}{7}{6}\begin{document}
$${ \phi} = 800 \,{ \rm{ \mu m}}$$
\end{document} sample, in-plane 0° beams were \documentclass{aastex}\usepackage{amsbsy}\usepackage{amsfonts}\usepackage{amssymb}\usepackage{bm}\usepackage{mathrsfs}\usepackage{pifont}\usepackage{stmaryrd}\usepackage{textcomp}\usepackage{portland, xspace}\usepackage{amsmath, amsxtra}\usepackage{upgreek}\pagestyle{empty}\DeclareMathSizes{10}{9}{7}{6}\begin{document}
$$40 \,{ \rm{ \mu m}}$$
\end{document} smaller than designed on average whereas \documentclass{aastex}\usepackage{amsbsy}\usepackage{amsfonts}\usepackage{amssymb}\usepackage{bm}\usepackage{mathrsfs}\usepackage{pifont}\usepackage{stmaryrd}\usepackage{textcomp}\usepackage{portland, xspace}\usepackage{amsmath, amsxtra}\usepackage{upgreek}\pagestyle{empty}\DeclareMathSizes{10}{9}{7}{6}\begin{document}
$$45^ \circ$$
\end{document} beams were \documentclass{aastex}\usepackage{amsbsy}\usepackage{amsfonts}\usepackage{amssymb}\usepackage{bm}\usepackage{mathrsfs}\usepackage{pifont}\usepackage{stmaryrd}\usepackage{textcomp}\usepackage{portland, xspace}\usepackage{amsmath, amsxtra}\usepackage{upgreek}\pagestyle{empty}\DeclareMathSizes{10}{9}{7}{6}\begin{document}
$$70 \,{ \rm{ \mu m}}$$
\end{document} smaller. In-plane \documentclass{aastex}\usepackage{amsbsy}\usepackage{amsfonts}\usepackage{amssymb}\usepackage{bm}\usepackage{mathrsfs}\usepackage{pifont}\usepackage{stmaryrd}\usepackage{textcomp}\usepackage{portland, xspace}\usepackage{amsmath, amsxtra}\usepackage{upgreek}\pagestyle{empty}\DeclareMathSizes{10}{9}{7}{6}\begin{document}
$$0^ \circ$$
\end{document} beams for the \documentclass{aastex}\usepackage{amsbsy}\usepackage{amsfonts}\usepackage{amssymb}\usepackage{bm}\usepackage{mathrsfs}\usepackage{pifont}\usepackage{stmaryrd}\usepackage{textcomp}\usepackage{portland, xspace}\usepackage{amsmath, amsxtra}\usepackage{upgreek}\pagestyle{empty}\DeclareMathSizes{10}{9}{7}{6}\begin{document}
$${ \phi} = 500 \,{ \rm{ \mu m}}$$
\end{document} sample were \documentclass{aastex}\usepackage{amsbsy}\usepackage{amsfonts}\usepackage{amssymb}\usepackage{bm}\usepackage{mathrsfs}\usepackage{pifont}\usepackage{stmaryrd}\usepackage{textcomp}\usepackage{portland, xspace}\usepackage{amsmath, amsxtra}\usepackage{upgreek}\pagestyle{empty}\DeclareMathSizes{10}{9}{7}{6}\begin{document}
$$67 \,{ \rm{ \mu m}}$$
\end{document} larger on average, whereas \documentclass{aastex}\usepackage{amsbsy}\usepackage{amsfonts}\usepackage{amssymb}\usepackage{bm}\usepackage{mathrsfs}\usepackage{pifont}\usepackage{stmaryrd}\usepackage{textcomp}\usepackage{portland, xspace}\usepackage{amsmath, amsxtra}\usepackage{upgreek}\pagestyle{empty}\DeclareMathSizes{10}{9}{7}{6}\begin{document}
$$45^ \circ$$
\end{document} beams were \documentclass{aastex}\usepackage{amsbsy}\usepackage{amsfonts}\usepackage{amssymb}\usepackage{bm}\usepackage{mathrsfs}\usepackage{pifont}\usepackage{stmaryrd}\usepackage{textcomp}\usepackage{portland, xspace}\usepackage{amsmath, amsxtra}\usepackage{upgreek}\pagestyle{empty}\DeclareMathSizes{10}{9}{7}{6}\begin{document}
$$23 \,{ \rm{ \mu m}}$$
\end{document} smaller.
When plotting the elastic moduli of designs from Table 1 according to their porosity, all topologies demonstrate lower elastic moduli with increasing porosity for samples of ϕ = 800 and 500 μm (Fig. 4); mean elastic moduli with standard error for Figure 4 measurements are presented in Table 1. There is additionally a decrease of elastic modulus with decreasing beam diameter, for a given porosity value. These findings suggest that samples with smaller beam diameters are potentially more subject to failure due to fabrication defects having a larger proportional influence on performance.
Mean elastic modulus for Table 1 designs (closed symbols for beam diameter\documentclass{aastex}\usepackage{amsbsy}\usepackage{amsfonts}\usepackage{amssymb}\usepackage{bm}\usepackage{mathrsfs}\usepackage{pifont}\usepackage{stmaryrd}\usepackage{textcomp}\usepackage{portland, xspace}\usepackage{amsmath, amsxtra}\usepackage{upgreek}\pagestyle{empty}\DeclareMathSizes{10}{9}{7}{6}\begin{document}
$$\;{ \phi} = 800 \,{ \rm{ \mu m}}$$
\end{document}, open symbols for \documentclass{aastex}\usepackage{amsbsy}\usepackage{amsfonts}\usepackage{amssymb}\usepackage{bm}\usepackage{mathrsfs}\usepackage{pifont}\usepackage{stmaryrd}\usepackage{textcomp}\usepackage{portland, xspace}\usepackage{amsmath, amsxtra}\usepackage{upgreek}\pagestyle{empty}\DeclareMathSizes{10}{9}{7}{6}\begin{document}
$${ \phi} = 500 \,{ \rm{ \mu m}}$$
\end{document}), with standard deviation.
Cell culture
After 48 h of incubation, the MED610 had a mean \documentclass{aastex}\usepackage{amsbsy}\usepackage{amsfonts}\usepackage{amssymb}\usepackage{bm}\usepackage{mathrsfs}\usepackage{pifont}\usepackage{stmaryrd}\usepackage{textcomp}\usepackage{portland, xspace}\usepackage{amsmath, amsxtra}\usepackage{upgreek}\pagestyle{empty}\DeclareMathSizes{10}{9}{7}{6}\begin{document}
$$95.6 \%$$
\end{document} cell count relative to the control (\documentclass{aastex}\usepackage{amsbsy}\usepackage{amsfonts}\usepackage{amssymb}\usepackage{bm}\usepackage{mathrsfs}\usepackage{pifont}\usepackage{stmaryrd}\usepackage{textcomp}\usepackage{portland, xspace}\usepackage{amsmath, amsxtra}\usepackage{upgreek}\pagestyle{empty}\DeclareMathSizes{10}{9}{7}{6}\begin{document}
$$2.0 \%$$
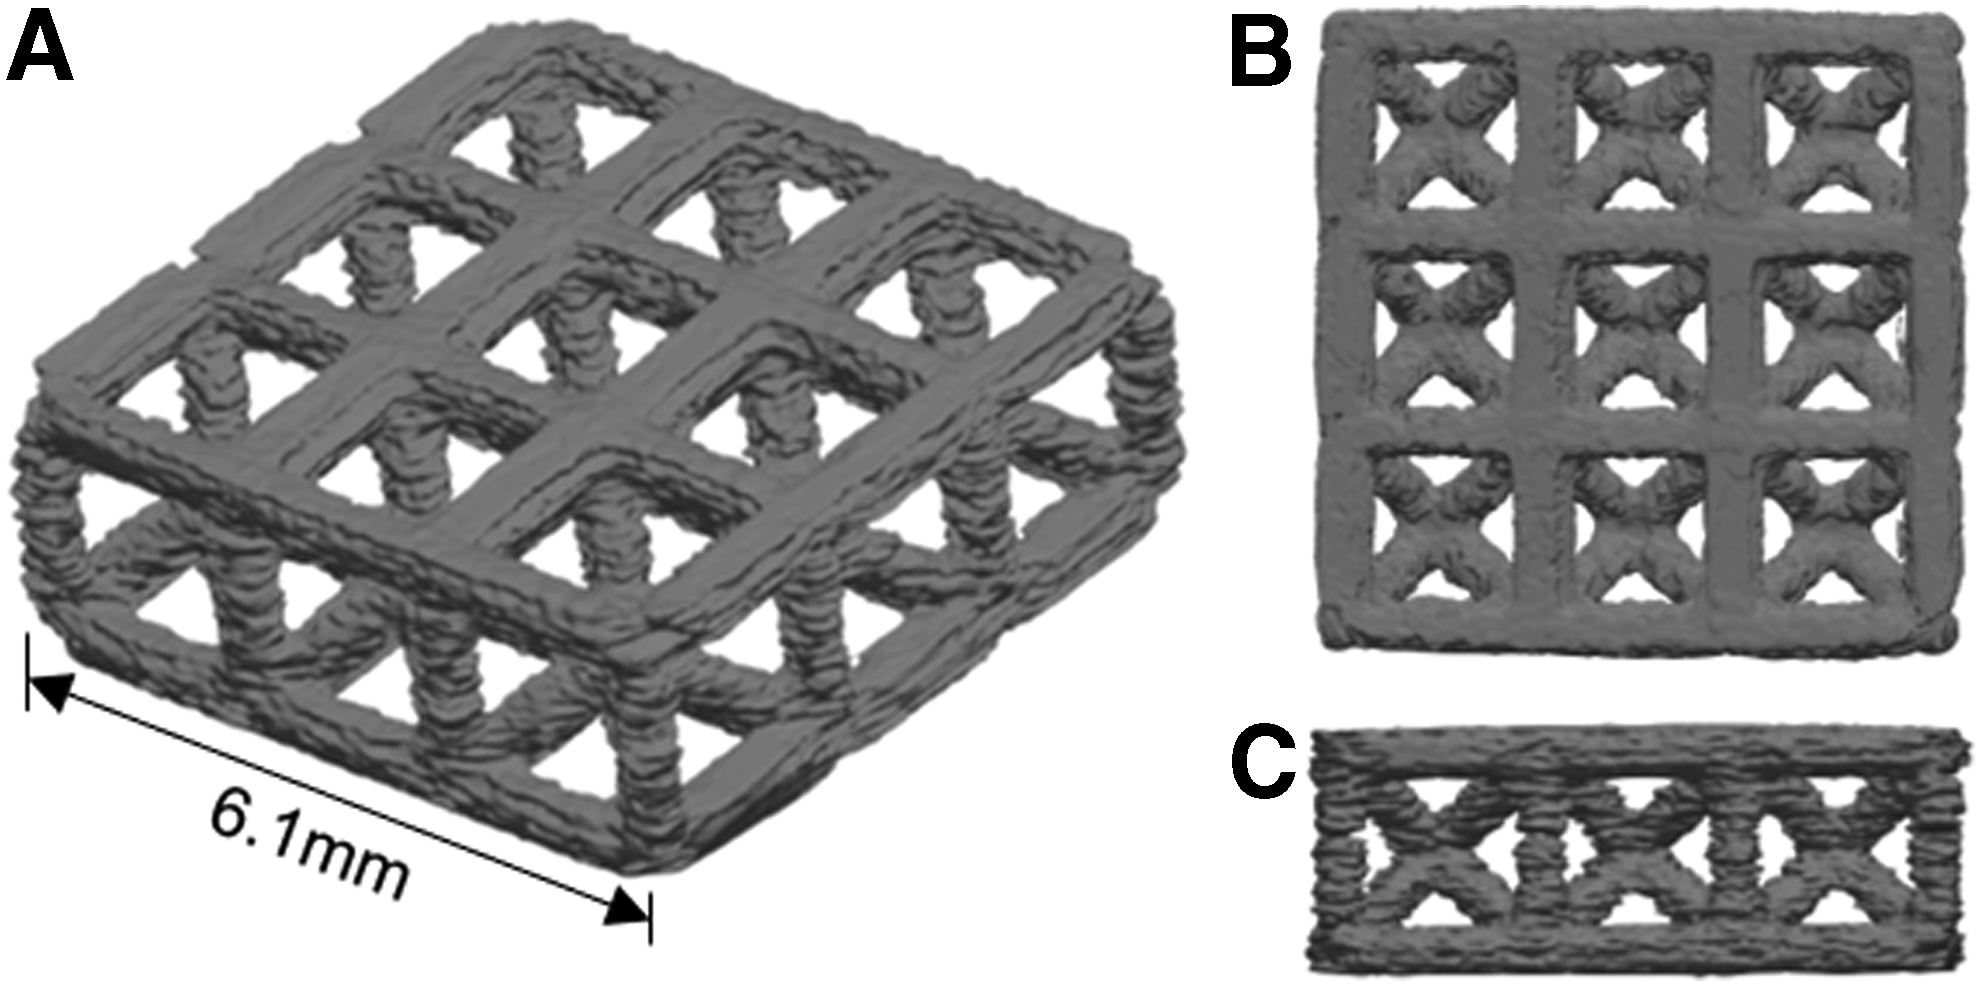
\end{document} standard deviation). The BC cell culture samples were imaged by using micro-computed tomography (μCT) analysis to determine the accuracy of their internal pore size (Fig. 5).
(A) μCT imaging of BC sample with beam diameter \documentclass{aastex}\usepackage{amsbsy}\usepackage{amsfonts}\usepackage{amssymb}\usepackage{bm}\usepackage{mathrsfs}\usepackage{pifont}\usepackage{stmaryrd}\usepackage{textcomp}\usepackage{portland, xspace}\usepackage{amsmath, amsxtra}\usepackage{upgreek}\pagestyle{empty}\DeclareMathSizes{10}{9}{7}{6}\begin{document}
$${ \phi} = 500 \,{ \rm{ \mu m}}$$
\end{document} and unit cell length \documentclass{aastex}\usepackage{amsbsy}\usepackage{amsfonts}\usepackage{amssymb}\usepackage{bm}\usepackage{mathrsfs}\usepackage{pifont}\usepackage{stmaryrd}\usepackage{textcomp}\usepackage{portland, xspace}\usepackage{amsmath, amsxtra}\usepackage{upgreek}\pagestyle{empty}\DeclareMathSizes{10}{9}{7}{6}\begin{document}
$$l = 1.85 \,{ \rm{mm}}$$
\end{document}, including (B) in-plane (C) and out-of-plane perspectives. μCT, micro-computed tomography.
Aggregate pore size measurements are presented in Table 3. The BC pores have the same in-plane and out-of-plane measurements since they reflect the measurement of an internal plane oriented at 45° relative to the original build direction. Measured BC pore sizes ranged from 490 to \documentclass{aastex}\usepackage{amsbsy}\usepackage{amsfonts}\usepackage{amssymb}\usepackage{bm}\usepackage{mathrsfs}\usepackage{pifont}\usepackage{stmaryrd}\usepackage{textcomp}\usepackage{portland, xspace}\usepackage{amsmath, amsxtra}\usepackage{upgreek}\pagestyle{empty}\DeclareMathSizes{10}{9}{7}{6}\begin{document}
$$570 \,{ \rm{ \mu m}}$$
\end{document}, with a mean of \documentclass{aastex}\usepackage{amsbsy}\usepackage{amsfonts}\usepackage{amssymb}\usepackage{bm}\usepackage{mathrsfs}\usepackage{pifont}\usepackage{stmaryrd}\usepackage{textcomp}\usepackage{portland, xspace}\usepackage{amsmath, amsxtra}\usepackage{upgreek}\pagestyle{empty}\DeclareMathSizes{10}{9}{7}{6}\begin{document}
$$534 \,{ \rm{ \mu m}}$$
\end{document}. The μCT imaging of BC sample for out-of-plane and in-plane faces demonstrates that open pores remain interconnected throughout the entire structure. Pore sizes for the FXBC sample were measured as \documentclass{aastex}\usepackage{amsbsy}\usepackage{amsfonts}\usepackage{amssymb}\usepackage{bm}\usepackage{mathrsfs}\usepackage{pifont}\usepackage{stmaryrd}\usepackage{textcomp}\usepackage{portland, xspace}\usepackage{amsmath, amsxtra}\usepackage{upgreek}\pagestyle{empty}\DeclareMathSizes{10}{9}{7}{6}\begin{document}
$$321 \,{ \rm{ \mu m}}$$
\end{document} on the in-plane face and \documentclass{aastex}\usepackage{amsbsy}\usepackage{amsfonts}\usepackage{amssymb}\usepackage{bm}\usepackage{mathrsfs}\usepackage{pifont}\usepackage{stmaryrd}\usepackage{textcomp}\usepackage{portland, xspace}\usepackage{amsmath, amsxtra}\usepackage{upgreek}\pagestyle{empty}\DeclareMathSizes{10}{9}{7}{6}\begin{document}
$$586 \,{ \rm{ \mu m}}$$
\end{document} on the out-of-plane face, whereas pores on the Cube face measured \documentclass{aastex}\usepackage{amsbsy}\usepackage{amsfonts}\usepackage{amssymb}\usepackage{bm}\usepackage{mathrsfs}\usepackage{pifont}\usepackage{stmaryrd}\usepackage{textcomp}\usepackage{portland, xspace}\usepackage{amsmath, amsxtra}\usepackage{upgreek}\pagestyle{empty}\DeclareMathSizes{10}{9}{7}{6}\begin{document}
$$968 \,{ \rm{ \mu m}}$$
\end{document} for in-plane pores and \documentclass{aastex}\usepackage{amsbsy}\usepackage{amsfonts}\usepackage{amssymb}\usepackage{bm}\usepackage{mathrsfs}\usepackage{pifont}\usepackage{stmaryrd}\usepackage{textcomp}\usepackage{portland, xspace}\usepackage{amsmath, amsxtra}\usepackage{upgreek}\pagestyle{empty}\DeclareMathSizes{10}{9}{7}{6}\begin{document}
$$974 \,{ \rm{ \mu m}}$$
\end{document} for out-of-plane pores; standard error for all measurements was less than \documentclass{aastex}\usepackage{amsbsy}\usepackage{amsfonts}\usepackage{amssymb}\usepackage{bm}\usepackage{mathrsfs}\usepackage{pifont}\usepackage{stmaryrd}\usepackage{textcomp}\usepackage{portland, xspace}\usepackage{amsmath, amsxtra}\usepackage{upgreek}\pagestyle{empty}\DeclareMathSizes{10}{9}{7}{6}\begin{document}
$$11 \,{ \rm{ \mu m}}$$
\end{document}. All measured pores were within the 200–1000 μm range suitable for bone tissue engineering.12
Pore Size Measurements with Standard Error
Lattice design
Mean pore size measurements
Topology
Beam diameter (μm)
Unit cell length (mm)
In-plane (μm)
Out-of-plane (μm)
Cube
1000
2.00
968 ± 10
974 ± 10
BC
500
1.85
534 ± 5
534 ± 5
FXBC
500
2.20
320 ± 6
587 ± 10
Confocal imaging for each design after 2 and 5 weeks culture time with Saos-2 cells is presented in Figure 6, with selected images representing typical areas of growth for each design.
Confocal imaging for Cube (pore size p = 1000 μm), BC (\documentclass{aastex}\usepackage{amsbsy}\usepackage{amsfonts}\usepackage{amssymb}\usepackage{bm}\usepackage{mathrsfs}\usepackage{pifont}\usepackage{stmaryrd}\usepackage{textcomp}\usepackage{portland, xspace}\usepackage{amsmath, amsxtra}\usepackage{upgreek}\pagestyle{empty}\DeclareMathSizes{10}{9}{7}{6}\begin{document}
$$p = 500 \,{ \rm{ \mu m}}$$
\end{document}), and FXBC (\documentclass{aastex}\usepackage{amsbsy}\usepackage{amsfonts}\usepackage{amssymb}\usepackage{bm}\usepackage{mathrsfs}\usepackage{pifont}\usepackage{stmaryrd}\usepackage{textcomp}\usepackage{portland, xspace}\usepackage{amsmath, amsxtra}\usepackage{upgreek}\pagestyle{empty}\DeclareMathSizes{10}{9}{7}{6}\begin{document}
$$p = 500 \,{ \rm{ \mu m}}$$
\end{document}) samples after 2 and 5 weeks culture time. Color images are available online.
Imaging suggests that after 2 weeks, initial cell adhesion and proliferation resulted in partial cell coverage of the scaffold surfaces. After 5 weeks, cells have begun filling internal pores by forming curved tissue growth fronts for 3D ingrowth. The smaller FXBC pore has a higher proportion of its area filled in comparison to the larger Cube pore, which is in agreement with curvature-based models, suggesting that smaller pores with higher surface curvature fill faster.22–24
Spinal cages
The BC topology was chosen for prototyping lattices for spinal cages (Fig. 7A) due to its suitability for supporting tissue growth and its more reliable manufacturability than Cube and FX topologies. In addition, when increasing beam diameter \documentclass{aastex}\usepackage{amsbsy}\usepackage{amsfonts}\usepackage{amssymb}\usepackage{bm}\usepackage{mathrsfs}\usepackage{pifont}\usepackage{stmaryrd}\usepackage{textcomp}\usepackage{portland, xspace}\usepackage{amsmath, amsxtra}\usepackage{upgreek}\pagestyle{empty}\DeclareMathSizes{10}{9}{7}{6}\begin{document}
$${ \phi}$$
\end{document} to increase elastic modulus for a fixed porosity P, the BC topology retains a smaller pore size p than the FXBC topology. The BC unit cell for spinal cage prototyping was configured with \documentclass{aastex}\usepackage{amsbsy}\usepackage{amsfonts}\usepackage{amssymb}\usepackage{bm}\usepackage{mathrsfs}\usepackage{pifont}\usepackage{stmaryrd}\usepackage{textcomp}\usepackage{portland, xspace}\usepackage{amsmath, amsxtra}\usepackage{upgreek}\pagestyle{empty}\DeclareMathSizes{10}{9}{7}{6}\begin{document}
$${ \phi} = 800 \,{ \rm{ \mu m}}$$
\end{document} and unit cell length \documentclass{aastex}\usepackage{amsbsy}\usepackage{amsfonts}\usepackage{amssymb}\usepackage{bm}\usepackage{mathrsfs}\usepackage{pifont}\usepackage{stmaryrd}\usepackage{textcomp}\usepackage{portland, xspace}\usepackage{amsmath, amsxtra}\usepackage{upgreek}\pagestyle{empty}\DeclareMathSizes{10}{9}{7}{6}\begin{document}
$$l = 2.6 \,{ \rm{mm}}$$
\end{document} to provide lattice properties of\documentclass{aastex}\usepackage{amsbsy}\usepackage{amsfonts}\usepackage{amssymb}\usepackage{bm}\usepackage{mathrsfs}\usepackage{pifont}\usepackage{stmaryrd}\usepackage{textcomp}\usepackage{portland, xspace}\usepackage{amsmath, amsxtra}\usepackage{upgreek}\pagestyle{empty}\DeclareMathSizes{10}{9}{7}{6}\begin{document}
$$\;P = 0.5$$
\end{document} and \documentclass{aastex}\usepackage{amsbsy}\usepackage{amsfonts}\usepackage{amssymb}\usepackage{bm}\usepackage{mathrsfs}\usepackage{pifont}\usepackage{stmaryrd}\usepackage{textcomp}\usepackage{portland, xspace}\usepackage{amsmath, amsxtra}\usepackage{upgreek}\pagestyle{empty}\DeclareMathSizes{10}{9}{7}{6}\begin{document}
$$p = 600 \,{ \rm{ \mu m}}$$
\end{document}. Unit cells were patterned to form a 5 × 5 × 2 lattice with a nominal cross-sectional area of \documentclass{aastex}\usepackage{amsbsy}\usepackage{amsfonts}\usepackage{amssymb}\usepackage{bm}\usepackage{mathrsfs}\usepackage{pifont}\usepackage{stmaryrd}\usepackage{textcomp}\usepackage{portland, xspace}\usepackage{amsmath, amsxtra}\usepackage{upgreek}\pagestyle{empty}\DeclareMathSizes{10}{9}{7}{6}\begin{document}
$$190 \,{ \rm{m}}{{ \rm{m}}^2}$$
\end{document} for a base “Lattice” design and modified with local reinforcements to form “Cross” and “Channels” cages with \documentclass{aastex}\usepackage{amsbsy}\usepackage{amsfonts}\usepackage{amssymb}\usepackage{bm}\usepackage{mathrsfs}\usepackage{pifont}\usepackage{stmaryrd}\usepackage{textcomp}\usepackage{portland, xspace}\usepackage{amsmath, amsxtra}\usepackage{upgreek}\pagestyle{empty}\DeclareMathSizes{10}{9}{7}{6}\begin{document}
$$7.2 \,{ \rm{mm}}$$
\end{document} height and \documentclass{aastex}\usepackage{amsbsy}\usepackage{amsfonts}\usepackage{amssymb}\usepackage{bm}\usepackage{mathrsfs}\usepackage{pifont}\usepackage{stmaryrd}\usepackage{textcomp}\usepackage{portland, xspace}\usepackage{amsmath, amsxtra}\usepackage{upgreek}\pagestyle{empty}\DeclareMathSizes{10}{9}{7}{6}\begin{document}
$${ \rm{195}} \,{ \rm{m}}{{ \rm{m}}^{ \rm{2}}}$$
\end{document} nominal cross-sectional areas (Fig. 7B). Mechanical properties were evaluated by comparing mean force-displacement curves (Fig. 7C) and stiffness (Fig. 7D).
(A) Designed cage between adjacent vertebrae. (B) Cage design and fabrication (1 cm length indicator) with measured (C) mean force-displacement and (D) mean stiffness with standard error. Color images are available online.
Force-displacement curves demonstrated that the Channels cage has the highest strength, followed by the Cross and Lattice, reflected by their yield strengths of \documentclass{aastex}\usepackage{amsbsy}\usepackage{amsfonts}\usepackage{amssymb}\usepackage{bm}\usepackage{mathrsfs}\usepackage{pifont}\usepackage{stmaryrd}\usepackage{textcomp}\usepackage{portland, xspace}\usepackage{amsmath, amsxtra}\usepackage{upgreek}\pagestyle{empty}\DeclareMathSizes{10}{9}{7}{6}\begin{document}
$${ \rm{1}}{ \rm{.6}} \,{ \rm{kN}}$$
\end{document} at \documentclass{aastex}\usepackage{amsbsy}\usepackage{amsfonts}\usepackage{amssymb}\usepackage{bm}\usepackage{mathrsfs}\usepackage{pifont}\usepackage{stmaryrd}\usepackage{textcomp}\usepackage{portland, xspace}\usepackage{amsmath, amsxtra}\usepackage{upgreek}\pagestyle{empty}\DeclareMathSizes{10}{9}{7}{6}\begin{document}
$$0.34 \,{ \rm{mm}}$$
\end{document} displacement, \documentclass{aastex}\usepackage{amsbsy}\usepackage{amsfonts}\usepackage{amssymb}\usepackage{bm}\usepackage{mathrsfs}\usepackage{pifont}\usepackage{stmaryrd}\usepackage{textcomp}\usepackage{portland, xspace}\usepackage{amsmath, amsxtra}\usepackage{upgreek}\pagestyle{empty}\DeclareMathSizes{10}{9}{7}{6}\begin{document}
$$1.2 \,{ \rm{kN}}$$
\end{document} at \documentclass{aastex}\usepackage{amsbsy}\usepackage{amsfonts}\usepackage{amssymb}\usepackage{bm}\usepackage{mathrsfs}\usepackage{pifont}\usepackage{stmaryrd}\usepackage{textcomp}\usepackage{portland, xspace}\usepackage{amsmath, amsxtra}\usepackage{upgreek}\pagestyle{empty}\DeclareMathSizes{10}{9}{7}{6}\begin{document}
$$0.33 \,{ \rm{mm}}$$
\end{document} displacement, and \documentclass{aastex}\usepackage{amsbsy}\usepackage{amsfonts}\usepackage{amssymb}\usepackage{bm}\usepackage{mathrsfs}\usepackage{pifont}\usepackage{stmaryrd}\usepackage{textcomp}\usepackage{portland, xspace}\usepackage{amsmath, amsxtra}\usepackage{upgreek}\pagestyle{empty}\DeclareMathSizes{10}{9}{7}{6}\begin{document}
$$0.7 \,{ \rm{kN}}$$
\end{document} at \documentclass{aastex}\usepackage{amsbsy}\usepackage{amsfonts}\usepackage{amssymb}\usepackage{bm}\usepackage{mathrsfs}\usepackage{pifont}\usepackage{stmaryrd}\usepackage{textcomp}\usepackage{portland, xspace}\usepackage{amsmath, amsxtra}\usepackage{upgreek}\pagestyle{empty}\DeclareMathSizes{10}{9}{7}{6}\begin{document}
$$0.27 \,{ \rm{mm}}$$
\end{document} displacement, respectively. The increase in mechanical properties is also supported by stiffness comparisons, with a 2.14 times greater stiffness for the Channels cage and 1.63 times greater stiffness for the Cross cage compared with the base Lattice. Increased performance comes at the cost of increased volume/material for both cages. The Channels cage (\documentclass{aastex}\usepackage{amsbsy}\usepackage{amsfonts}\usepackage{amssymb}\usepackage{bm}\usepackage{mathrsfs}\usepackage{pifont}\usepackage{stmaryrd}\usepackage{textcomp}\usepackage{portland, xspace}\usepackage{amsmath, amsxtra}\usepackage{upgreek}\pagestyle{empty}\DeclareMathSizes{10}{9}{7}{6}\begin{document}
$$P = 0.42$$
\end{document}) has reduced porosity compared with the base Lattice (\documentclass{aastex}\usepackage{amsbsy}\usepackage{amsfonts}\usepackage{amssymb}\usepackage{bm}\usepackage{mathrsfs}\usepackage{pifont}\usepackage{stmaryrd}\usepackage{textcomp}\usepackage{portland, xspace}\usepackage{amsmath, amsxtra}\usepackage{upgreek}\pagestyle{empty}\DeclareMathSizes{10}{9}{7}{6}\begin{document}
$$P = 0.5$$
\end{document}); however, the Cross cage retains similar porosity (\documentclass{aastex}\usepackage{amsbsy}\usepackage{amsfonts}\usepackage{amssymb}\usepackage{bm}\usepackage{mathrsfs}\usepackage{pifont}\usepackage{stmaryrd}\usepackage{textcomp}\usepackage{portland, xspace}\usepackage{amsmath, amsxtra}\usepackage{upgreek}\pagestyle{empty}\DeclareMathSizes{10}{9}{7}{6}\begin{document}
$$P = 0.52$$
\end{document}).
Discussion
Designed lattice samples were fabricated via polyjet printing for varied topology, beam diameter, porosity, and pore size configurations and imaged to determine the fidelity of fabricated samples before mechanical and biological testing. Measured lattice length and height were all larger than designed, with at most a \documentclass{aastex}\usepackage{amsbsy}\usepackage{amsfonts}\usepackage{amssymb}\usepackage{bm}\usepackage{mathrsfs}\usepackage{pifont}\usepackage{stmaryrd}\usepackage{textcomp}\usepackage{portland, xspace}\usepackage{amsmath, amsxtra}\usepackage{upgreek}\pagestyle{empty}\DeclareMathSizes{10}{9}{7}{6}\begin{document}
$$0.4 \,{ \rm{mm}}$$
\end{document} difference from design for the largest samples (greater than \documentclass{aastex}\usepackage{amsbsy}\usepackage{amsfonts}\usepackage{amssymb}\usepackage{bm}\usepackage{mathrsfs}\usepackage{pifont}\usepackage{stmaryrd}\usepackage{textcomp}\usepackage{portland, xspace}\usepackage{amsmath, amsxtra}\usepackage{upgreek}\pagestyle{empty}\DeclareMathSizes{10}{9}{7}{6}\begin{document}
$$15 \,{ \rm{mm}}$$
\end{document} length) and generally within \documentclass{aastex}\usepackage{amsbsy}\usepackage{amsfonts}\usepackage{amssymb}\usepackage{bm}\usepackage{mathrsfs}\usepackage{pifont}\usepackage{stmaryrd}\usepackage{textcomp}\usepackage{portland, xspace}\usepackage{amsmath, amsxtra}\usepackage{upgreek}\pagestyle{empty}\DeclareMathSizes{10}{9}{7}{6}\begin{document}
$$0.2 \,{ \rm{mm}}$$
\end{document} for smaller samples (smaller than \documentclass{aastex}\usepackage{amsbsy}\usepackage{amsfonts}\usepackage{amssymb}\usepackage{bm}\usepackage{mathrsfs}\usepackage{pifont}\usepackage{stmaryrd}\usepackage{textcomp}\usepackage{portland, xspace}\usepackage{amsmath, amsxtra}\usepackage{upgreek}\pagestyle{empty}\DeclareMathSizes{10}{9}{7}{6}\begin{document}
$$10 \,{ \rm{mm}}$$
\end{document} length), which suggests an accuracy dependency on size. Measured porosity ranged from \documentclass{aastex}\usepackage{amsbsy}\usepackage{amsfonts}\usepackage{amssymb}\usepackage{bm}\usepackage{mathrsfs}\usepackage{pifont}\usepackage{stmaryrd}\usepackage{textcomp}\usepackage{portland, xspace}\usepackage{amsmath, amsxtra}\usepackage{upgreek}\pagestyle{empty}\DeclareMathSizes{10}{9}{7}{6}\begin{document}
$$0.01$$
\end{document} to \documentclass{aastex}\usepackage{amsbsy}\usepackage{amsfonts}\usepackage{amssymb}\usepackage{bm}\usepackage{mathrsfs}\usepackage{pifont}\usepackage{stmaryrd}\usepackage{textcomp}\usepackage{portland, xspace}\usepackage{amsmath, amsxtra}\usepackage{upgreek}\pagestyle{empty}\DeclareMathSizes{10}{9}{7}{6}\begin{document}
$$0.08$$
\end{document} higher than designed when considering mean measurements of all samples. Differences in porosity may be attributed to broken beams, remaining support material, extra material at beam connections, and beam fabrication defects. Beam fabrication defects, such as build layers having slightly different diameters and misalignment, led to variances in beam diameters ranging from \documentclass{aastex}\usepackage{amsbsy}\usepackage{amsfonts}\usepackage{amssymb}\usepackage{bm}\usepackage{mathrsfs}\usepackage{pifont}\usepackage{stmaryrd}\usepackage{textcomp}\usepackage{portland, xspace}\usepackage{amsmath, amsxtra}\usepackage{upgreek}\pagestyle{empty}\DeclareMathSizes{10}{9}{7}{6}\begin{document}
$$90 \,{ \rm{ \mu m}}$$
\end{document} smaller to \documentclass{aastex}\usepackage{amsbsy}\usepackage{amsfonts}\usepackage{amssymb}\usepackage{bm}\usepackage{mathrsfs}\usepackage{pifont}\usepackage{stmaryrd}\usepackage{textcomp}\usepackage{portland, xspace}\usepackage{amsmath, amsxtra}\usepackage{upgreek}\pagestyle{empty}\DeclareMathSizes{10}{9}{7}{6}\begin{document}
$$70 \,{ \rm{ \mu m}}$$
\end{document} larger than designed on average, based on the build direction and beam orientation. Inconsistencies led to measured pores being from \documentclass{aastex}\usepackage{amsbsy}\usepackage{amsfonts}\usepackage{amssymb}\usepackage{bm}\usepackage{mathrsfs}\usepackage{pifont}\usepackage{stmaryrd}\usepackage{textcomp}\usepackage{portland, xspace}\usepackage{amsmath, amsxtra}\usepackage{upgreek}\pagestyle{empty}\DeclareMathSizes{10}{9}{7}{6}\begin{document}
$$180 \,{ \rm{ \mu m}}$$
\end{document} smaller to \documentclass{aastex}\usepackage{amsbsy}\usepackage{amsfonts}\usepackage{amssymb}\usepackage{bm}\usepackage{mathrsfs}\usepackage{pifont}\usepackage{stmaryrd}\usepackage{textcomp}\usepackage{portland, xspace}\usepackage{amsmath, amsxtra}\usepackage{upgreek}\pagestyle{empty}\DeclareMathSizes{10}{9}{7}{6}\begin{document}
$$34 \,{ \rm{ \mu m}}$$
\end{document} larger than designed, on average, but remained within the 200–1000 μm range suitable for bone tissue engineering. Pore size inconsistencies are potentially due to variances in beam sizes, surface roughness, and imaging processes that influence measurement accuracy. These measurements were conducted with microscopy and μCT methods; however, emerging approaches such as ultrasonic wave propagation could provide improved monitoring of the geometric quality of lattices and supplementary measurements for 3D geometries.35
Fabrication defects may account for some variations in lattice mechanical performance,8 such as beam diameter having a positive correlation with elastic moduli, when beam-based finite element evaluations suggest there is no dependency.14 According to these beam-based finite element analyses, the Cube topology should have the highest elastic modulus at a given porosity based on it having the highest proportion of material continuously aligned with the loading path. However, the Cube is measured as the lowest, potentially due to fragile interfacing of horizontal and vertical beams, or local buckling of unsupported vertical beams, which reinforces the need for more advanced finite element approaches.36 The mechanical performance of BC, FX, and FXBC topologies was similar, and it demonstrated a decreased elastic modulus with increased porosity.10 When rescaling designs by adjusting the number of unit cells (i.e., Table 1 pore size fixed designs), there was maximum difference of \documentclass{aastex}\usepackage{amsbsy}\usepackage{amsfonts}\usepackage{amssymb}\usepackage{bm}\usepackage{mathrsfs}\usepackage{pifont}\usepackage{stmaryrd}\usepackage{textcomp}\usepackage{portland, xspace}\usepackage{amsmath, amsxtra}\usepackage{upgreek}\pagestyle{empty}\DeclareMathSizes{10}{9}{7}{6}\begin{document}
$$\pm 15 \,{ \rm{MPa}}$$
\end{document} across measurements, which suggests that the lattices retain scalable mechanical properties. The rescaled lattice in Figure 7 had an elastic modulus of \documentclass{aastex}\usepackage{amsbsy}\usepackage{amsfonts}\usepackage{amssymb}\usepackage{bm}\usepackage{mathrsfs}\usepackage{pifont}\usepackage{stmaryrd}\usepackage{textcomp}\usepackage{portland, xspace}\usepackage{amsmath, amsxtra}\usepackage{upgreek}\pagestyle{empty}\DeclareMathSizes{10}{9}{7}{6}\begin{document}
$$97 \,{ \rm{MPa}}$$
\end{document}, similar to the \documentclass{aastex}\usepackage{amsbsy}\usepackage{amsfonts}\usepackage{amssymb}\usepackage{bm}\usepackage{mathrsfs}\usepackage{pifont}\usepackage{stmaryrd}\usepackage{textcomp}\usepackage{portland, xspace}\usepackage{amsmath, amsxtra}\usepackage{upgreek}\pagestyle{empty}\DeclareMathSizes{10}{9}{7}{6}\begin{document}
$$117 \,{ \rm{MPa}}$$
\end{document} modulus of the \documentclass{aastex}\usepackage{amsbsy}\usepackage{amsfonts}\usepackage{amssymb}\usepackage{bm}\usepackage{mathrsfs}\usepackage{pifont}\usepackage{stmaryrd}\usepackage{textcomp}\usepackage{portland, xspace}\usepackage{amsmath, amsxtra}\usepackage{upgreek}\pagestyle{empty}\DeclareMathSizes{10}{9}{7}{6}\begin{document}
$$P = 0.5$$
\end{document} BC topology from Table 1. Differences in these measurements may be partially attributed to lattice samples and cages having different batch and test dates.13
When lattices were rescaled with pore size \documentclass{aastex}\usepackage{amsbsy}\usepackage{amsfonts}\usepackage{amssymb}\usepackage{bm}\usepackage{mathrsfs}\usepackage{pifont}\usepackage{stmaryrd}\usepackage{textcomp}\usepackage{portland, xspace}\usepackage{amsmath, amsxtra}\usepackage{upgreek}\pagestyle{empty}\DeclareMathSizes{10}{9}{7}{6}\begin{document}
$$p = 500 \,{ \rm{ \mu m}}$$
\end{document} and 1 U cell height, only the BC and FXBC topologies were reliably fabricated, so a Cube topology of p = 1000 μm was also fabricated as a basis of comparison for cell culture experiments. Samples were designed with 1 U cell height to minimize volume and mitigate the influence that porosity variations may have on tissue growth due to nutrient transport variances. Beam diameter and pore size were fixed for assessing tissue growth in response to geometrical differences among different topologies.22–24 Cell culture experiments demonstrated the feasibility of tissue growth on these structures, with a high stochastic variance in tissue volume. Tissue growth was qualitatively similar to Saos-2 and osteoblast tissue growth observed by other studies, where curved tissue fronts emerged.4,34 Findings suggest the MED610 material is biocompatible for tissue growth,15 but further experiments are required to assess the material's longevity and how properties such as surface roughness may influence tissue growth.7 Comparisons to other studies are limited, since material properties such as local and global material stiffness influence tissue growth,37 in addition to differences in biological testing protocols.
A \documentclass{aastex}\usepackage{amsbsy}\usepackage{amsfonts}\usepackage{amssymb}\usepackage{bm}\usepackage{mathrsfs}\usepackage{pifont}\usepackage{stmaryrd}\usepackage{textcomp}\usepackage{portland, xspace}\usepackage{amsmath, amsxtra}\usepackage{upgreek}\pagestyle{empty}\DeclareMathSizes{10}{9}{7}{6}\begin{document}
$$P = 0.5$$
\end{document}, \documentclass{aastex}\usepackage{amsbsy}\usepackage{amsfonts}\usepackage{amssymb}\usepackage{bm}\usepackage{mathrsfs}\usepackage{pifont}\usepackage{stmaryrd}\usepackage{textcomp}\usepackage{portland, xspace}\usepackage{amsmath, amsxtra}\usepackage{upgreek}\pagestyle{empty}\DeclareMathSizes{10}{9}{7}{6}\begin{document}
$${ \phi} = 800 \,{ \rm{ \mu m}}$$
\end{document} BC unit cell design was chosen as a base lattice for spinal cage prototypes, due to the larger beam diameter that improves its elastic modulus over \documentclass{aastex}\usepackage{amsbsy}\usepackage{amsfonts}\usepackage{amssymb}\usepackage{bm}\usepackage{mathrsfs}\usepackage{pifont}\usepackage{stmaryrd}\usepackage{textcomp}\usepackage{portland, xspace}\usepackage{amsmath, amsxtra}\usepackage{upgreek}\pagestyle{empty}\DeclareMathSizes{10}{9}{7}{6}\begin{document}
$${ \phi} = 500 \,{ \rm{ \mu m}}$$
\end{document} designs, while retaining its capacity to support tissue growth for spinal cage prototypes with \documentclass{aastex}\usepackage{amsbsy}\usepackage{amsfonts}\usepackage{amssymb}\usepackage{bm}\usepackage{mathrsfs}\usepackage{pifont}\usepackage{stmaryrd}\usepackage{textcomp}\usepackage{portland, xspace}\usepackage{amsmath, amsxtra}\usepackage{upgreek}\pagestyle{empty}\DeclareMathSizes{10}{9}{7}{6}\begin{document}
$$p = 600 \,{ \rm{ \mu m}}$$
\end{document}. The lattice was used in two contrasting cage designs generated with a similar height but smaller cross-sectional area than human intervertebral disks. The highest performing cage sample, the Channels cage, yielded at \documentclass{aastex}\usepackage{amsbsy}\usepackage{amsfonts}\usepackage{amssymb}\usepackage{bm}\usepackage{mathrsfs}\usepackage{pifont}\usepackage{stmaryrd}\usepackage{textcomp}\usepackage{portland, xspace}\usepackage{amsmath, amsxtra}\usepackage{upgreek}\pagestyle{empty}\DeclareMathSizes{10}{9}{7}{6}\begin{document}
$$1.6 \,{ \rm{kN}}$$
\end{document}, which is slightly below the \documentclass{aastex}\usepackage{amsbsy}\usepackage{amsfonts}\usepackage{amssymb}\usepackage{bm}\usepackage{mathrsfs}\usepackage{pifont}\usepackage{stmaryrd}\usepackage{textcomp}\usepackage{portland, xspace}\usepackage{amsmath, amsxtra}\usepackage{upgreek}\pagestyle{empty}\DeclareMathSizes{10}{9}{7}{6}\begin{document}
$$1.65 \,{ \rm{kN}}$$
\end{document} typical maximum load of the spine20 and suggests that the cage may be suitable for spinal fusion if other aspects of the system, such as pedicle screws, carry a portion of the load as a safety factor. Depending on the safety factor, the Cross cage or base Lattice could potentially be used and would provide a higher porosity than the Channels cage.
The \documentclass{aastex}\usepackage{amsbsy}\usepackage{amsfonts}\usepackage{amssymb}\usepackage{bm}\usepackage{mathrsfs}\usepackage{pifont}\usepackage{stmaryrd}\usepackage{textcomp}\usepackage{portland, xspace}\usepackage{amsmath, amsxtra}\usepackage{upgreek}\pagestyle{empty}\DeclareMathSizes{10}{9}{7}{6}\begin{document}
$$5.6 \,{ \rm{kN / mm}}$$
\end{document} stiffness of the Cross cage is lower than similarly designed 3D printed cages using poly(ɛ-caprolactone) mixed with hydroxyapatite that have \documentclass{aastex}\usepackage{amsbsy}\usepackage{amsfonts}\usepackage{amssymb}\usepackage{bm}\usepackage{mathrsfs}\usepackage{pifont}\usepackage{stmaryrd}\usepackage{textcomp}\usepackage{portland, xspace}\usepackage{amsmath, amsxtra}\usepackage{upgreek}\pagestyle{empty}\DeclareMathSizes{10}{9}{7}{6}\begin{document}
$$7.5 \,{ \rm{kN / mm}}$$
\end{document} stiffness and titanium cages that have \documentclass{aastex}\usepackage{amsbsy}\usepackage{amsfonts}\usepackage{amssymb}\usepackage{bm}\usepackage{mathrsfs}\usepackage{pifont}\usepackage{stmaryrd}\usepackage{textcomp}\usepackage{portland, xspace}\usepackage{amsmath, amsxtra}\usepackage{upgreek}\pagestyle{empty}\DeclareMathSizes{10}{9}{7}{6}\begin{document}
$$31.3 \,{ \rm{kN / mm}}$$
\end{document} stiffness.16,18 Assuming a nominal loading of less than \documentclass{aastex}\usepackage{amsbsy}\usepackage{amsfonts}\usepackage{amssymb}\usepackage{bm}\usepackage{mathrsfs}\usepackage{pifont}\usepackage{stmaryrd}\usepackage{textcomp}\usepackage{portland, xspace}\usepackage{amsmath, amsxtra}\usepackage{upgreek}\pagestyle{empty}\DeclareMathSizes{10}{9}{7}{6}\begin{document}
$$1.5 \,{ \rm{kN}}$$
\end{document}, local strain within the cage would remain below the limits proposed for ossification.38 The Cross cage achieves its stiffness with only a \documentclass{aastex}\usepackage{amsbsy}\usepackage{amsfonts}\usepackage{amssymb}\usepackage{bm}\usepackage{mathrsfs}\usepackage{pifont}\usepackage{stmaryrd}\usepackage{textcomp}\usepackage{portland, xspace}\usepackage{amsmath, amsxtra}\usepackage{upgreek}\pagestyle{empty}\DeclareMathSizes{10}{9}{7}{6}\begin{document}
$$195 \,{ \rm{m}}{{ \rm{m}}^2}$$
\end{document} cross-section in comparison to the \documentclass{aastex}\usepackage{amsbsy}\usepackage{amsfonts}\usepackage{amssymb}\usepackage{bm}\usepackage{mathrsfs}\usepackage{pifont}\usepackage{stmaryrd}\usepackage{textcomp}\usepackage{portland, xspace}\usepackage{amsmath, amsxtra}\usepackage{upgreek}\pagestyle{empty}\DeclareMathSizes{10}{9}{7}{6}\begin{document}
$$500 \,{ \rm{m}}{{ \rm{m}}^2}$$
\end{document} cross-section of the poly(ɛ-caprolactone) cage, and it could achieve a higher stiffness if redesigned to a similar size. The cage design may also be improved through iterative testing and automated design methods,1,28 especially when considering the need for patient-specific tuning with regard to expected loadings, geometrical constraints, and other spinal cage system components.
Conclusion
Beam-based lattices suitable for tissue engineering were designed with controlled properties and fabricated via polyjet printing. Generally, measured diameters were 50–100 μm smaller than designed and samples were up to \documentclass{aastex}\usepackage{amsbsy}\usepackage{amsfonts}\usepackage{amssymb}\usepackage{bm}\usepackage{mathrsfs}\usepackage{pifont}\usepackage{stmaryrd}\usepackage{textcomp}\usepackage{portland, xspace}\usepackage{amsmath, amsxtra}\usepackage{upgreek}\pagestyle{empty}\DeclareMathSizes{10}{9}{7}{6}\begin{document}
$$8 \%$$
\end{document} more porous than designed. Lattices with fixed porosity and \documentclass{aastex}\usepackage{amsbsy}\usepackage{amsfonts}\usepackage{amssymb}\usepackage{bm}\usepackage{mathrsfs}\usepackage{pifont}\usepackage{stmaryrd}\usepackage{textcomp}\usepackage{portland, xspace}\usepackage{amsmath, amsxtra}\usepackage{upgreek}\pagestyle{empty}\DeclareMathSizes{10}{9}{7}{6}\begin{document}
$$500 \,{ \rm{ \mu m}}$$
\end{document} beam diameters had lower elastic moduli than lattices designed with \documentclass{aastex}\usepackage{amsbsy}\usepackage{amsfonts}\usepackage{amssymb}\usepackage{bm}\usepackage{mathrsfs}\usepackage{pifont}\usepackage{stmaryrd}\usepackage{textcomp}\usepackage{portland, xspace}\usepackage{amsmath, amsxtra}\usepackage{upgreek}\pagestyle{empty}\DeclareMathSizes{10}{9}{7}{6}\begin{document}
$$800 \,{ \rm{ \mu m}}$$
\end{document} beam diameters, potentially due to a greater relative influence of fabrication defects on performance. Elastic modulus decreased with increasing porosity for all topologies. In vitro tissue growth was demonstrated for multiple scaffolds with 50–1000 μm pore sizes, with curved tissue fronts that demonstrate 3D ingrowth. Spinal cage prototypes using lattices with localized reinforcement were fabricated and demonstrated to have stiffness up to \documentclass{aastex}\usepackage{amsbsy}\usepackage{amsfonts}\usepackage{amssymb}\usepackage{bm}\usepackage{mathrsfs}\usepackage{pifont}\usepackage{stmaryrd}\usepackage{textcomp}\usepackage{portland, xspace}\usepackage{amsmath, amsxtra}\usepackage{upgreek}\pagestyle{empty}\DeclareMathSizes{10}{9}{7}{6}\begin{document}
$$5.6 \,{ \rm{kN / mm}}$$
\end{document}, which is suitable for spinal fusion applications. Findings show the potential of using polyjet printing for tissue engineering, and they highlight characteristics of 3D printed lattice structures that are relevant for broad applications.
Footnotes
Acknowledgments
Ben Helgason provided the vertebral model () from the Virtual Skeletal Database.30 Funding from the ETH Zurich postdoctoral fellowship program supported this research.
Author Disclosure Statement
No competing financial interests exist.
References
1.
HollisterSJ, FlanaganCL, ZopfDA, et al.Design control for clinical translatio of 3D printed modular scaffolds. Ann Biomed Eng, 2015; 43:774–786.
2.
KenglaC, RenteriaE, WivellC, et al.Clinically relevant bioprinting workflow and imaging process for tissue construct design and validation. 3D Print Addit Manuf, 2017; 4:239–247.
3.
EganPF, SheaKA, FergusonSJ. Simulated tissue growth for 3D printed scaffolds. Biomech Model Mechanobiol, 2018; 17:1–15.
4.
RumplerM, WoeszA, VargaF, et al.Three-dimensional growth behavior of osteoblasts on biomimetic hydroxylapatite scaffolds. J Biomed Mater Res A, 2007; 81:40–50.
5.
WangX, XuS, ZhouS, et al.Topological design and additive manufacturing of porous metals for bone scaffolds and orthopaedic implants: A review. Biomaterials, 2016; 83:127–141.
6.
de WildM, ZimmermannS, RüeggJ, et al.Influence of microarchitecture on osteoconduction and mechanics of porous titanium scaffolds generated by selective laser melting. 3D Print Addit Manuf, 2016; 3:142–151.
7.
RuppertDS, HarryssonOL, Marcellin-LittleDJ, et al.Osseointegration of coarse and fine textured implants manufactured by electron beam melting and direct metal laser sintering. 3D Print Addit Manuf, 2017; 4:91–97.
8.
RavariMK, KadkhodaeiM, BadrossamayM, et al.Numerical investigation on mechanical properties of cellular lattice structures fabricated by fused deposition modeling. Int J Mech Sci, 2014; 88:154–161.
9.
ArabnejadS, JohnstonRB, PuraJA, et al.High-strength porous biomaterials for bone replacement: A strategy to assess the interplay between cell morphology, mechanical properties, bone ingrowth and manufacturing constraints. Acta Biomater, 2016; 30:345–356.
10.
WeißmannV, WiedingJ, HansmannH, et al.Specific yielding of selective laser-melted Ti6Al4V open-porous scaffolds as a function of unit cell design and dimensions. Metals, 2016; 6:166.
11.
DongG, TangY, ZhaoYF. A survey of modeling of lattice structures fabricated by additive manufacturing. J Mech Des, 2017; 139:100906.
12.
EganP, FergusonS, SheaK. Design of hierarchical 3D printed scaffolds considering mechanical and biological factors for bone tissue engineering. J Mech Des, 2017; 139.
13.
MuellerJ, SheaK, DaraioC. Mechanical properties of parts fabricated with inkjet 3D printing through efficient experimental design. Mater Des, 2015; 86:902–912.
14.
EganPF, GonellaVC, EngenspergerM, et al.Computationally designed lattices with tuned properties for tissue engineering using 3D printing. PLoS One, 2017; 12:e0182902.
15.
Alifui-SegbayaF, VarmaS, LieschkeGJ, et al.Biocompatibility of photopolymers in 3D printing. 3D Print Addit Manuf, 2017; 4:185–191.
16.
KangH, HollisterSJ, La MarcaF, et al.Porous biodegradable lumbar interbody fusion cage design and fabrication using integrated global-local topology optimization with laser sintering. J Biomech Eng, 2013; 135:101013.
17.
BashkuevM, ChecaS, PostigoS, et al.Computational analyses of different intervertebral cages for lumbar spinal fusion. J Biomech, 2015; 48:3274–3282.
18.
TsaiPI, HsuCC, ChenSY, et al.Biomechanical investigation into the structural design of porous additive manufactured cages using numerical and experimental approaches. Comput Biol Med, 2016; 76:14–23.
19.
LeeYH, ChungCJ, WangCW, et al.Computational comparison of three posterior lumbar interbody fusion techniques by using porous titanium interbody cages with 50% porosity. Comput Biol Med, 2016; 71:35–45.
20.
RohlmannA, PohlD, BenderA, et al.Activities of everyday life with high spinal loads. PLoS One, 2014; 9:e98510.
21.
HabibFN, NikzadM, MasoodSH, et al.Design and development of scaffolds for tissue engineering using three-dimensional printing for bio-based applications. 3D Print Addit Manuf, 2016; 3.
22.
GuyotY, PapantoniouI, ChaiYC, et al.A computational model for cell/ECM growth on 3D surfaces using the level set method: A bone tissue engineering case study. Biomech Model Mechanobiol, 2014; 13:1361–1371.
23.
RumplerM, WoeszA, DunlopJW, et al.The effect of geometry on three-dimensional tissue growth. J R Soc Interf, 2008; 5:1173–1180.
24.
BidanCM, KommareddyKP, RumplerM, et al.Geometry as a factor for tissue growth: Towards shape optimization of tissue engineering scaffolds. Adv Healthc Mater, 2013; 2:186–194.
WilkeHJ, NeefP, CaimiM, et al.New in vivo measurements of pressures in the intervertebral disc in daily life. Spine, 1999; 24:755–762.
27.
MariniG, StuderH, HuberG, et al.Geometrical aspects of patient-specific modelling of the intervertebral disc: Collagen fibre orientation and residual stress distribution. Biomech Model Mechanobiol, 2016; 15:543–560.
28.
EganP, CaganJ, SchunnC, et al.The D3 methodology: Bridging science and design for bio-based product development. J Mech Des, 2016; 138.
29.
EganPF, BauerI, SheaK, FergusonS. Mechanics of three-dimensional printed lattices for biomedical devices. J Mech Des, 2019; 141:031703.
30.
KistlerM, BonarettiS, PfahrerM, et al.The virtual skeleton database: An open access repository for biomedical research and collaboration. J Med Internet Res, 2013; 15:e245.
31.
BusscherI, PloegmakersJJ, VerkerkeGJ, et al.Comparative anatomical dimensions of the complete human and porcine spine. Eur Spine J, 2010; 19:1104–1114.
32.
KlawitterM, QueroL, KlasenJ, et al.Curcuma DMSO extracts and curcumin exhibit an anti-inflammatory and anti-catabolic effect on human intervertebral disc cells, possibly by influencing TLR2 expression and JNK activity. J Inflamm, 2012; 9:29.
33.
RodanSB, ImaiY, ThiedeMA, et al.Characterization of a human osteosarcoma cell line (Saos-2) with osteoblastic properties. Cancer Res, 1987; 47:4961–4966.
34.
SobralJM, CaridadeSG, SousaRA, et al.Three-dimensional plotted scaffolds with controlled pore size gradients: Effect of scaffold geometry on mechanical performance and cell seeding efficiency. Acta Biomater, 2011; 7:1009–1018.
35.
XuX, VallabhCKP, ClelandZJ, et al.Phononic crystal artifacts for real-time in situ quality monitoring in additive manufacturing. J Manuf Sci Eng, 2017; 139:091001.
36.
MelanconD, BagheriZ, JohnstonR, et al.Mechanical characterization of structurally porous biomaterials built via additive manufacturing: Experiments, predictive models, and design maps for load-bearing bone replacement implants. Acta Biomater, 2017; 63:350–368.
37.
BurkeDP, KellyDJ. Substrate stiffness and oxygen as regulators of stem cell differentiation during skeletal tissue regeneration: A mechanobiological model. PLoS One, 2012; 7:e40737.
38.
ClaesL, HeigeleC. Magnitudes of local stress and strain along bony surfaces predict the course and type of fracture healing. J Biomech, 1999; 32:255–266.