
Abstract
Abstract
Selective inhibition sintering (SIS) process is a relatively new additive manufacturing technology that builds parts on a layer-by-layer basis. This new process has been of high interest in recent years. The principal idea of the SIS process for metallic parts is based on the retardation of selected segments of each powder layer from sintering. In this process, the inhibitor, which is an inorganic salt solution or a carbohydrate solution (sucrose), is printed on the boundary of each metal powder layer cross-section to form the green part. During bulk sintering, the inhibitor decomposes to second-phase particles. The decomposed solid particles cover the surface of affected metal powder particles and exert a retarding force on the surface movement, which results in sintering retardation in the printed sections. In this article, the effects of inhibitor and sintering conditions on the SIS process for bronze were investigated. Retardation from sintering was studied for bronze inhibited by sucrose through the SIS process. The mechanical properties of the printed and nonprinted sections under different sintering conditions were characterized by the aid of design of experiments methodology. The characterizations were conducted by measuring the mechanical properties of metallic parts under different sintering temperature and sintering time. Scanning electron microscopy and energy-dispersive X-ray spectroscopy techniques were used to study the printed sections after sintering.
Introduction
Selective inhibition sintering (SIS) process for metallic parts fabrication is a relatively new additive manufacturing (AM) process based on prevention of selected segments of each powder layer from sintering.1,2 The steps for the SIS process are shown in Figure 1. The SIS process as shown in Figure 1 consists of the following steps:
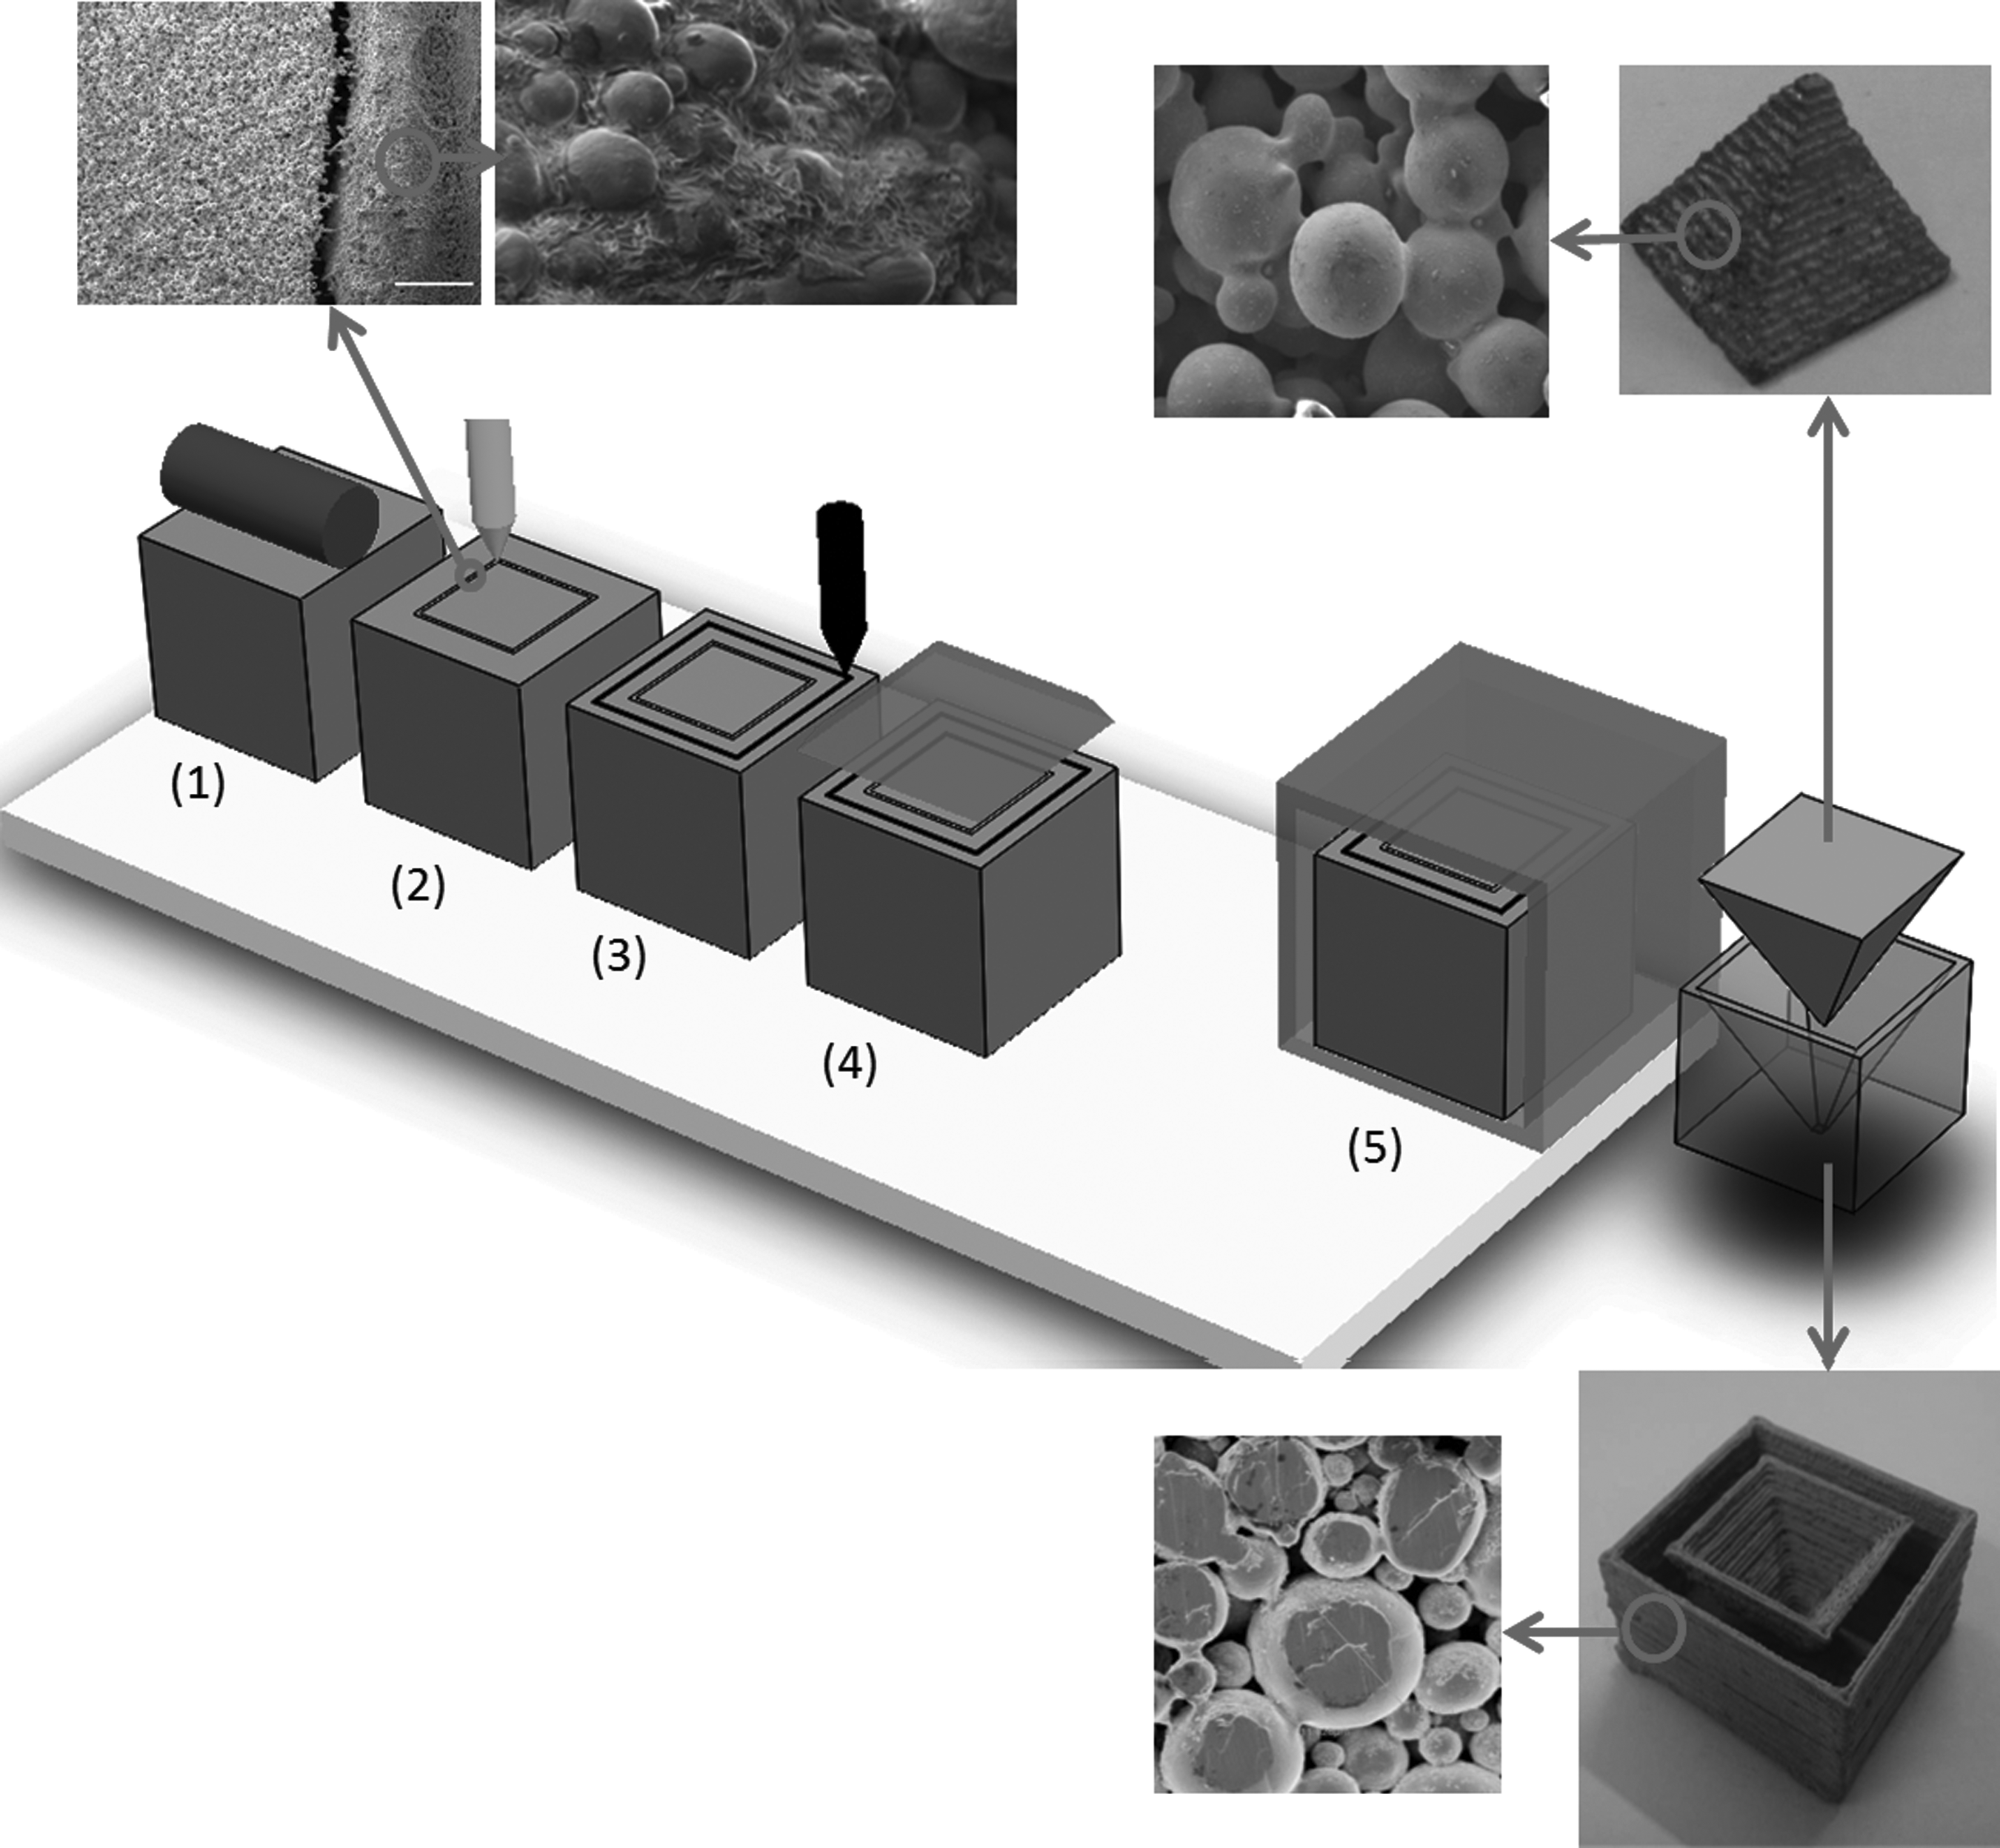
Stages in the fabrication of metallic parts by the SIS method. SIS, selective inhibition sintering.
Laying powder: Loose metal powder is spread as a thin layer over the build tank. The spread of metal powder is done by roller or blade.
Deposition of inorganic salts or sucrose: A solenoid valve with a fine orifice, 1 or an inkjet printer head, 3 is used to deliver the solution to the selected areas of the powder bed surface (boundary of every layer's cross-section).
Creation of a boundary to contain green part: An adhesive, binder, is deposited on the powder bed at the periphery. Due to the mechanical interlock of the inhibitor crystals, the same inhibitor that is used in step 2 can hold the metal powder particles together after it is completely dried.
Heating: A heater is used to evaporate water and other liquid additives (such as alcohol, which may be needed for breaking surface tension) in the printed sections. After this stage, steps 1–4 are repeated for the next layers.
Bulk sintering the fully dried bonded green parts in a conventional sintering oven.
The SIS process promises a lower manufacturing cost compared with other commercialized AM methods for metallic parts fabrication due to its simplicity in fabrication. 4 According to 2018 Wohlers annual report, in the past 2 years there has been a 220% growth in sales for AM machines that were capable of fabricating metallic parts. 5 Due to this recent increase in demand, there have been numerous research studies to improve the mechanical properties of the AM metallic parts and reduce the cost of the machine.5,6 The SIS process for metallic parts is a relatively new process offering a low cost of fabrication and in recent years, it has gained lots of attention. Therefore, a thorough study is needed for the SIS process to analyze and study the effect of sintering conditions on the inhibition process and mechanical properties of the final parts.
In this article, the effects of sintering parameters on parts fabricated by the SIS process were studied. The study was focused on measuring the effect of sintering temperature and time on in situ strength of the printed (bronze printed with sucrose) and nonprinted sections (pure bronze). Several literatures have studied loose powder sintering for bronze.7–9 The goals of these studies were to formulate and model the effect of sintering parameters on pure bronze without the presence of any secondary material in the metal powder. Adding the inhibitor to the metal will retard the sintering process. The effects of secondary particles on retardation from sintering of metals have been studied for certain applications such as cathode material.10–12 These studies used alumina and SiC to retard the sintering process and studied the underlying for retardation from sintering. Several recent studies have characterized the effect of alumina on bronze during sintering under compaction.13,14 The results of these studies were beneficial to understand the underlying of inhibition from sintering of metals when introduced to nonmetallic particles. However, none of these studies was able to directly address the retardation from sintering for the SIS process when sucrose/carbon particles were introduced to bronze. In this article, a thorough study was conducted to characterize the mechanical properties and sintering rate for bronze particles inhibited from sintering by sucrose (carbon particles after sintering) fabricated by the SIS process. The characterizations were conducted by measuring the mechanical properties (micro hardness) under different sintering temperature and sintering time. By the aid of design of experiments (DOE) methodology, the effects of bulk sintering conditions were studied simultaneously, both on bronze and on bronze printed with inhibitor (sucrose). Mathematical regression models were presented to model the effect of sintering conditions on the micro-hardness of the test coupons. Scanning electron microscopy (SEM) and energy-dispersive X-ray spectroscopy (EDS) techniques were used to study the printed sections after sintering.
Materials and Methods
The core of the SIS process is to print an inhibitor (inorganic salt solution/sucrose) on a metal powder bed on a layer-by-layer basis to form a green part and retard the printed sections from sintering.1,2 Several experiments were conducted to prove the feasibility of the SIS process for various inhibitors.1–4
Inhibitor selection
Sucrose and inorganic salts that have a decomposition temperature lower than the sintering temperature and decompose to carbon/ceramic particles were potential candidates for the process. The following factors were considered in choosing the inorganic salt:
Solubility of the inorganic salt (the higher the solubility, the more second-phase particles can be dispersed in the metal); Molecular mass weight and surface tension for a proper penetration in a metal powder bed; Decomposition temperature; Type and composition of the compounds after decomposition.
The best inhibitor candidates that showed success in the preliminary screening were aluminum sulfate, magnesium sulfate, zirconium sulfate, and sucrose. To run a comparison test between different inhibitors, droplets with a volume of 34 mm3 of each solution were deposited on one layer of bronze powder. All the printed samples were sintered in an Argon environment at 810°C for 10 min. To measure the sintering retardation process, surface hardness (Hardness Rockwell B or HRB) for each test case was measured and recorded. The surface hardness for various inhibitors on bronze is shown in Figure 2. It was concluded from Figure 2 that sucrose (dispersed carbon particles) showed the best retardation from sintering and it was chosen as the inhibitor of choice for the SIS process for bronze. Through the rest of this article, the effect of sintering conditions on the SIS process with sucrose as the inhibitor will be studied. The inhibitor solution was achieved by dissolving 100 g of C12H22O11 anhydrous in 100 mL of water at room temperature, and 100 mL of isopropyl alcohol was added to the mixture to reduce the surface tension of the liquid for ease of printing. To confirm the composition of the particles pinned to the metallic particles after sintering in the printed sections, EDS and X-ray diffraction were conducted to analyze and characterize the chemical composition of the particles pinned to the surface of bronze after bulk sintering.
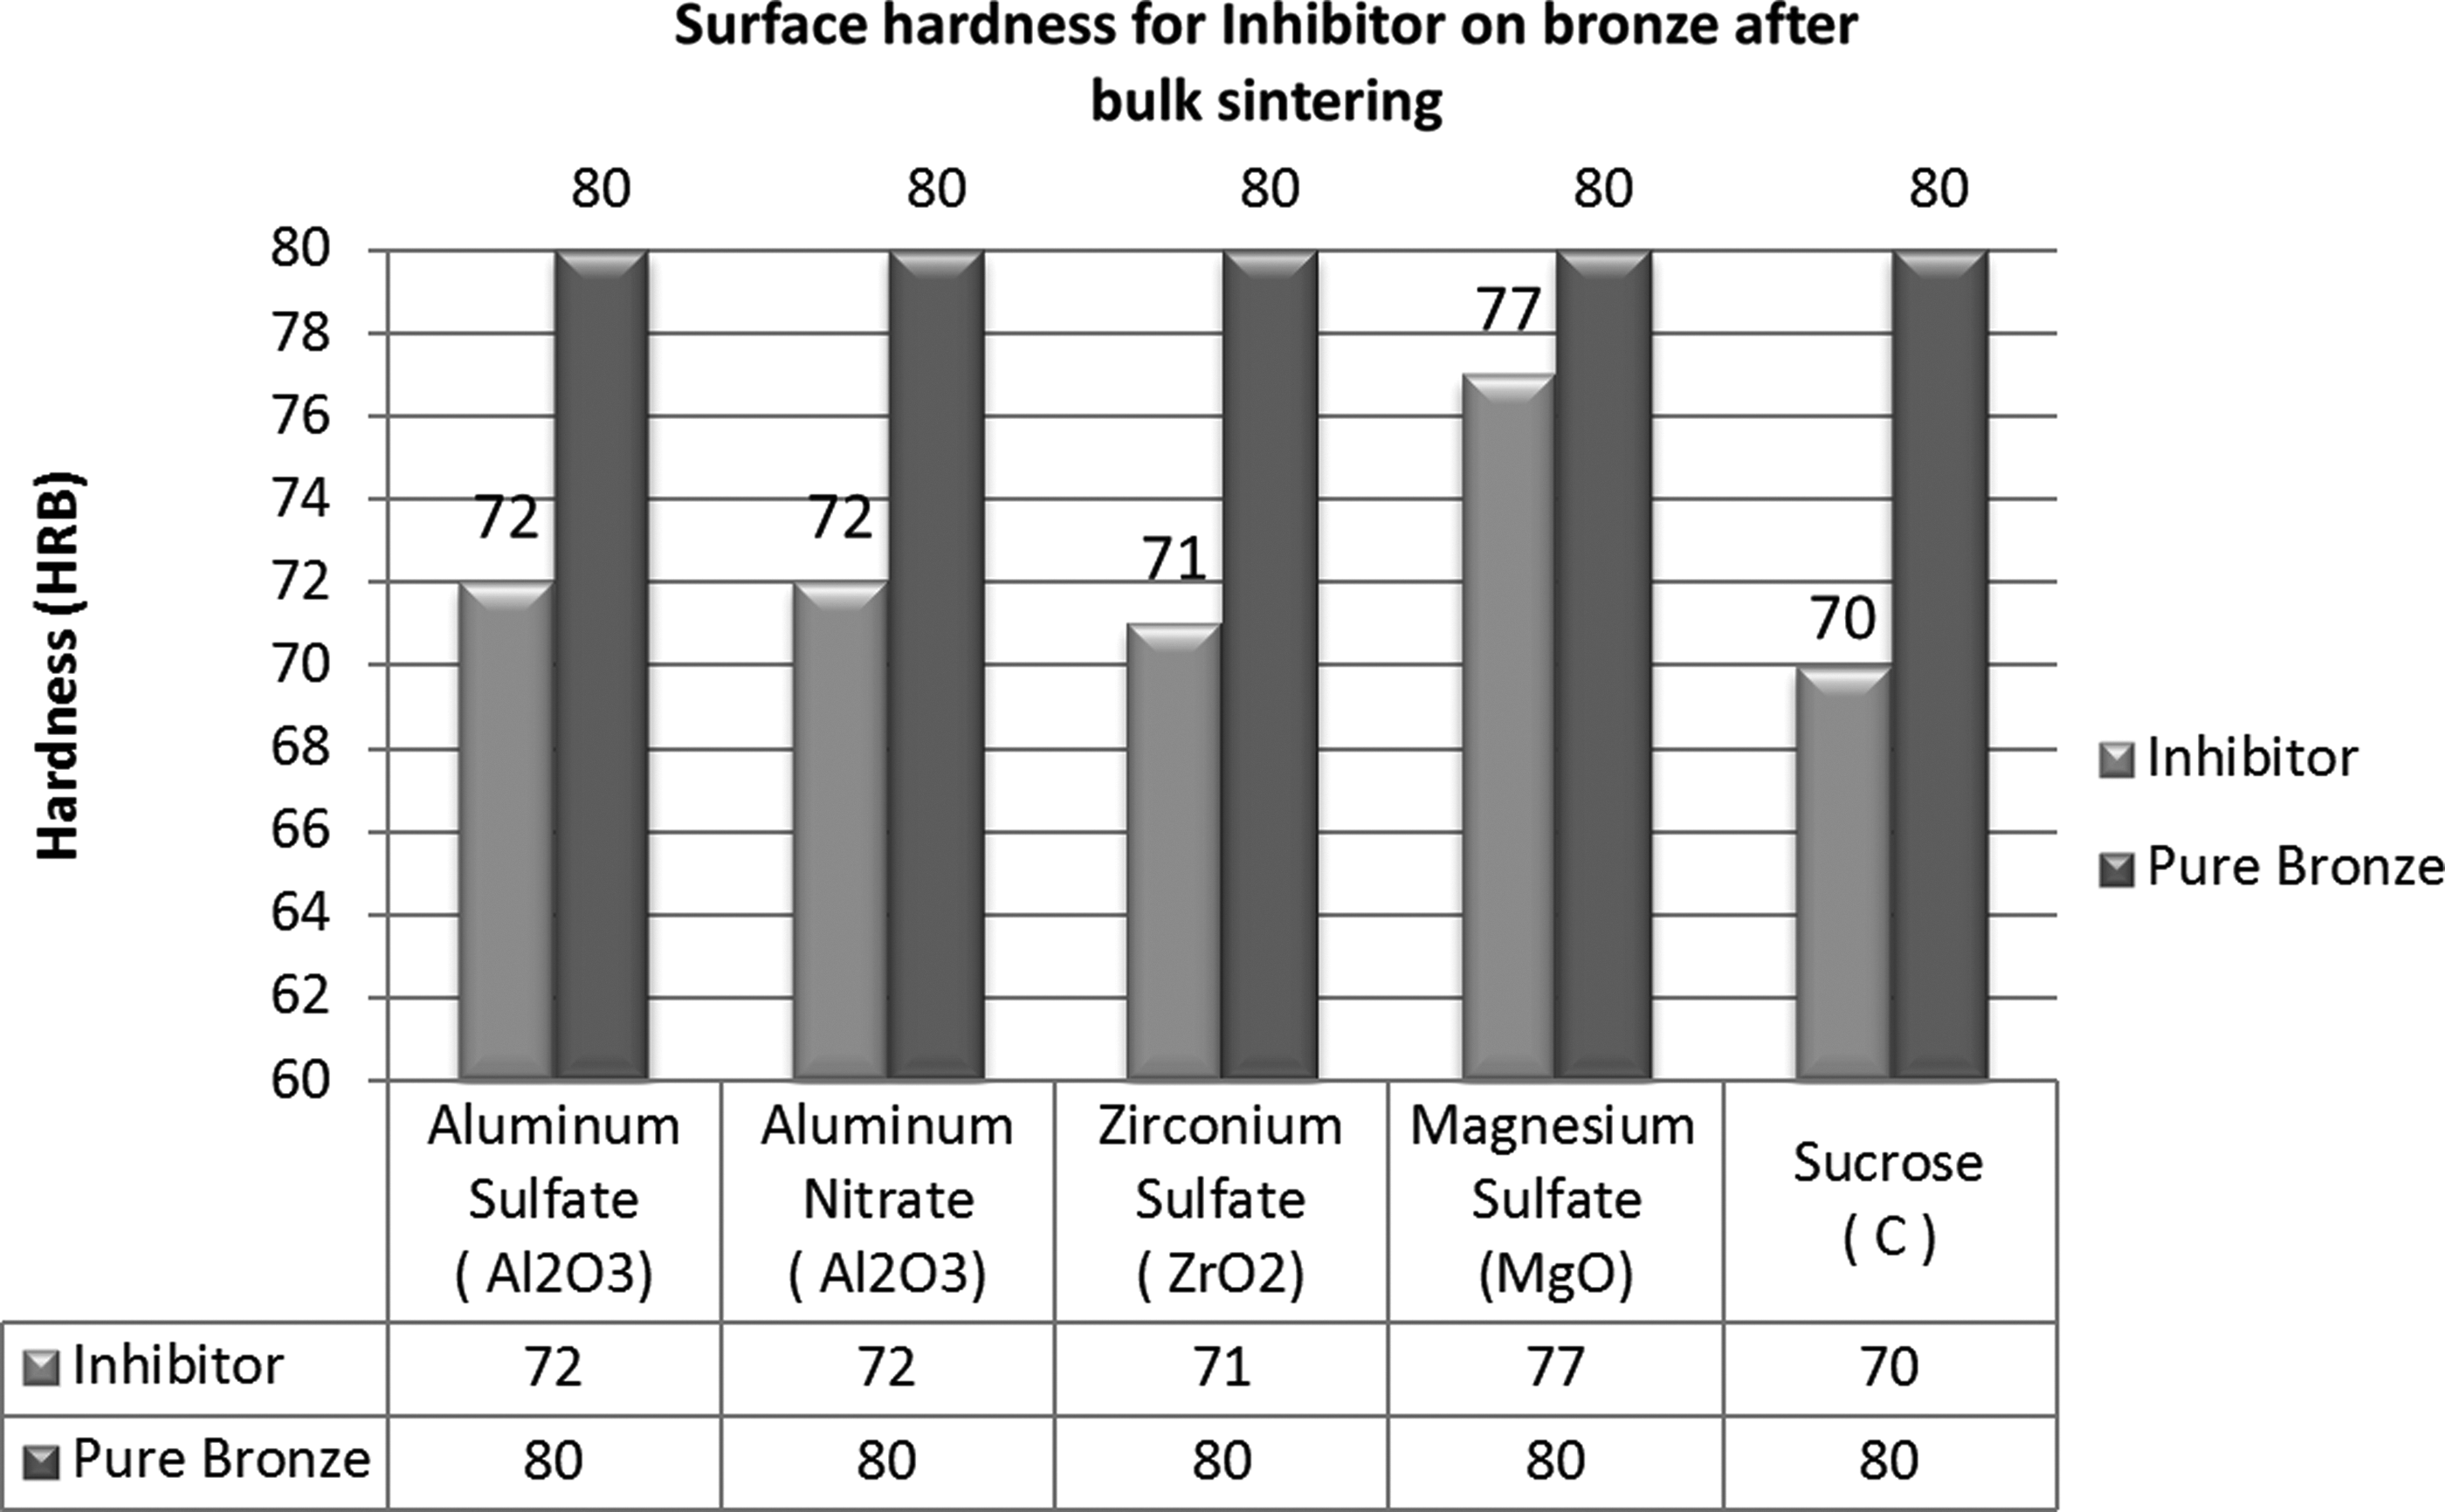
Surface hardness comparison between different inhibitors. HRB, Hardness Rockwell B.
Metal powder for SIS process
Several studies in the field of powder metallurgy have proven the superior mechanical properties of bronze and its applications.7,8 Bronze powder was chosen as base metal in this research. Mixed, partially alloyed, and fully alloyed bronze powders were investigated for this research. In the preliminary studies, it was observed that sintered parts with annealed, fully alloyed bronze powders (solid state sintering) showed better mechanical properties and more stability and uniformity in sintering (for the same sintering cycle) compared with mixed and partially alloyed bronze (liquid state sintering). The metal powder size and shape was chosen based on green part packing density and ease to spread the metal powder as a uniform layer during the green part fabrication. Spherical-shaped particles have a higher packing density compared with irregular-shaped powder metal. Considering all the aforementioned factors, spherical-shaped fully alloyed bronze powder with mesh size 325 (45 μm diameter) was chosen as the powder bed. The bronze powder used in our experiments (Bronze 5890) had the following chemical composition:
Copper: 89.79%
Tin: 10%
Lead: 0.025%
Zinc: 0.04%
Iron: 0.058%
Phosphorus: 0.085%
The powder particle size has the following distribution:
325 Mesh (44 μm): 98.7%
200/325 Mesh (44–75 μm): 1.3%
Green part fabrication
A three-axis prototype machine was developed to be used as a test bed to fabricate the green parts by deposition of droplets on a powder bed. The machine had three axes. One axis was for controlling the up-down movement of the platform, build tank. For every layer, the platform moved down one layer thickness to accommodate the new layer of powder. The two other axes were for controlling the movement of a dispensing valve, which deposited the inhibitor on every layer. A single-print nozzle, solenoid valve, with an orifice size of 0.005″ (0.127 mm) was used for the dispensing salt solution/ceramic agent. The deposited droplets from the nozzle are 300 nL. The nozzle moved in the X and Y axes by stepper motors with a continuous speed of 30 mm/s, which can be adjusted depending on the metal powder bed and deposited solution. A heater was used to heat up every layer after printing to dry the inhibitor in the printed sections. Every layer was heated up to ∼110°C to dry up the delivered inorganic salt solution.
Sintering
After completing all layers, the fabricated green part is transferred to a sintering furnace. Sintering is done in an inert environment with argon gas or under high vacuum (both environments showed similar results). The preliminary sintering sequence that yielded an acceptable mechanical property was determined to be: sinter the part at 600°C for 15 min, increase temperature to 810°C for 10 min, and finally slowly cool down the part. The effect of sintering temperature and sintering time on the strength of the sintered coupons was investigated by the aid of DOE methodology. A full factorial design with the aforementioned two factors, two replicates, and two center points was conducted for this study. The upper limit (+1) and lower limit (−1) for every factor is shown in Table 1. The strength of the coupons after sintering under different sintering parameters was quantified by measuring the surface hardness (HRB) and tensile strength (a micro-tensile device was incorporated to measure the tensile strength).
Full Factorial Design Factors for Sintering Parameters
Surface hardness test
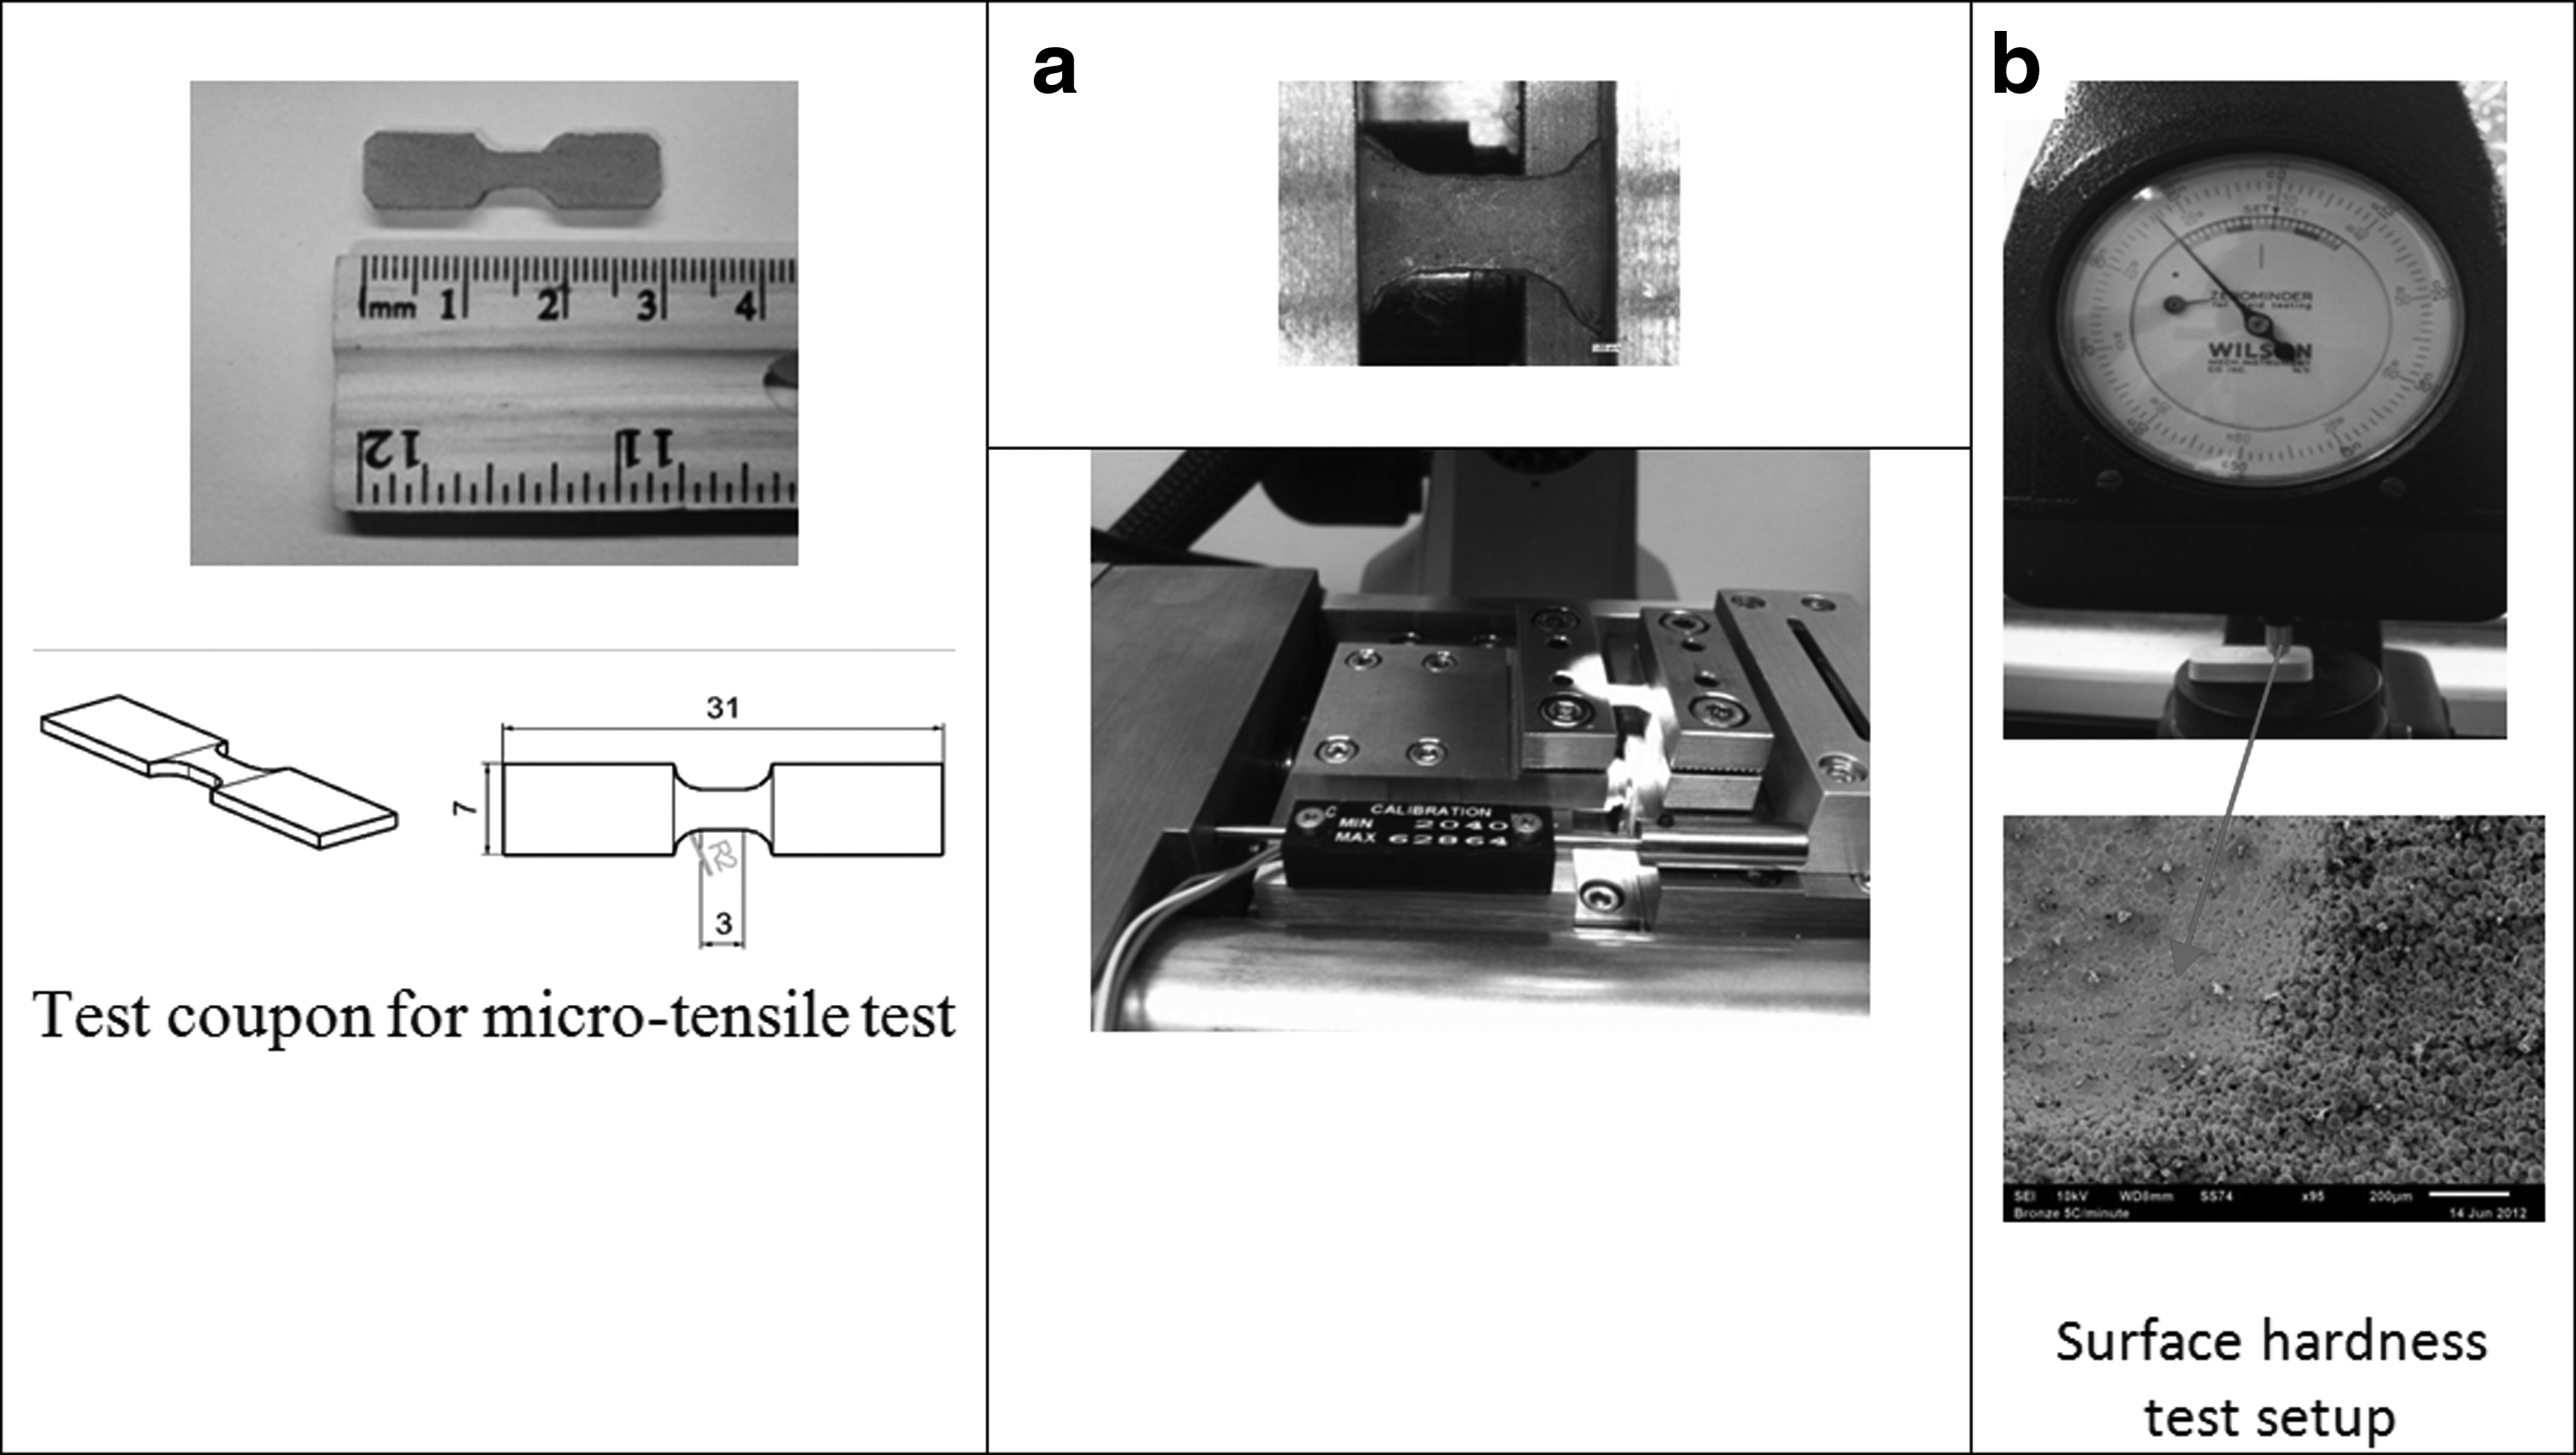
HRB was used to measure the surface hardness. For measuring the surface hardness of the printed sections after sintering, a ball indenter with a diameter of 1.58 mm was used to press into the specimen; an initial test pressure equal to 10 kg-force and a main test pressure equal to 100 kg-force was applied on the indenter in sequence, the total force 110 kg-force was kept for 5 s, and finally the 100 kg-force was removed. The e value, which is the difference between the indent depth under the total load and the initial load, was recorded. The hardness values are calculated by the following equation:

Micro-tensile test for loose powder sintering
A nonstandard tensile test was carried out to measure the yield strength and ultimate tensile strength of the sintered parts at different settings for the printed and nonprinted sections. For the mechanical testing, the parts were made with a dimension and setup shown in Figure 3. The experimental setup consists of the test coupon, a force sensor, two-dimensional adjustable stages, a microscope, a displacement sensor, and a piezoelectric motor. The strain rate was chosen to be 0.1 mm/min.
Mechanical characterization setup for
Results and Discussion
Sintering inhibition
Preliminary test cases were conducted to study the effect of sucrose solution on bronze powder for the SIS process. SEM micrographs for a coupon before and after sintering at 810°C for 10 min are shown in Figure 4. It was observed from SEM micrographs, as shown in Figure 4c, that ultra-fine (as fine as 1 μm) graphite particles pin to the surface of metal particles. The particles were dispersed and distributed across the metal in the printed sections. The particles retard the sintering process and prevent the boundary of the part (printed sections) from sintering. To confirm the composition of the particles pinned to the metallic particles after sintering, EDS was conducted to analyze and characterize the chemical composition of the particles pinned to the surface of bronze. The EDS results of the test case after sintering are shown in Figure 5. As can be seen from Figure 5, the graphite particles pinned to the surface of bronze show 10 wt.% on bronze. The distribution of different elements in the bronze-sucrose cross-section after sintering is shown in Figure 6. As can be seen from Figure 6, there was a semi-uniform distribution of carbon particles on the bronze powder bed, which showed a uniform dispersion and distribution of carbon on bronze that pins to the surface of bronze.
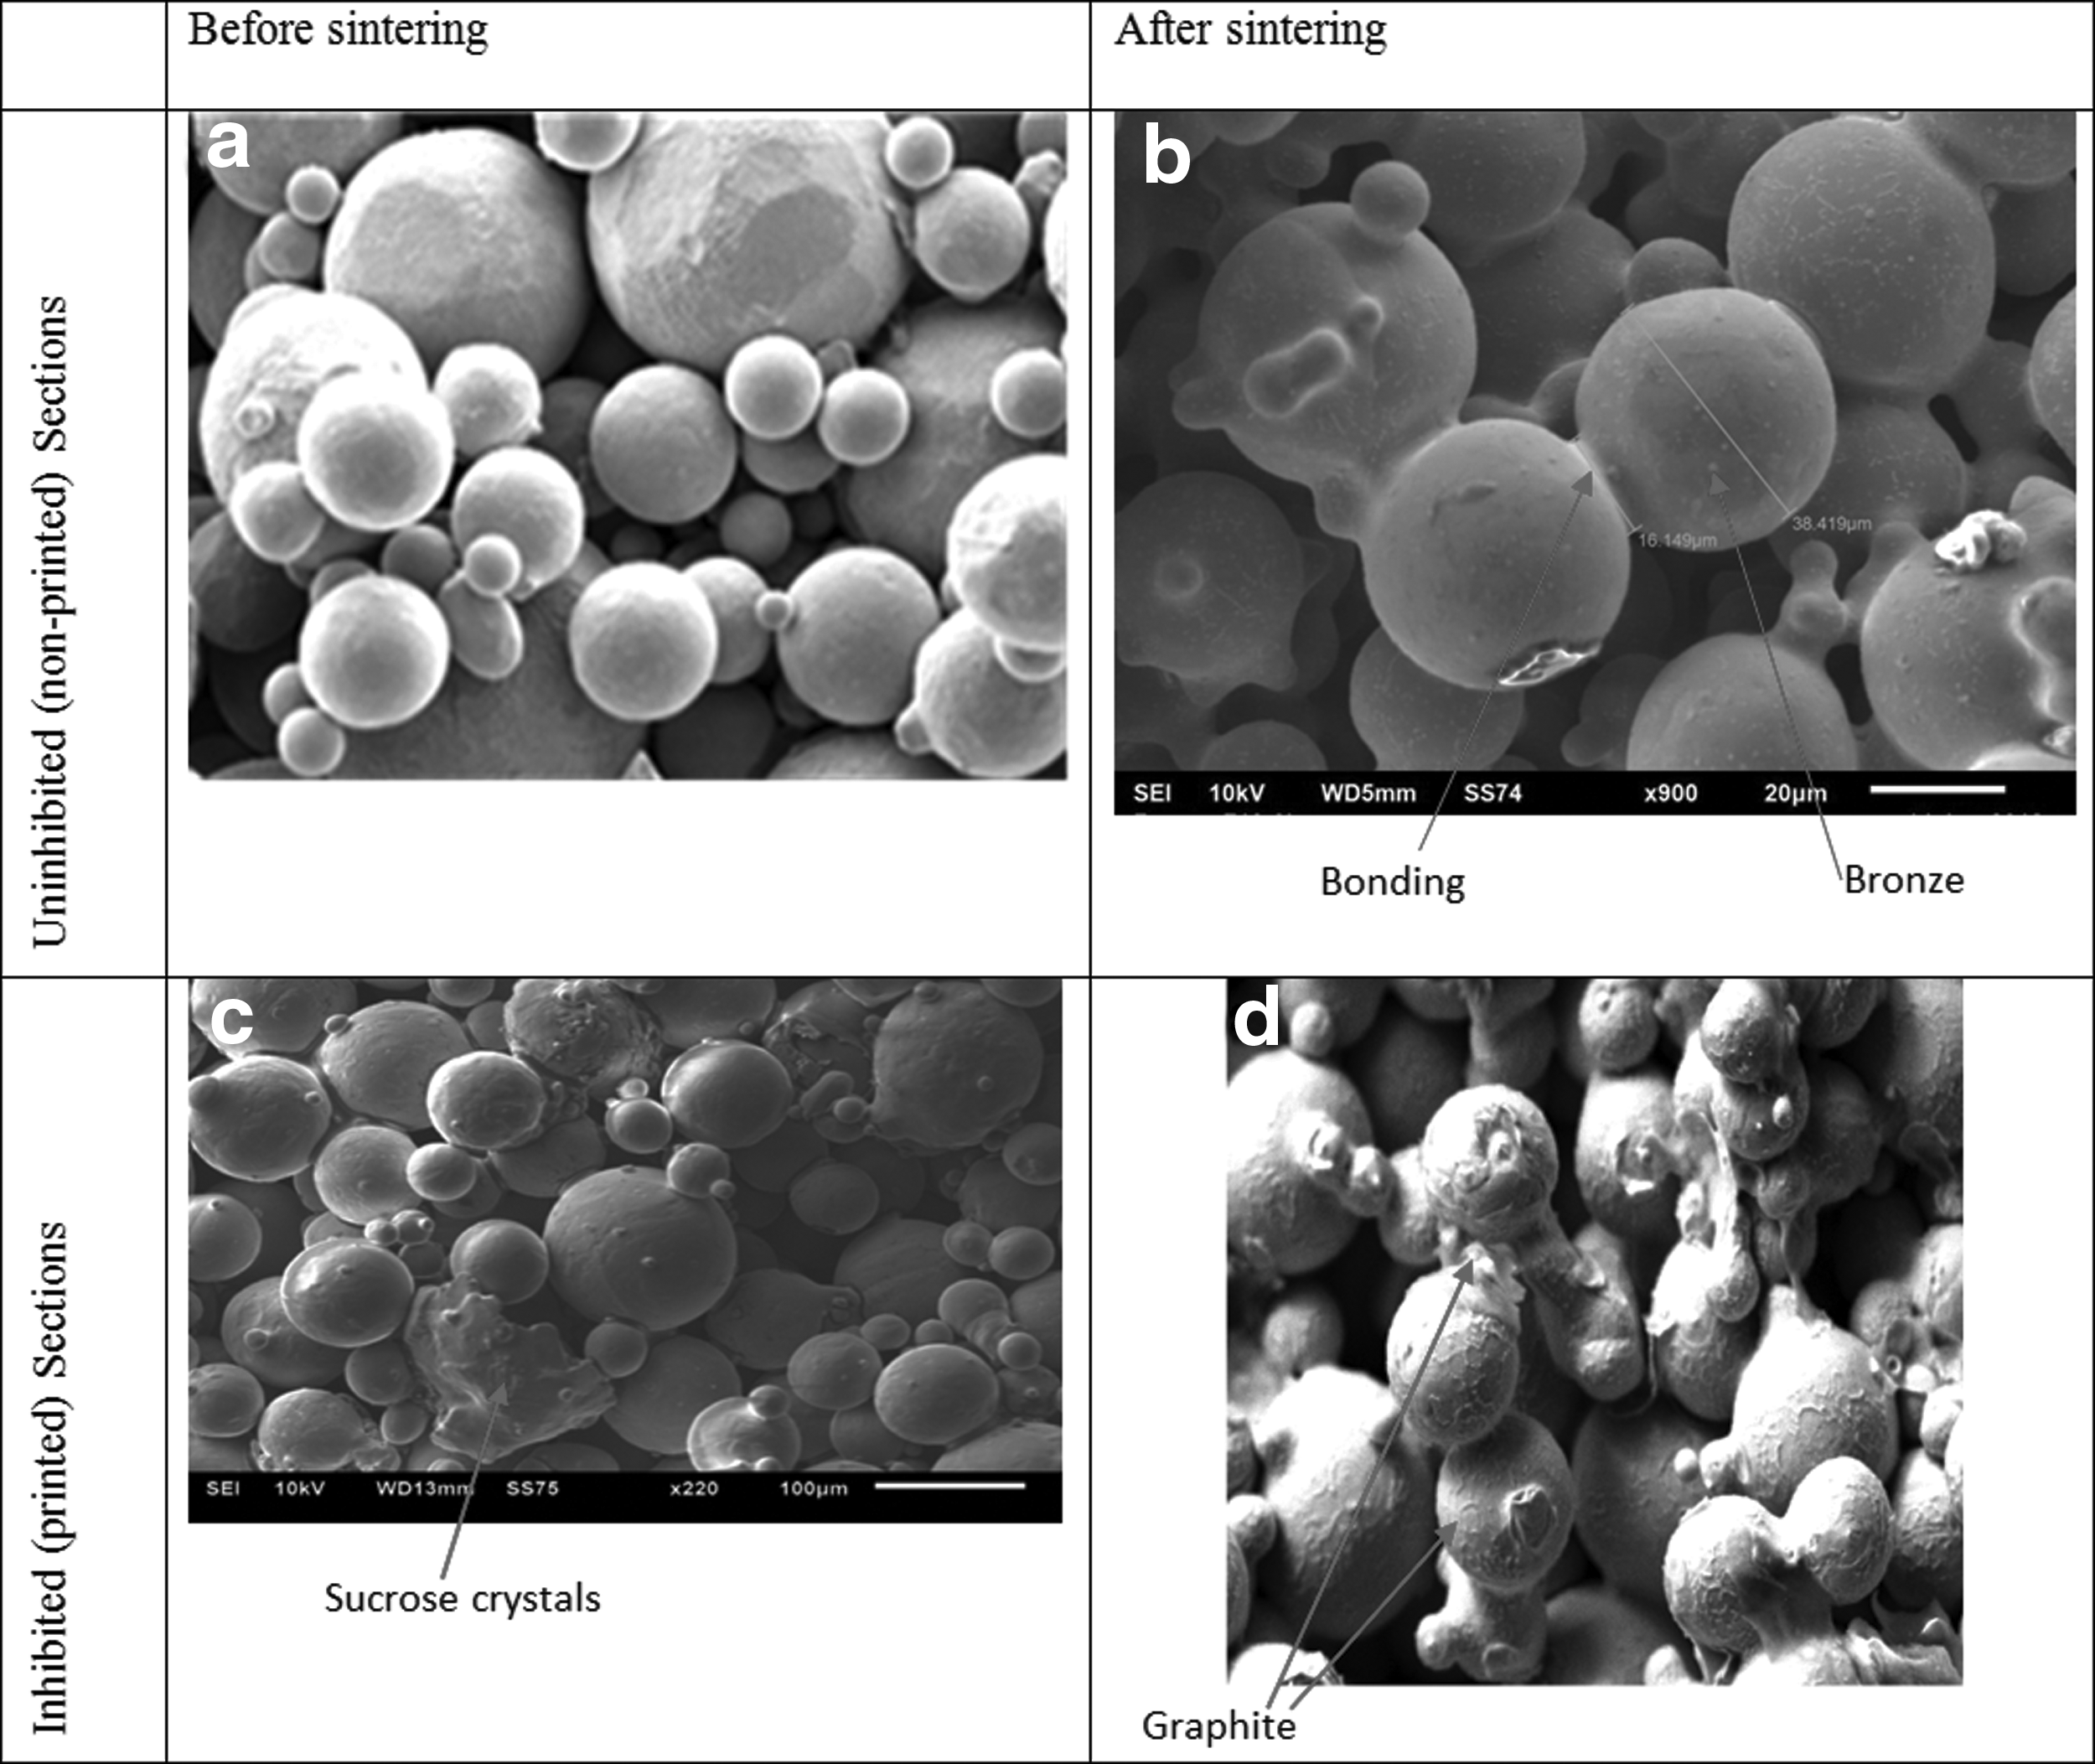
SEM micrograph
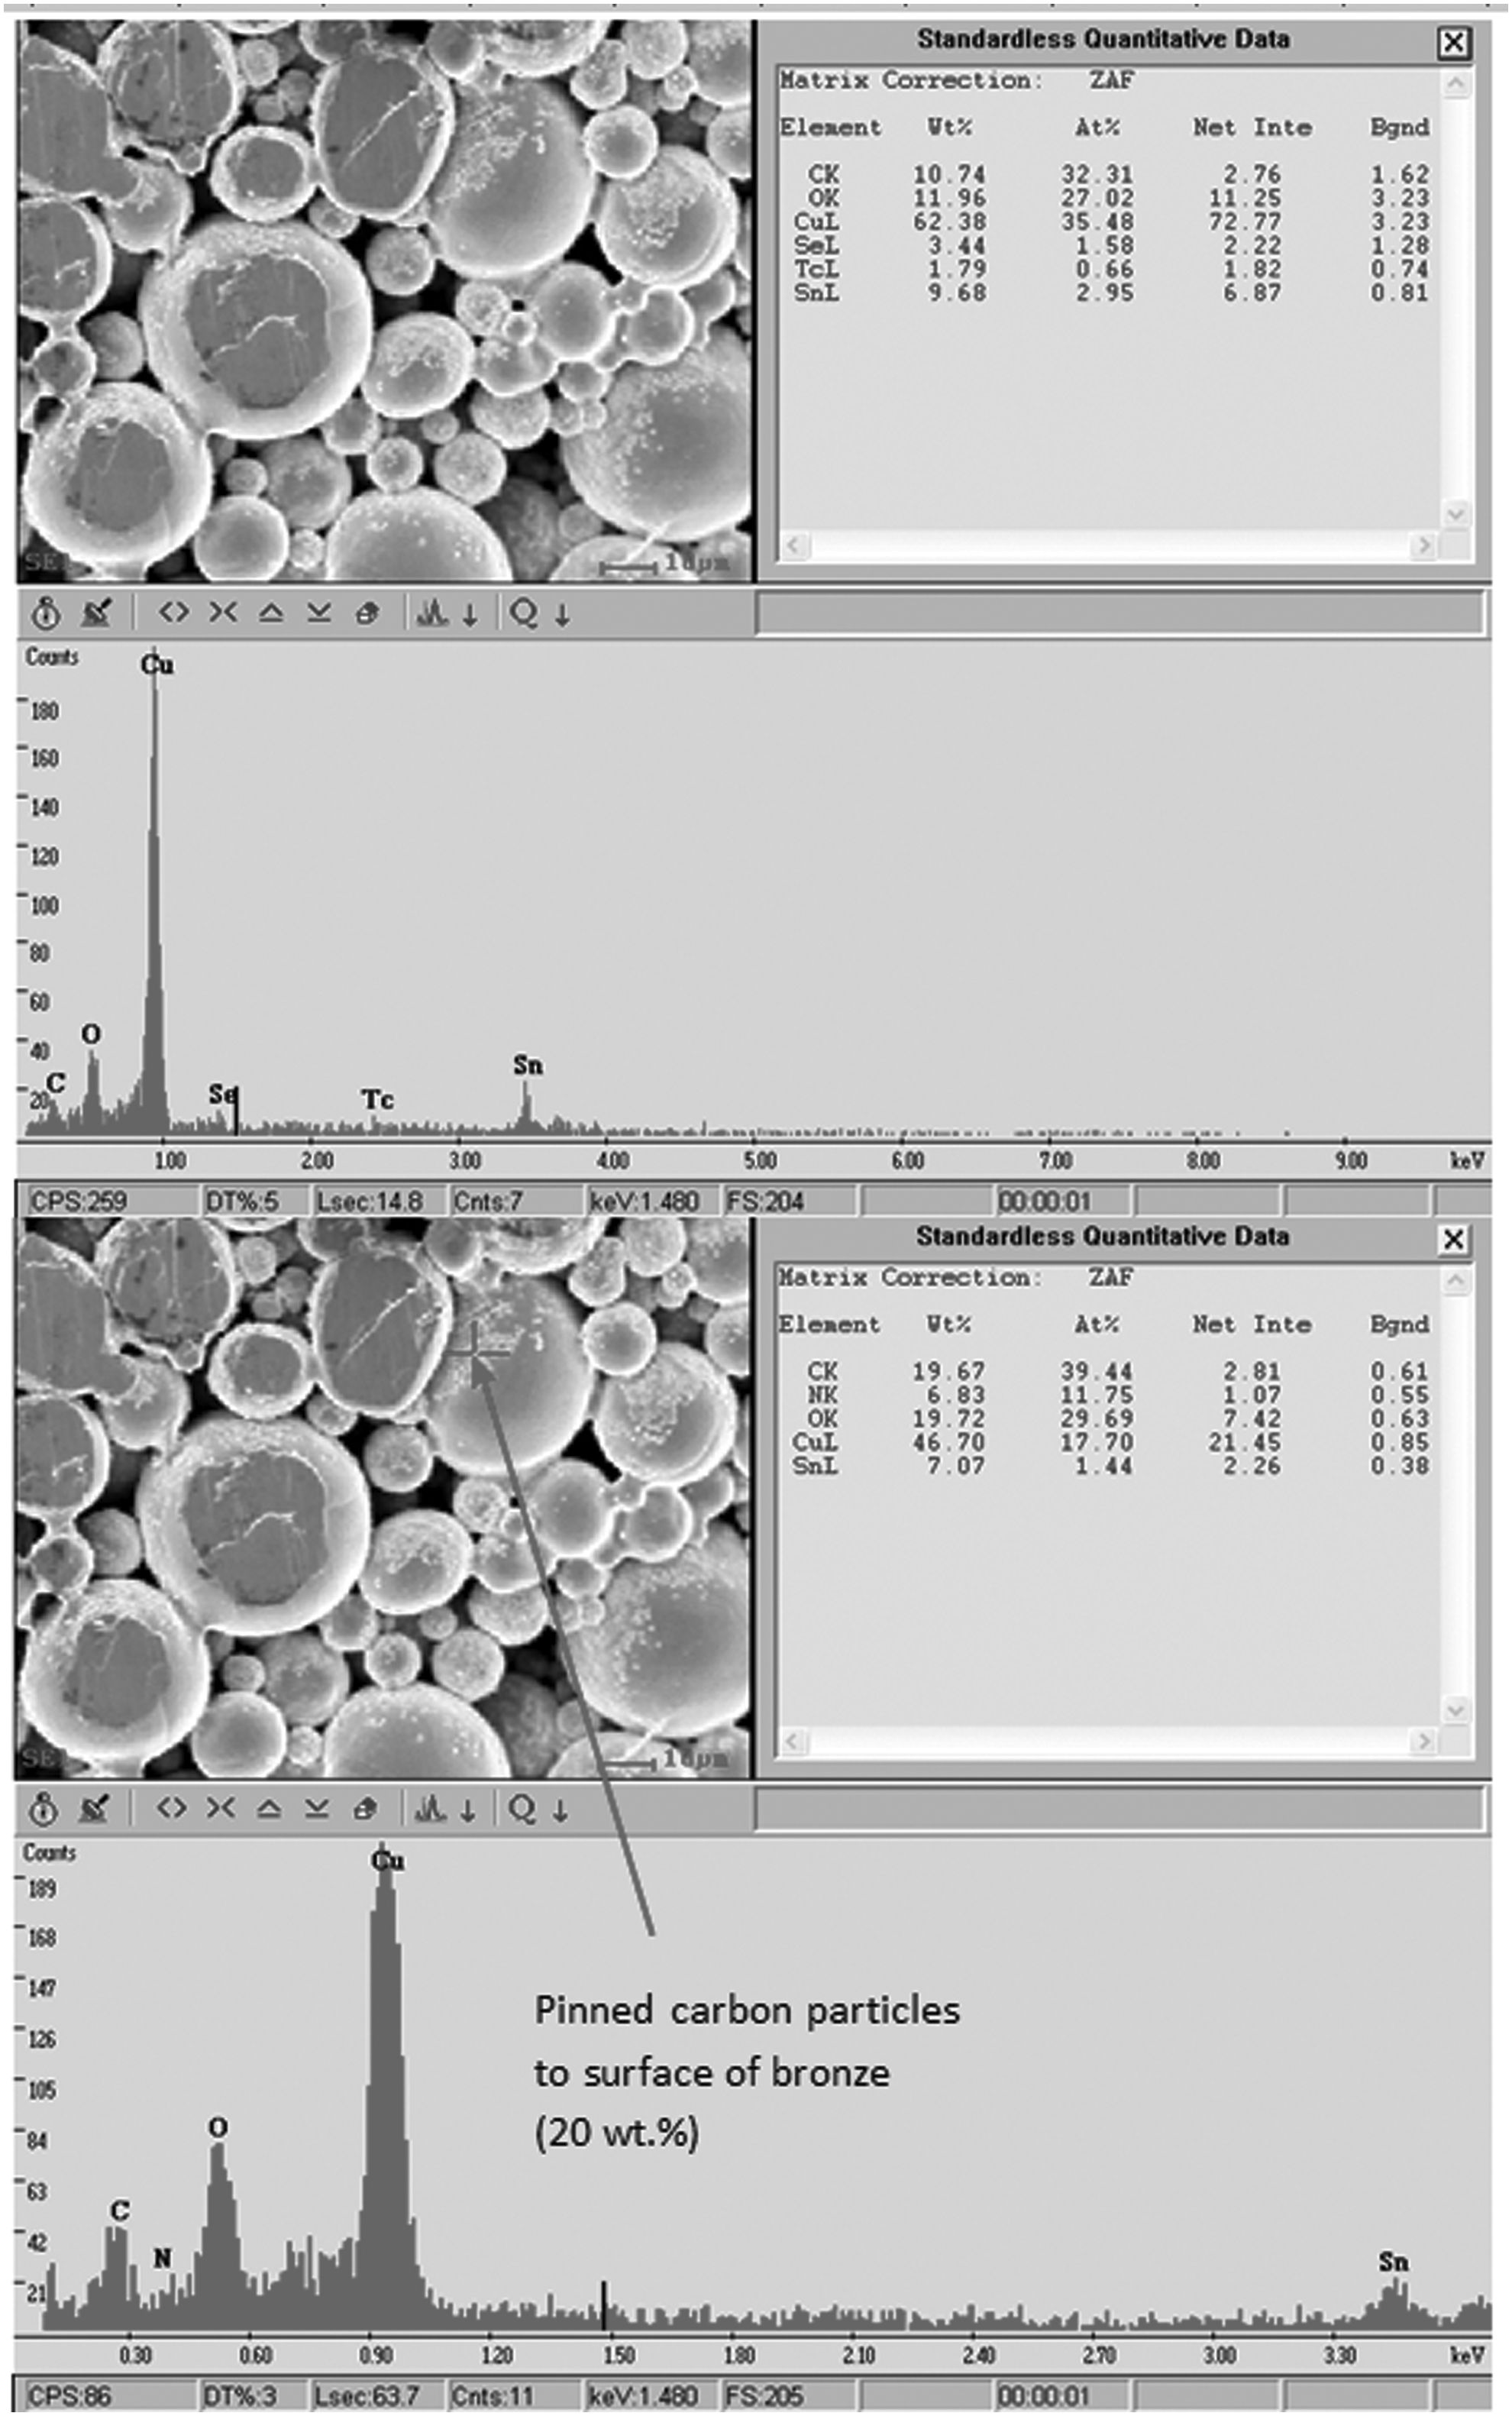
SEM image of a sintered sample with printed sucrose and the related energy-dispersive X-ray spectroscopy analysis.
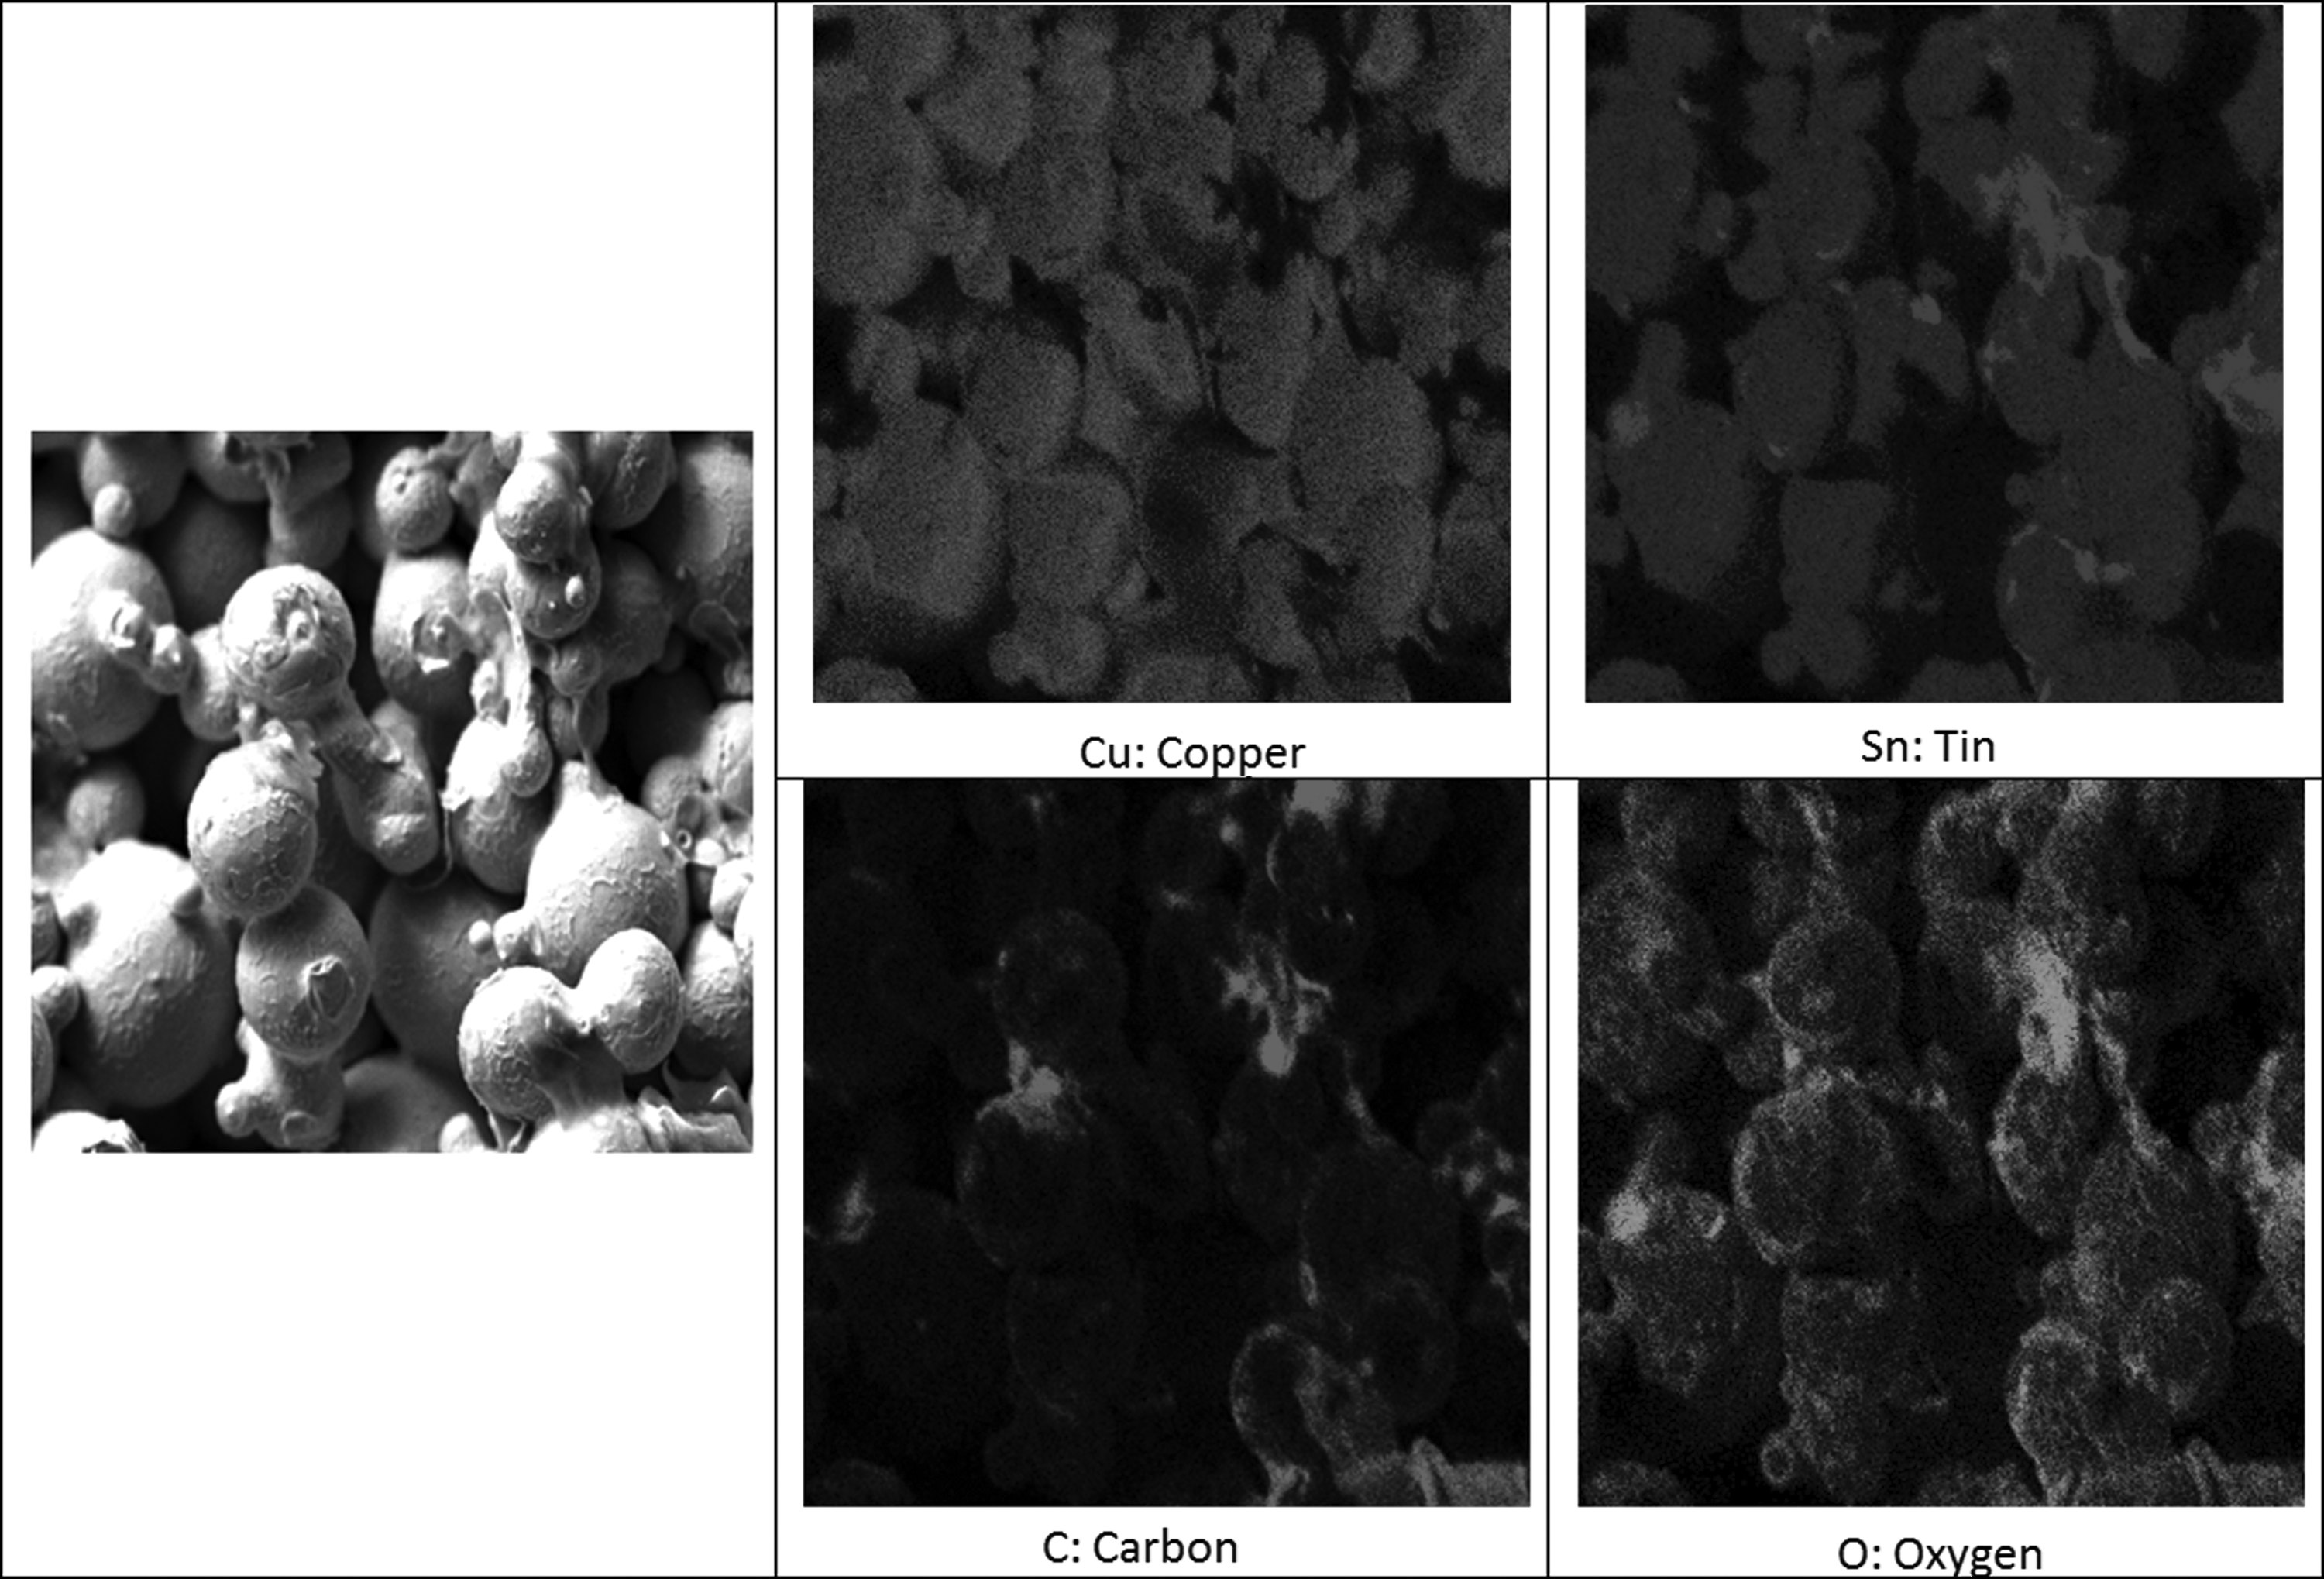
Distribution of different elements in the bronze SIS process.
By studying the SEM micrographs and the related EDS analysis during sintering and studying the sugar decomposition by previous literatures,15,16 the following was concluded: Sugar starts to decompose at 185°C 16 and fully decomposes at around 820°C, which is the maximum sintering temperature used in the SIS process for bronze. The decomposition reaction for sugar is shown next:

The carbon left behind gave a carbon coating to the affected metal particles. Carbon particles are spread uniformly on the metal powder and slow down the surface diffusion and grain boundary diffusion during the solid-phase sintering process.
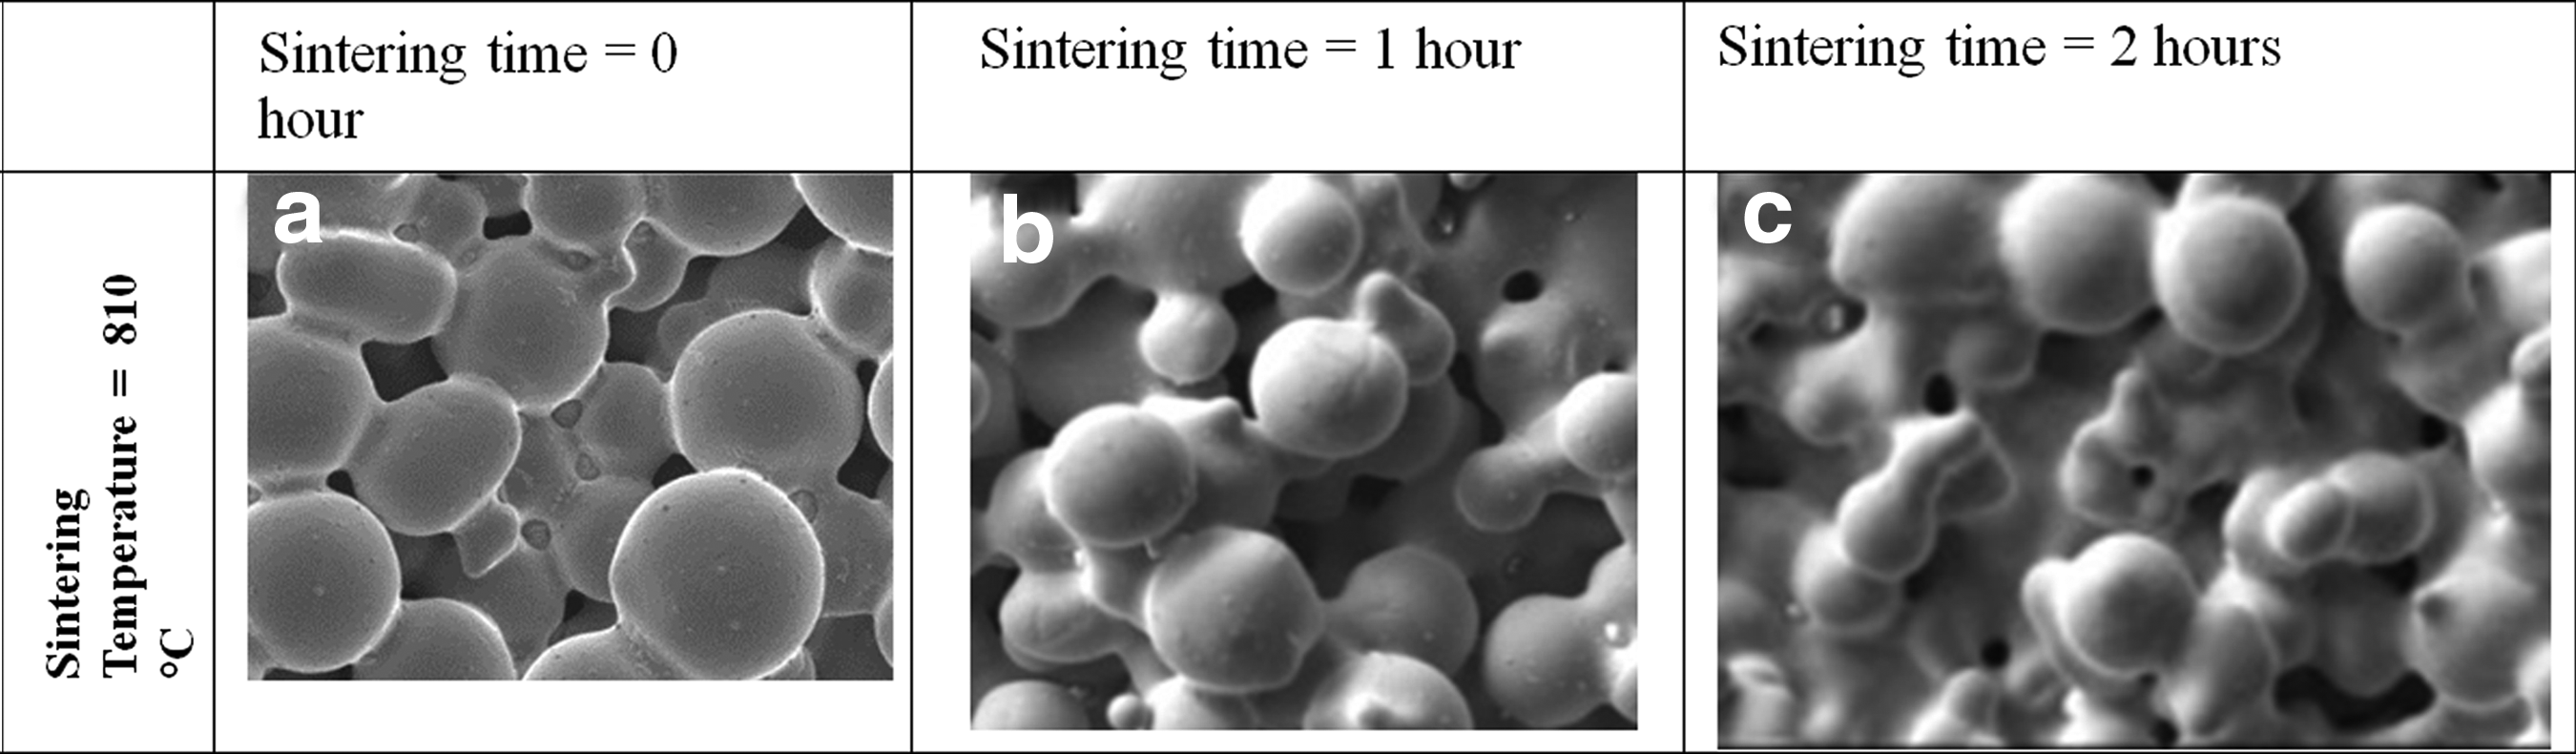
Sintering time and sintering temperature were two of the most important factors (main process parameters) that affect the SIS process. To find the effect of effective factors and their interaction on the mechanical properties of the boundary and the part, the full factorial design model discussed earlier was analyzed. The significance level was chosen to be 5%. So, if any factor or its interaction with another factor has a p-distribution of 5% or less, then it will be significant and the null hypothesis will be rejected for that factor.17,18 The mechanical properties (shrinkage rate, surface hardness, and yield strength) for different sintering settings are shown in Table 2. As can be seen from Table 1, with the increase of sintering time and sintering temperature there is an increase in the surface hardness for both the printed sections and nonprinted sections. The same pattern can be observed for the yield strength. To further analyze the stress-strain behavior for the printed and nonprinted sections, the stress-strain diagram for sintering at 810°C for a duration of 1 h is shown in Figure 7. As can be seen from Figure 7, the sintering retardation decreased the yield strength from 103 MPa to 84 MPa. This decrease in yield strength and ultimate tensile strength was in confirmation with a decrease in sintering rate. For the same sintering conditions (810°C, 1 h), the sintering retardation decreased the surface hardness from 88 HRB to 82 HRB. This decrease in hardness was also in confirmation with a decrease in sintering rate. The surface hardness and yield strength for other sintering conditions depicted in Table 2 showed a similar pattern. The difference of surface hardness between printed and nonprinted sections becomes significant at higher temperature and higher time, which is an important factor for the SIS process. The SIS process is based on the difference of sintering rate between printed and nonprinted sections, which correlates to mechanical properties between the printed and nonprinted sections. The SEM micrographs for various sintering conditions for printed sections are shown in Figure 8. As can be observed from Figure 8, the necking between two bronze particles increases as both the sintering time and temperature increase. It can also be observed that with the increase of time the necking shows an overall increase. It can also be observed that at the highest sintering setting (810°C, 2 h) the pores are still interconnected and the sintering is still occurring at the initial stage of sintering. The SEM micrographs for the same sintering conditions are shown in Figure 9. As can be seen from Figure 9, the sintering rate has a significant increase from 0 to 2 h. It can also be observed that after 2 h of sintering the pores are not interconnected and intermediate stages of sintering start to occur. The analysis of variance (ANOVA) table for the printed coupons under different sintering conditions discussed in Table 1 is shown in Table 3.
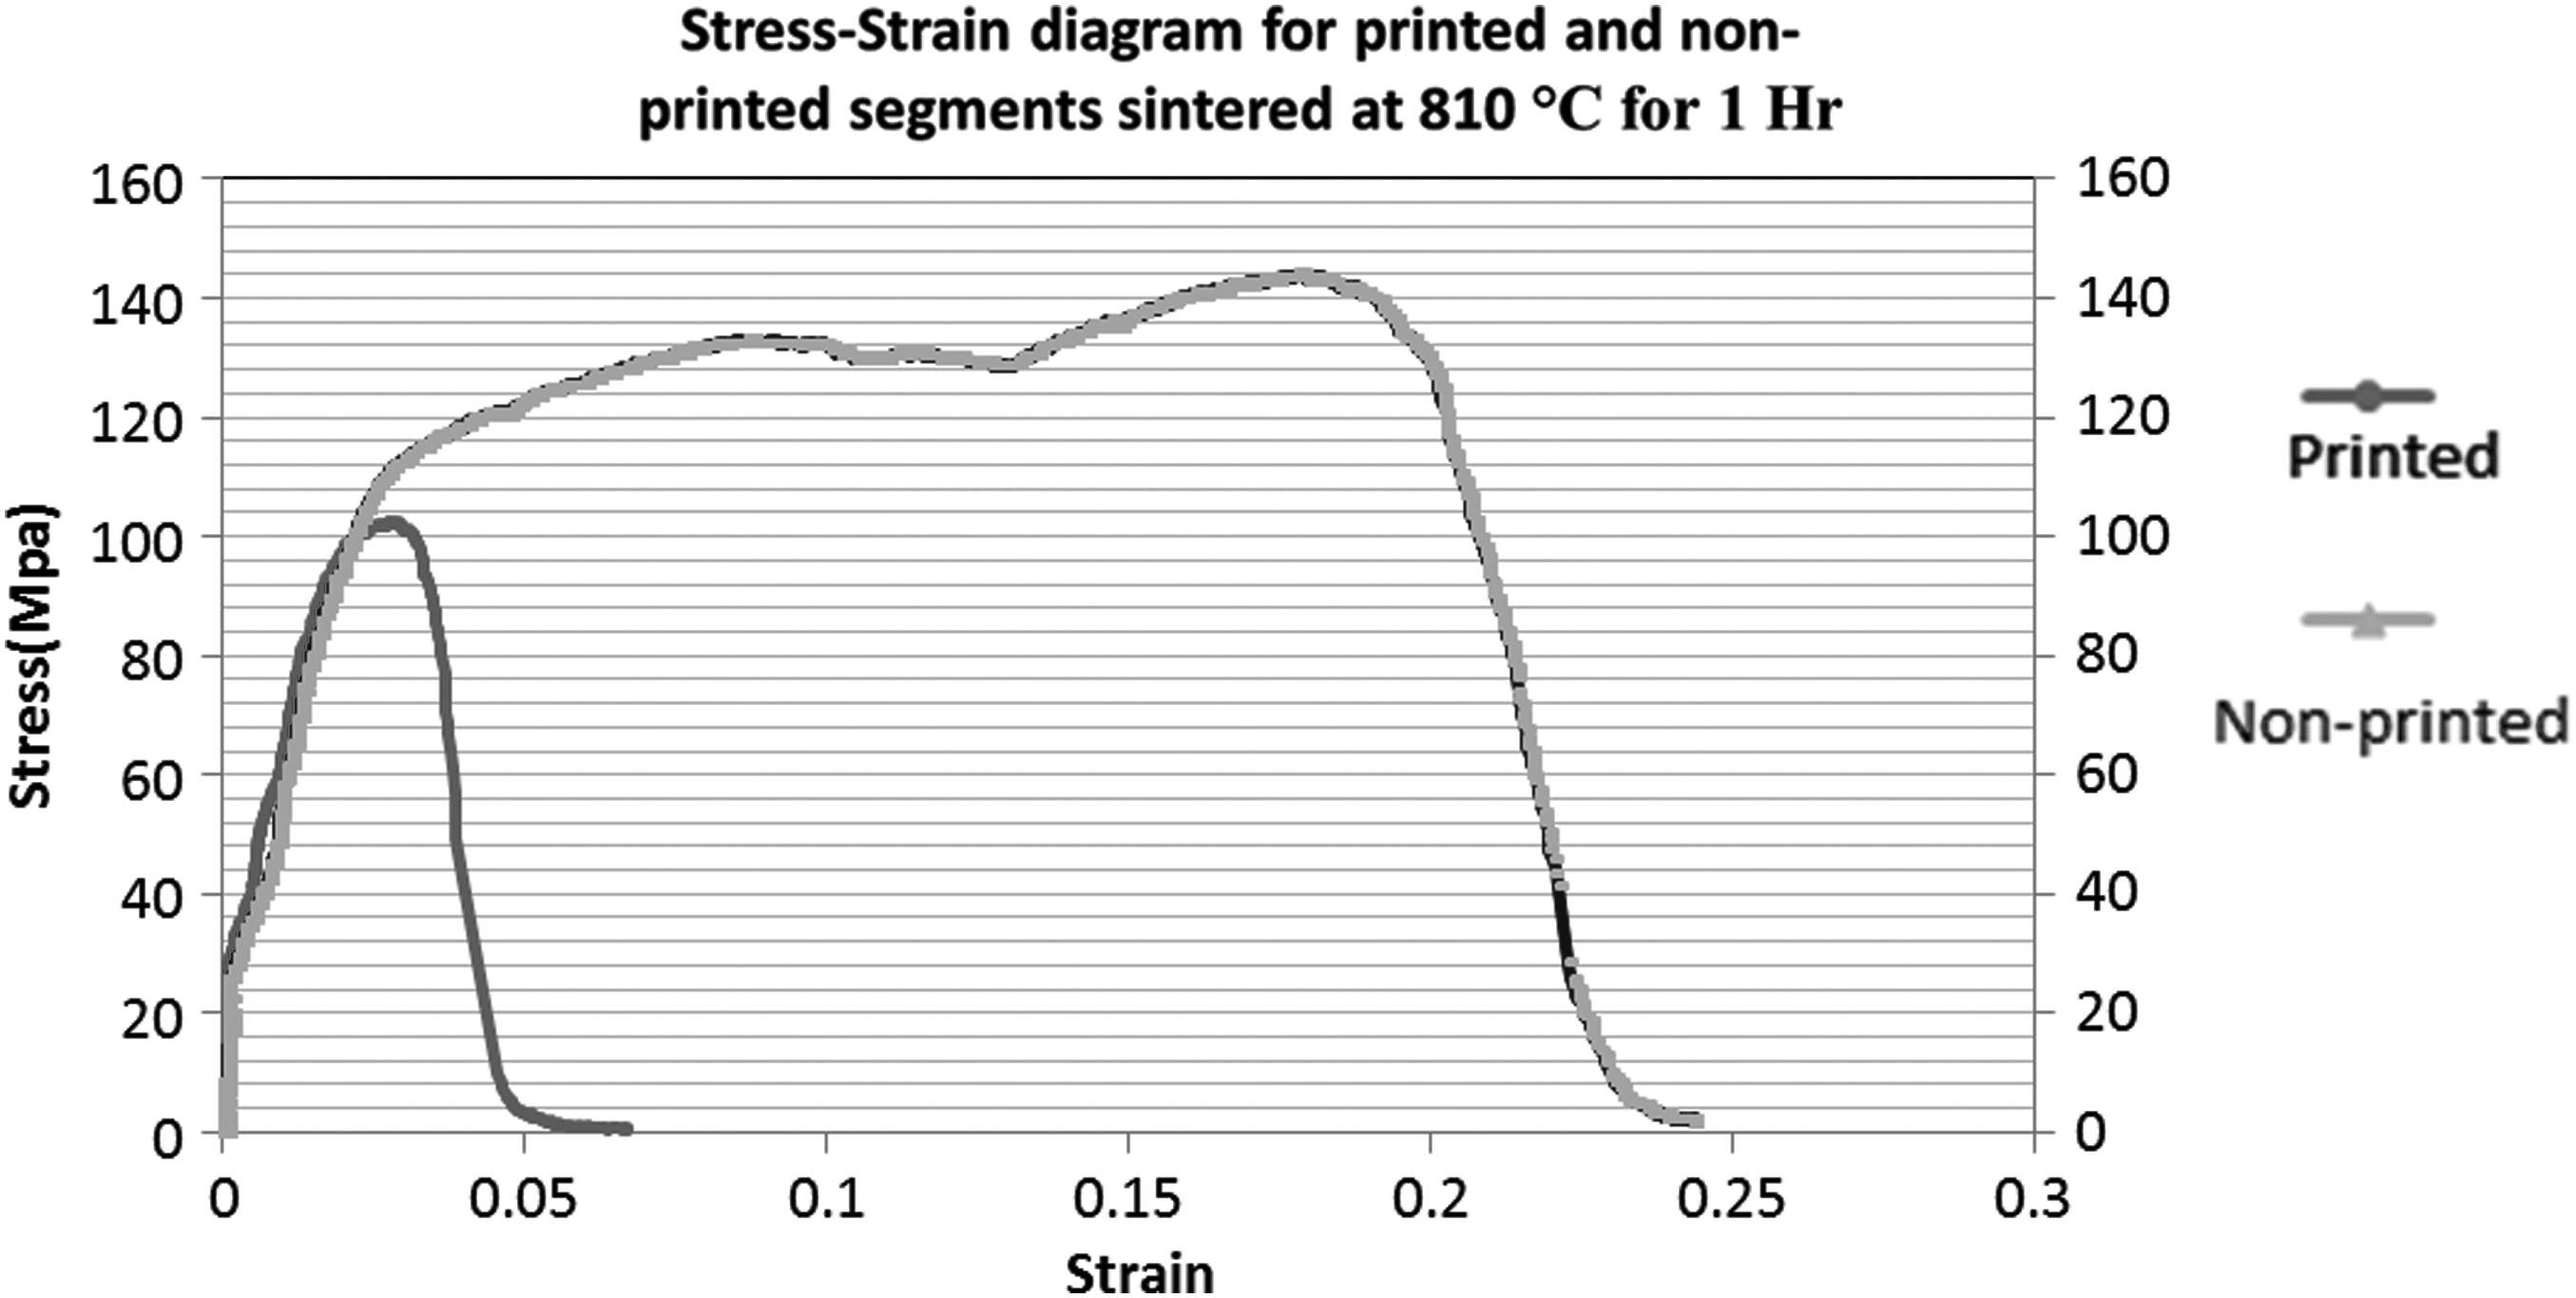
Stress-strain diagram (micro-tensile test) for sintering at 810°C, 1 h.
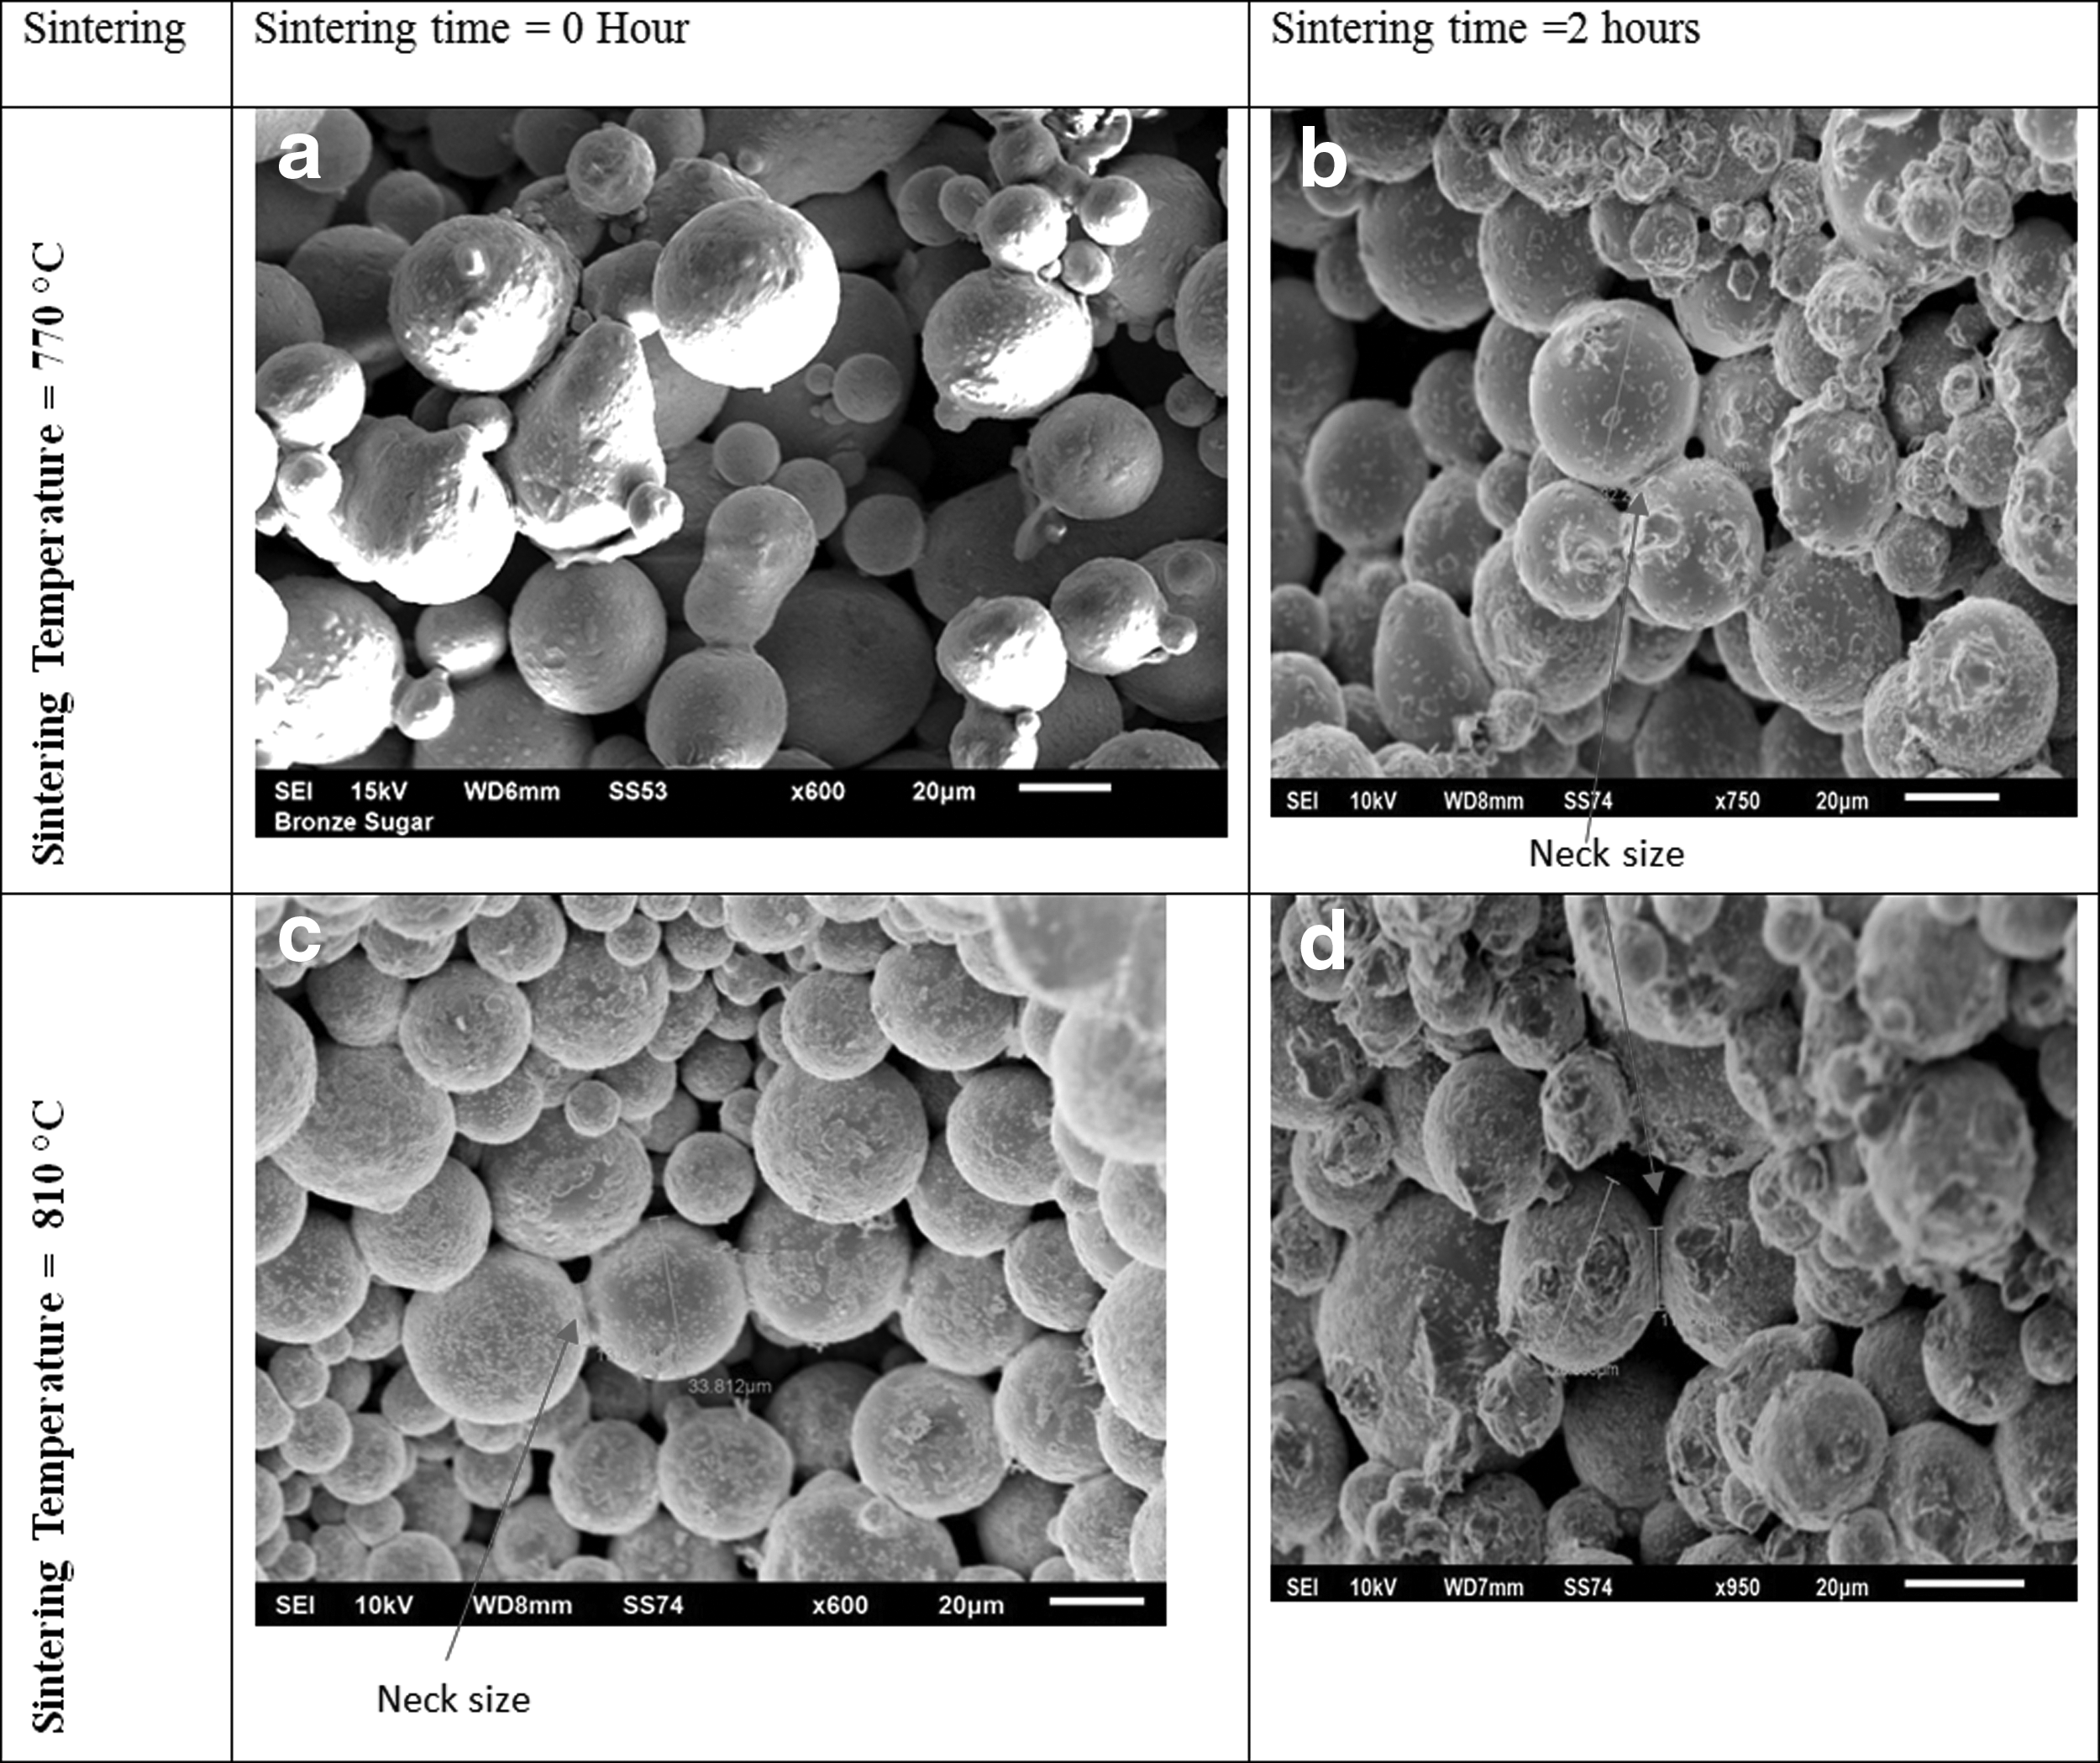
SEM micrographs
SEM micrographs
Mean Value of Mechanical Properties for Selective Inhibition Sintering After Sintering
HRB, Hardness Rockwell B.
Analysis of Variance Table for Linear Regression Model for Hardness Rockwell B for Printed Sections
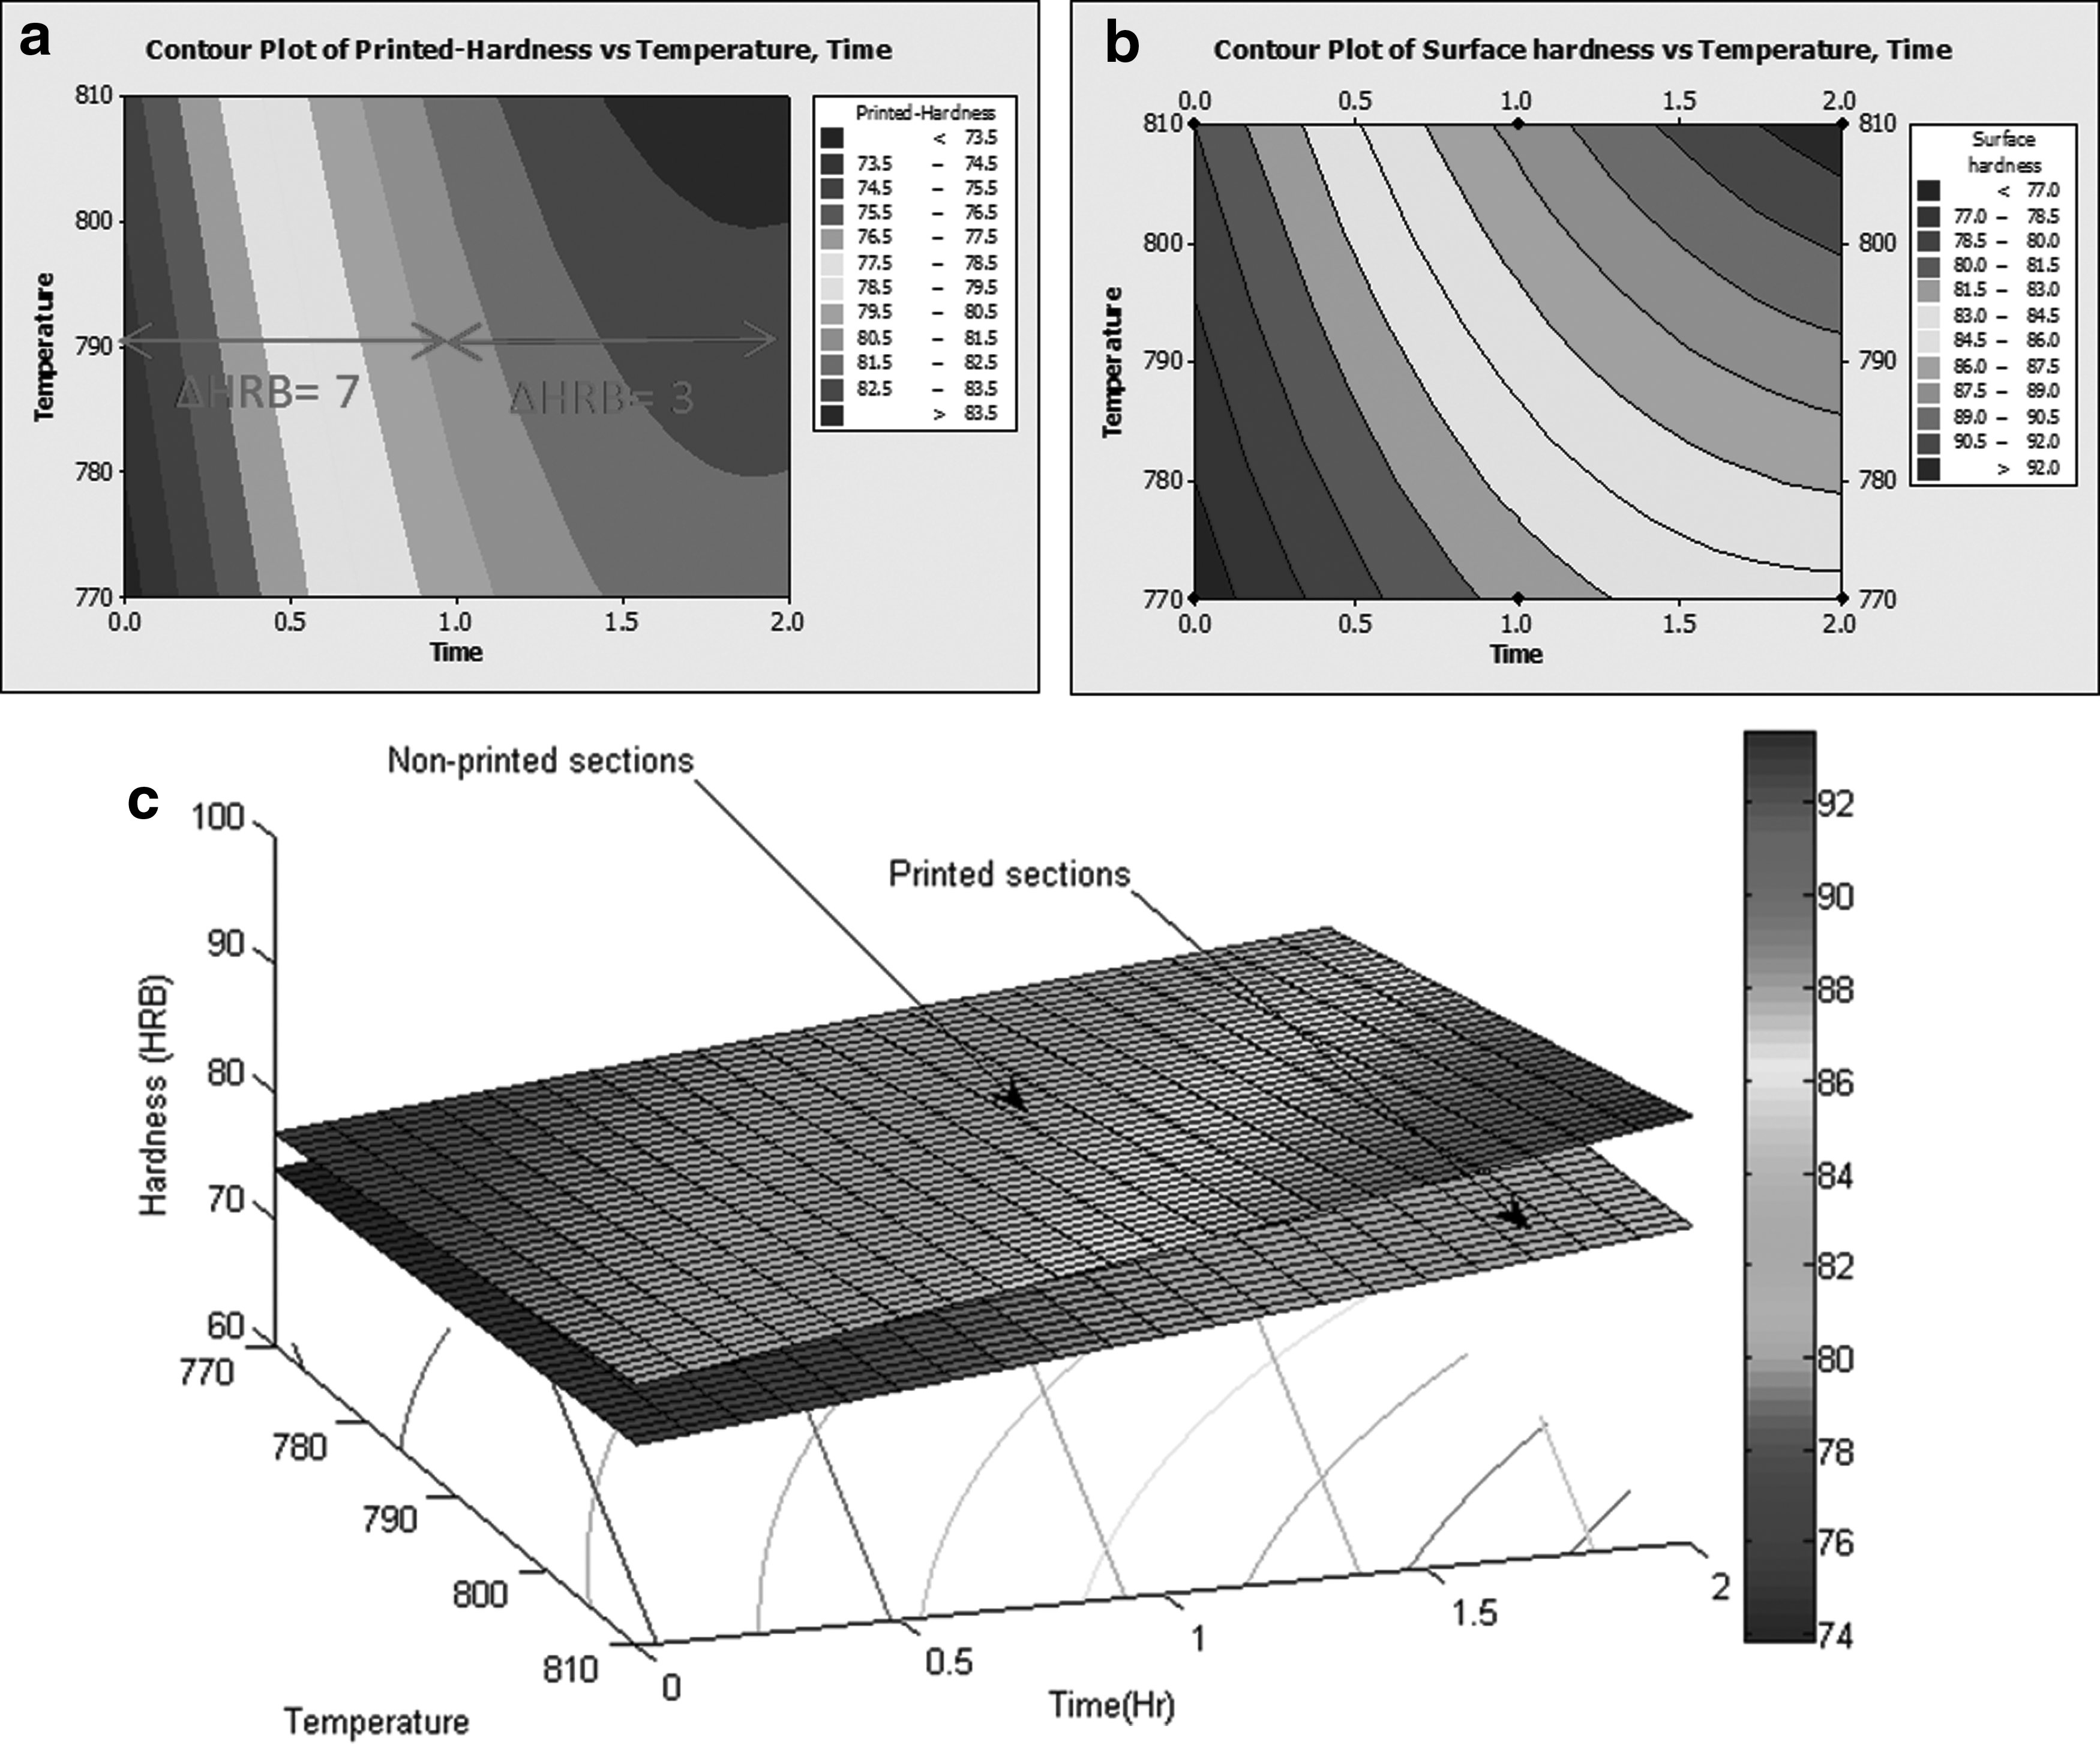
As was shown in the ANOVA table for printed sections, the p-distribution value for time is <5%, indicating that time is significant. The p-value for temperature is >5%, indicating that temperature is insignificant in the chosen range. It should be noted that temperature is insignificant for the range of 770–810. The interaction plot for sintering time and sintering temperature on surface hardness of printed sections is shown in Figure 10a. It can also be observed from Figure 10a that sintering time is more significant than sintering temperature for the chosen range shown in Table 1. It can also be observed from Figure 10a that surface hardness has a faster change at lower sintering times (smaller spacing between contours) and the change of hardness slows down as the sintering time increases (larger spacing between the contours). This is in confirmation with previous literature studies.10,11 Prior studies have developed generic models to show how the dispersed particles pinned to the surface of metal retard the surface movement (sintering process).10,11 The force exerted by the bronze surface on the carbon particle pinned to the surface of bronze is shown in Equation (3) given next10,11:
Surface hardness plot

where F is the force applied on a single carbon particle, a is particle (carbon) radius, γ1 is the surface energy of the substrate (bronze), and α is contact angle between bronze and carbon.
During the bulk sintering process, high curvature regions (high stress regions on metal surface) are filled in by a flow of atoms to reduce the curvature. This flow of the atoms can be considered a surface movement moving normal to itself.10,11
When a surface is advancing during sintering, the drag on the surface by the particles pinned to the surface works against the capillary pressure driving the surface. This drag can be presented as a pressure on the surface shown in the equation given next:

where K is curvature of bronze surface, and n is number of particles per unit area. It can be concluded from Equation (4) that with the increase of sintering rate, the number of carbon particles (n) per surface area increases. This will result in an increase on drag (pressure P), which will reduce the sintering rate. This phenomenon is in confirmation with what was concluded from Figure 10a.
The ANOVA table for the nonprinted coupons (pure bronze) under different sintering conditions discussed in Table 1 is shown in Table 4. The p-distribution value for time is <5%, indicating that time is significant. The p-value for temperature is also <5%, indicating that temperature is also a significant factor in the chosen range.
Analysis of Variance Table for Linear Regression Model for Hardness Rockwell B for Nonprinted Sections
The interaction plot for sintering time and sintering temperature on surface hardness of nonprinted sections is shown in Figure 10b. It can be observed from Figure 10b that both sintering time and sintering temperature show a uniform significant increase in the surface hardness for pure bronze. This is in confirmation with prior studies on the initial stages of sintering. The pores in this study were cylindrical and interconnected with neck size to diameter ratio (X/D) <30%. Therefore, it can be concluded that sintering took place at initial stages of sintering. One of the developed prior models that relate the neck size growth to temperature and time 9 is shown in Equation (5):
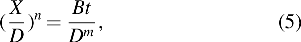
where X is the neck diameter, D is the particle diameter, t is the isothermal sintering time, B is a constant that varies with different sintering mechanisms and is proportional to inverse of temperature, and n and m change with time and degree of sintering but for many analyses have been assumed constant. It can be observed that the effect of sintering time in the developed regression model shown in Table 4 is in confirmation with Equation (5). It can also be observed that prior models are not beneficial and practical due to the complex nature of sintering. However, the developed regression model in this article is a simplified special case.
The effect of sintering time and sintering temperature on surface hardness for printed and nonprinted sections from the coefficients shown in Tables 3 and 4 is shown in Figure 10c. Figure 10c was derived from Tables 3 and 4, to further analyze the effect of sintering conditions on printed and nonprinted sections simultaneously. As can be seen from Figure 10c, when sintering time and sintering temperature was increased, the surface hardness difference between printed and nonprinted sections was increased. This phenomenon is of high interest for the SIS process. It shows that the separation process becomes easier with the increase of sintering time and sintering temperature.
Conclusions
This article presented and investigated the effect of sintering conditions on the SIS process for bronze inhibited by sucrose (carbon particles). Several test cases were fabricated and analyzed to study the behavior of bronze during sintering when sucrose was introduced to the system. The core concept of the SIS process was shown to be the decomposition of sucrose into ultra-fine carbon particles distributed and pinned to the surface of bronze. The mechanical properties of the printed and nonprinted sections were characterized by the aid of DOE methodology. It was shown that sintering time plays a significant role in the SIS process for the printed sections. It was also concluded that with the increase of sintering time and sintering temperature, the surface hardness difference between printed and nonprinted sections increases. The results of this study will be in direct use of researchers and engineers to improve the mechanical properties of bronze parts fabricated by the SIS process. The results of this article can also be used to qualitatively model and understand the sintering behavior of bronze for loose powder sintering applications when introduced to carbon particles.
Footnotes
Acknowledgments
This work was supported by California State University Long Beach, College of Engineering and University of Southern California, Department of Industrial and Systems Engineering.
Author Disclosure Statement
No competing financial interests exist.