
Abstract
A novel custom-made 3D silicone printer and two-part Ecoflex silicone resins were used to 3D-print standard-shaped silicone coupon and irregular-shaped meniscus structures via a heat-cured extrusion-based method. This article is segmented into three parts: (1) study on the effect of 3D printing parameters on dimensional accuracy and mechanical properties of 3D-printed silicone, (2) reliability and failure analysis of 3D-printed silicone according to ASTM D575 standards under monotonic and cyclic compressive loading, and (3) cytotoxicity of 3D-printed silicone by extraction method according to ISO 10993-12 for different extraction time and extract volume/surface area ratios. Based on analysis using regression method and analysis of variance, we found that the dimensional accuracy of lengths and widths is sensitive to both nozzle diameters and bed temperatures (BTs), while the height is only sensitive to BTs. Failure results were analyzed using the two-parameter Weibull probability distribution model and Weibull regression analysis and revealed that the Weibull modulus had a value greater than 1 in all groups, indicating an increasing failure rate with time for Ecoflex 30 and 50 meniscus implants. Results from quantitative cell proliferative assay exhibit statistically insignificant differences for all samples, pointing to the low cytotoxicity and excellent biocompatibility of printed silicone.
Introduction
Material extrusion method 1 is one of the most established additive manufacturing techniques in the fabrication of scaffolds for tissue engineering,2,3 medical devices, 4 and even tissue models. 5 In this work, we show that the extrusion method, in combination with specific curing mechanism, is capable of directly fabricating silicone functional parts for medical implant. In the extrusion method, either a one-part oxime-type liquid silicone resin is extruded directly or a two-part liquid silicone resin is premixed before extrusion. Different curing mechanisms applied before, during, or after the extrusion process, using ultraviolet light, 6 moisture, 7 and heat 8 have been used to print myriad silicone end-products, as proofs-of-concept. Different grades, types, or series of silicones have dissimilar rheological properties and will require different printing parameters for optimal extrusion.
Currently, all medical-grade silicones used in medical devices, medical implants, and biomedical applications 8 are only heat curable. Although existing silicone additive manufacturing (AM) (nonextrusion) methods with higher resolution such as freeform-reversible-embedding (FRE), 9 ink-jetting, and stereolithographic-low-one-photon-polymerization (SLA-LOPP) 10 have been described, none of these is able to 3D print medical-grade silicones. While FRE, SLA-LOPP, and PICSIMA 11 have used Carbopol bath, polymer resin bath, and silicone bath, respectively, as support systems, all other systems have attempted to directly print silicone without support systems.
The rheological properties of each silicone resin, especially gelation times, storage and lost moduli, and curing temperatures and times, are determined initially to allow the construction of calibration curves, which are used in parametric settings. In contrast to fused deposition modeling and selective laser melting processes where many studies have been done to investigate surface roughness, waviness, rastering orientations and struts directions, hatching space and distance, and melt pool dimensions, 12 there have been no similar studies in heat-cured extrusion silicone AM. Owing to the sparse studies conducted in silicone AM, there is limited information on the processing parameters of heat-cured silicone extrusion technology and their impact on the quality and mechanical properties of the cellular cube printout. As opposed to thermoplastic polymer printing, which commenced in the early 1980s and has developed quite rapidly with Polyjet 3D Printer from Stratasys, silicone 3D printings are expensive and fraught with unique difficulties and complications. 13
This is the first study to show that direct 3D printing of silicone is possible using a novel heat-cured extrusion-based technology and that adequate mixing and polymerization of the two-part Ecoflex resin are possible, as opposed to what was claimed by Liravi and Toyserkani. 6 The present novel system harnesses on the variable curing rates and viscosities of the Ecoflex silicone resins to print these silicone constructs.
This article is divided into three parts. The first section investigates the effect of 3D printing parameters (nozzle diameter [ND], nozzle temperature [NT], and bed temperature [BT]) on the dimensional accuracy and mechanical properties of 3D-printed silicone parts. The second section investigates the reliability and failure properties of 3D-printed silicone samples according to ASTM D575 14 standards under monotonic (strain rates of 12, 120, 360, 720, and 1000 mm/min) and 1000-cycle compressive loading, and the third part studies the biocompatibility of 3D-printed silicone by the extraction method according to ISO 10993-12 15 for different extraction time (10, 20, and 30 days) and extract volume/surface area ratios (1×, 2×, and 3×).
Experimental Setup
Material
The Ecoflex silicone elastomer kit, Ecoflex 30 and Ecoflex 50, was used. This two-part liquid elastomer kit consisted of a prepolymer base and crosslinking curing agent. The reaction mixture was mainly composed of oligomeric dimethyl siloxane (vinyl-terminated), a crosslinking agent (methyl hydrosiloxane), and a catalyst (platinum complex, ∼10 ppm) for the hydrosilylation reaction. By mixing the two parts at equal ratios by weight/volume, the silicone elastomer can be extruded and cured optimally. Similar to polydimethylsiloxane (PDMS) elastomer, the Ecoflex elastomer was assumed to be an incompressible material with Poisson's ratio of 0.5. 16
Design of test samples
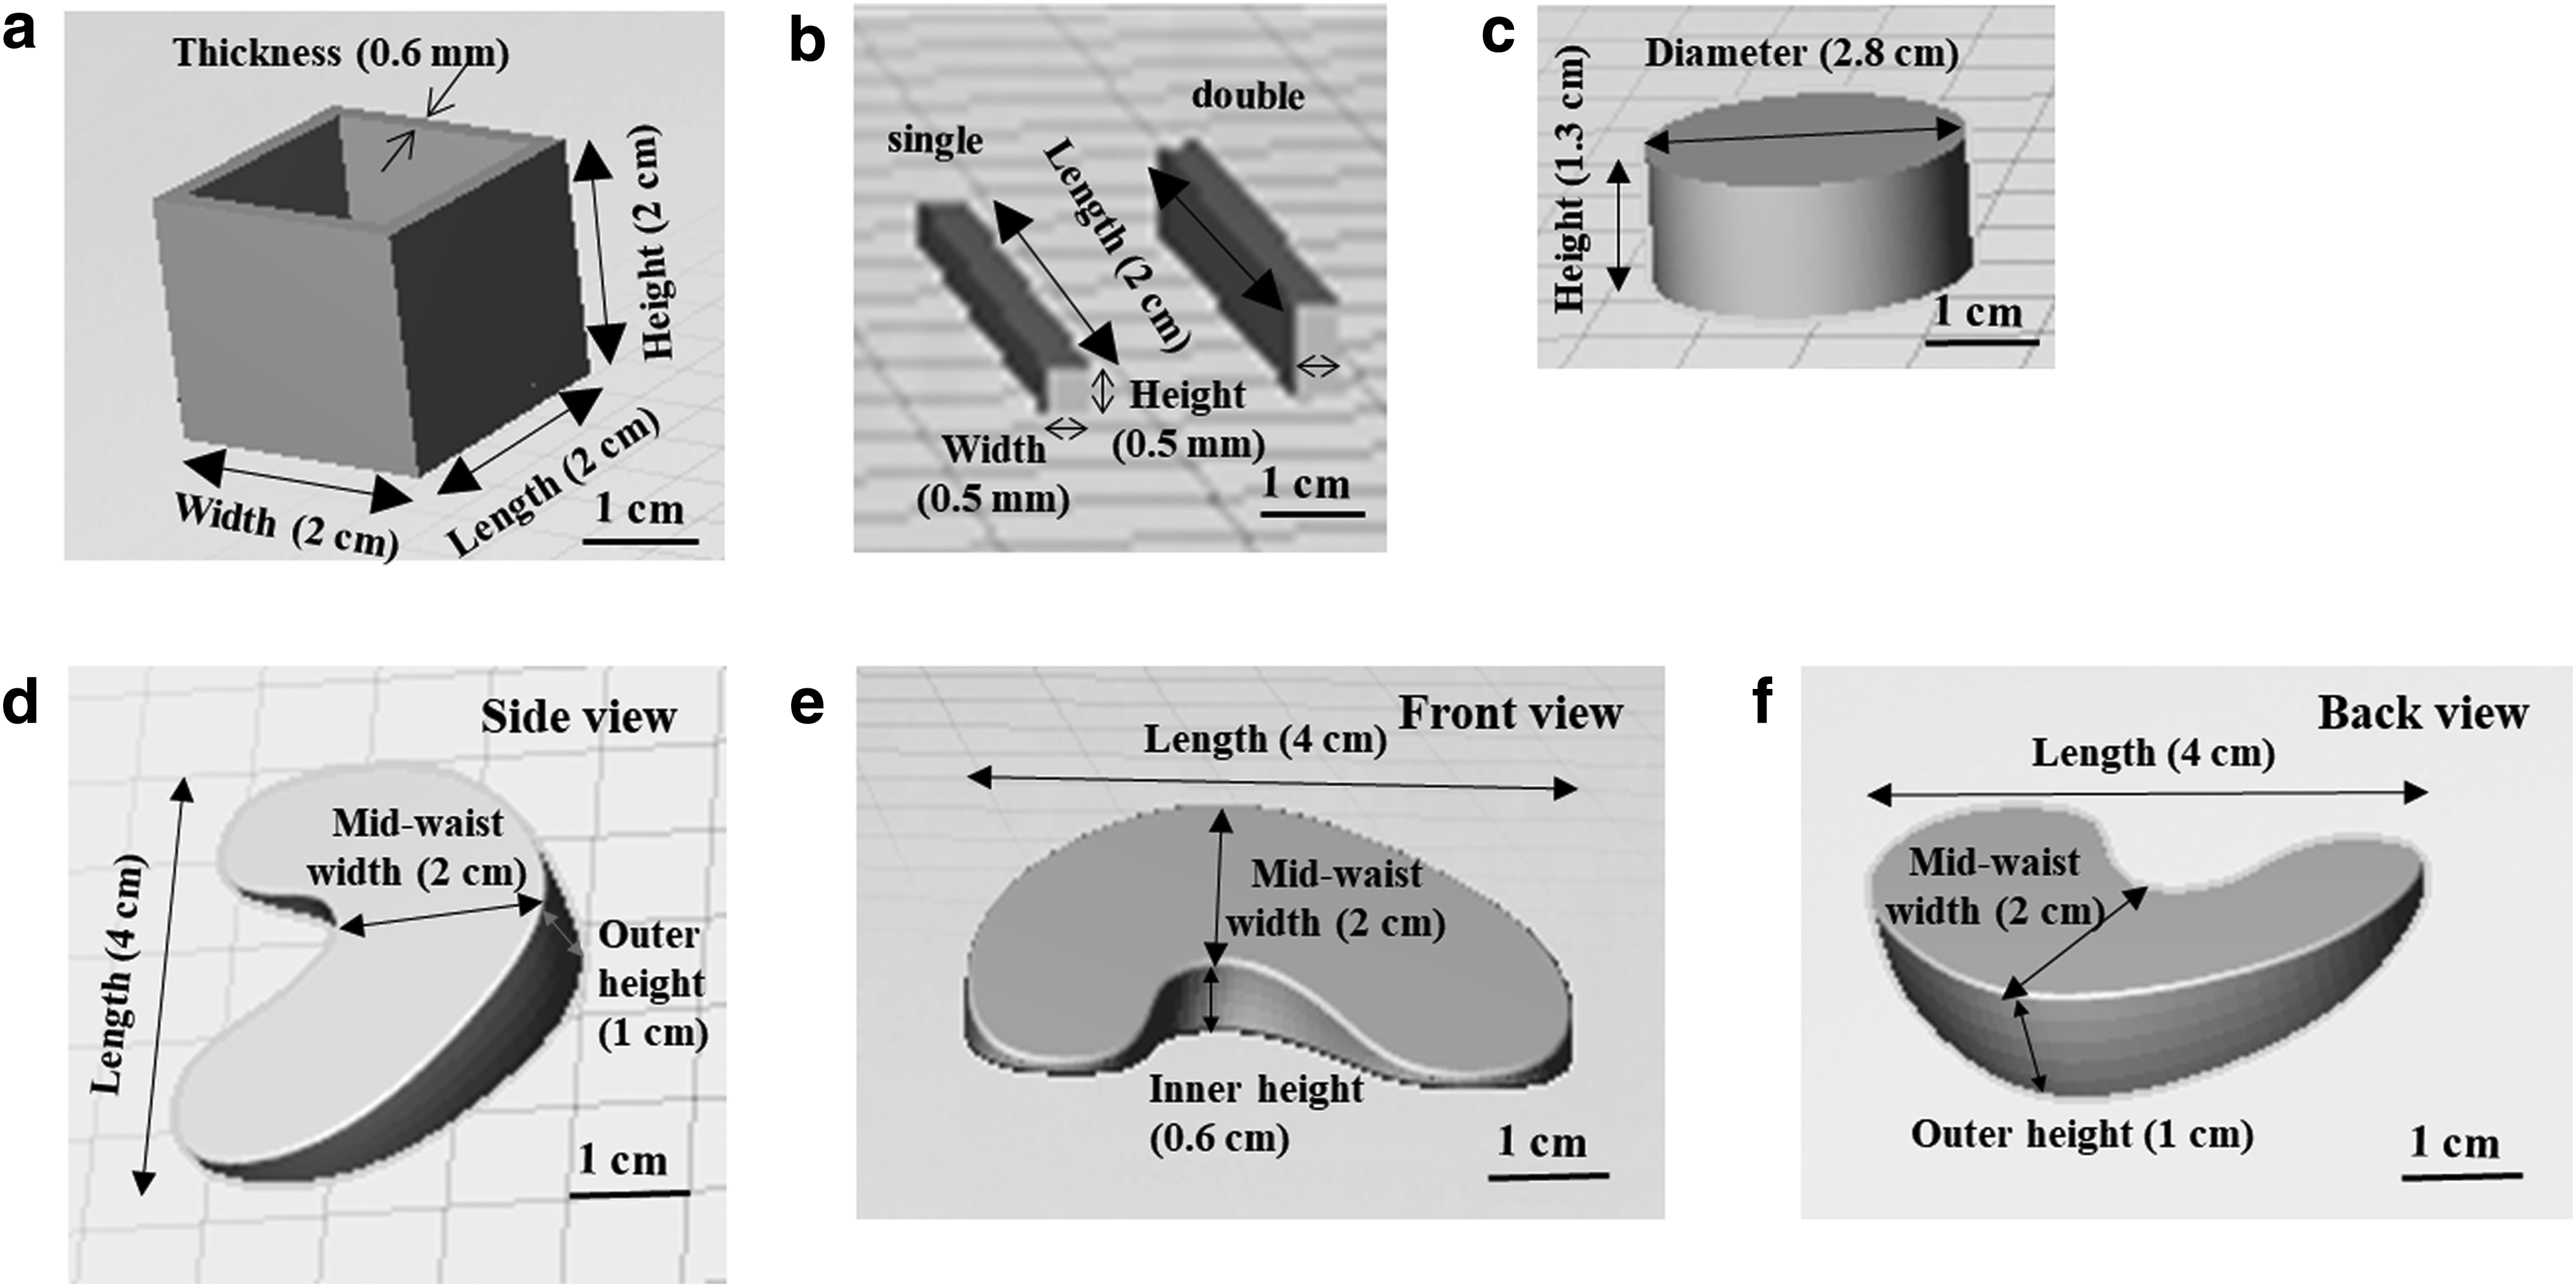
The printed cube cell unit and struts were used for standardization and optimization of printing process parameters. These were also used to study the effect of processing parameters on the quality and mechanical properties of these structures. The unit cube cell designed consists of vertical and horizontal square walls of 0.6 mm sides, which correspond to the 20G ND measurements. The square walls are formed by basic strut layers. Therefore single-layer and double-layer struts were first printed to determine the resolution and printability. The printing of cylinders and struts represent the toolpath taken for the horns and body of the meniscus, respectively. This printing was done to determine the optimal ND and printing speed.
Horizontal walls were chosen to investigate the different building direction capabilities of the extrusion printer. The generated CAD diagrams are shown in Figure 1. The overall dimensions of the cube structures were 20 mm by 20 mm by 20 mm, with allowance given in the height to allow for warping or collapse of height owing to inadequate curing secondary to poor heat conduction.
CAD drawings of
Sample dimension
For compression tests, both standard cylindrical specimens and 3D-printed silicone meniscus implants were used, as shown in Figure 1c–f, respectively. The design of specimen mold was based on ASTM D575. 14 It consisted of a top plate with 10 cylindrical holes (each hole measuring 13 mm in height and 28 mm in diameter) and a plain rectangular base. This plastic mold did not bind with silicone elastomer during the curing process. The meniscus dimensions are different for each individual and the use of 3D printing is to allow customized production of meniscus implants. The anterior and posterior horns and body of the designed meniscus have been replicated according to the anatomy of the native meniscus.
Metrological measurement of dimensional accuracy and porosity analysis
The general dimensions of the as-fabricated structures were measured using digital Vernier calipers with 0.01 mm accuracy (ABS Digimatic Calipers; Mitutoyo Corporation). The sample dimensions were derived from the average of three points (n = 3) on each of the three replicates (n = 3) of the as-fabricated samples.
X-ray computed tomography (CT) scan has been proven useful for determining the detailed dimensional accuracy of individual 3D-printed parts. 17 The 3D-printed silicone knee menisci were reconstructed to obtain the virtual model using the X-ray micro-CT (μ-CT) imaging system (Skyscan 1173; Bruker Co.). The μ CT-scan machine has a CCD sensor with 2240 × 2240 pixels, each with the pixel size of 50 μm. The 1 × 1 camera binning mode was used and the resulting image pixel size was 24.25 μm when the object was placed 176.380 mm from the source. Source voltage, source current, and the exposure time were set to 67 kV, 111 μA, and 1254 ms, respectively. One-millimeter-thick aluminum filter was used.
In the porosity analysis, the porosity was obtained by calculating the percentage of the total closed pore volume over the total object volume using the CT scan postprocessing software. The minimum detectable size of the pore was set to 8 voxels or 1.14 × 105 μm3. To study the dimensional accuracy, the reconstructed 3D-printed models were compared with the CAD model using the Geomagic Control software. The shape deviation of the 3D-printed model was calculated using the shortest distance projection method.
Design of experiment for regression analysis and analysis of variance of printing parameters
Regression analysis was used to determine the value of coefficients of the function that cause the function to best fit a set of observed data.
6
There are mainly two types of regression techniques, namely linear and nonlinear regression. This method used an empirical model for predicting output parameters under a set of controlled experimental factors. The regression analysis optimization process involves three major steps
7
:
Performing the statistically designed experiments. Estimating the coefficients in a mathematical model. Predicting the response and examining the adequacy of the model.
The significant variables for the in-house-developed silicone 3D printer, nozzle diameter, nozzle temperature, and bed temperature, were chosen as the critical variables designated as ND, NT, and BT, respectively. The values of ND, NT, and BT were selected based on preliminary experiments conducted. The factors and their three levels for the 33 factorial designs are listed in Table 1.
Factors for Regression Analysis
The NT range was determined from the rheological study of the specific liquid silicone rubber. The 40°C to 60°C range was within which there was a rapid phase transition from gel to sol state. The NT was chosen as the temperature where this phase change occurred most rapidly. The BT needed to completely cure extrudate in the shortest possible time to provide a stable platform for deposition and blending of subsequent layers of the meniscus. A range of meniscus samples were printed out using temperatures ranging from 70°C to 110°C.
To evaluate the key factors and their effects on the printed dimensions of the samples, a polynomial equation3,4 is expressed as follows:
where y is the response or dependent variable investigated, ai is a correction constant coefficient, ai, aii, and aij are coefficients for linear, quadratic, and interaction effect, xi and xj are the independent variables (ND, NT, and BT), and ɛ is the random error. The polynomial equation assumes that third-order interactions of the independent variables are insignificant. Analysis of variance (ANOVA) is carried out on the derived empirical formulae to evaluate the significance of the formulae. ANOVA uses test statistics called the F statistic to test the null hypotheses. From the F distribution table, with probability of 5%, if the F value of the formula is lower than critical value, the formula is then concluded to be significant in relating the inputs and output. The p-value is the probability that the derived empirical formula is not significant where R2 is a measurement of the fit of the data from 0 to 1, with 1 being the perfect fit.
Compressive test
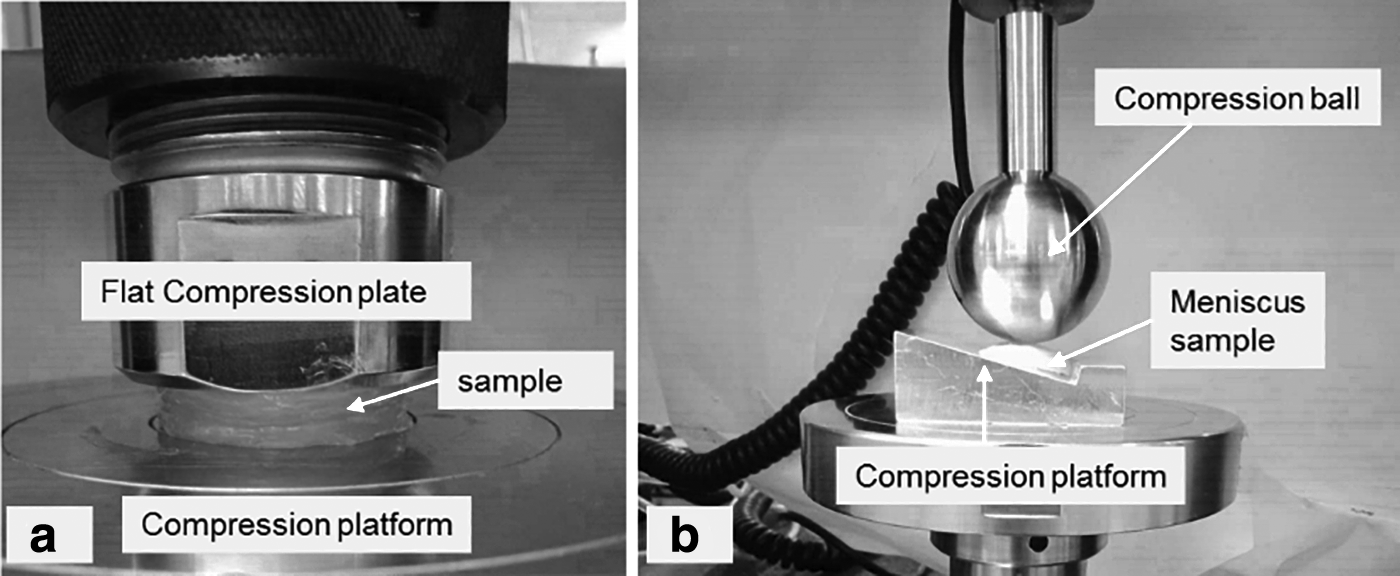
The test was performed following ASTM D575 tTest Method A 14 using Instron 5569. The top compression ball was connected to a load cell (500 N) to record the compression force, and a displacement transducer was used to record the compressive displacement. Data acquisition of load and crosshead position was done with Bluehill testing software at constant crosshead displacement rates of 12, 120, 360, 720, and 1000 mm/min. Hence, the sample could freely expand laterally under compression. The samples were compressed up to 70% strain and engineering stress and strain were obtained. The setup is shown in Figure 2.
Experimental apparatus used for the static compression.
For standard samples, the stress was obtained as the ratio of compression force recorded by the load cell to the average cross-sectional area of sample. For meniscus samples, the force was divided by the area of a circular segment of the compression ball. The area of a circular segment of the compression ball is again a function of the displacement. The strain was obtained as the ratio of compressive displacement and sample thickness. All tests were repeated three times for each Ecoflex elastomer. All values recorded in tables are the mean values with standard errors.
During the compression of 3D-printed meniscus samples, the compression plates were modified to mimic the actual geometry of the knee joint. First, the top flat compression plate was replaced by a compression ball, which mimics the actual compression by the femoral condyles on the human meniscus. Second, the flat-bottomed plate was replaced by a sloped compression platform as the thickness of the meniscus is not uniform over the radial distance. The sloped compression plate also mimics the human tibial plateau.
Monotonic compressive test up to failure
The sample was compressed from 0% of strain until complete failure. If failure was not observed, censored data were obtained at 70% strain. The strain level was chosen such that the femoral bone component does not impact on the tibial component assuming that the stress/strain behavior was linear at the small strain range, the elastic modulus for strain level 30% as well as for strain level 70% before failure could be calculated using Hooke's law, by taking the slope of respective stress/strain curve, as follows E = σ/ɛ where E is the modulus, σ is engineering stress, and ɛ is engineering strain.
Cyclic compressive testing
The sample was compressed from 0% strain until 70% strain and then released back to 0% strain for 1, 4, and 1000 cycles. The maximum number of 1000 cycles was selected to closely mimic the number of steps a sedentary person would take in a day. Four cycles were chosen to investigate Mullin's effect and hysteresis. The evolution of mechanical properties of the PDMS elastomer with the number of cycles was observed and compared for both Ecoflex 30 and Ecoflex 50, under different strain rates. 18
Mechanical characterization
Low-viscosity (Ecoflex-30) silicone and high-viscosity (Ecoflex-50) silicone were used to fabricate the meniscus implants for mechanical characterization. First, the standard samples as per ASTM D575 were fabricated to obtain the compressive modulus of host materials. Thereafter, meniscus samples were 3D printed, using liquid silicone rubber (LSR) Ecoflex 30 and Ecoflex 50, with an extrusion rate of 0.5 mL/min, ND 0.51 mm, NT 60°C, BT 100°C in ambient temperature of 24°C. The bed was heated by a heater mattress attached to its base and the temperature is measured by a built-in thermistor. The photograph of both standard (STD) and 3D-printed (3DP) fully cured samples is shown in Figure 3.

Photograph of the standard and meniscus samples,
Weibull analysis of failure and reliability
To find the appropriate member of the Weibull family for a data set using Weibull probability plot (WPP), the WPP of failure data is first plotted. Then, knowing that the different Weibull distributions have different plot shapes, the best model can be selected. The WPP is based on the Weibull transformation as shown below 11 : y = ln (−ln [1 − F(t)]) and x = ln (t) (1) where t represents life time of the component and F(t) is the probability of failure before time t. A plot of y versus x is called the WPP. One of the main tasks when plotting WPP is calculating the y-values that correspond with the values of F(t). There are several methods such as Kaplan–Meier and Median Rank that can be used to estimate F(t). 19
Statistical analysis Kolmogorov–Smirnov method was used 20 to test the normality distribution of groups' strength. A two-way ANOVA was then used, 21 to estimate differences in mean strength among groups followed by pairwise comparisons with the Bonferroni procedure, 22 to locate differences between specific groups. Both tests were conducted at a significance level of 0.05. To collect information about the spread (a-parameter) and shape (b-parameter) of the distribution of groups' failure mode in compression, a two-parameter Weibull regression analysis was performed on the data, using the probability plotting method in Excel 2007. To estimate the survival reliability of the groups, the Weibull reliabilities were calculated and put in a survival graph by plotting survival probabilities (cumulative frequency) against failure stress.23,24
Cytotoxicity tests via extraction method
Minimum Essential Medium (MEM) α supplemented with 10% fetal bovine serum was used as extraction medium for incubation of cylindrical silicone samples (1.56 cm diameter, 0.5 cm height) for 72 h under cell culture conditions. To investigate the influence of the extract concentration on cytotoxicity, extracts were prepared with different volumes of extraction medium (1.5, 3, and 4.5 mL). For meniscus silicone implants, samples were soaked in 5 mL of extraction medium for 72 h under cell culture conditions. To investigate the influence of extraction time on cytotoxicity, cylindrical silicone samples (1.56 cm diameter, 0.5 cm height) were incubated with 1.5 mL of extraction medium for 10, 20, and 30 days under cell culture conditions.
A total number of 50,000 L929 cells were seeded in 24-well plates and incubated for 24 h to allow attachment. Then, the culture medium was replaced with 500 μL of extracts. The positive control medium was the corresponding extraction medium incubated under cell culture condition along with the silicone samples. After incubating the cells with extraction medium for 24 h, all media in the wells were replaced with fresh medium mixed with 10% WST-8 cell proliferation assay. The assay was incubated for 4 h and measured on a microplate reader (Molecular Devices) at 450 nm.
Results and Discussion
Printing optimization
Important printing parameters such as ND and BT were characterized in turn to determine their individual influence and interactive effects on the printing process and final part quality.
Metrological characterization
Dimensional measurements of specimens' lengths, widths, inner heights, and outer heights are shown in Table 2 below. Unpaired Student t-test did not reveal any statistical differences in length and width measurements between Ecoflex 30 and Ecoflex 50 silicone implant samples. However, there was a statistically significant difference in both the inner heights and outer heights for constructs printed from Ecoflex 30 and Ecoflex 50. Since Ecoflex 50 had higher shore hardness and higher viscosity than Ecoflex 30, a higher construct was printable with Ecoflex 50 than with Ecoflex 30.
Dimensional Measurements of Meniscus Design, Ecoflex 30, and Ecoflex 50 Meniscus Samples
Mean and SD of 20 repeated measurements were recorded.
p < 0.05, statistically significant.
Compared with conventional molding, for 3D-printed meniscus sample using Ecoflex 50, we are able to achieve up to 95.3% accuracy in length, up to 100% accuracy in midwaist, up to 100% accuracy in inner height, and up to 99.4% accuracy in outer height; and for 3D-printed meniscus sample using Ecoflex 30, we are able to achieve up to 96.1% accuracy in length, up to 100% accuracy in midwaist, up to 100% accuracy in inner height, and up to 79.7% accuracy in outer height. A dimensional comparison of the two Ecoflex is important for the correct choice of material during 3D printing. It can be seen in this case that using Ecoflex 30 can only achieve a maximum print target outer height dimension of 7.97 mm, while Ecoflex 50 can achieve a maximum print target outer height dimension of 9.94 mm, which is very close to the target value of 10 mm.
Therefore, Ecoflex 50 would be the better choice for the printing of silicone meniscus, in terms of printing accuracy. In the article by Erbagci et al., 25 in vivo magnetic resonance imaging measurement showed the maximum outer height of the normal human meniscus to be in the range of 5.03–5.53 mm for the medial meniscus and to be in the range of 4.33–5.36 mm for the lateral meniscus.
Dimensional accuracy analysis
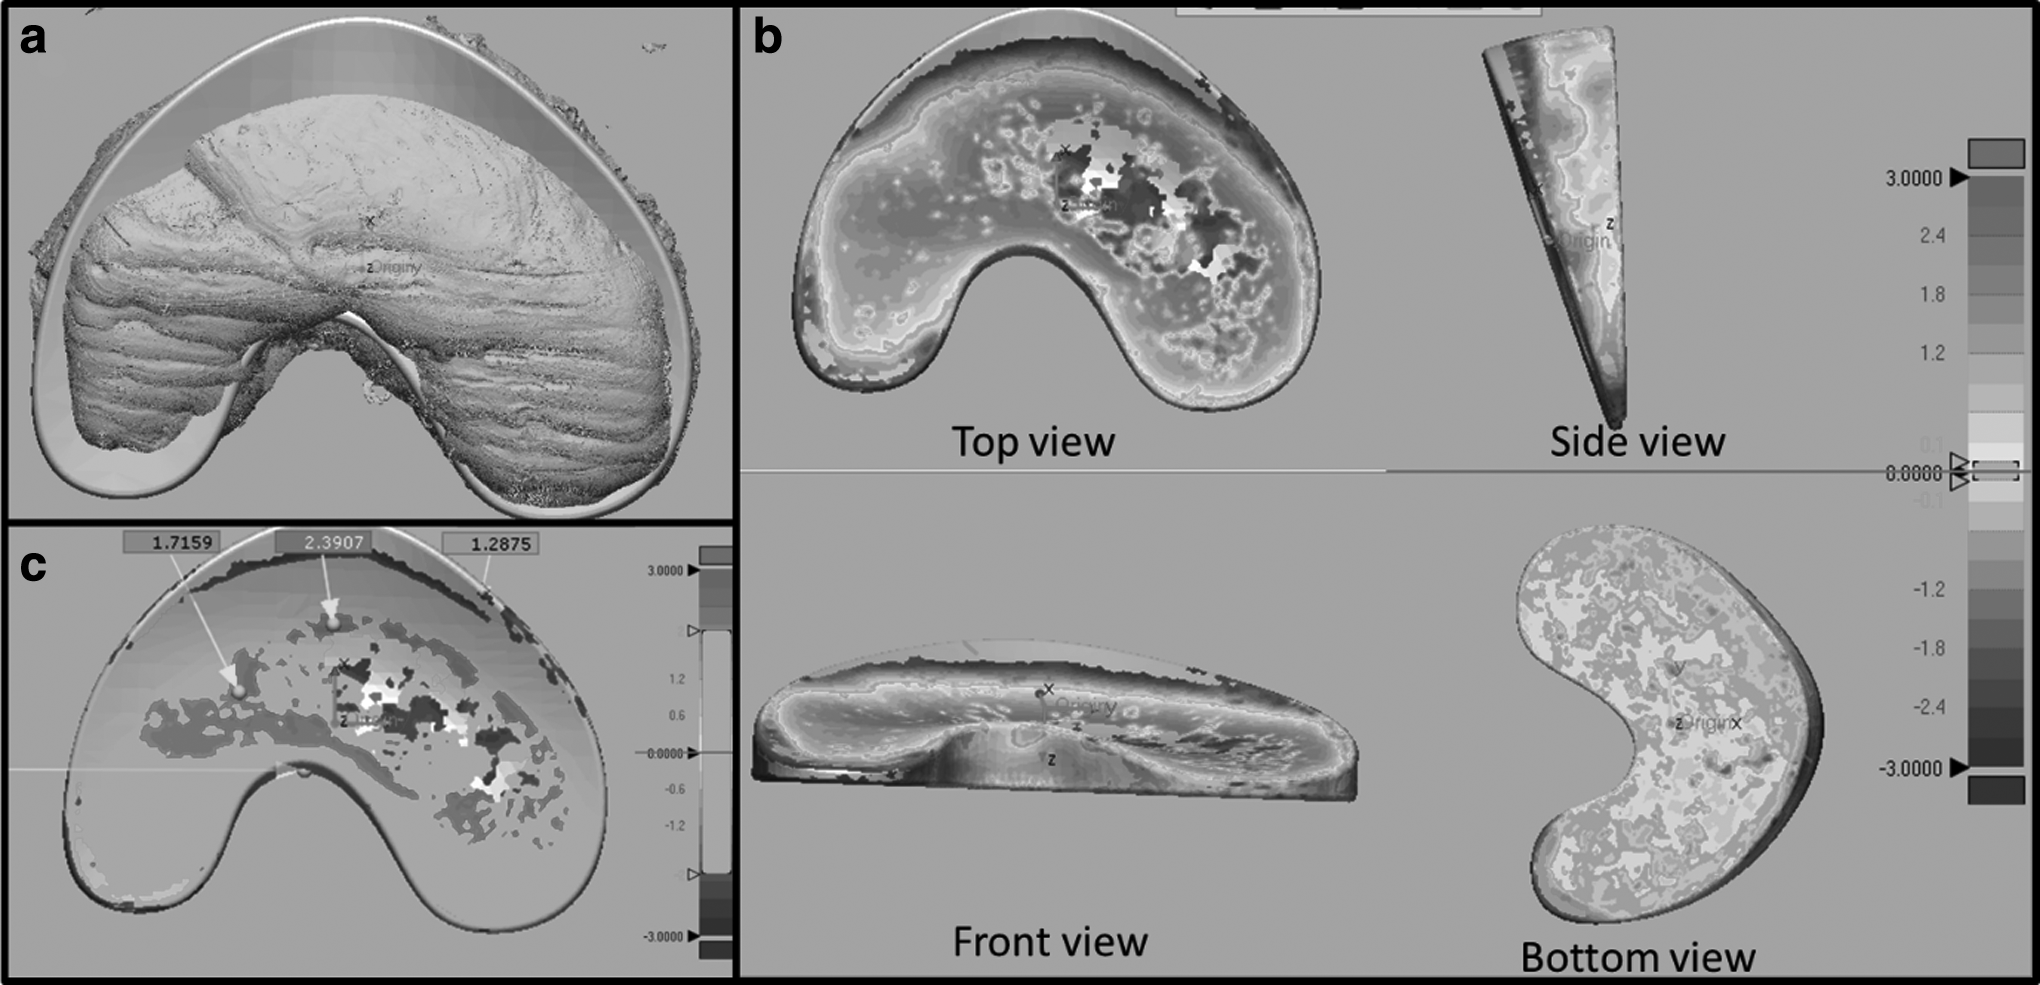
In this dimensional accuracy study, four printed silicone samples were used. Figure 4a shows the overlapped view of the scanned printed silicone meniscus and the CAD model. Here, it is observed that the exterior dimensions of the printed meniscus such as the length and width match generally well with the CAD model. Figure 4b shows the color-mapped shape deviation of the scanned sample. Based on the analysis result, it is found that the average root-mean-square deviation of the four scanned samples from the CAD model is around 0.9017 mm with standard deviation range between 0.8804 and 0.9142 mm. Figure 4c shows the color-mapped tolerance analysis of the scanned sample. It is found that all the samples have 92–94% of its shape fall within a tolerance of ±2 mm. Even though there is around 6–8% out-of-tolerance, this does not affect the functionality of the printed knee meniscus as the out-of-tolerance happens at noncritical part. The tolerance of 2% obtained is comparable with previous accuracy studies with 3D printing, SLA, and selective laser sintering (SLS), as shown in the accuracy studies presented by Bortolotto et al. 26 and Bücking et al. 27
Porosity analysis
It is well known that the extrusion-based 3D printing technique tends to introduce voids between the adjacent filaments especially for polymeric materials. 28 However, the effect of the use of silicone on the porosity is not well studied. In this study, porosity of the 3D-printed silicone knee meniscus is evaluated using μ-CT. Figure 5a shows the cross-sectional view of the 3D-printed silicone knee meniscus. Tiny pores are observed, which are likely caused by air bubbles present in the silicone feedstock. Unlike polymeric materials (Fig. 5b), there is no noticeable groove formed between the roads of two adjacent filaments. This is probably due to the less viscous property of the silicone that makes it easier to fill the gap in between two roads of filaments. The average porosity for Ecoflex 50 and Ecoflex 30 is found to be 0.27 ± 0.13% and 0.35 ± 0.18%, respectively, which indicates that a high-density 3D-printed silicone part is achievable using this extrusion-based technique.

Regression model
The second-order regression models were obtained for the printed samples' dimensions (Cl, Cw, Ch, Lw, and Lh). Mathematical models developed for this study considered only significant model terms. From the statistical analysis, insignificant model terms, which have limited influence, were removed to make the empirical formulae efficient.
30
The empirical formulae for the printed dimensions in terms of the key process parameters and their coefficient are given by the following:
where Cl = length of cube, Cw = width of cube, Ch = height of cube, Lw = width of line, and Lh = height of line.
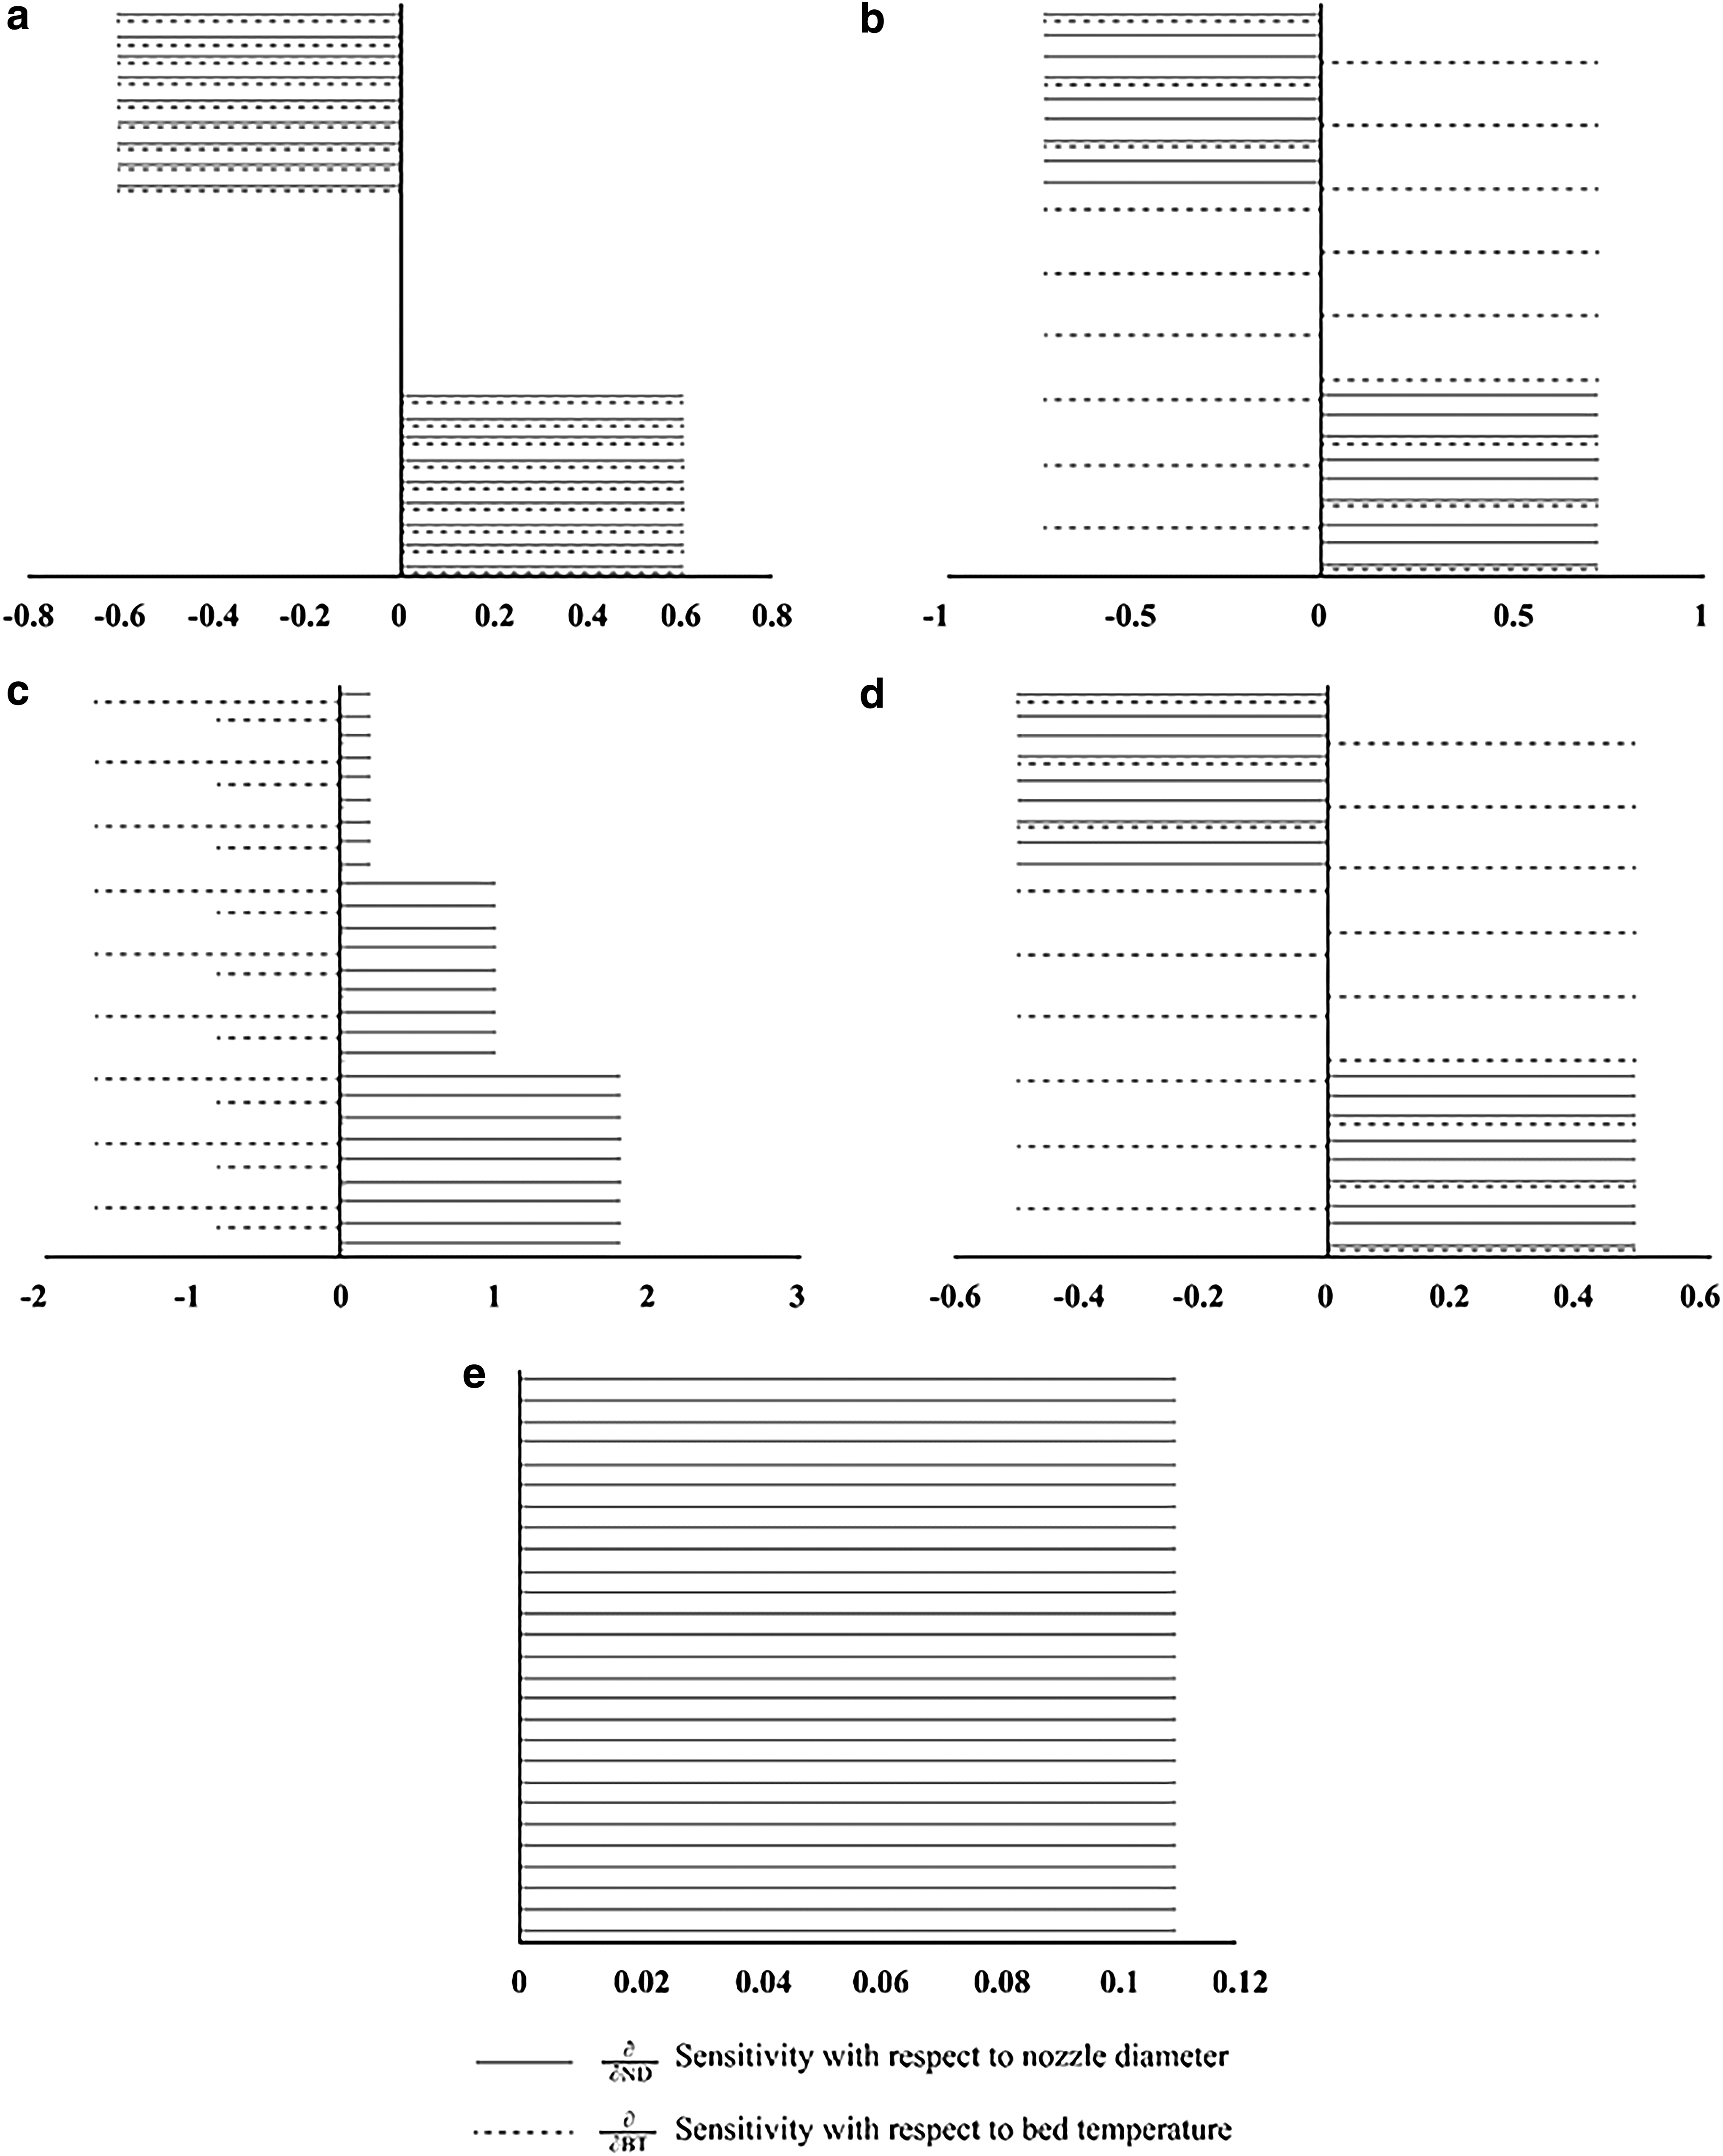
Based on the empirical formulae obtained from regression analysis, it is observed that only the ND and BT have significant effect on the printed dimensions of the silicone structures. The printed strut widths (Lw) are dependent on both NDs and BTs, while the printed strut heights (Lh) are dependent on only BTs. Similarly, the printed cube lengths (Cl), cube widths (Cw), and cube heights (Ch) are all dependent on NDs and BTs. Sensitivity analysis is a method to rank the significant process parameters in order of importance and is used to determine the most influential input process parameters with respect to the outputs. Mathematically, sensitivity of an output with respect to an input factor is the partial derivative of the output with respect to the input variables.31,32 If the sensitivity with respect to a certain process parameter is positive, the dimensions will increase with an increase in this process parameter, whereas negative sensitivity states the opposite. 30 The sensitivity analysis results are shown in Figure 6.
Sensitivity of printed dimensions to process parameters
It is revealed that the printed dimensions are most sensitive to equally sensitive to ND and BT. However, the height of the printed specimens is most sensitive to BT only. These are shown by the magnitude of the sensitivity in the analysis.
NT does not have a significant impact on the height of printed cube as the pre-extrusion heating within the nozzle is only sufficient to initiate the curing process. The postextrusion BT has the most significant effect on the printed height dimension.
Product reliability
Reliability, in general terms, is defined as the probability of an item performing its intended function adequately over a period of time intended under the operating conditions encountered. Therefore, it shows the overall ability of the system to perform its intended function. 33 Current available literature in silicone AM has only studied the reliability and mean time to failure rates of the molded silicone breast implants using Weibull prediction model and analysis.19,34 No reliability study is available for 3D-printed medical silicone implants.
Mechanical compression stress/strain results and compressive modulus
The stress/strain response of the silicone elastomer under monotonic compressive loading up to failure is shown in Figure 7. This strongly overall nonlinear stress/strain behavior was similarly obtained by Johnstone et al. 35 A linear elastic region is obtained at a low strain level, and a nonlinear region is obtained at a higher strain level before failure. The inbox of the linear region allows a closer look at Figure 9 up to 40% strain and shows that Ecoflex 50 has a higher modulus at any point of strain values when compared with Ecoflex 30. The transition strain occurs at 55% for Ecoflex 50 compared with 50% for Ecoflex30. The results indicate that a harder or more viscous resin has a higher transition strain.
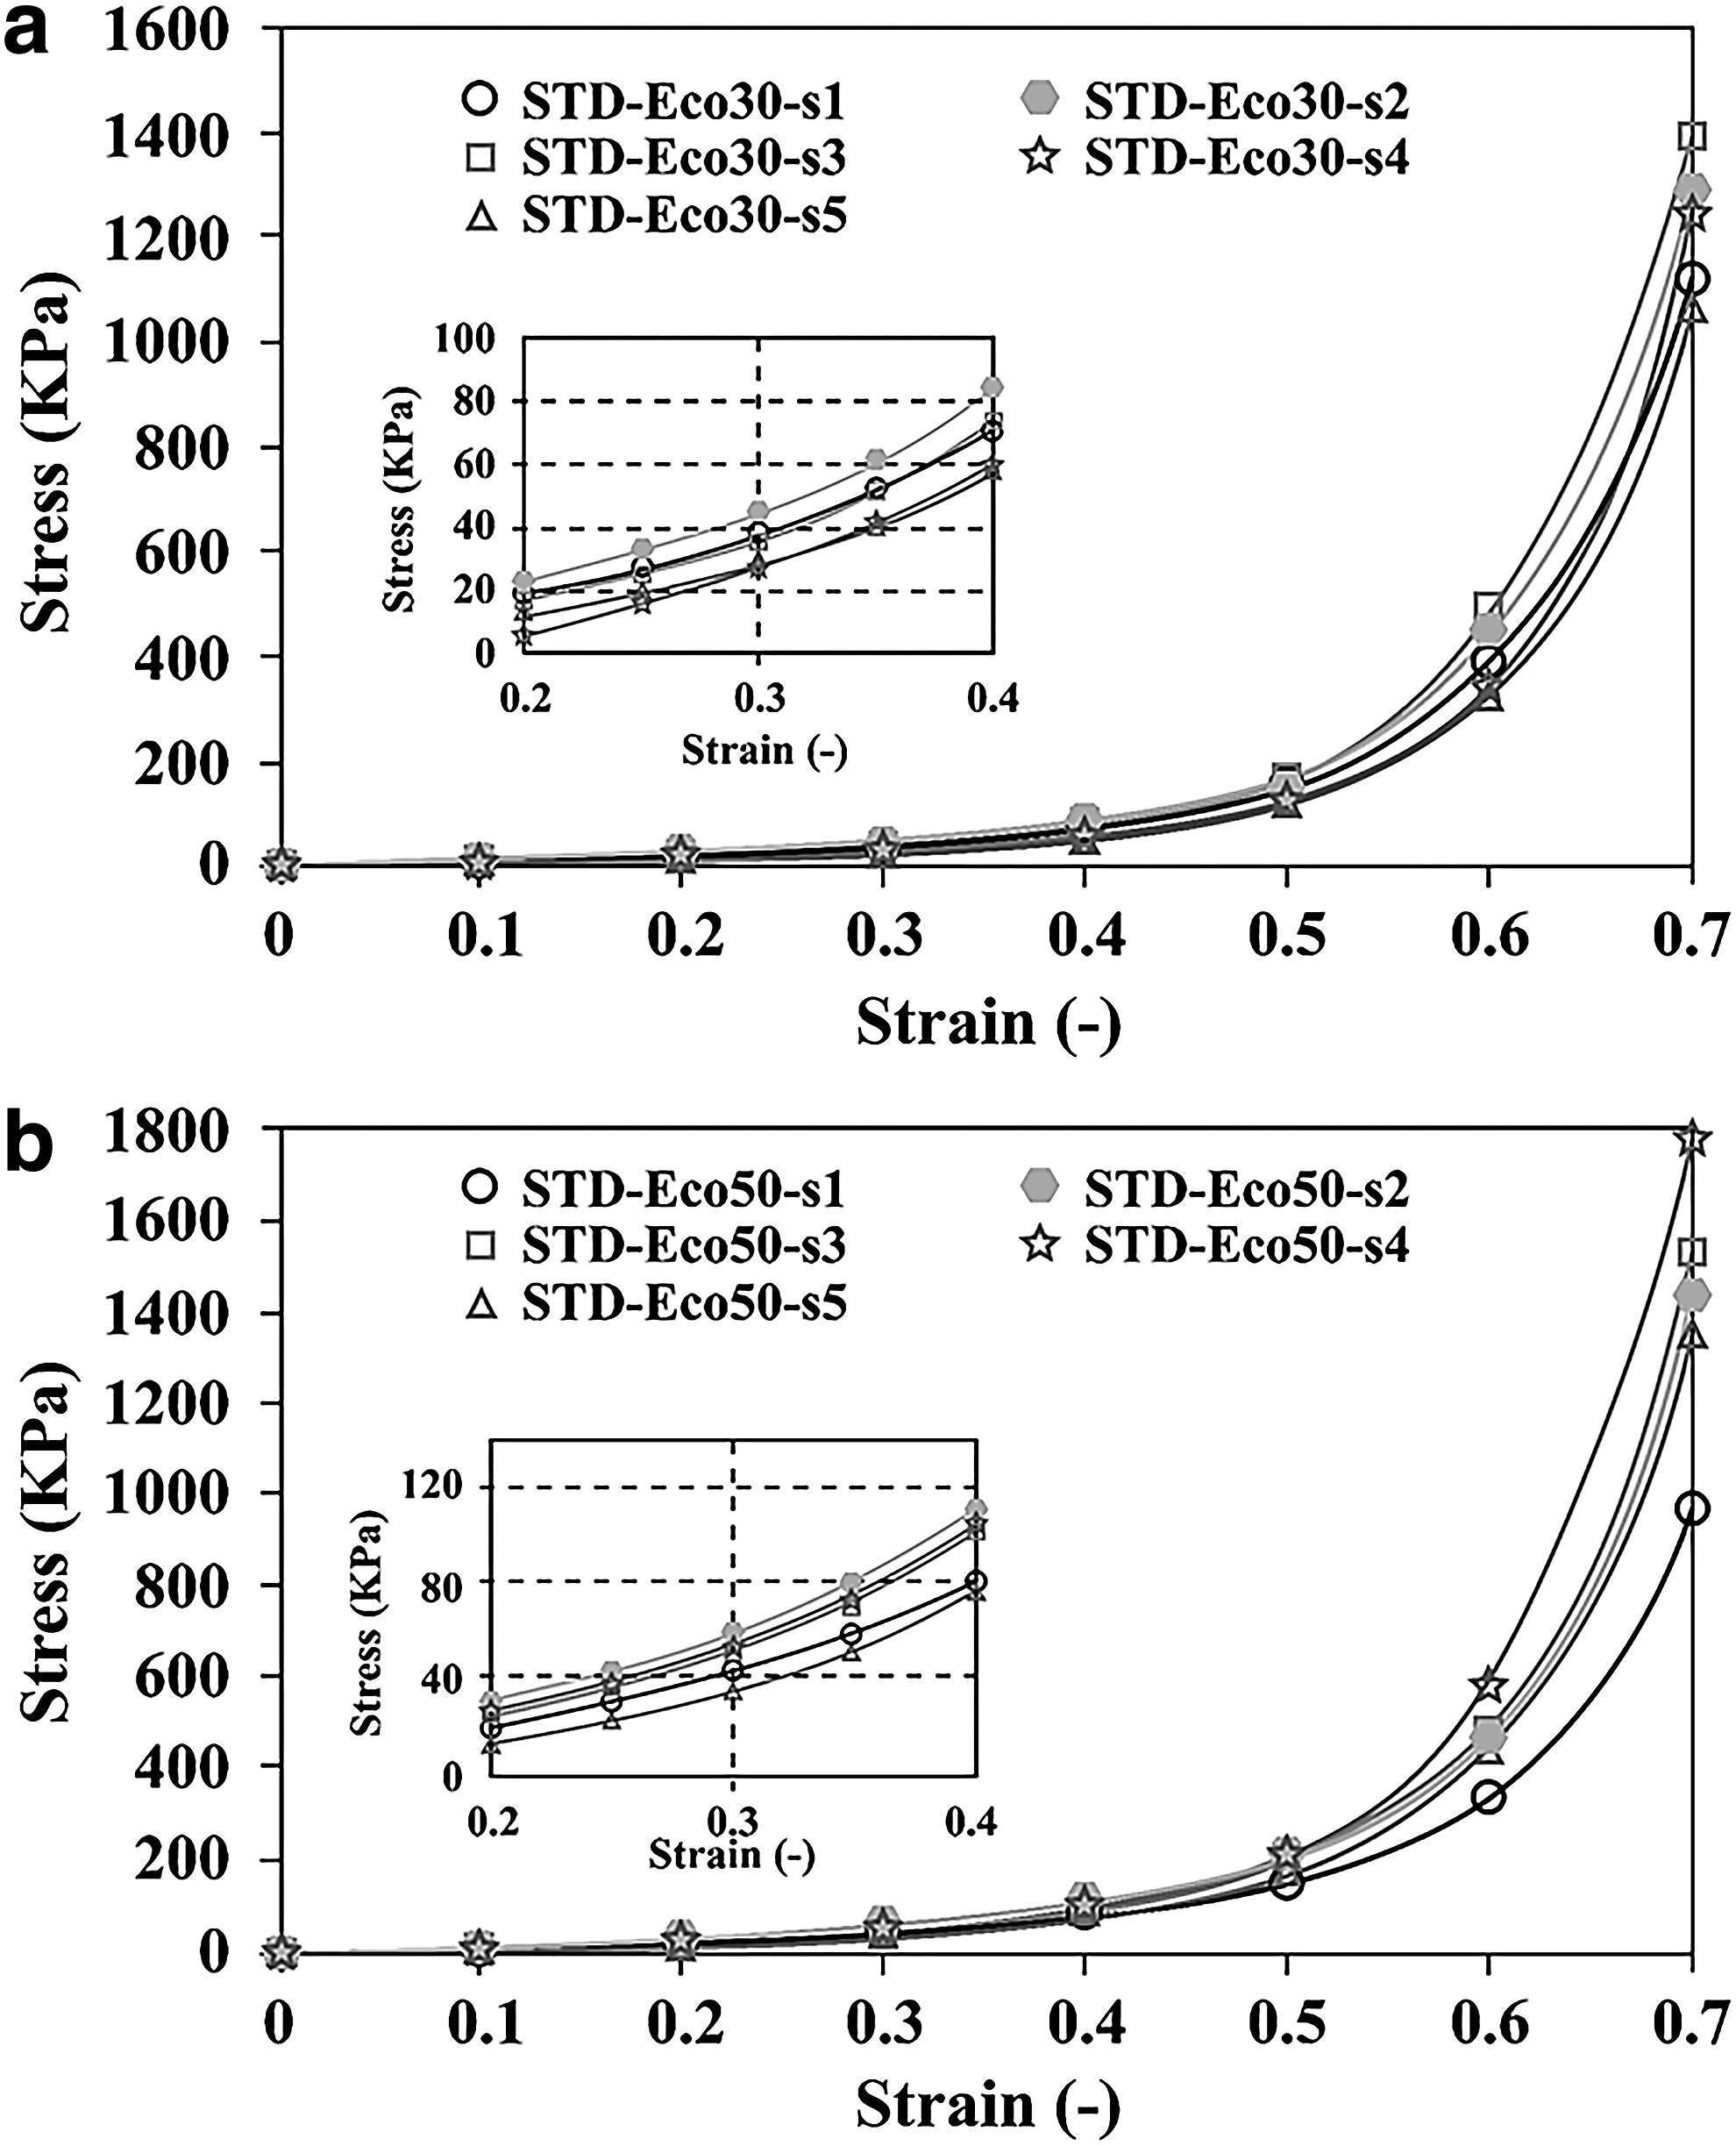
Compressive stress/strain curves for two standard samples,
The two moduli of the standard samples of Ecoflex 50 and Ecoflex 30 are presented in Figure 7. The compressive modulus of Ecoflex 50 is statistically significantly higher than that of Ecoflex 30. The two moduli of both meniscus 50 and meniscus 30 silicone implants are presented in Figure 8. Compressive modulus of Ecoflex 50 silicone meniscus is also statistically higher than that of Ecoflex 30 silicone meniscus. Figure 9 summarizes the above findings. In Table 3, statistical analysis using unpaired Student's t-test shows that there is a statistically significant difference in compressive modulus between molded Ecoflex 30 and 3DP Ecoflex 30 (p < 0.05). Similarly, a significant difference in compressive modulus was found between molded Ecoflex 50 and 3DP Ecoflex 50 (p < 0.05). Based on Table 3, the compressive modulus of 3DP Ecoflex 30 meniscus ranged from 195 to 240 kPa, 3DP Ecoflex 50 meniscus ranged from 275 to 320 kPa, and that of native meniscal tissue ranged from 90 to 160 kPa. 36
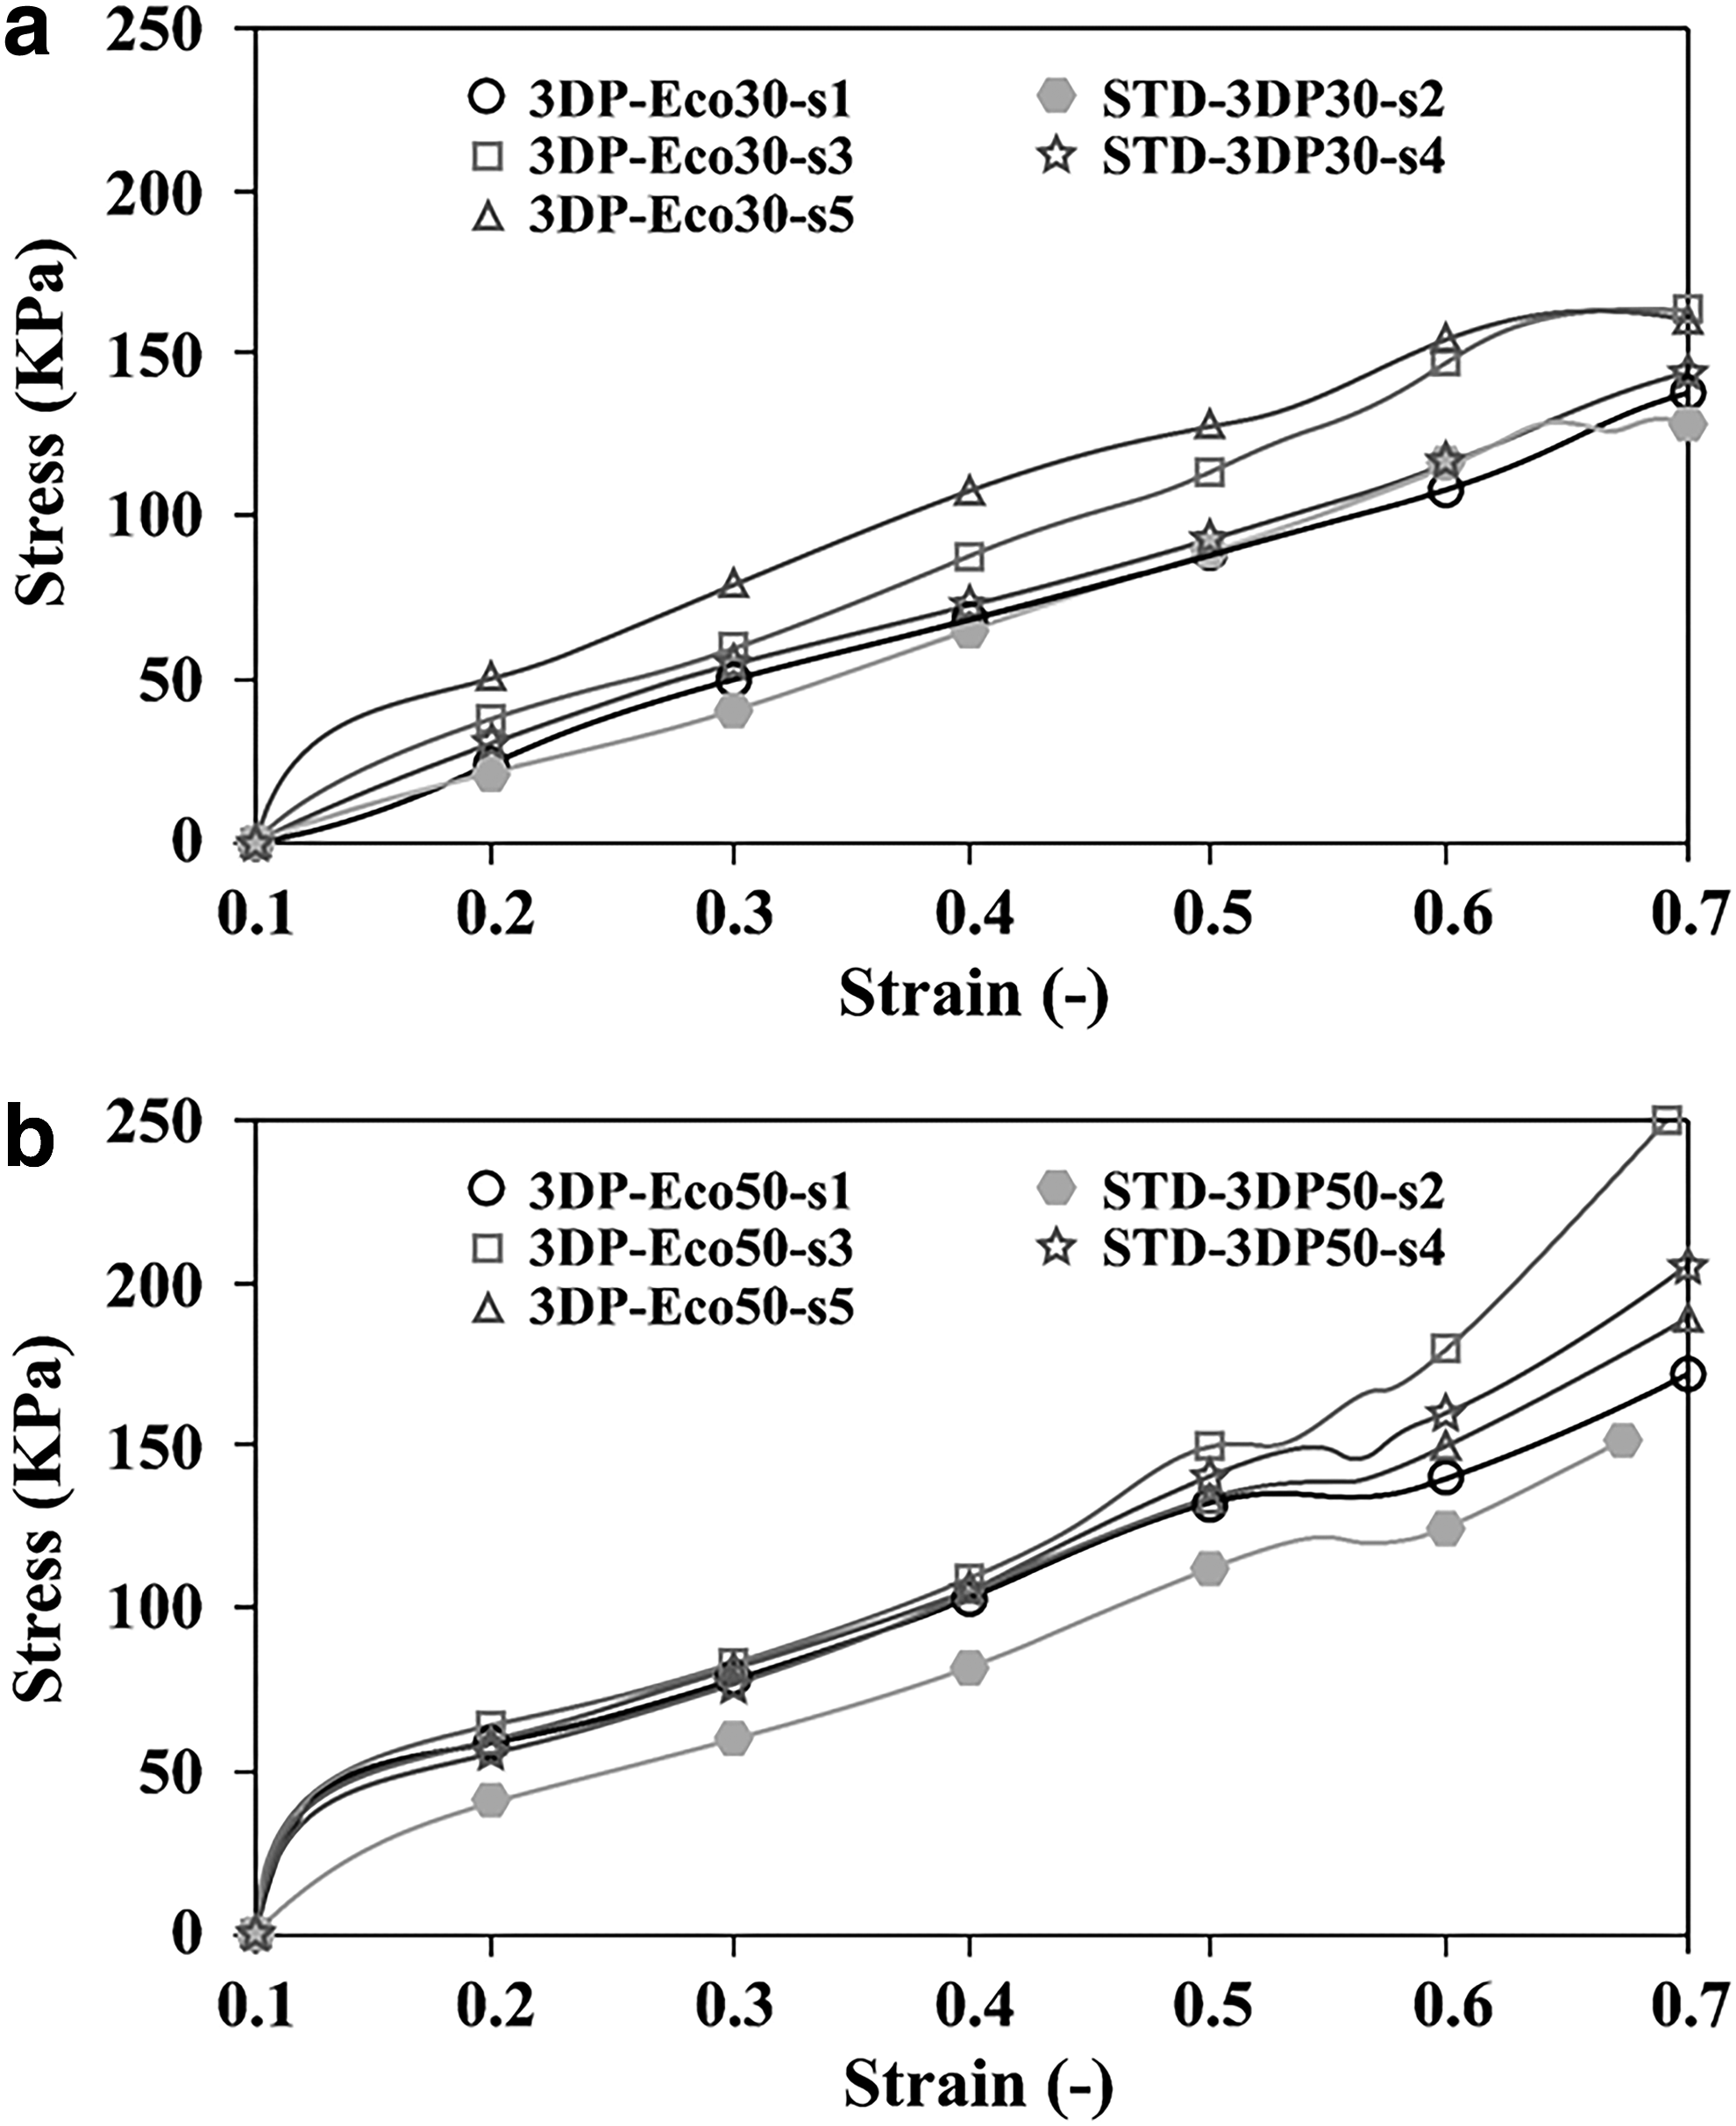
Compressive stress/strain curves for two groups of 3D-printed meniscus samples,
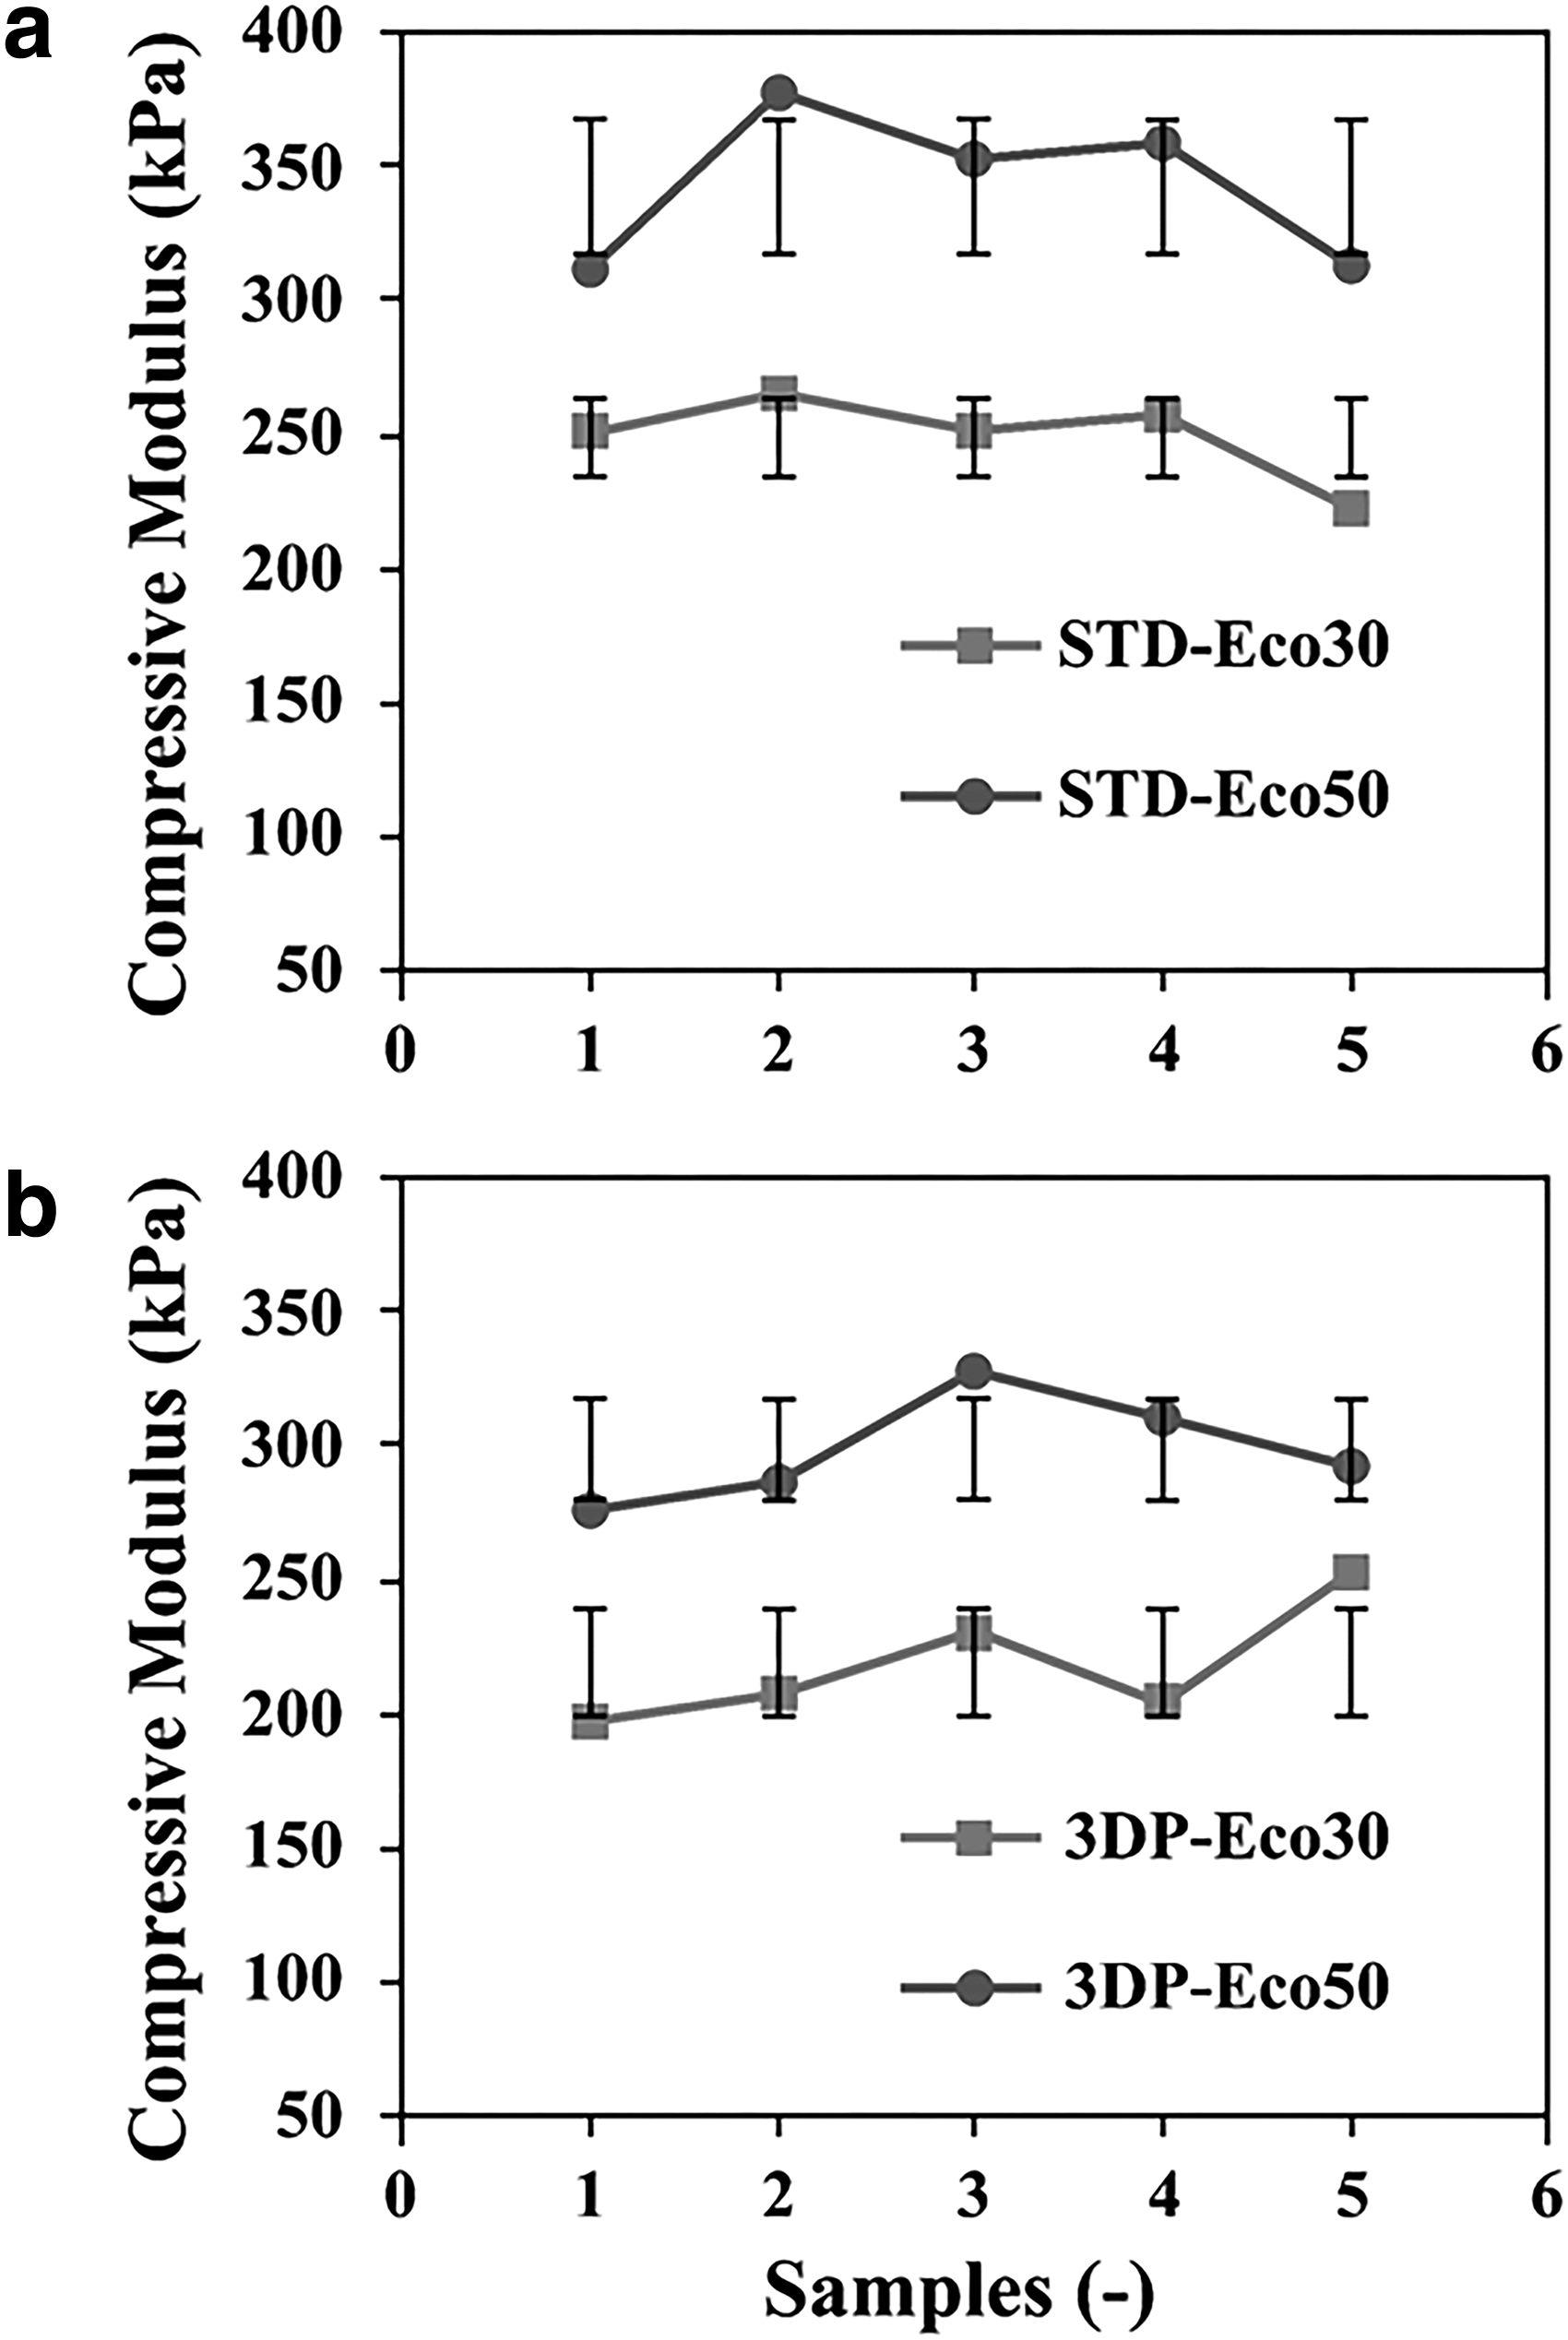
Representation of the compressive modulus for different samples with standard error bars with 95% confident interval.
Compressive Modulus for Standard and 3D-Printed Samples as Obtained by the Slope of the Stress/Strain Curve in Linear Viscoelastic Region (i.e., Strain Range 0.3–0.5)
The relationship between elastic modulus and resin viscosity is different in the linear elastic region and in the nonlinear region. Figure 7 shows that at the beginning of straining, the elastic modulus increases with increasing resin viscosity and shore hardness. Similar results were found in studies done by Brown, 37 Khanafer, 38 and Wang. 39
At higher viscosity, the higher concentrations of base polymer and curing agents become trapped entanglements and enhance silicone network, resulting in a stronger modulus. 40 As the resin is combined in a 1:1 ratio, there is little chance of stoichiometric imbalance of the network. The sudden steepness of the stress/strain curve indicates that the material undergoes crystallization. 41 At extreme strains, the exponential rise may be more likely due to the approximation of both compression plates.
It can also be observed that at times Ecoflex 30 may have a lower compressive modulus at the initial strain but was able to exhibit a much higher ultimate compressive strength and compressive modulus before failure. This may be explained by the lower concentration of both the base polymer and curing agents, thus allowing for greater degree of compression and exhibiting higher elastic modulus (before failure) and higher ultimate compressive strengths. This phenomenon is also observed in resins with lower crosslinker concentration. This trend was also observed by Khanafer et al., 38 Wang et al., 39 and Kim et al., 42 where silicone elastomer samples were treated at different temperatures during the curing process.
Fabrication by both direct molding and 3D printing of silicone meniscus had been done. Mechanical compression test results, as shown below in Figure 10 and Table 4, did not show any statistically significant difference in compressive moduli between 3D-printed and molded samples using Ecoflex 30 samples (p = 0.32) and in compressive moduli between 3D-printed and molded samples using Ecoflex 50 samples (p = 0.31). Hysteresis effect was particularly obvious at a low strain rate at 12 mm/min in both monotonic and cyclical loadings as shown in Figure 11. The strain hardening effect was observed at 1000 cycles at a high strain rate of 1000 mm/min.
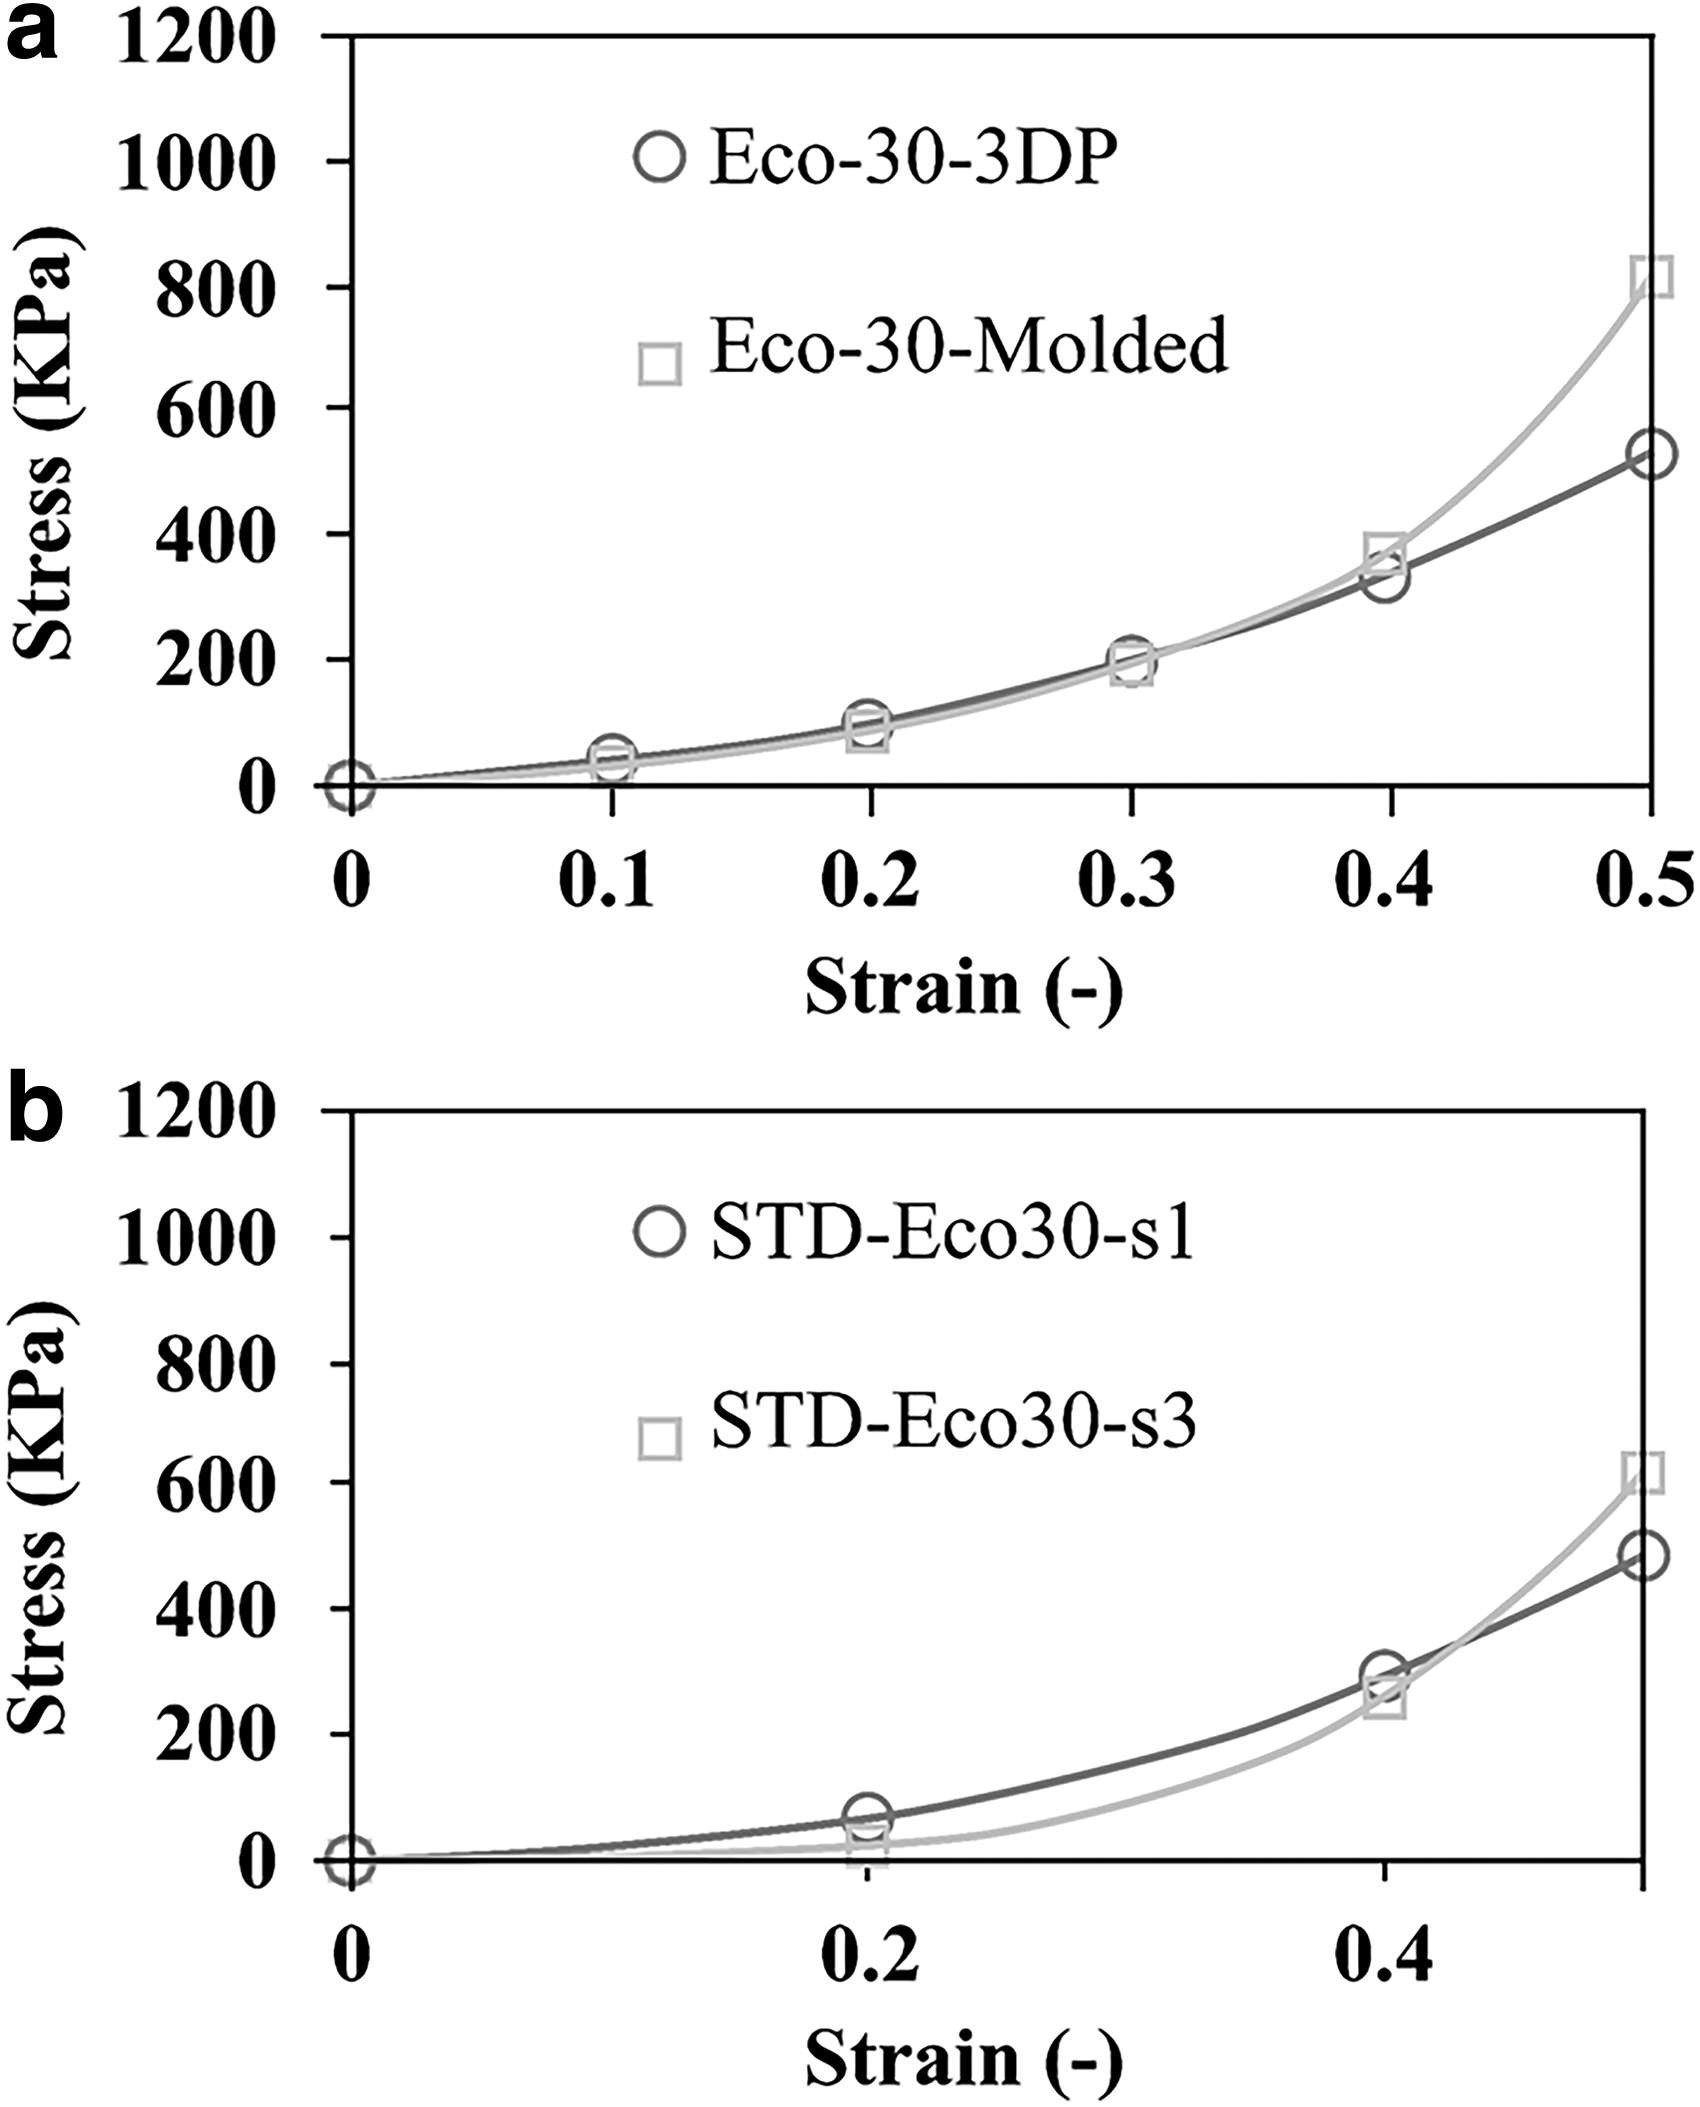
Compressive stress/strain curves for two groups of 3D-printed and molded meniscus samples,

Stress/strain curves in single and cycle loadings.
Compressive Modulus for Molded and 3D-Printed Meniscus Samples (i.e., Strain Range 0.3–0.5)
Weibull failure plot model of 3D-printed meniscus
With moderate variability in the failure data of the silicone meniscus implants in this study, the two-parameter Weibull distribution (e.g., exponential, lognormal, and Weibull distribution) is used for the reliability analysis43,44 due to its versatility,20,45,46 after checking the validity and suitability of the model. To fully capture the reliability of different components under different conditions with different behaviors, several new models have been proposed over the years that are either derived from, or in some way related to, the two-parameter Weibull distribution. An example is the Weibull proportional hazard model, which can be used to calculate the reliability of a component considering the effect of operational conditions (such as temperature, dust, or humidity). 21 Most of the distributions in the Weibull family have a characteristic shape on the WPP. For example, a twofold Weibull mixture has an S-shape and a two-parameter Weibull distribution is a straight line.22,47 Hence, the WPP can provide a systematic procedure to determine which model is more appropriate for a specific data set.
For only 1 in 106 samples of meniscus to fail (F = 10−6), at 1000 × of cyclic loading and maximum strain rate of 1000 mm/min, a typical daily walking frequency of a sedentary person, the maximum stress that Ecoflex 50 (σF50) and Ecoflex 30 (σF30) silicone meniscus implants can take (σF50) is 2.696 and 0.369 MPa, respectively. The Weibull failure plot for 3DP Ecoflex 50 and Ecoflex 30 meniscus implants is shown in Figure 12.
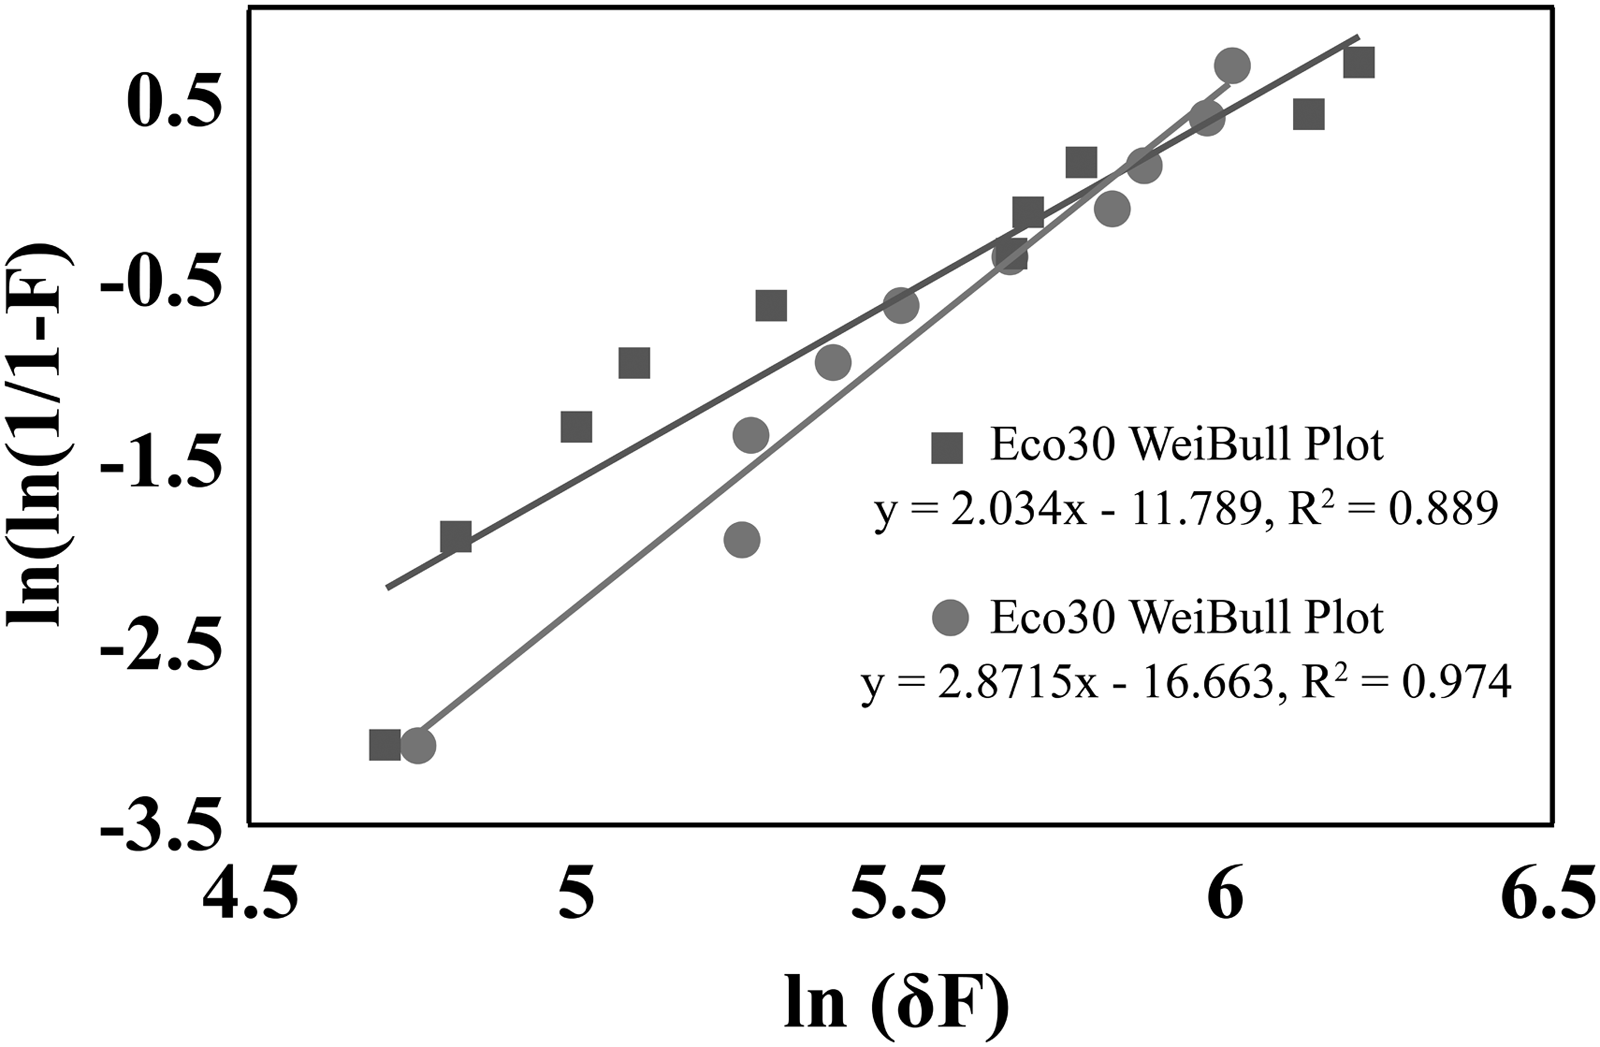
Weibull failure plot for 3DP Ecoflex 50 and Ecoflex 30 meniscus implants.
The null hypothesis for no differences between Ecoflex 30 silicone printouts and Ecoflex 50 silicone printouts was rejected. Higher strengths were associated with Ecoflex 50 silicone printouts. Weibull analysis showed that parameter b (Weibull modulus) had a value greater than 1 in all groups, indicating an increasing failure rate as expected. However, the confidence intervals of b show that while most materials have similar values, Ecoflex 50 has a higher b value, indicating a decreasing failure rate different from Ecoflex 30. This is expressed in an early failure of the bond mainly due to its high percent elongation. Weibull analysis showed also that parameter a (characteristic strength), which indicates the highest failure stress at a probability of 63.2%, ranges from 4.75 to 5.97 N/mm2 for Ecoflex 50 and from 4.71 to 6.20 N/mm2 for Ecoflex 30. The higher values of a were associated with Ecoflex 50 samples and lower values with Ecoflex 30 samples, following the same pattern with the results based on the means.
Reliability analysis
The Weibull distribution is suitable for modeling data with monotone hazard rates that either increase or decrease exponentially with time. The Weibull hazard and survivor functions are h(x) = f(x)/S(x) = f(x)/1 − F(x) and S(t) = exp(−λtp), respectively, where p is ancillary or shape parameter, and λ is exp (Xβ). 41
At single and four cycles of cyclic loading, Figure 13 shows that both Ecoflex 50 silicone standard specimens and Ecoflex 50 silicone meniscus implants have lower cumulative frequencies of failure hazard and thus have a higher than 95% reliability of survivorship, compared with their Ecoflex 30 counterparts, for any given stress level.
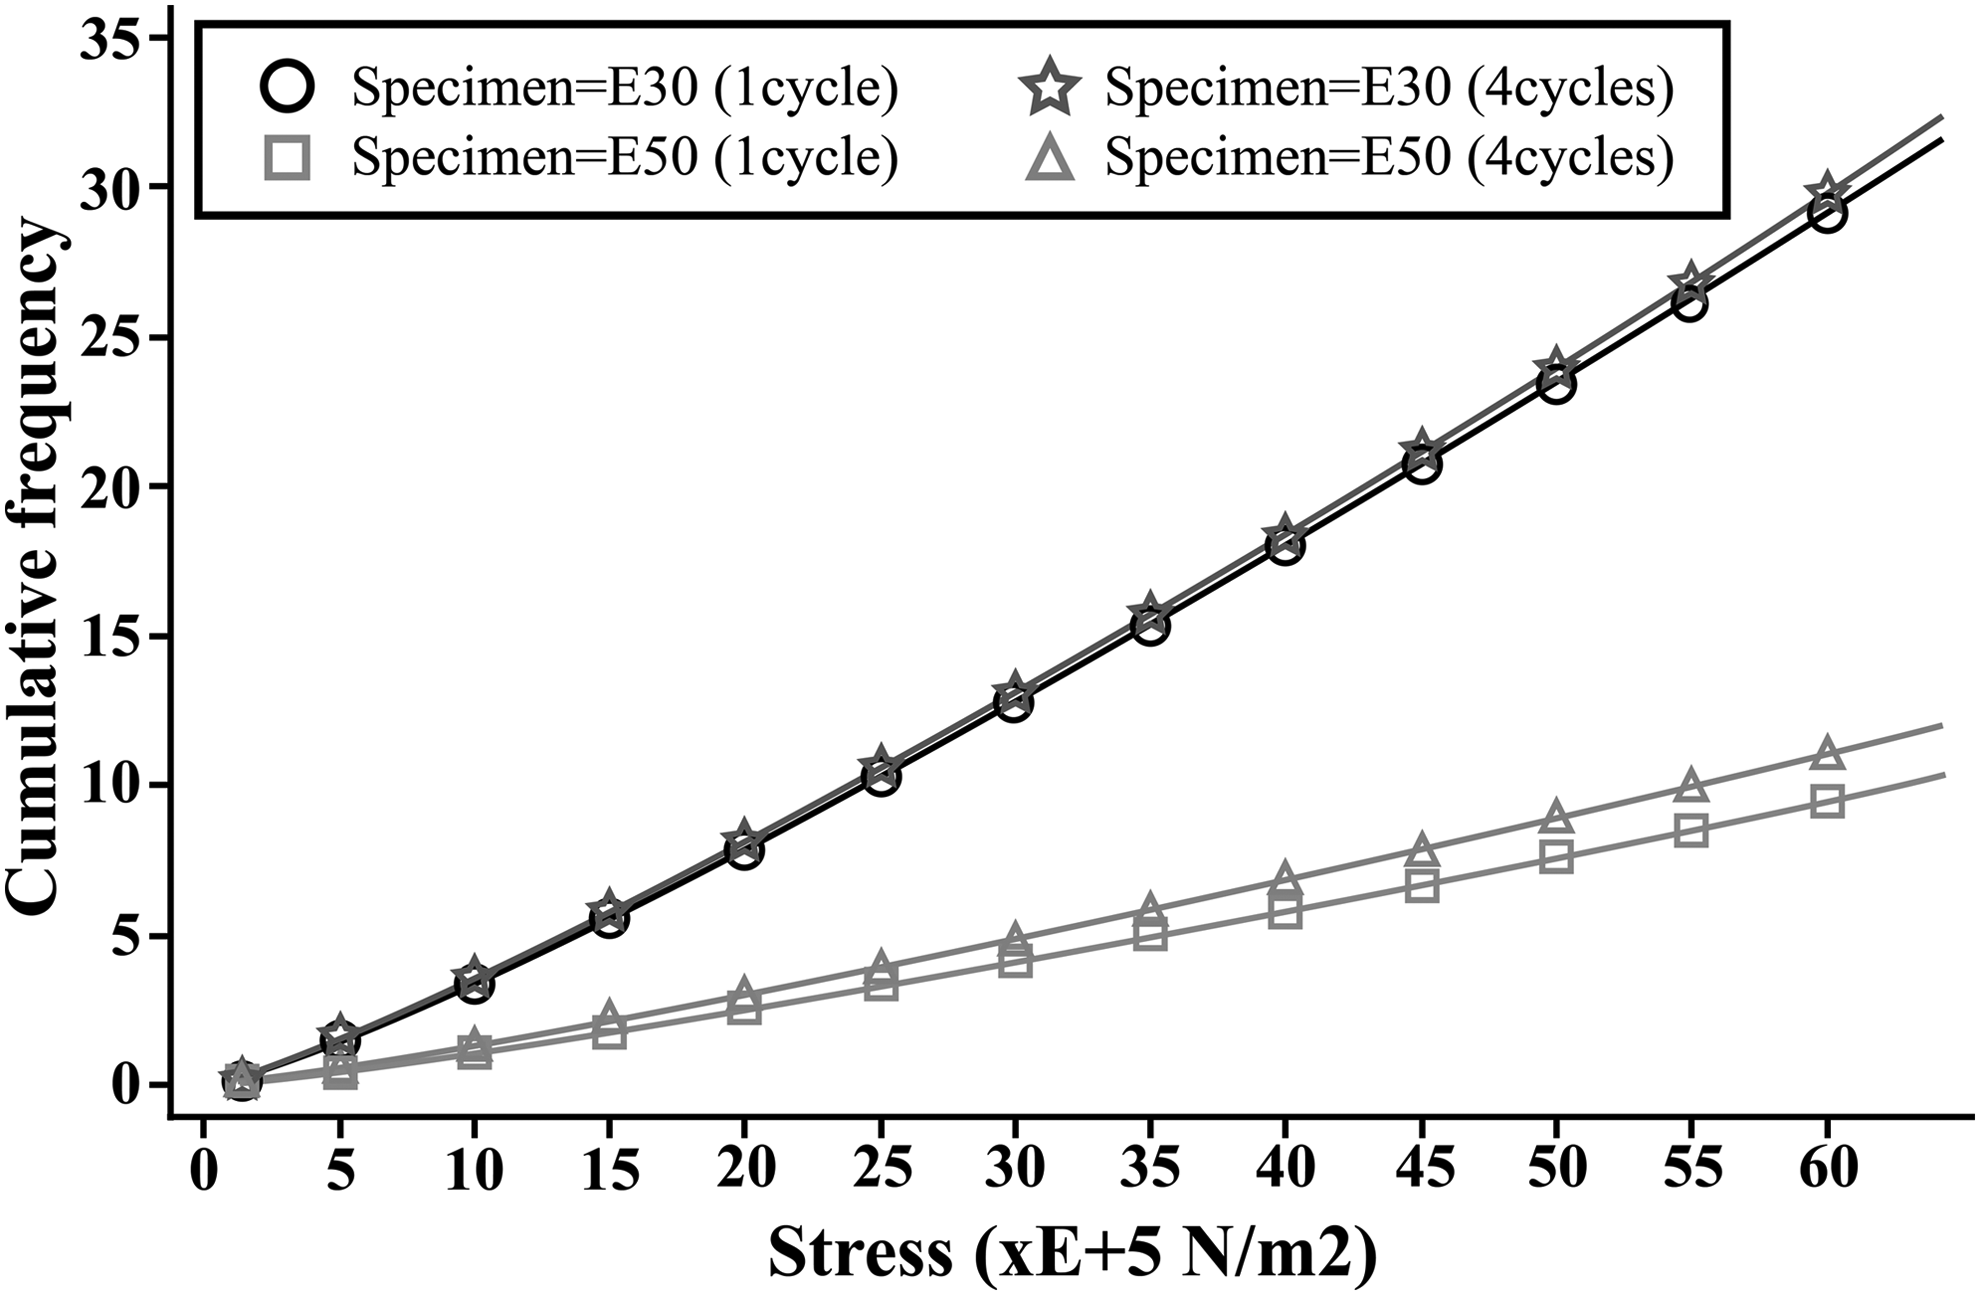
Cumulative frequencies for stress (×105 N/m2) by different cycles of specimen using Weibull distribution.
At 1000-cycle cyclic loading, Figure 14 shows that the Ecoflex 50 meniscus implant (M50) has the lowest and Ecoflex 30 meniscus implant (M30) has the highest cumulative frequencies of failure for any given stress. Similarly, Ecoflex 50 standard specimens (E50) have a higher reliability rate of survival compared with Ecoflex 30 standard specimens (E30).
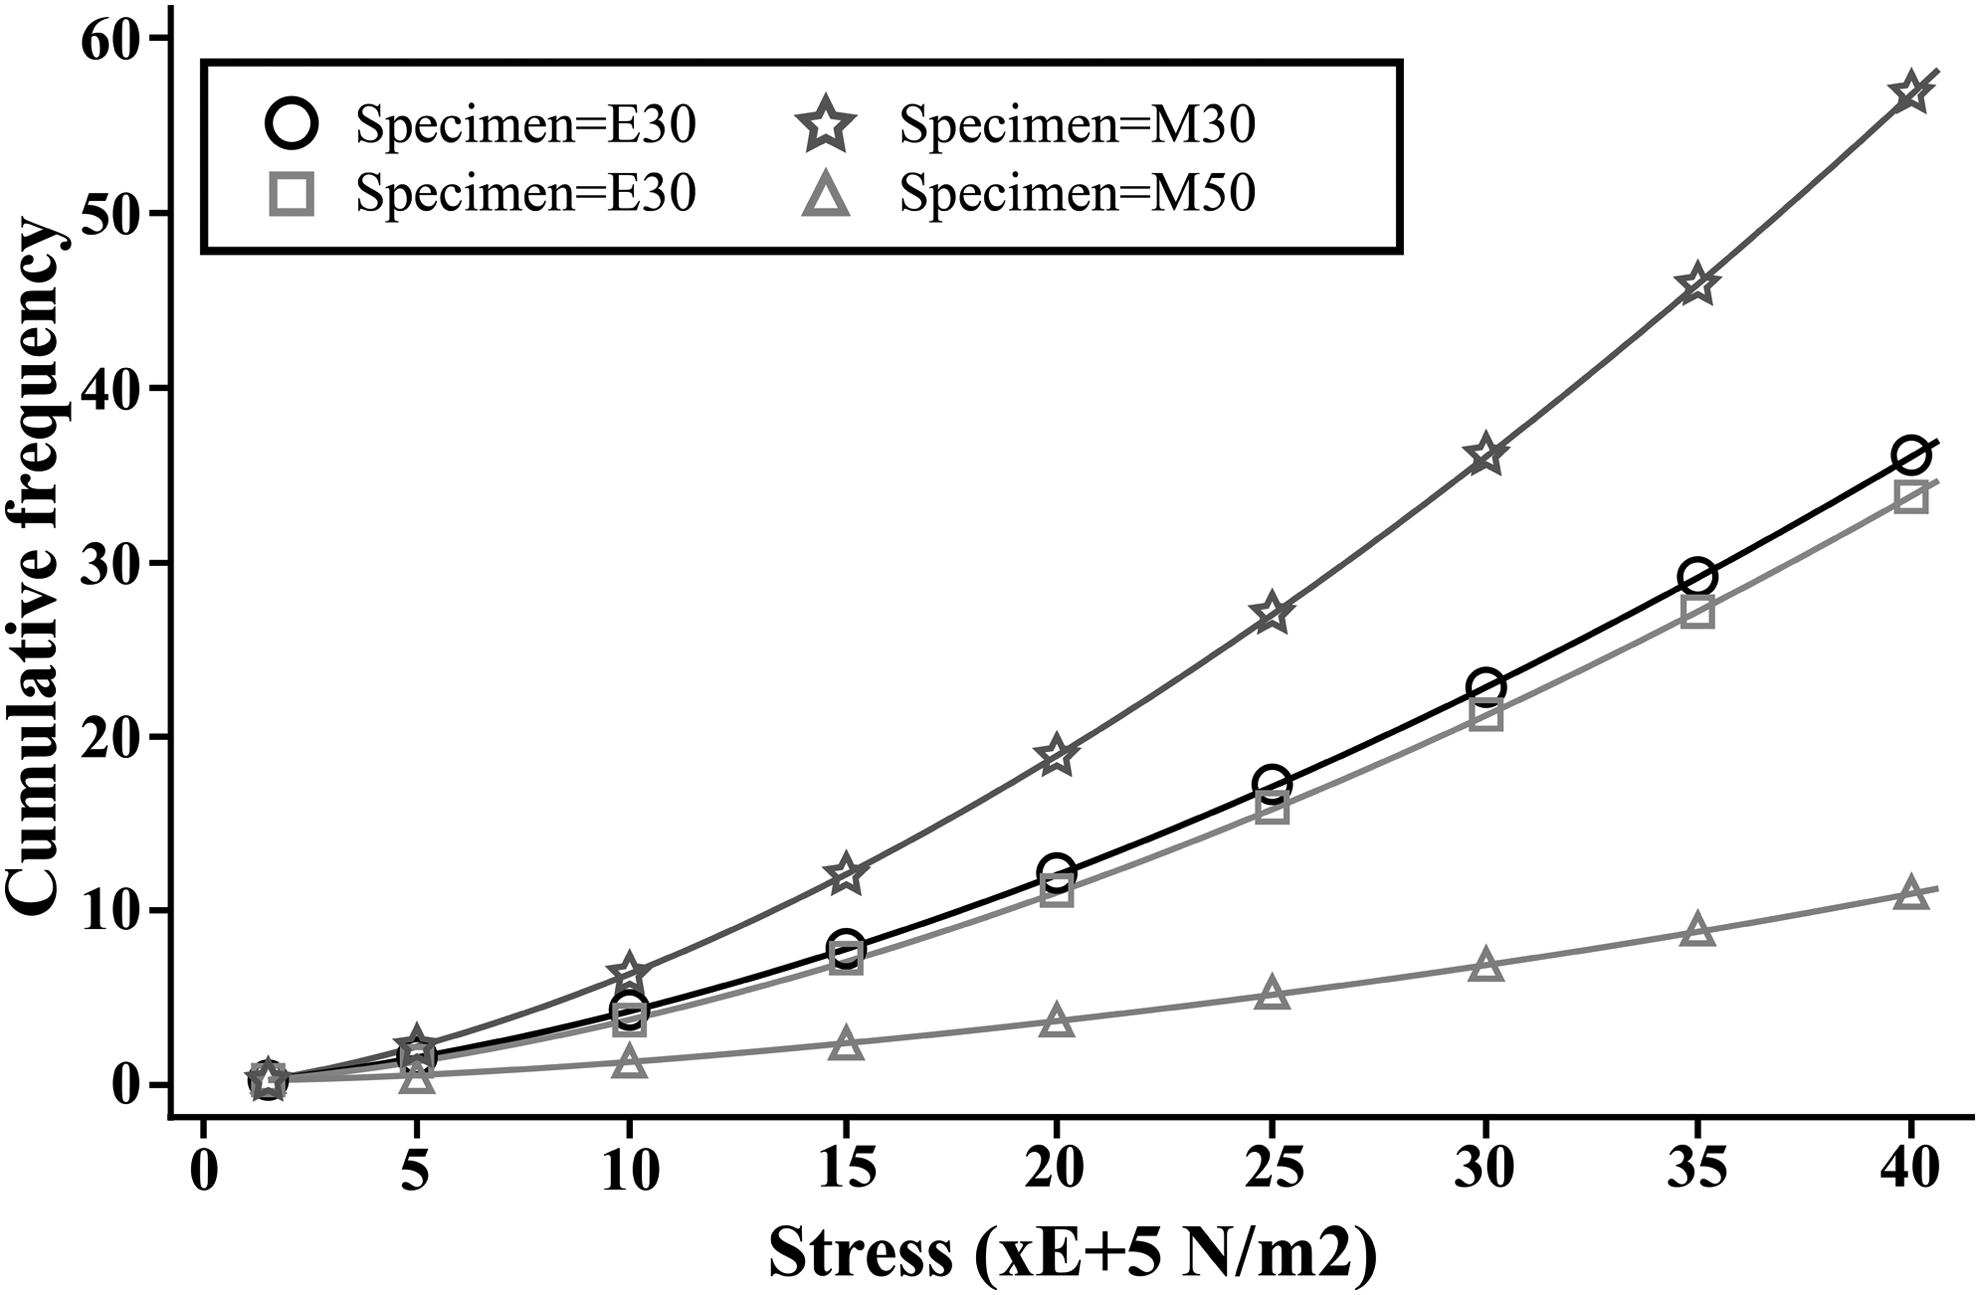
Cumulative frequencies for stress (×105 N/m2) of Ecoflex 30 and Ecoflex 50 specimens using Weibull distribution. E30/E50 = standard (ASTM D575) samples and M30/M50 = meniscus samples.
Biocompatibility
Cytotoxicity test via extraction method
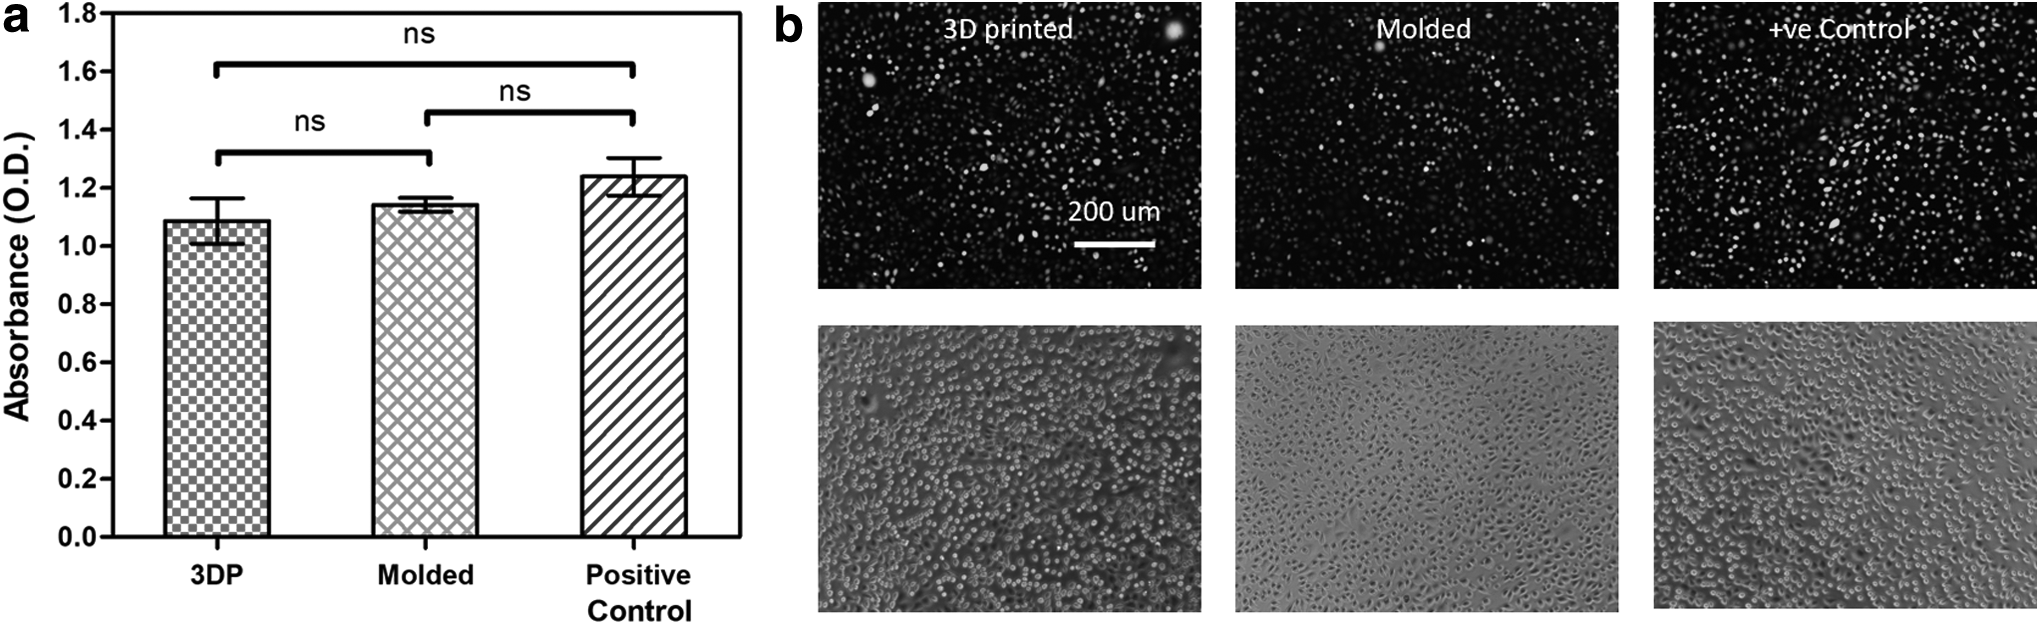
Cytotoxicity test by extraction according to ISO10993-12 15 is used widely in most in vitro biocompatibility studies. However, the extraction parameters in ISO10993-12 such as extraction medium, extraction time, and extraction volume/surface area should be adapted to simulate in vivo degradation. In this cytotoxicity study, we examined and compared between molded and 3D-printed silicone samples for extraction times of 10, 20, and 30 days, and extraction volume/surface area ratios of 1×, 2×, and 3×. Results from quantitative cell proliferation assays indicated a statistically nonsignificant difference between almost all 3D-printed and molded Ecoflex 30 and Ecoflex 50 samples for all three extraction volume/surface area ratios tested (Figs. 15 and 16). This points to the nontoxic nature of the 3D-printed silicone as no toxic chemicals were released over the extraction period. The same observation was made for longer periods of observation up to 30 days of extraction time (Fig. 17). The results are extremely promising and highlight the long-term biocompatibility and stability of the 3D silicone using cell culture medium as extraction medium.

Cytotoxicity results under different extraction volume/surface area ratios for extracts collected from standard silicone samples: 3D-printed-Ecoflex-50/30, molded-Ecoflex-50/30, and positive control. Cell proliferation of L929 cells after 24 h of incubation with extract was quantified based on the WST-8 cell proliferation assay. Statistical significance between groups was assessed using two-way ANOVA followed by Bonferroni post tests. nsp > 0.05, *p < 0.05, **p < 0.01, and ***p < 0.001. ANOVA, analysis of variance.

Conclusions
In conclusion, based on analysis using regression method and analysis of variance, it was found that ND and BT were the major determinants on the accuracy and precision of printed dimensions in the x–y horizontal planes, while the BT was the only significant determinant on construct. Failure results were analyzed using the two-parameter Weibull probability distribution model and Weibull regression analysis and revealed that Ecoflex 50 silicone meniscus had lower failure rates than the Ecoflex 30 counterparts. Finally, results from quantitative cell proliferative assay exhibit statistically insignificant differences for all samples, pointing to the low cytotoxicity and excellent biocompatibility of printed silicone. From the results obtained, 3D printing allows rapid customization and production of silicone meniscus, achieving close to the accuracy of conventional molding when the appropriate liquid silicone rubber is chosen, although 100% accuracy is still a challenge when printing tall layered structures. Future improvisation in silicone printing processes can be achieved.
Footnotes
Acknowledgments
The authors thank all administrative and research staff at the Singapore Centre for 3D Printing (SC3DP), Nanyang Technological University, who have contributed to the successful publication of this work. The authors also thank Daniel Yeo Yin Ping from SC3DP for technical assistance.
Author Disclosure Statement
No competing financial interests exist.
Funding Information
This research is supported by the National Research Foundation, Prime Minister's Office, Singapore, under its Medium-Sized Centre funding scheme and by the NTU Start-Up Grant.