
Abstract
Herein, the influence of vacuum debinding temperature on microstructure and mechanical properties of three-dimensional-printed alumina is systematically investigated by employing a variety of characterization techniques. The results reveal that the debinding temperature >400°C resulted in negligible weight loss. Moreover, the crystallite size of the sintered alumina decreased with increasing debinding temperature. The lower debinding temperature of 300–350°C did not remove the photosensitive resin, which resulted in a loose lamellar structure. However, the higher debinding temperature (450–600°C) resulted in several irregular small-sized particles. Moreover, the size of alumina particles increased after the sintering process. The Raman analysis revealed that the debinded samples contain C, Al, and O; however, the C has not been detected after sintering. In general, the physical properties, such as shrinkage, open porosity, and relative density, exhibited a close relationship with the flexural strength, which is influenced by the debinding temperature. Based on the physical properties and processing requirements, the optimal vacuum debinding temperature should be in the range of 400–500°C.
Introduction
Since its invention by Charles Hull in 1986, three-dimensional (3D) printing technology has attracted wide academic and industrial attention due to its distinct advantages, such as low utilization of raw materials, short production cycle, and formation of complex-shaped components. 1 3D printing, also known as stereolithography (SL), is being widely used to fabricate polymer-based components, where a liquid resin tank is filled with ultraviolet (UV)-assisted curing resin and a certain dose of UV laser irradiation cures the desired region. In general, curing depth should be controlled during the printing process and it should be kept higher than the height of the platform movement to ensure a strong bond between the layers.2–5 After more than 30 years of development, SL technology has attained the maturity of fabricating plastic products with excellent precision and fast production rate. 6
In 1996, Griffith et al. have applied 3D printing to fabricate ceramic components and initiate another promising area of 3D SL research. 7 However, the utilization of 3D SL in ceramics renders unique challenges. For instance, the addition of inorganic powder reduces the fluidity of photosensitive resin and hinders the liquid movement. 8 Moreover, the scattering of slurry system due to the addition of ceramic particles increases the curing linewidth and decreases the curing depth, which leads to reduce precision of the printed component. Furthermore, the 3D-printed green body contains a lot of resin, which easily breaks the sample during debinding and sintering processes.
Alumina has excellent abrasion resistance, good heat insulation, outstanding high temperature stability, and excellent corrosion resistance. It is the ceramic material with the largest application, the largest production, and the widest application field in oxide ceramics. 9 However, due to the high hardness and poor toughness of alumina ceramics, it is more difficult to fabricate alumina ceramics with complex parts. Therefore, it is important to research the forming method of alumina ceramics through 3D printing technology via SL.
Wu et al. 10 have fabricated the alumina ceramics by using the microsized Al2O3, nano-sized Al2O3, and a mixture of micro- and nano-sized Al2O3 to investigate the influence of debinding process parameters on the density of 3D-printed components. It has been reported that the material that was vacuum debinderized exhibits a higher density than the traditional thermal debinding. Moreover, Wu et al. have concluded that the bimodal particle size distribution of the starting powder and vacuum debinding can effectively enhance the performance of 3D-printed ceramics. Li et al. 11 have observed that the quality of 3D-printed ceramic components is largely influenced by the bond strength gradient during the debinding process. Zhou et al. 12 have prepared a defect-free alumina cutting tool via SL 3D printing technology to optimize the drying and debinding processes.
Compared with the natural drying process, polyethylene glycol (PEG400) reduced the deformation of the green body. Compared with the vacuum debinding or air debinding, the debinding process, consisting of a vacuum pyrolysis step and air debinding, can suppress the deformation of 3D-printed components due to its excellent control over the pyrolysis rate. Chartier et al. 13 have investigated the influence of irradiation parameters on the polymerization of ceramic reactive suspensions to avoid the stress-induced cracking and deformation during debinding and sintering stages. Xing et al. 14 have studied the effect of plasticizer on the fabrication and properties of SL-fabricated alumina ceramics and demonstrated that the adjacent layers do not exhibit any delamination.
Moreover, Xing et al. have shown that the internal stress in the green bodies should be changed during the debinding process to optimize the integrity of green bodies. One should note that the cracks occur between two adjacent layers due to the insufficient adhesion of the individual layers. 15 To fabricate complex-shaped ceramic components, Lian et al. 16 have employed the bottom-up mask-projection SL technique and established the optimal debinding protocols to improve the printing efficiency and product quality.
Therefore, the influence of debinding conditions on the quality of SL-printed ceramic components should be studied to obtain a better understanding of the 3D printing process and device the required improvement strategies. One should note that the ceramic green bodies exhibit an optimal debinding temperature, where too low temperature does not render the debinding effect and too high temperature leads to undesirable energy consumption and induces side effects, such as cracked surface and inferior strength. As vacuum debinding reduces the rate of resin decomposition and volatilization in alumina ceramic green bodies, herein, we aimed to investigate the effect of temperature during vacuum debinding on microstructure and mechanical properties of SL-printed alumina components.
The thermal stability, crystal structure, elemental composition, and morphological features of debinded and sintered alumina samples have been systematically studied. Furthermore, the influence of debinding temperature on shrinkage, open porosity, relative density, and flexural strength has also been investigated.
Experimental Procedure
Alumina ceramic slurry and green body
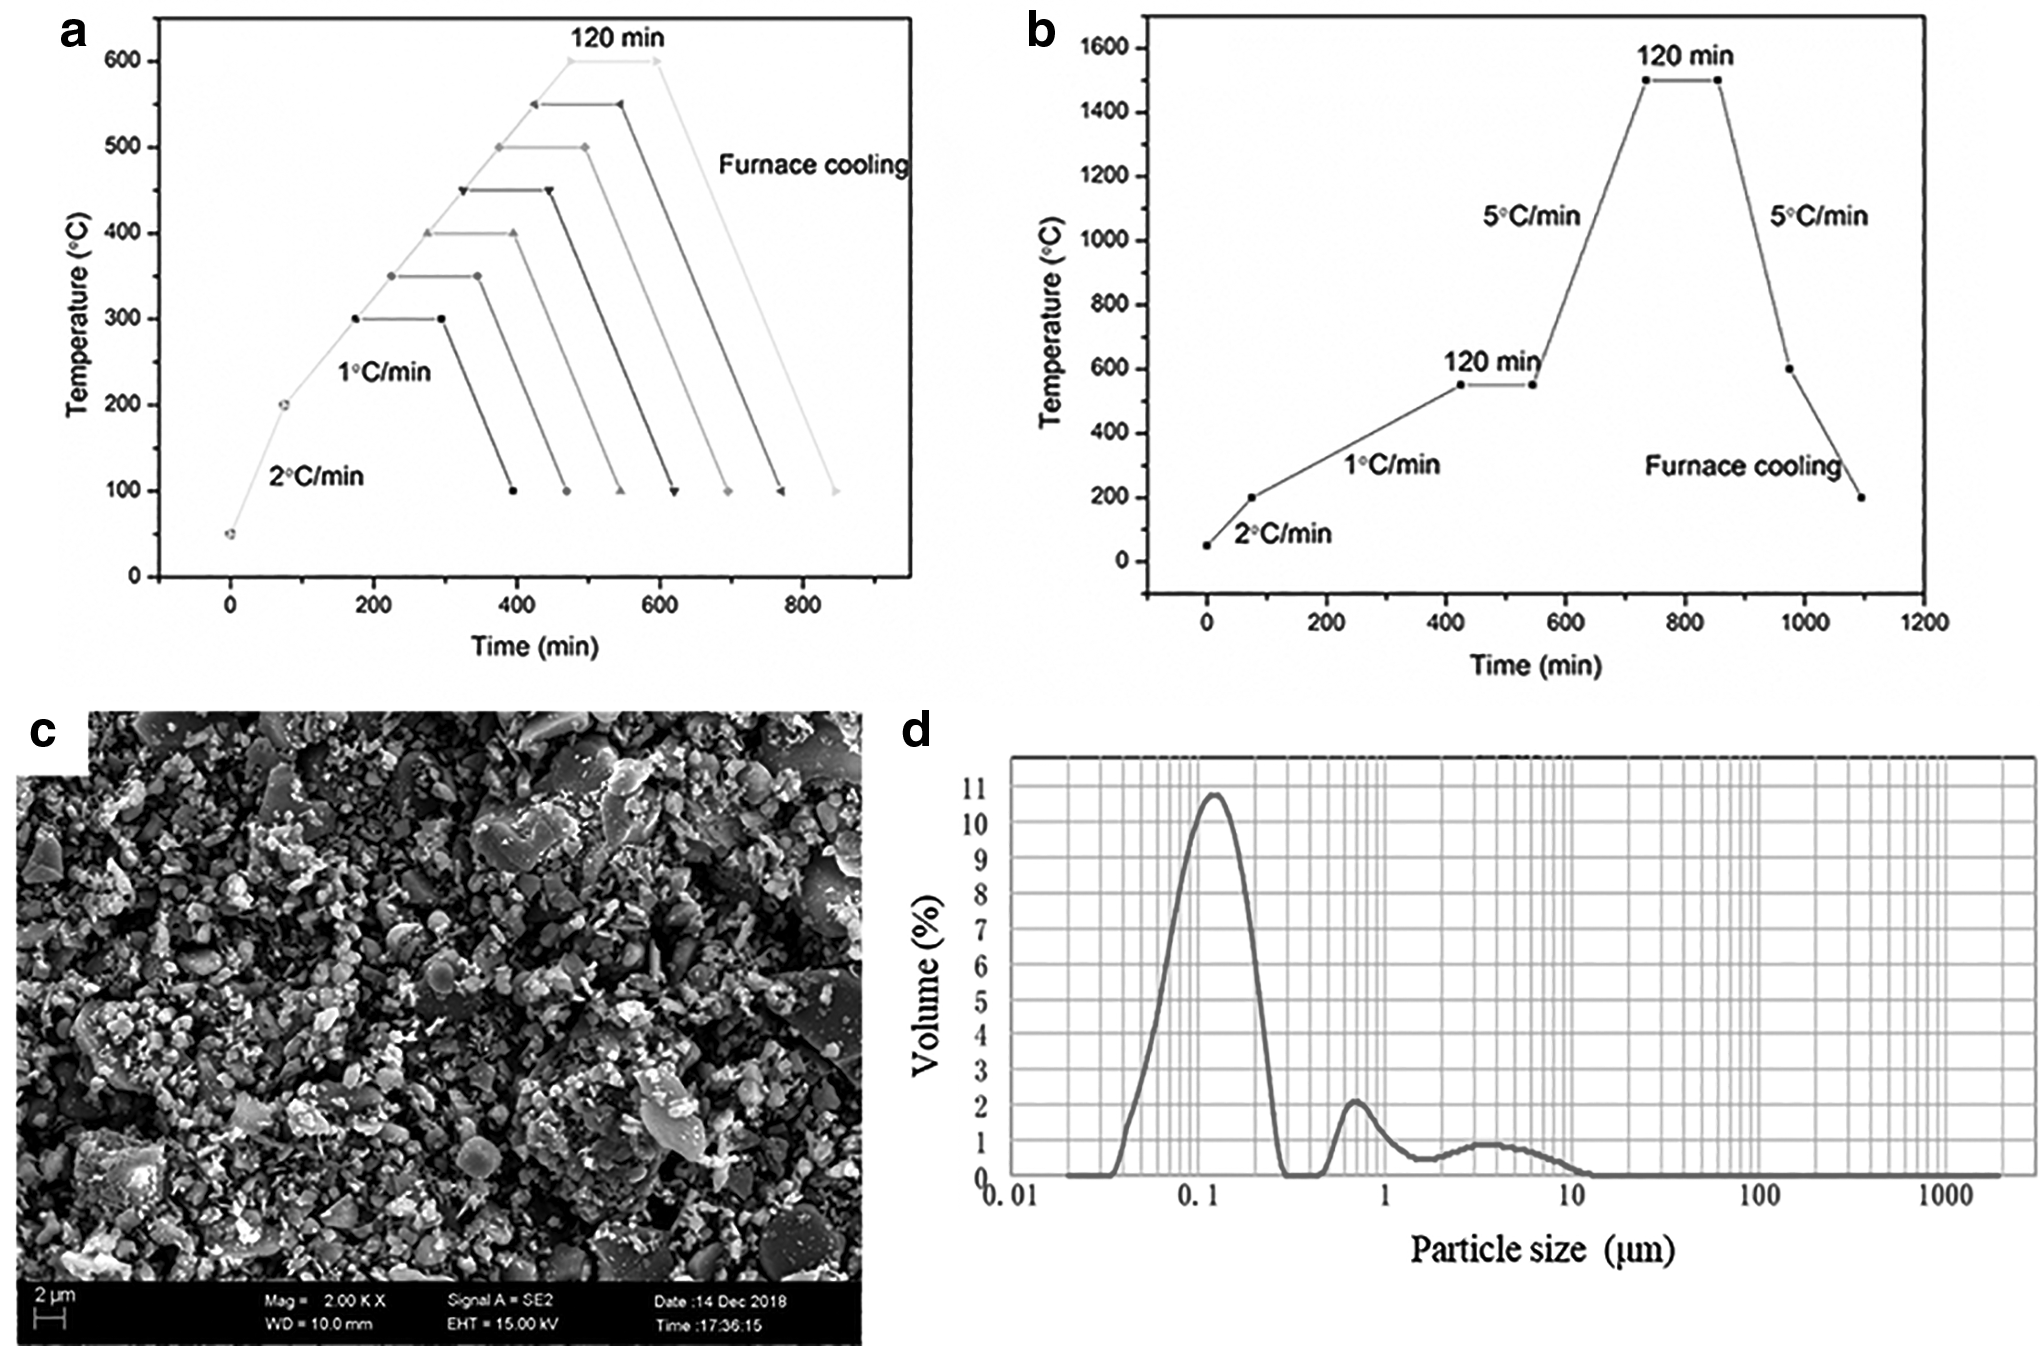
The alumina powder was obtained from Henan Hecheng Inorganic New Material Co., Ltd., China. The scanning electron microscopy (SEM) images showing the morphology and the particle size of the powders are shown in Figure 1. The photosensitive resin was purchased from Beijing Ten Dimensions Technology Co., Ltd., China.
The
The type of photosensitive resin belongs to acrylic resin. Briefly, 495 g of alumina powder were added to 100 g of photosensitive resin, followed by vigorous stirring. Then, the mixture was ball-milled for 2 h and defoamed for 10 min, resulting in alumina ceramic slurry. The alumina ceramic slurry was transferred to the 3D printer (Beijing Ten Dimensions Technology Co., Ltd.), and the exposure energy and single-layer exposure time were set at 10 mW/cm2 and 10 s, respectively. The layer thick was set at 100 μm. The 3D printing process resulted in alumina ceramic green bodies with a cuboid model, and the size of the model was 50 × 5 × 4 mm. The x- and y-directions were parallel to the building direction.
Debinding and sintering processes
The debinding of green bodies was carried out in a tubular furnace (Hefei Ke Jing Materials Technology Co., Ltd., China). First, the green bodies were heated to 200°C at a heating rate of 2°C/min. Then, the samples were heated to the target temperature (T = 300°C, 350°C, 400°C, 450°C, 500°C, 550°C, and 600°C) at a heating rate of 1°C/min and held for 2 h. The debinding profile is illustrated in Figure 1a, and the alumina ceramics, debinded at different temperatures, were named as S(T).
After the debinding process, the samples were sintered in a muffle furnace (Hefei Ke Jing Materials Technology Co., Ltd.). First, the samples were heated to 200°C at a heating rate of 2°C/min. Then, the samples were heated to 550°C at a heating rate of 1°C/min and held for 2 h. Finally, the samples were heated to 1500°C at a heating rate of 5°C/min and held for 2 h. The sintering profile is illustrated in Figure 1b. The debinding process was conduct in vacuum atmosphere, and the sintering process was conduct in air atmosphere.
Characterization
The thermogravimetric analysis (TGA) was carried out by using a 449F5 simultaneous TG-DSC apparatus (Netzsch, Germany) in the temperature range of 50–600°C. The temperature was increased at a heating rate of 10°C/min under continuous argon flow. X-ray diffraction (XRD) patterns were recorded by using a Bruker D8 FOCUS X-ray diffractometer, equipped with Cu Kα radiations (Bruker Corporation, Germany). The samples were scanned at a scan rate of 0.02° s−1 per step, in the 2θ range of 10°–90°. The voltage and current of X-ray tube were 40 kV and 30 mA, respectively. 17 The Raman spectroscopy was carried out by using Confocal Raman Microscope Systems (Alpha300R, WITec), with a laser wavelength of 532 nm, irradiation power of 50 mW, and a slit width of 50 μm.
SEM images were observed by using Helios G4 CX (FEI Corporation), equipped with energy dispersive spectrometer (Thermo NS7, Thermo Fisher). Transmission electron microscopy (TEM) was carried out by using Tecnai G2 F20 (FEI Corporation). The samples were dispersed in absolute alcohol using the ultrasonic device and then dropped on a copper microscope grid covered with perforated carbon.
The bulk density of the sintered samples was measured by using the Archimedes method. 18 The accuracy of the weighing balance was 0.0001 g (Mettler Toledo, Switzerland). The theoretical density of 3.99 g/cm3 was used for Al2O3. 19 The shrinkage of the sintered samples was measured by using the following equation:
where δ refers to the shrinkage of the sintered samples (%), L denotes the length of the green body (mm), and L1 corresponds to the length of sintered samples (mm).
The open porosity and bulk density were calculated from the following equations:
where B represents the open porosity of the sintered sample (%), d corresponds to the bulk density of sintered sample (g/cm3), G1 refers to the mass of the dry sample (g), G2 denotes the mass of the wet weight of the sample (g), G3 represents the mass of the buoyant weight of the sample (g), and dwater corresponds to the water density (g/cm3).
The flexural strength of the sintered samples was measured by using the three-point flexural method 20 (electronic universal testing machine, CMT4304; SUNS, China). The three-point flexural tests were carried out at a loading rate of 0.5 mm/min and the span length was 30 mm. The following equation was used to calculate the flexural strength:
where
Results and Discussion
TGA and physical properties
The printed green body was debinded to remove the organic photosensitive resin. The TGA was carried out after vacuum debinding at different temperatures, and the results are presented in Figure 2. Herein, TGA is performed to determine the thermal stability of the alumina ceramics at different debinding temperatures under a vacuum atmosphere. The results reveal that the samples, debinded at 300°C and 350°C, exhibited an obvious mass loss of 10% and 2%, respectively, whereas the sample, debinded at 400°C, did not show any significant mass loss. Compared with 16.8% resin content in green bodies, TGA results show that most of the resin in green bodies can be volatilized at 300°C and 350°C. However, vacuum debinding of the samples at 300°C and 350°C cannot meet the thermal stability requirements.
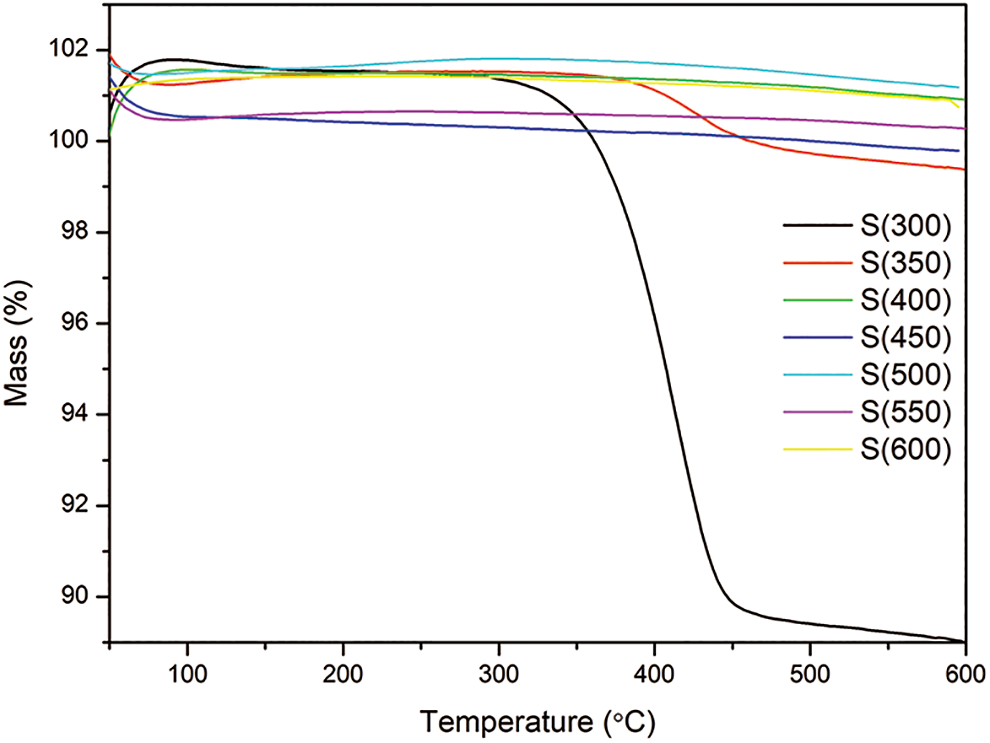
The TGA curves of the debinded samples. Color images are available online.
There still exhibited mass loss after the samples debinded at 300°C and 350°C. This means that there are some compounds, which can be decomposed when elevated the debinding temperature. Based on the TGA, the debinding temperature should be higher than or equal to 400°C. However, the higher temperature removes the organic resin from the green body and results in fragile samples. As the vacuum-debinded samples are required to transfer to the sintering furnace, a certain level of strength should be maintained to avoid the breakage of samples during the transfer process. Therefore, an optimal debinding temperature should not be too high.
The shrinkage, open porosity, bulk density, and relative density of the sintered samples are shown in Figure 3.
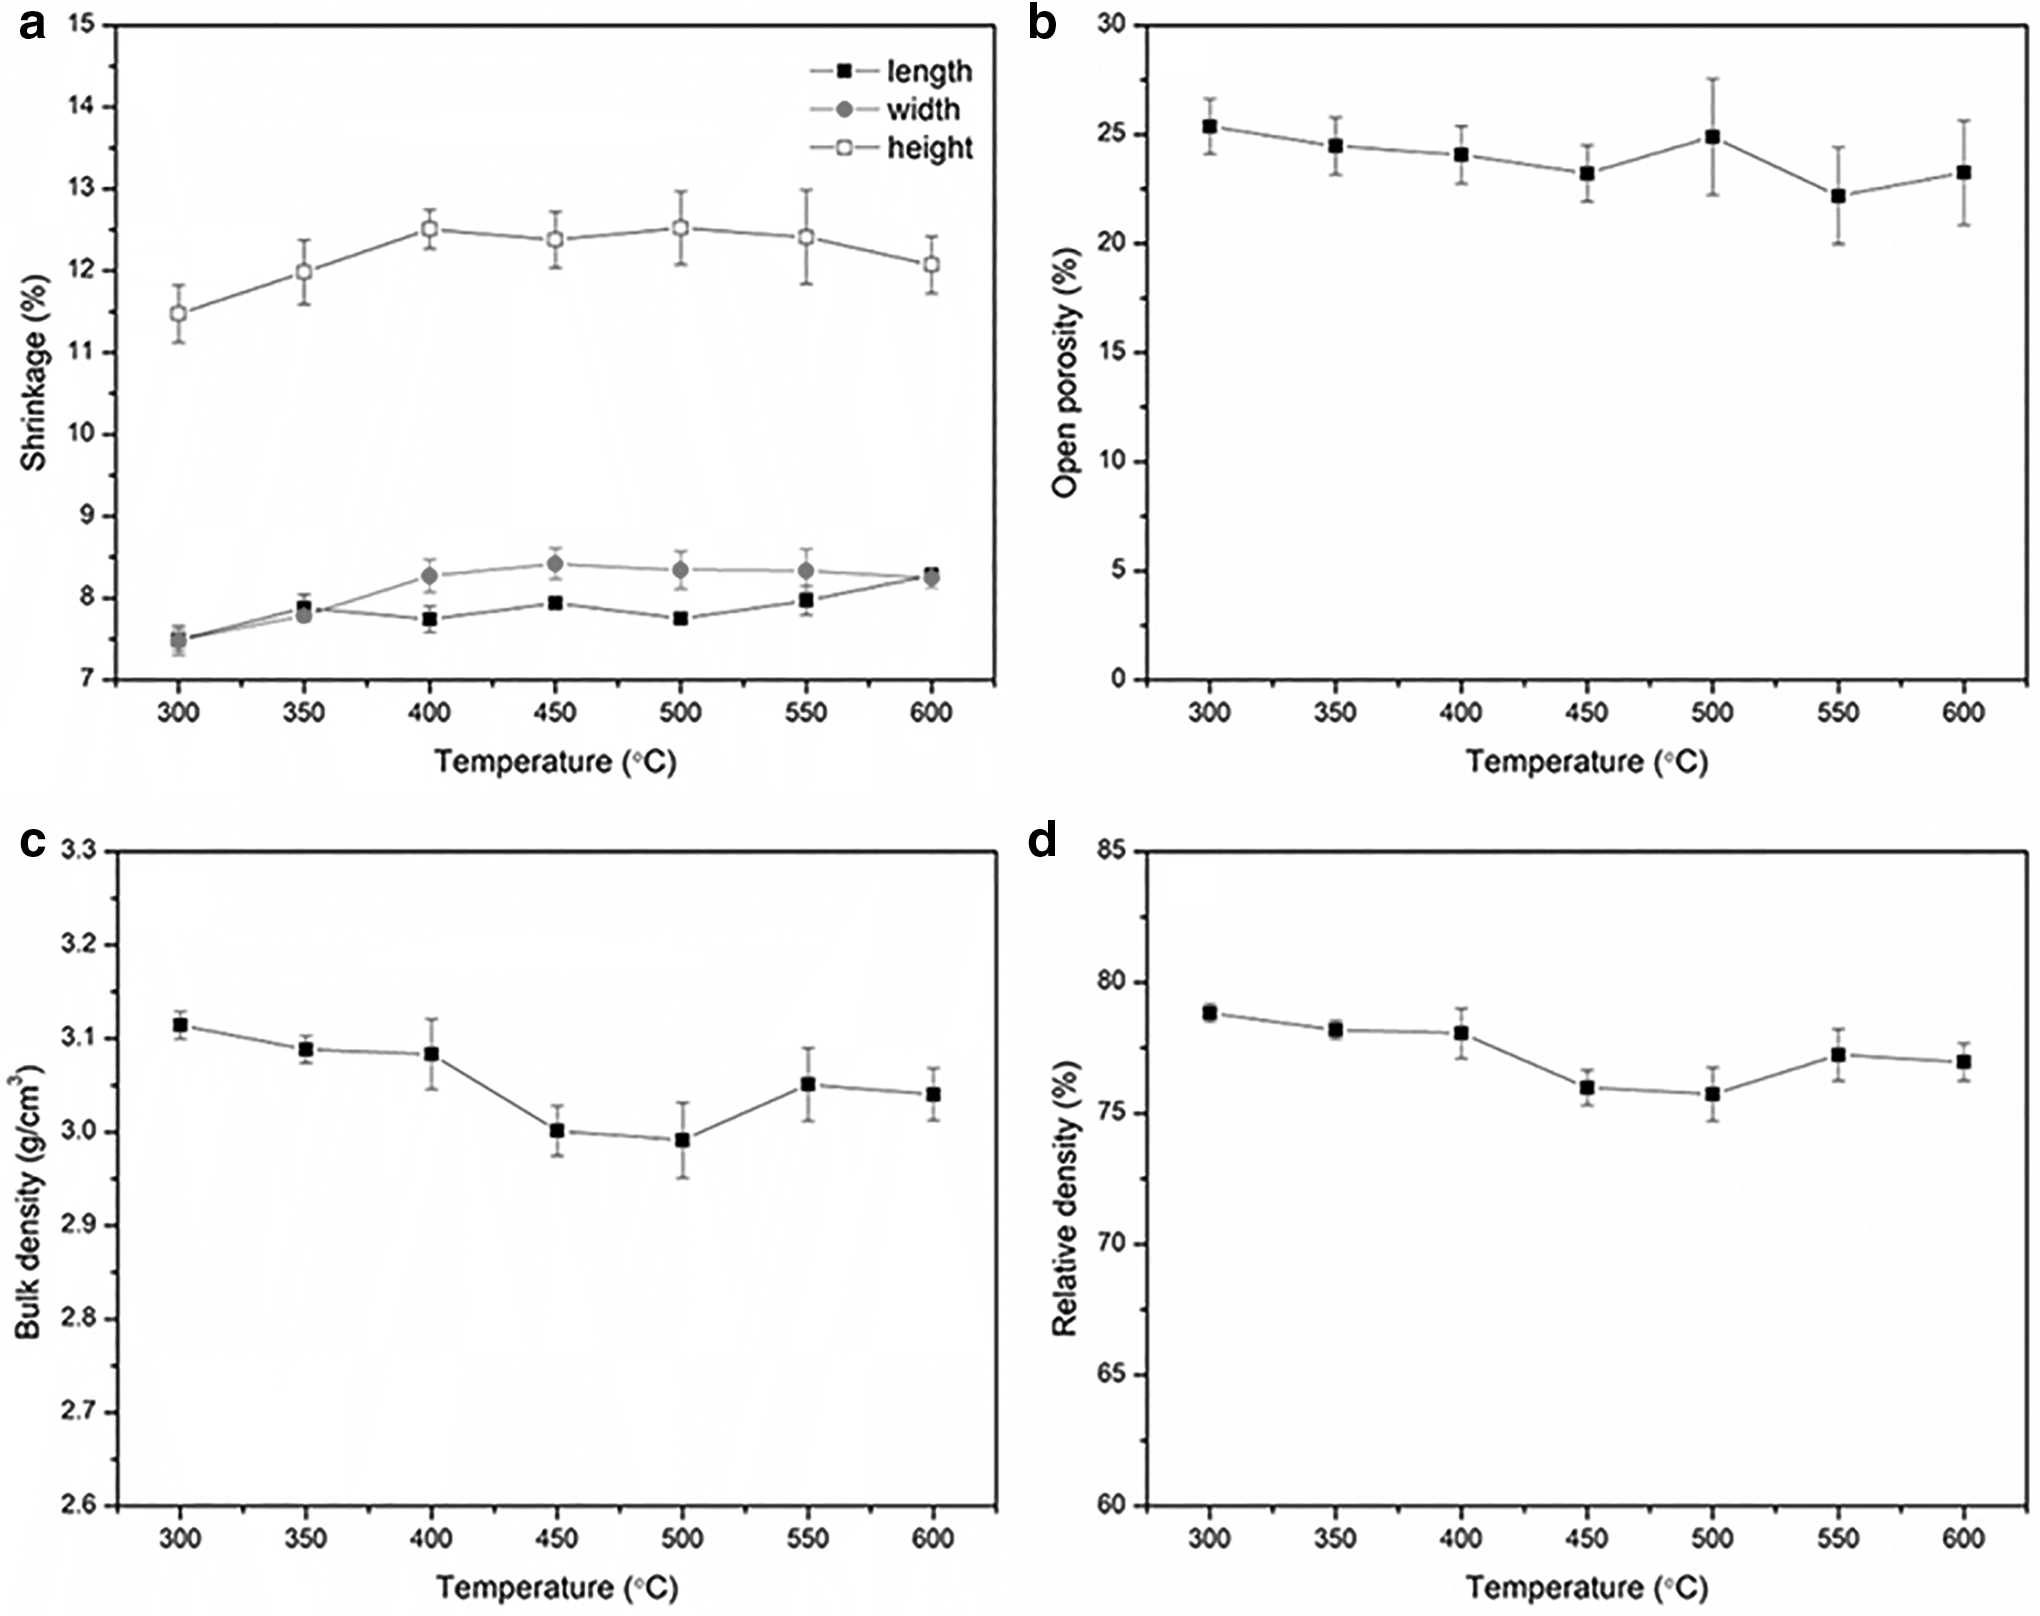
The physical properties after sintering of samples that had been debinderized at different temperatures:
At the debinding temperature of 300°C and 600°C, the sintered samples have exhibited the longitudinal shrinkage ranging from 7.5% to 8.3%, transverse shrinkage ranging from 7.5% to 8.4%, and shrinkage ranging from 11.5% to 12.5% in the height direction. One should note that even a large difference in debinding temperature (300°C) resulted in a shrinkage variation of 0.8%, 0.9%, and 1.0% in the direction of length, width, and height. Moreover, the shrinkage in the direction height is almost 1.5 times higher than the shrinkage in length and width directions.
In general, the shrinkage in the height direction of SL-printed components is higher than the length and width directions due to the layer-by-layer forming process. However, most of the published studies have shown the linear shrinkage data,21–23 whereas the shrinkage in other directions has rarely been reported. For instance, Sun et al. 24 have utilized SL to fabricate dense ceramic components by using well-dispersed ceramic suspensions with high solid loading and demonstrated the shrinkage of 21.9% in length and width directions and 28.9% in the height direction. Similar to our results, the shrinkage in height direction is 1.3 times higher than the width direction.
Chen et al. 25 have fabricated the piezoelectric ceramic transducer ceramics for ultrasound transducer array applications and demonstrated that the shrinkage is almost identical in the x- and y-directions but smaller than the z-direction. Moreover, Chen et al. have shown that the shrinkage in the z-direction is 1.2 times higher than the x- and y-directions. One should note that the SL 3D printing is a layer-by-layer process, where each layer is shaped in the x- and y-directions, and then, prototyping platform is moved in the z-direction to complete the process. Hence, the z-direction possesses a different binding force than the x- and y-directions, which results in a higher shrinkage in the z-direction than in the x- and y-directions under the same debinding and sintering conditions.
The different curing depth conditions of the z-direction compared with the x- and y-directions may lead to the different shrinkage. Along the x- and y-directions, the layers are exposed by homogeneous planar light source, and the joining is made by uniform polymerization in the x–y plane. While along the z-direction, the interfacial joining between layers is caused by the z-direction exposure and the energy distribution may be different with that in the x–y plane.
The open porosity after sintering of samples that had been debinderized at 300°C was 25.4%, and 23.2% for samples that had been debinderized at 600°C. The photosensitive resin, which is added in the alumina ceramic slurry, is removed during the debinding process, resulting in the formation of several pores. Hence, the as-prepared ceramics possess a large number of pores, which decrease the strength of as-prepared ceramics. The higher sintering temperature leads to a lower porosity at the expense of shrinkage. 26 Therefore, an optimal amount of porosity is required to maintain strength and structural stability. One should note that the open porosity is mainly influenced by the sintering temperature instead of debinding temperature. 27
In general, the SL-prepared ceramics render higher porosity due to the introduction of photosensitive resin. For instance, Thavornyutikarn et al. 28 have fabricated mechanically robust and porous ceramic scaffolds and achieved a porosity of 52–61%. Brunello et al. 29 have prepared bone tissue engineering scaffolds and obtained a total porosity of 42% after sintering at 1250°C. Maeng et al. 30 have fabricated complex-shaped ceramic architectures and achieved the porosity of 52.4% after sintering at 1250°C. Overall, the SL-prepared ceramics exhibit inferior strength due to the high porosity after sintering.
The bulk density after sintering of samples that had been debinderized at 300°C was 3.1 g/cm3, and 3.0 g/cm3 for samples that had been debinderized at 600°C. The relative density after sintering of samples that had been debinderized at 300°C was 78.8%, and 77.0% for samples that had been debinderized at 600°C. Overall, the debinding temperature did not exhibit any significant influence on bulk and relative densities. However, the bulk density slightly decreased with increasing debinding temperature. It is worth mentioning that the bulk density is closely related to the open porosity, which remained the same with changing the debinding temperature. Hence, the bulk density of different samples remained similar.
Microstructure and composition
The SEM images of the debinded and sintered samples show the morphological differences between the two processes (Fig. 4). Figure 4 shows the SEM images of the fracture surfaces for the samples. The debinded samples contain several fine particles, which grew up and exhibited excellent crystallinity after sintering. Moreover, the porous lamellar structure has been observed after debinding at 300°C, which is undecomposed photosensitive resin. Once the debinding temperature was increased to 350°C, the majority of the lamellar structure disappeared, which can be ascribed to the decomposition and removal of photosensitive resin. Moreover, the lamellar structure completely disappeared after debinding at >400°C. One should note that the debinded samples consist of two distinct sizes of alumina, indicating the bimodal distribution of alumina particles.
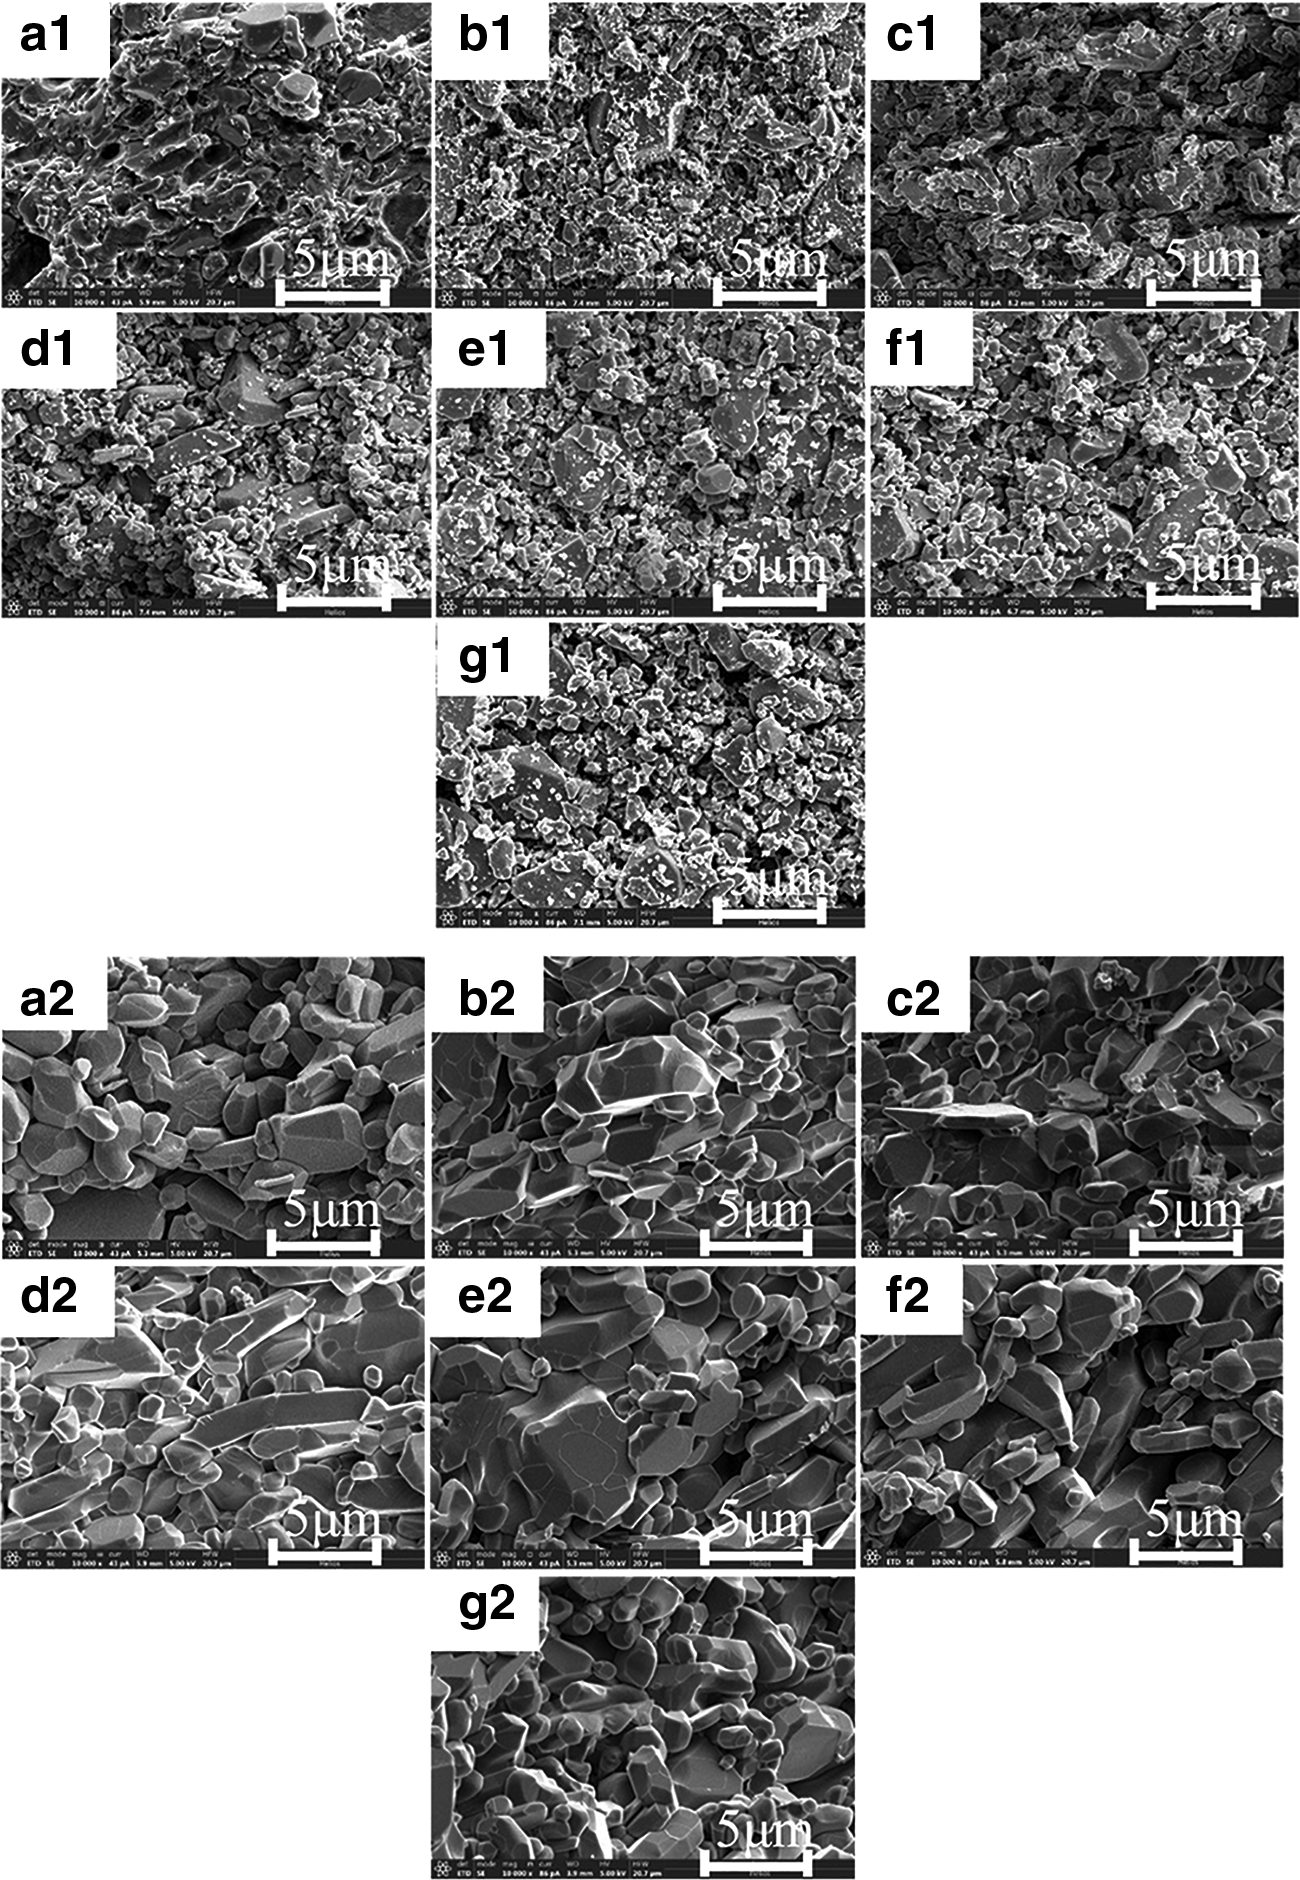
The SEM images of the debinded and sintered samples:
The smaller particles fill the gaps between the larger particles, resulting in the densification of the debinded sample. In addition, the SEM images show that the size and degree of crystallization of alumina particles gradually increased after sintering, as indicated by the clear edges and corners of the particles. The boundaries of large and small particles are distinct and tightly bound. It is worth mentioning that the observed structure is similar to the SL-printed high dielectric capacitor, as reported by Yang et al. 31
Moreover, these observations are consistent with the TGA results, as shown in Figure 2. The debinding temperatures of 400–600°C resulted in evenly mixed large- and small-size particles. The sintered samples have shown a large number of interstices between the particles, resulting in a higher level of porosity, as discussed in Figure 3. The high-temperature sintering process increases the size of small particles and decreases the porosity, which lead to higher strength.
Figure 5 presents the TEM images of debinded and sintered samples. The imaging mode was STEM image. It can be readily observed that the debinded sample possesses an irregular shape and the boundary line around the bulk sample is not obvious. TEM images show that the grain size of Al2O3, debinded at 300–350°C, is smaller than the samples debinded at 400–600°C. In the debinded samples, the large alumina particles are covered by several irregular-shaped small-size alumina particles. After sintering, the boundary of the alumina particles became clear, which indicates the growth of sintered alumina ceramics. Zhang et al. 32 have investigated the spherical α-Al2O3 and observed that the outer edge of the particles exhibits a thicker layer. Herein, the darkness contrast represents the thickness of alumina particles.
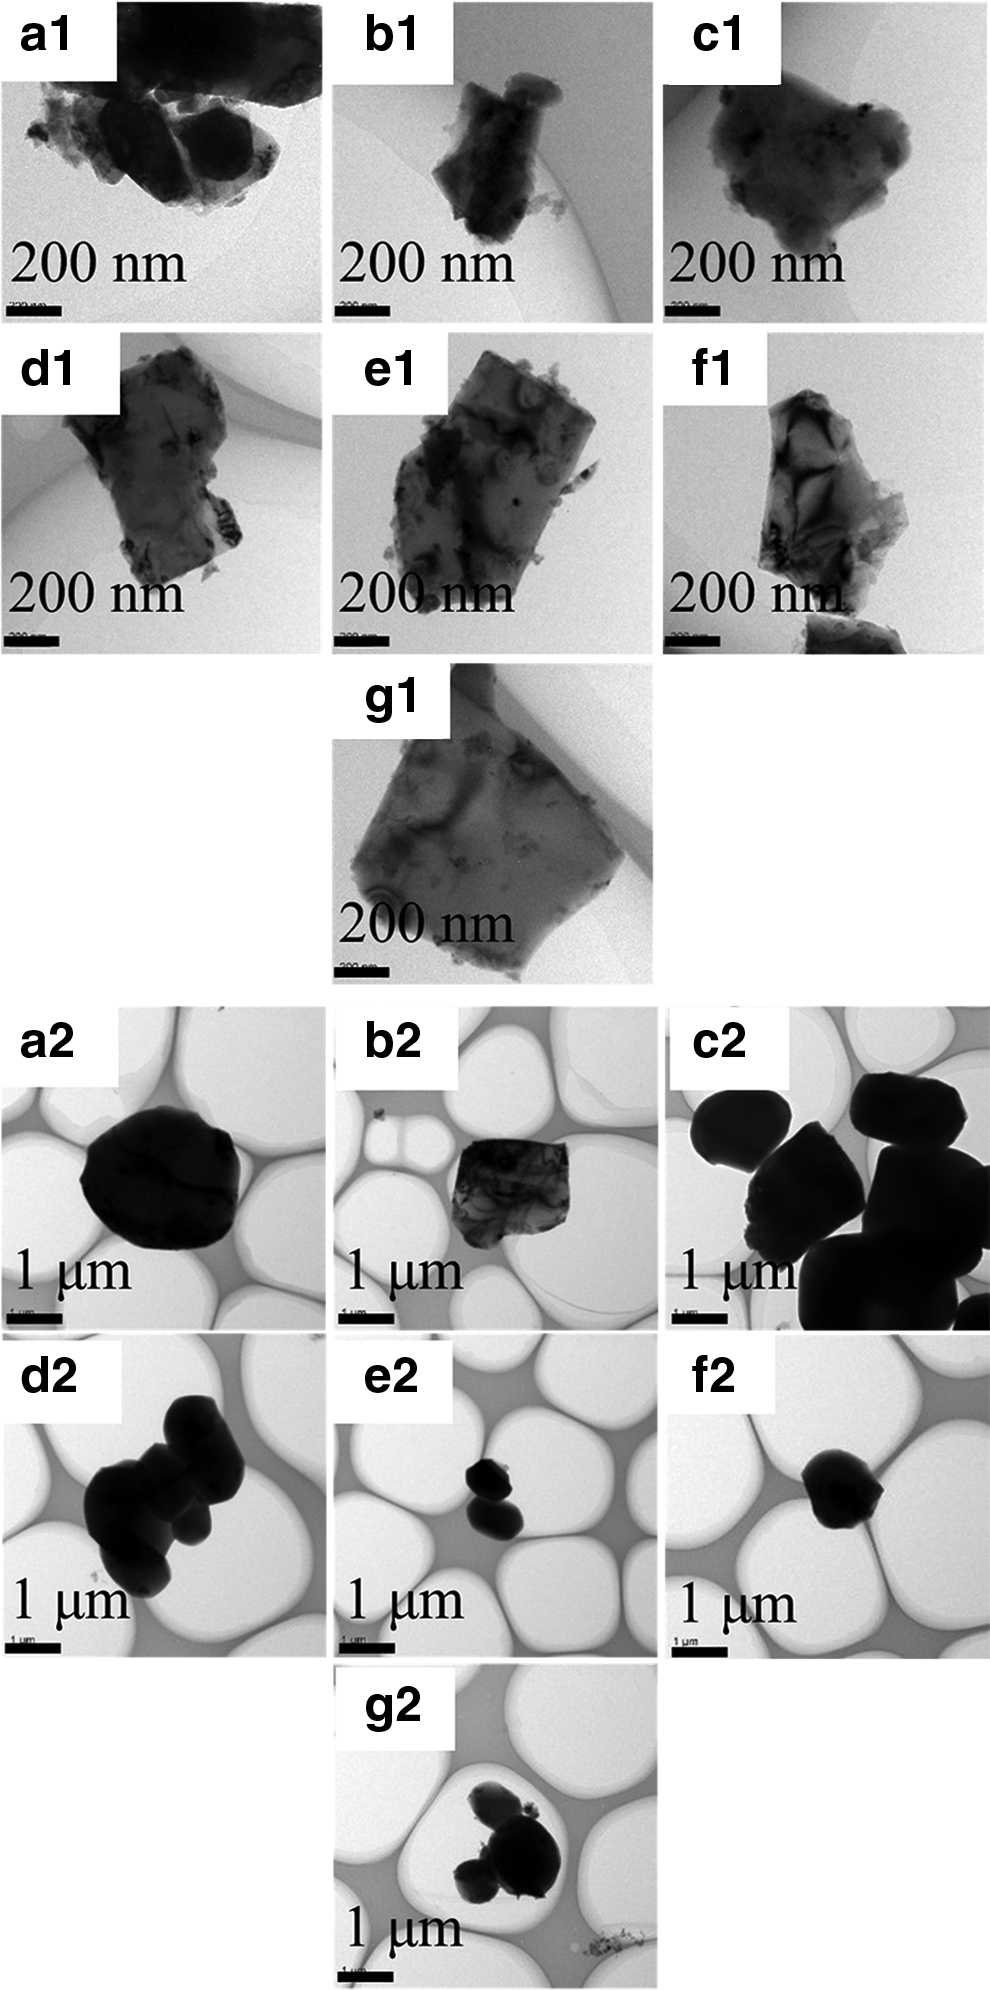
The TEM images of the debinded and sintered samples:
Jolly et al. 33 have explored the nanocrystalline alumina and demonstrated a spherical morphology, with a low degree of agglomeration, of the as-sprayed particles. It is worth mentioning that a low degree of agglomeration has been obtained in the current work, which can be ascribed to the strong interparticle adhesion due to vacuum debinding. Similarly, Yang et al. 34 have presented the microstructural evolution of α-Al2O3 during plasma erosion by using high-resolution TEM observation. Herein, the surface microstructure of the α-Al2O3 has been observed by using TEM images. Moreover, the TEM analysis revealed that the crystallite size decreases with the increase of debinding temperature.
Figure 6 shows the XRD patterns of the sintered samples debinded at different temperatures. The XRD patterns confirm that the as-sintered samples possess a single phase of α-alumina. The diffraction peaks located at 2θ = 25.6°, 35.1°, 37.8°, 41.7°, 43.4°, 46.2°, 52.6°, 57.5°, 59.8°, 61.2°, 66.5°, 68.2°, 70.4°, 74.3°, 77.2°, 80.7°, 84.4°, and 86.4° correspond to the (012), (104), (110), (006), (113), (202), (024), (116), (211), (122), (214), (300), (125), (208), (119), (220), (223), and (312) crystallographic planes of α-alumina, respectively (PDF no. 65–3103). 35 One should note that the debinding is only an intermediate process, whereas the final sintering process determines the final phase composition of the sample. Therefore, the sintered samples did not exhibit any phase difference.

The XRD patterns of the sintered samples. XRD, X-ray diffraction.
González et al. 36 have investigated the dosimetric properties of α-alumina, thermally treated at 1100°C, and observed the presence of rhombohedral crystalline phase, belonging to the hexagonal crystal system of Al2O3. The major diffraction peaks for the rhombohedral crystalline phase are located at 2θ = 25.577°, 35.151°, 37.785°, 43.363°, 52.559°, 57.504°, 66.522°, and 68.209°. The XRD results confirm the hexagonal structure of SL 3D-printed alumina ceramic after sintering at 1500°C. Fontainha et al. 37 have studied phase sensitivity of α-Al2O3. They have obtained the nanosized α-Al2O3 powder and converted it into micron-sized α-Al2O3 crystals. Herein, the debinded temperature did not introduce any new phase composition. López-Juárez et al. 38 have synthesized α-Al2O3, which has exhibited a phase transition from γ-Al2O3 to δ-Al2O3 after being heated to 900°C.
Furthermore, once it was heated to 1000°C, a mixture of δ-Al2O3 and θ-Al2O3 phases has been obtained, which transformed into α-Al2O3 at 1100°C. Herein, the sintering temperature of 1500°C is much higher than 1100°C, which resulted in pure α-Al2O3 phase.
The Raman spectra of the debinded and sintered samples are shown in Figures 7 and 8. The peaks at 417, 577, 644, 746, and 1003 cm−1 indicate the presence of α-Al2O3.39–41 The peaks at 1358 and 1599 cm−1 indicate the presence D- and G-bands, originating from the carbon, respectively.42–44 In Raman spectra, D-band represents the disordered carbon and G-band corresponds to sp2 vibrations of the carbon. The D- and G-bands have been observed after debinding at higher temperatures (400–600°C), which indicates that the decomposition of photosensitive resins resulted in carbon.
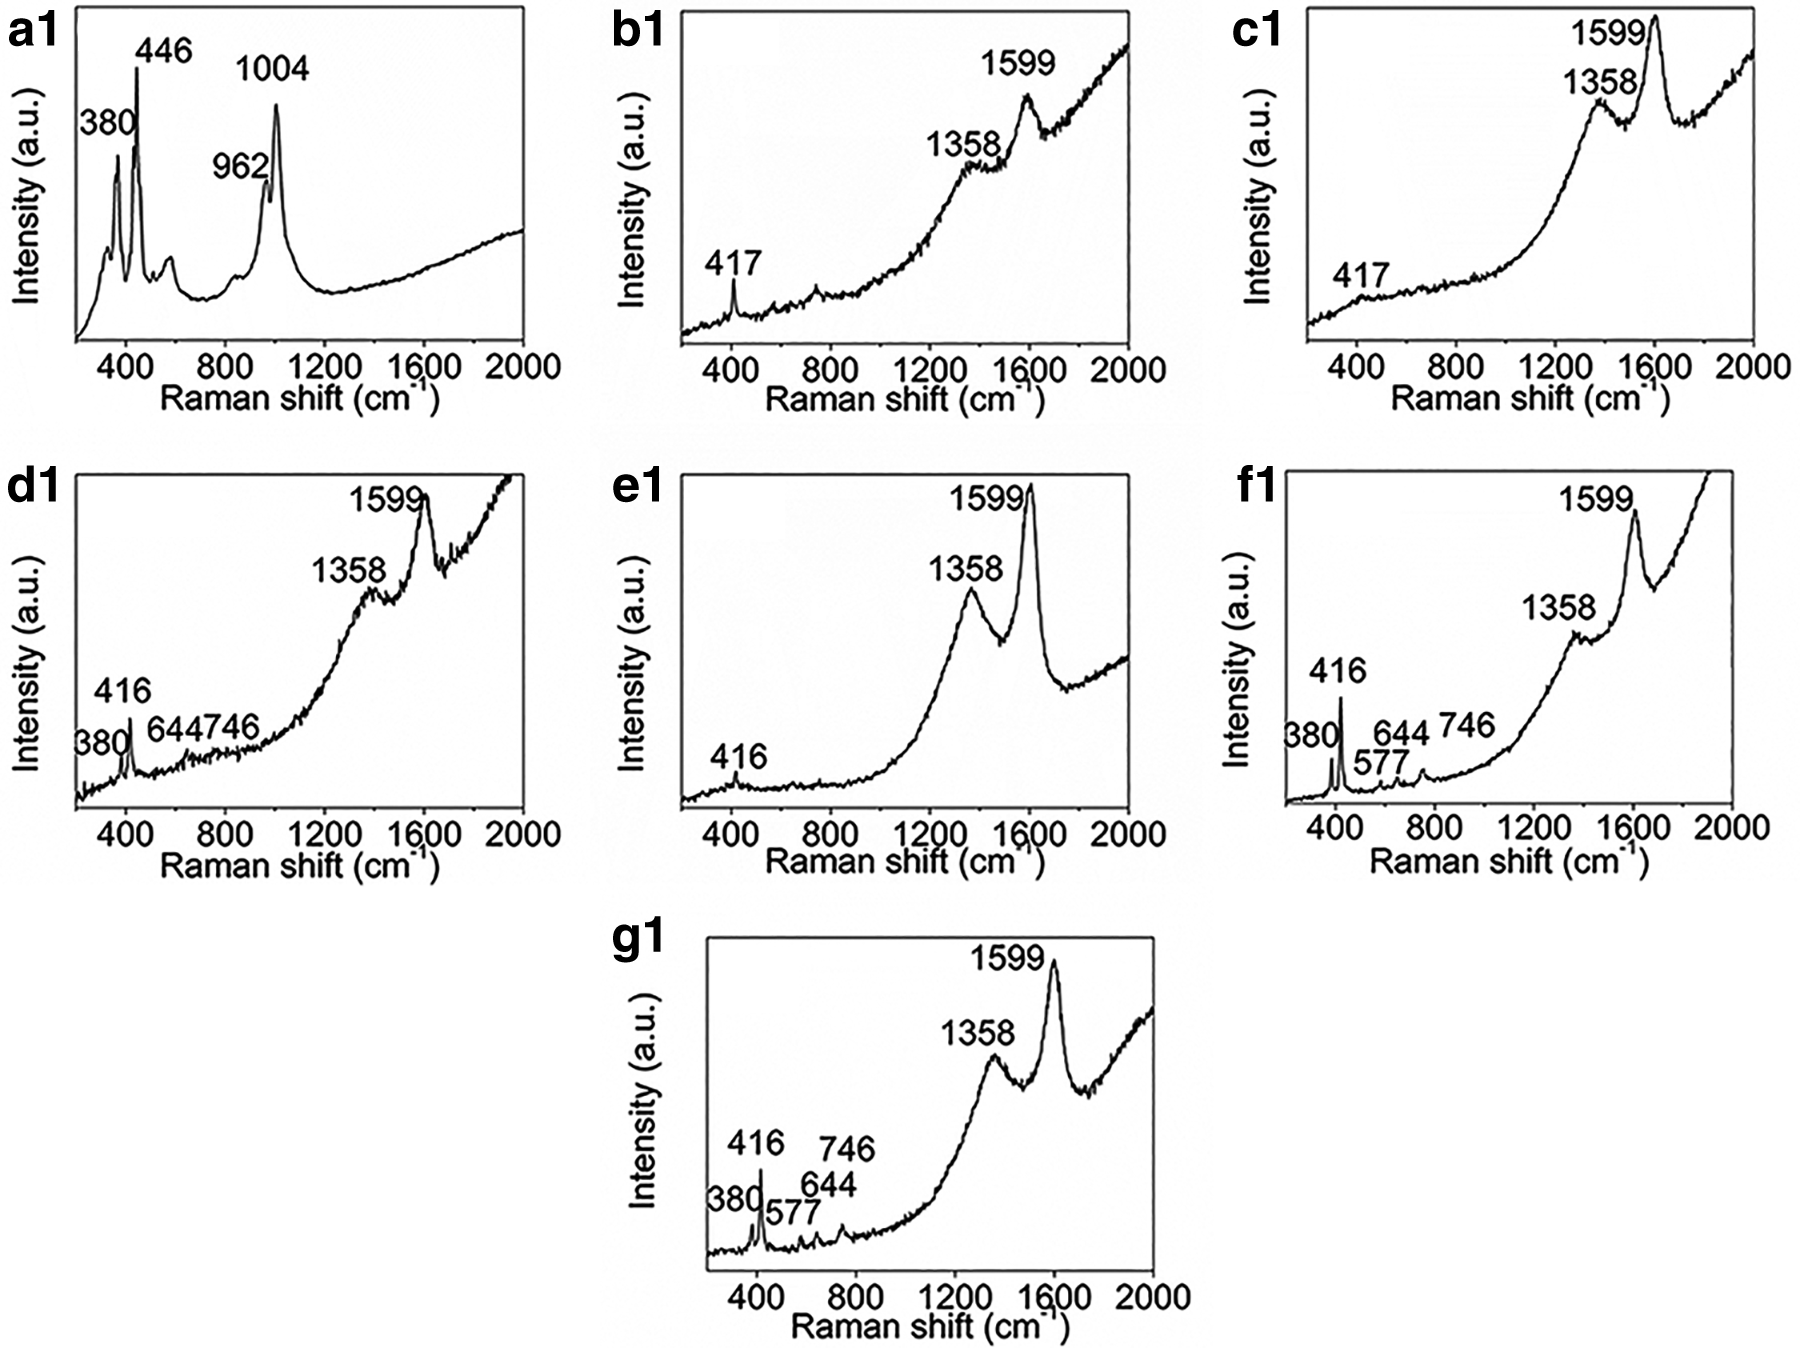
The Raman spectra of the debinded samples:
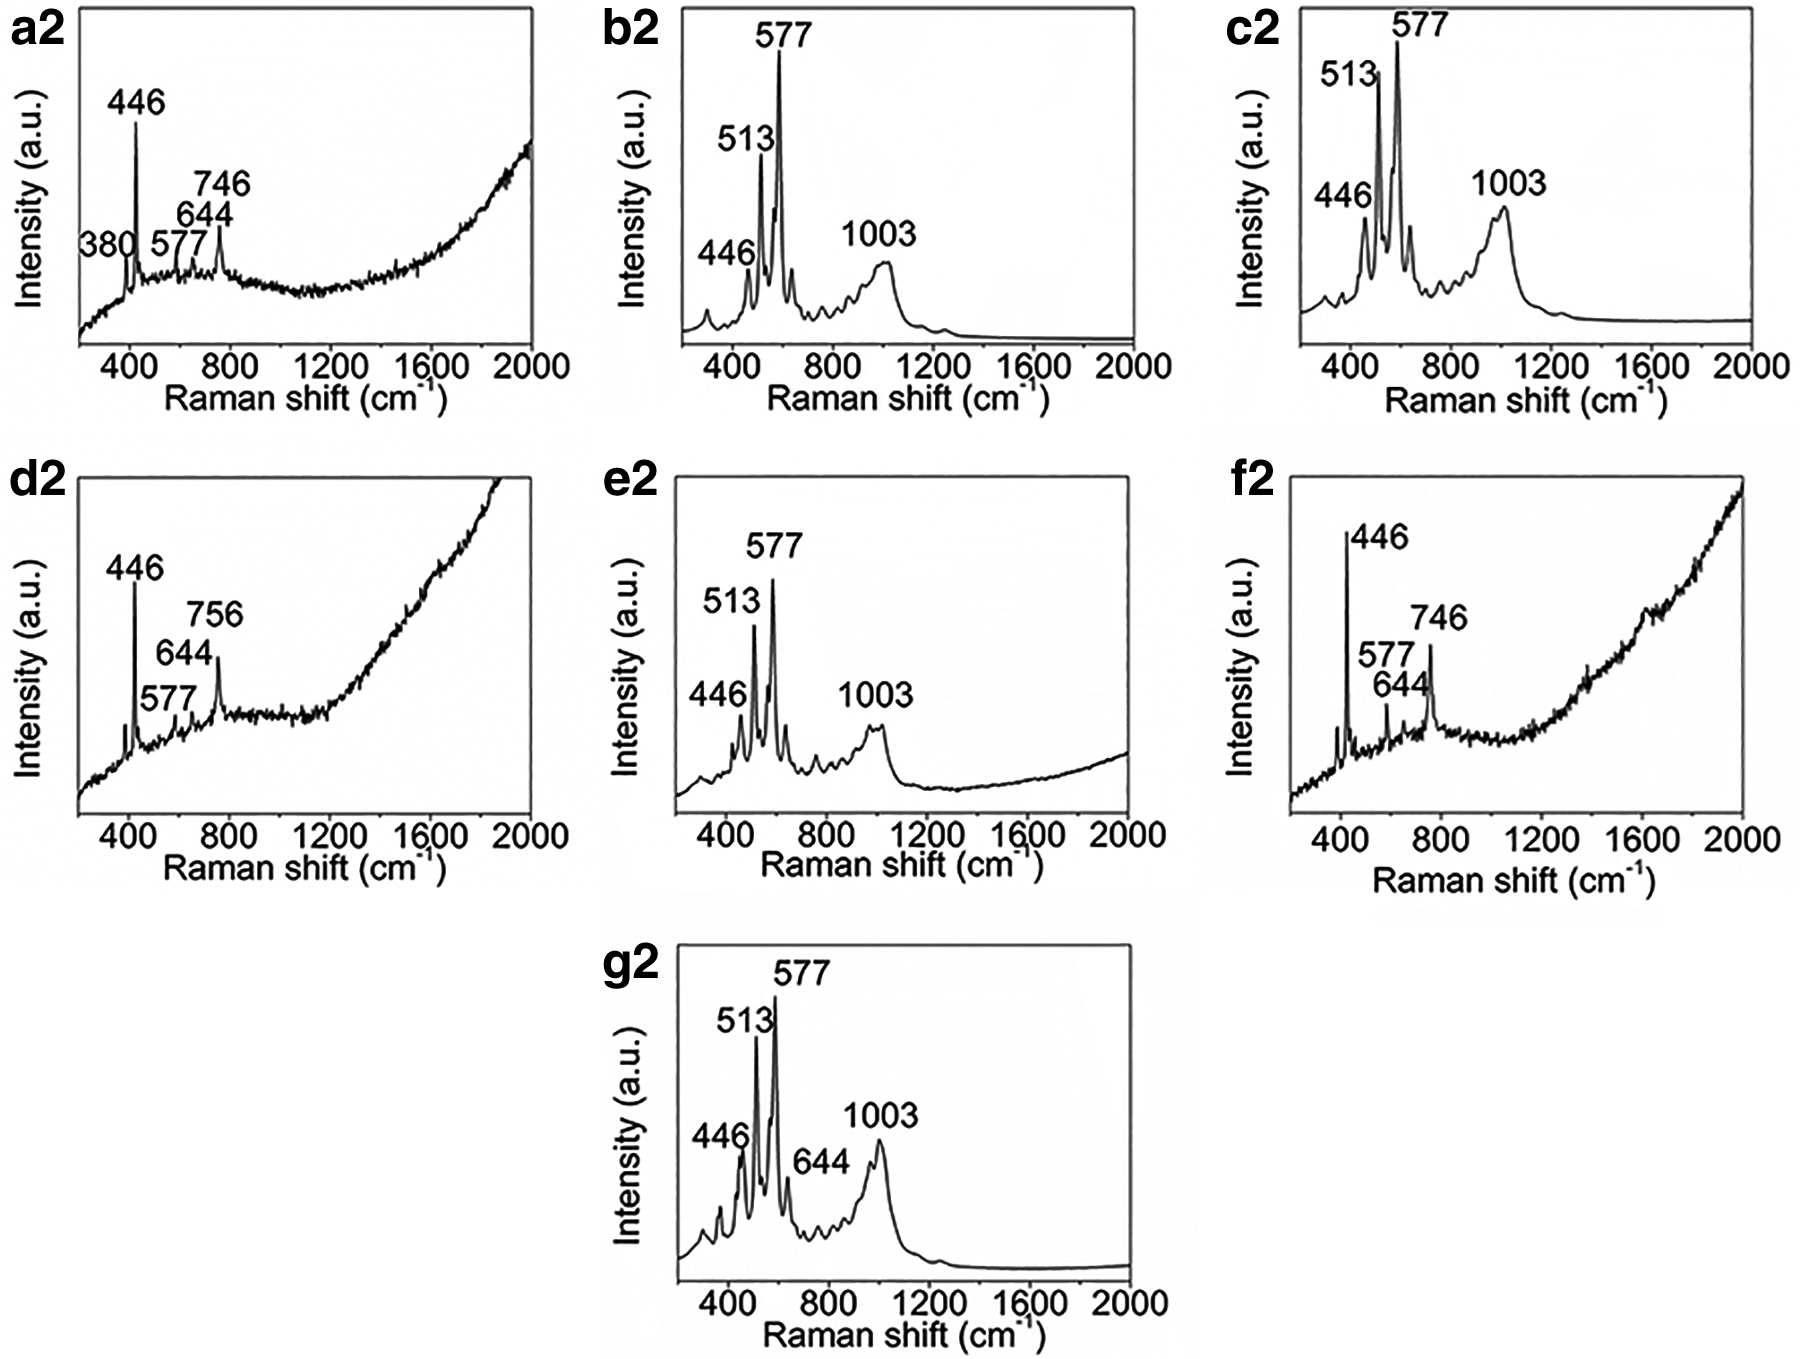
The Raman spectra of the sintered samples:
However, D- and G-bands have not been observed after debinding at a lower temperature (300°C), which can be ascribed to the presence of undecomposed photosensitive resin. Also, the sintering process has removed carbon, which is confirmed by the absence of D- and G-bands in Raman spectra of sintered samples. Gao et al. 45 have synthesized thin films of α-Al2O3 and observed the Raman peaks of α-Al2O3 at 380, 417, and 746 cm−1, which are consistent with our results. Li et al. 46 have investigated the Raman spectra of hierarchical and repetitive superstructures of α-Al2O3 and observed Raman peaks at 381.1, 418.3, 431.3, 442.2, 577.3, 645.2, and 751.5 cm−1, corresponding to α-Al2O3, and 378, 418, 432, 451, 578, 648, and 755 cm−1, representing the single crystal sample.
They have explained that the Raman mode is closer to the α-Al2O3 single crystal, which indicates the quasi-single crystal nature of the micro-conical superstructure. The minor difference in the peak position of the Raman modes between α-Al2O3 micro-cones and single crystal can be ascribed to the disordered vibrations of active phonons, resulting from the native tensile stress of cone-like superstructures. It is worth mentioning that the native tensile stress of superstructures influences the Raman phonon vibration, which has also been observed in other super- and nanostructured materials.
Mechanical characterization
The flexural strength of the sintered samples, debinded at different temperatures, is presented in Figure 9. The error bars mean the deviation of multiple test results from the mean value and 95% confidence intervals on the mean. The mean value of the shrinkage and the standard deviation were calculated by using the following equations:
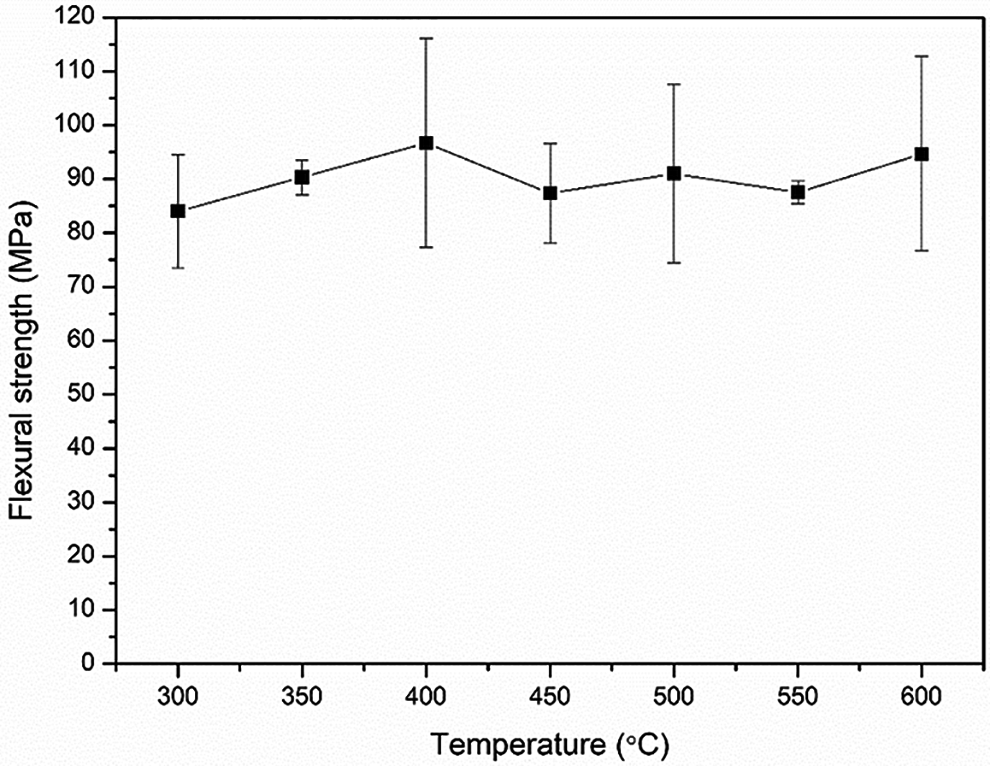
The flexural strength of the sintered samples after debinding at different temperatures.
where
At the debinding temperature of 300°C and 600°C, the flexural strength ranged from 84 to 97 MPa, respectively. Even though the debinding temperature is different, the difference in flexural strength of the sintered samples is very small, which indicates that the debinding temperature did not exhibit any significant influence on the flexural strength. Despite the small difference, some fluctuations still exist in the flexural strength of sintered samples. The minimum flexural strength of 84 MPa has been achieved after debinding at 300°C. It has been observed from TGA analysis that ∼10% of photosensitive organic resin still exists in the sample after debinding at 300°C (Fig. 2). Hence, the debinding temperature of 300°C is not sufficient to carry our vacuum debinding of ceramics.
Even though the debinding temperature of 300°C exhibits minimum shrinkage in the x-, y-, and z-directions, it is not an optimal debinding temperature due to the presence of undecomposed photosensitive resin, which has also been confirmed by the SEM analysis. Furthermore, the TEM analysis revealed the poor crystallinity of debinded samples. These results show that the low debinding temperature of 300°C is not advantageous in terms of physical properties, microstructure, and mechanical properties of SL 3D-printed alumina ceramics. Xuefei et al. 47 have aimed to toughen the Al2O3-based ceramic by adding SiC whiskers and nanoparticles and demonstrated a flexural strength of 730 MPa, which is much higher than the currently prepared material due to the differences in composition and processing parameters.
Xuefei et al. have utilized a sample, consisting of 74% Al2O3, 20% SiCw, 5% SiCnp, and 1% others, and sintered at 1700°C under a sintering pressure of 32 MPa. Hence, the extremely high strength can be ascribed to the high-temperature and high-pressure sintering. Herein, the SL 3D-printed alumina ceramics experienced pressure-less sintering at 1500°C, which resulted in an inferior flexural strength. Misirli et al. 48 have studied the Al2O3 and obtained the flexural strength of 213, 336, and 330 MPa after pressure-less sintering at 1450°C, 1550°C, and 1650°C, respectively. It is worth noting that the presence of photosensitive resin and its removal during the debinding process resulted in a porous structure, which led to inferior flexural strength of the SL 3D-printed alumina ceramics.
For instance, Misirli et al. have reported the open porosity of 1.47%, 0.9%, and 0.01% after sintering at 1450°C, 1550°C, and 1650°C, respectively, whereas the open porosity of SL 3D-printed alumina ceramics ranged from 21.2% to 27.6% after sintering at 1500°C. These results indicate that there is a close relationship between the open porosity and flexural strength, that is, the higher open porosity leads to lower flexural strength, which is consistent with the Ryskewitsch empirical formula. 49
Conclusions
The debinding process of the green body has become a major obstacle in the development of SL 3D printing technology. The formation of cracks and holes, leading to the inferior strength of the as-prepared ceramic components, usually occurs during the debinding process. Herein, we have systematically studied the influence of debinding temperature on the microstructure, physical properties, and mechanical behavior of vacuum-debinded alumina ceramics.
The TGA revealed that there is no significant weight loss after debinding at >400°C. Moreover, the crystallite size of the sintered alumina decreased with increasing debinding temperature. The microstructure of the sintered and debinded samples is significantly different in microstructure, and obvious changes in elemental composition have been observed after debinding and sintering. In conclusion, based on the physical properties, mechanical behavior, and processing requirements, the optimal vacuum debinding temperature ranges from 400°C to 500°C.
Footnotes
Author Disclosure Statement
No competing financial interests exist.
Funding Information
Funding from the National Key Research and Development Program of China (no. 2018YFB1106600), the Chinese National Foundation for Natural Sciences under contracts (no. 51672217), and the Research Fund of the State Key Laboratory of Solidification Processing (grant no.120-TZ-2015).