
Abstract
To avoid the problem of weak connections between panel sheets and core layers of lattice structures obtained by the traditional fabricating method, lattice structures of polylactic acid were integrally manufactured by fused deposition modeling of 3D printing technology in the present study. An orthogonal test was designed to evaluate the influence of the core distance, core diameter, and core length of lattice structures on their compression and energy absorption properties. Theoretical analysis and the finite element method were conducted to predict compression properties of lattice structures. The optimum specification of the lattice structure in this article with regard to specific strength was as follows: core distance 18 mm, core diameter 12 mm, and core length 20 mm. The lattice structure has good specific strength and specific energy absorption and can be comparable with an aluminum lattice. The failure mode of the lattice structure was determined to be crushing of the core, and no damage to the joint between the core and face sheet was observed.
Introduction
Sandwich structures consisting of high-strength thin panels and lightweight cores are widely used in the aerospace industry and medical fields due to their excellent properties, including low weight, high strength, and good energy absorption.1–3 Recently, lattice structures have been found to have higher specific strength and energy absorption characteristics.4,5 Lattice structures consist of upper and lower panels and a periodic arrangement of rod elements. 6 Lattice structures include the isogrid, 7 isotruss,8,9 tetrahedral, 10 Kagome,11,12 and other types. Li et al. 13 used hot pressing technology to prepare a carbon fiber pyramidal lattice structure, which was then subjected to a lateral compression test. Jin et al. 14 used wooden composite materials and birch dowels to prepare a diagonal column lattice structure that they used for out-of-plane compression, and results showed that the failure mode involved shear failure of the panel and core. Sun and Gao 15 used hot pressing technology to perform a surface compression experiment on a modified pyramidal lattice structure and found that the lattice structure had two failure modes: failure of the support and node fracture. Totaro 16 researched the formulation for anisogrid lattice panels and approached minimum mass solutions. Sorrentino et al. 17 manufactured an isogrid cylinder by robotic filament winding technology and its resistance to axial compression load is good. Ling et al. 18 used stereolithography 3D printing technology to create the lattice structure and found that the relative density and intrinsic material properties determine mechanical properties of the lattice structure. Liu et al. 19 used the free-hanging, 3D printing method to manufacture the carbon fiber reinforced plastic (CFRP) lattice structure, and the result demonstrated that free-hanging printed samples can be comparable with the CFRP lattice structure in specific compressive strength.
The energy absorption characteristics of lattice structures are attracting increasing attention. Zhang et al. 20 applied polyurethane foam to fill a pyramidal lattice structure to improve its energy absorption properties. The test result showed that the lattice structure filled with polyurethane foam had higher energy absorption efficiency when the strain was high. Jiang et al. 21 investigated the energy absorption of typical lattice structures and established an analytical model to predict the energy absorption of these structures. Yazdani et al. 22 used fused deposition modeling (FDM) to print sandwich panels and found that the sandwich panel had high energy absorption capacity.
In this article, a straight column lattice structure is examined. An orthogonal experiment was designed to examine the influence of the length, distance, and diameter of the core. The specific strength of the optimum configuration was obtained using the orthogonal test. The compression performance and energy absorption property of the lattice structure were analyzed.
Materials and Methods
Material
Polylactic acid (PLA; 1.75 mm diameter) was purchased from Zero print (Shenzhen) Industrial Development Company. Its density is 1.149 g/cm3. PLA is a biodegradable and biomedical material. It has good mechanical properties and broad application prospects especially in the biomedicine field and has already had a very mature application in 3D printing, 23 so PLA was selected as the material of lattice structure.
Design of the straight column lattice structure
The straight column lattice structure comprised upper and lower panels (40 × 40 × 3 mm) and four straight column cores. An orthogonal test was designed and applied to explore the influence on core distance, diameter, and length on the compression and energy absorption properties of the straight column lattice structure. The orthogonal test table for the lattice structure is shown in Table 1. There are nine groups in the table.
Orthogonal Test and Specific Strength of the Lattice Structure
Preparation of the straight column lattice structure
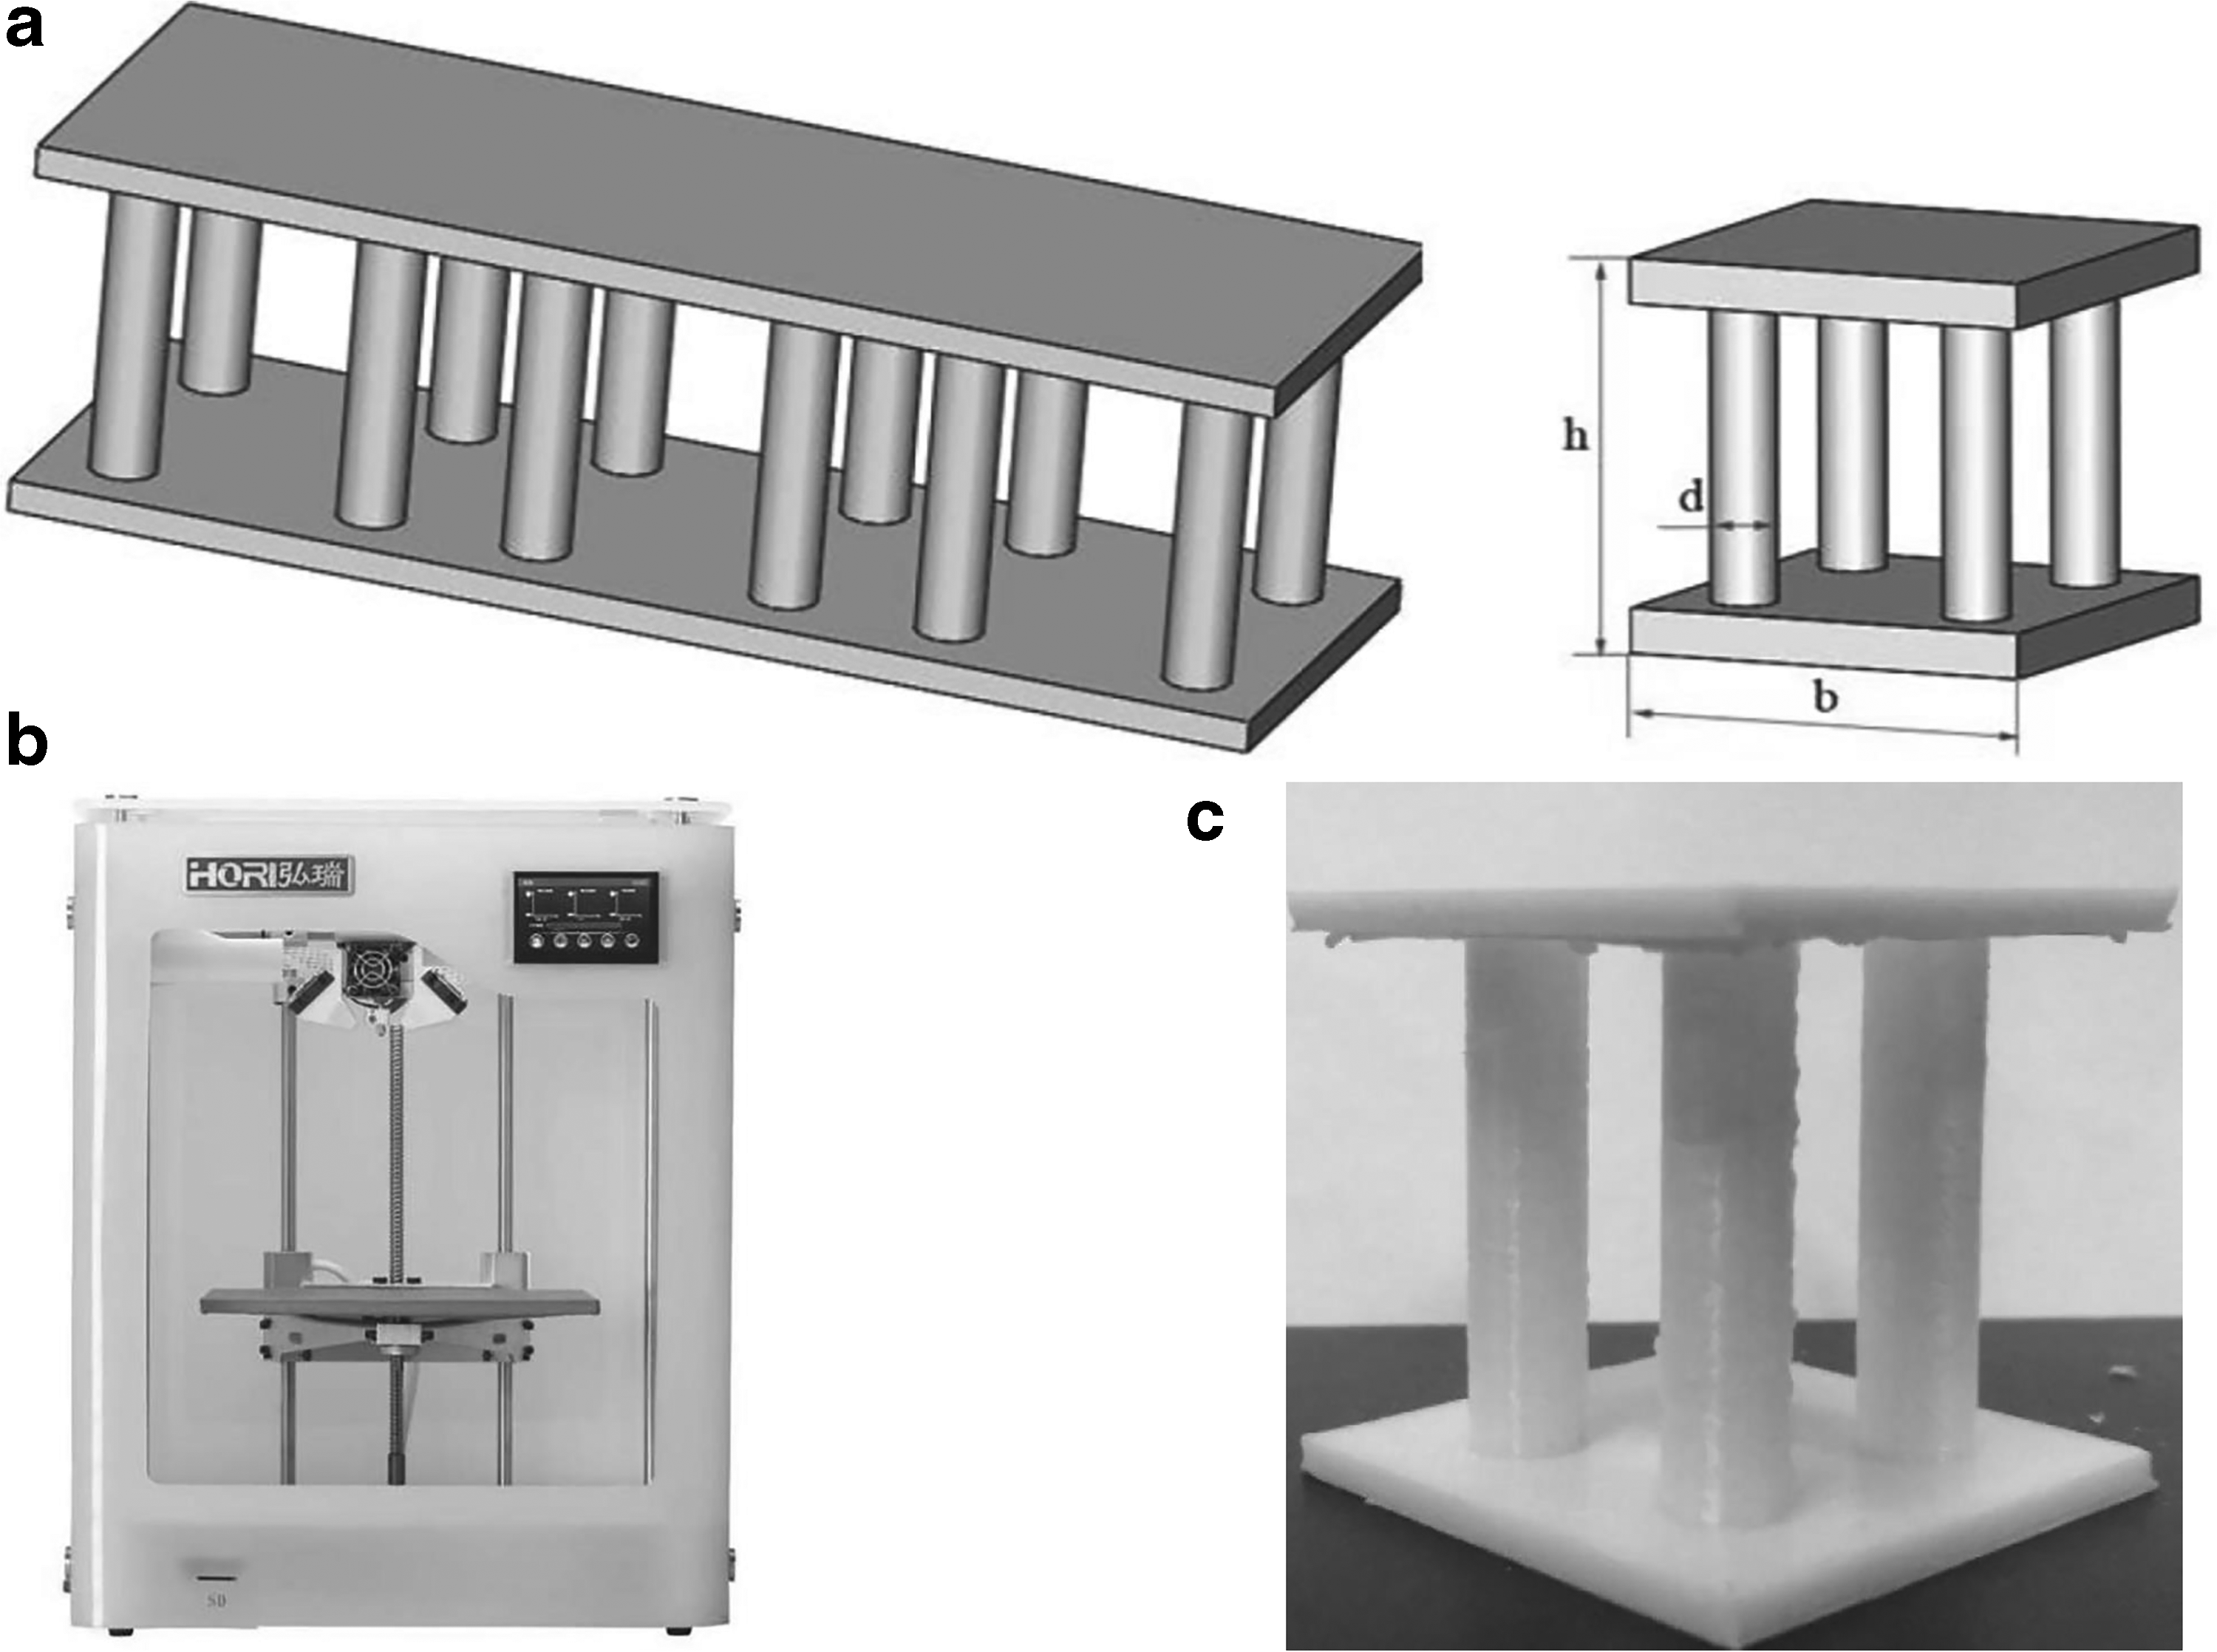
The model was designed using 3D software, SolidWorks2014, and then exported to the 3D printer using Cura slicing software. The H1 model 3D printer was used, as shown in Figure 1. The printing temperature was 200°C; printing speed was 60 mm/s; filling pattern was a straight line; and layer thickness was 0.2 mm.
Method of performance detection and analysis
The lattice structure compression test was performed on a universal mechanical testing machine according to the ASTM C365 standard. The loading speed was 2 mm/min. Experiments were conducted in nine groups with five specimens in each group. The cylindrical core of lattice structures was compressed according to ASTM D695-2010. The loading speed was 2 mm/min, and each group included five compression specimens.
Results and Discussion
Relative density of the lattice structure
The designed and 3D printed lattice structure is shown in Figure 1. The side length of the square panel is indicated by b; face sheet thickness is indicated by t; core distance is indicated by s; lattice structure height is indicated by h; and core diameter is indicated by d. The relative density of the lattice structure was calculated using Equation (1) and depended on the diameter of the core and length of the panel.
Because the length of the side is fixed, the relative density was determined only by the core diameter. The relative density of the lattice structure can be seen in Table 1.
Lattice structure compression test results
The compression test was conducted and corresponding compressive stress–strain curves are depicted in Figure 2, which shows that the curves can be divided into three categories according to the maximum load: C, F, and I; A, D, and G; and B, E, and H. The core diameters of the three types are different, indicating that the diameter of the core has the greatest influence on the strength of the lattice structure. Only two phases are present in curves C, G, and I; in these curves, the stress at the beginning increases rapidly with the strain and the stress decreases rapidly after reaching the maximum load. Curves A, B, D, E, F, and H have three stages. The first stage is the elastic phase, in which the stress increases rapidly with increasing strain. The curves then enter the second stage—plateau stage—after the maximum load is applied. Finally, the curves enter the third stage—densification stage—where the stress increases rapidly with increasing strain.

The diameter-to-length ratio of the lattice structure from group A to group I (Table 1) is shown in Figure 3. The diameter-to-length ratios of curves C, G, and I are 0.2, 0.25, and 0.267, respectively. The curves do not exhibit plateau and densification stages. Curves A, B, D, E, F, and H exhibit diameter-to-length ratios of 0.5, 0.4, 0.333, 0.3, 0.4, and 0.6, respectively. After the compression load reaches the maximum level, the plateau stage is reached, after which the densification phenomenon occurs. The above findings show whether the plateau phase and densification of the lattice structure occur and are related to the diameter-to-length ratio. Because the diameter-to-length ratio of the core is big, it means the core is strong. The core can be difficult to be bent, and it can be more likely that the plateau phase and densification occur. In this experiment, the plateau stage and densification occurred when the diameter-to-length ratio was >0.3 for curves A, B, D, E, F, and H. Curves D and E can be divided into groups according to the characteristics of the curve at the plateau and densification stages. Curves A, B, F, and H can be assigned to one group. Figure 2 indicates that the increasing strain and decreasing stress observed for curves D and E are higher than those for the other set of curves before entering the densification stage, which occurs because the diameter-to-length ratios of the lattice structure corresponding to curves D and E (0.333 and 0.3, respectively) are smaller than diameter-to-length ratios of the remaining groups (minimum 0.4). It is apparent that a larger diameter-to-length ratio results in rapid occurrence of the densification stage and a smaller decrease in stress at the plateau stage.
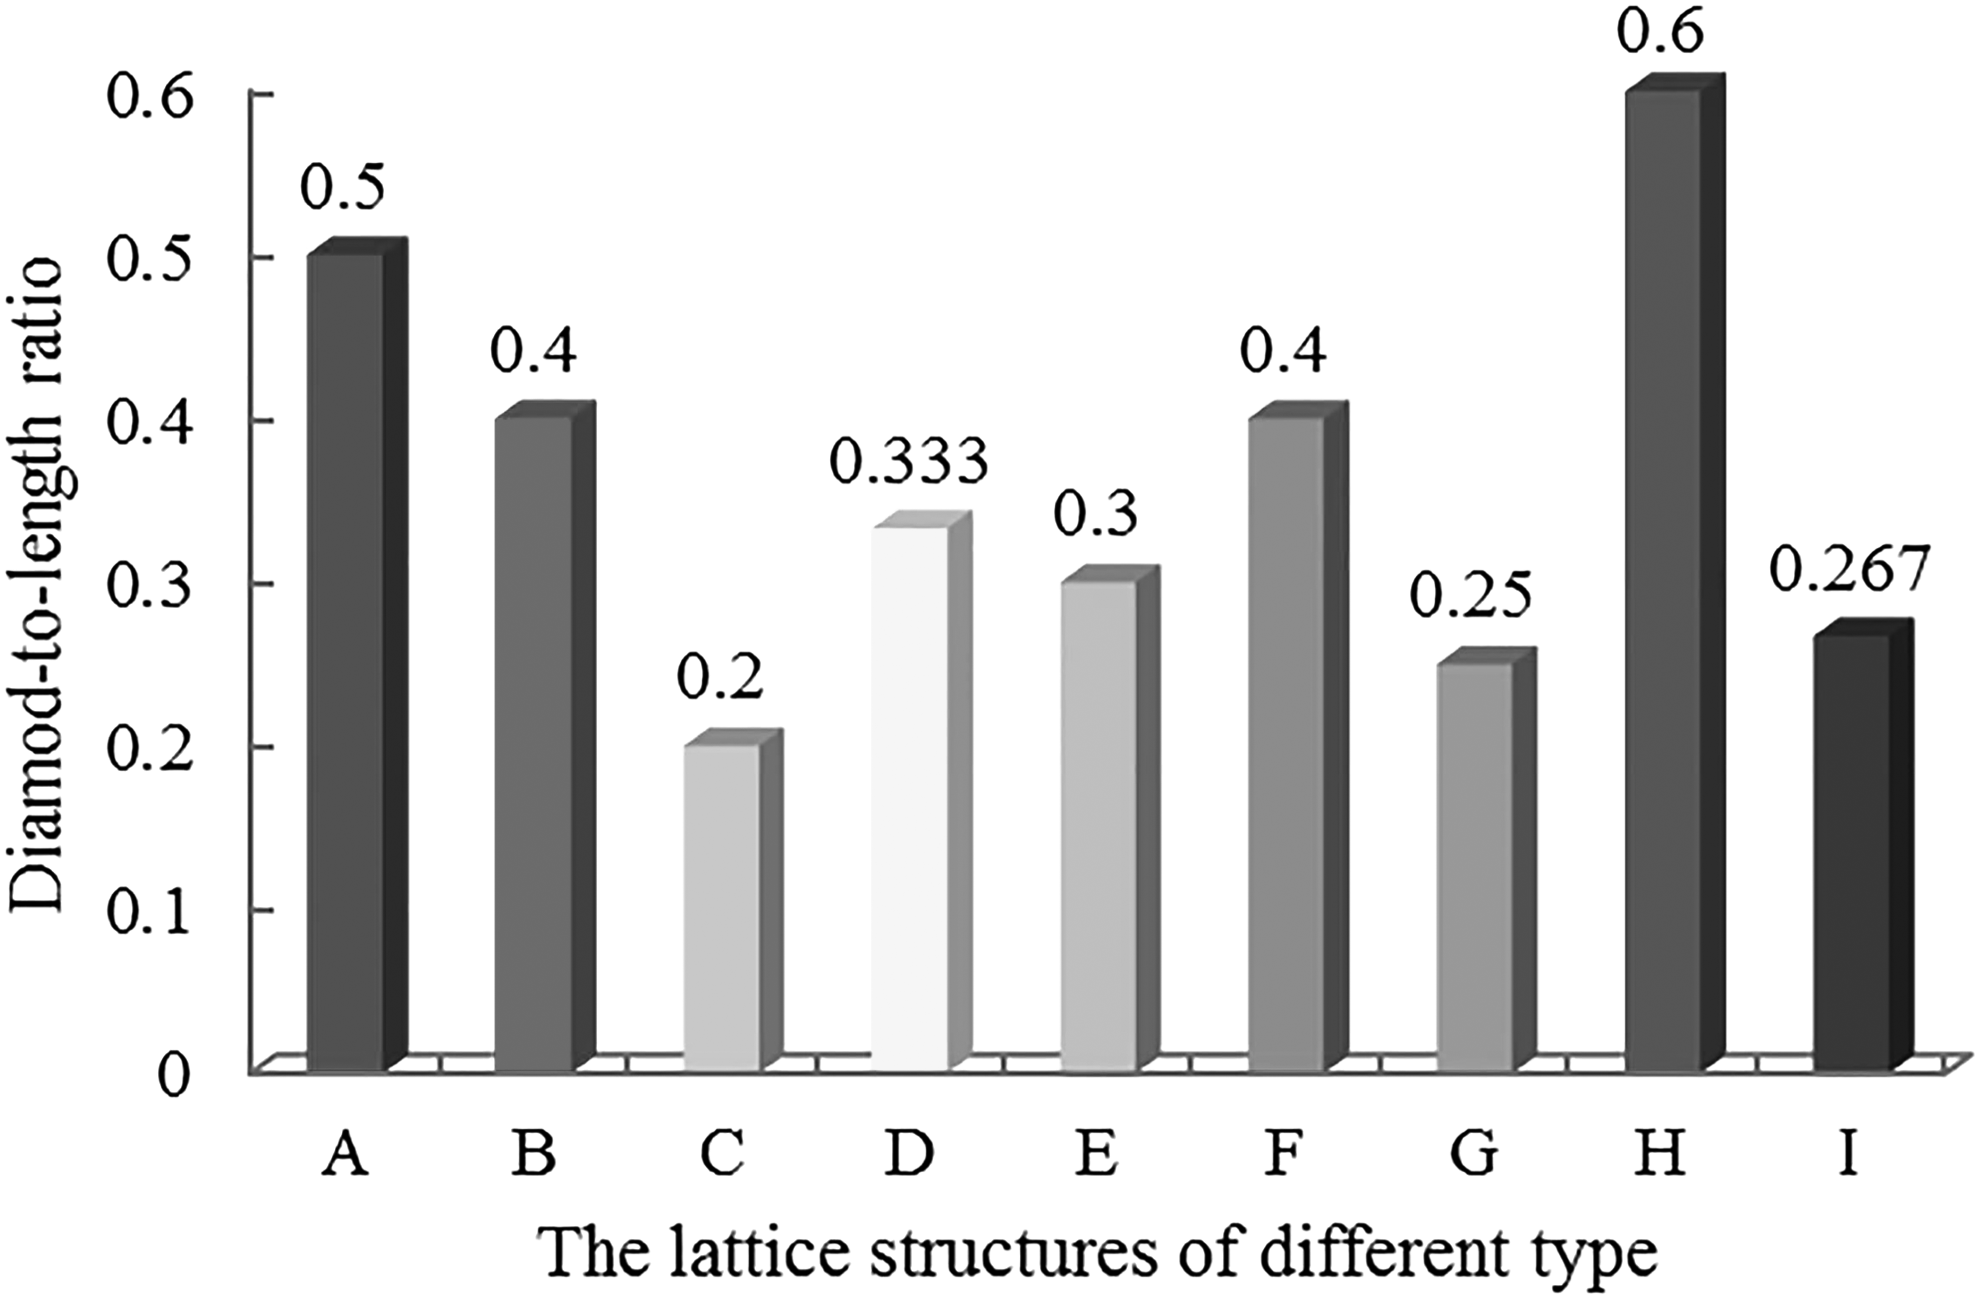
The diameter-to-length ratios of typical 3D printed lattice structures.
As shown in Figure 4a, three stress–strain curves of lattice structures are simplified. According to the difference of the next stage of the elastic phase, the lattice structure can be divided into three types: postflexural fracture, postbuckling, and postswelling. A, B, F, and H lattice structures are postswelling; D and E lattice structures are postbuckling; C, G, and I lattice structures are postflexural fracture. The deformation map of the lattice structure is shown in Figure 4b–j. The figure shows two types of deformation: a bent core and a drum-type core. For the same displacement, when the diameter-to-length ratio is <0.4, the core is more prone to bending. When the diameter-to-length ratio is smaller, the bend is more severe. When the diameter-to-length ratio is ≥0.4, the cores tend to exhibit the drum type of deformation.
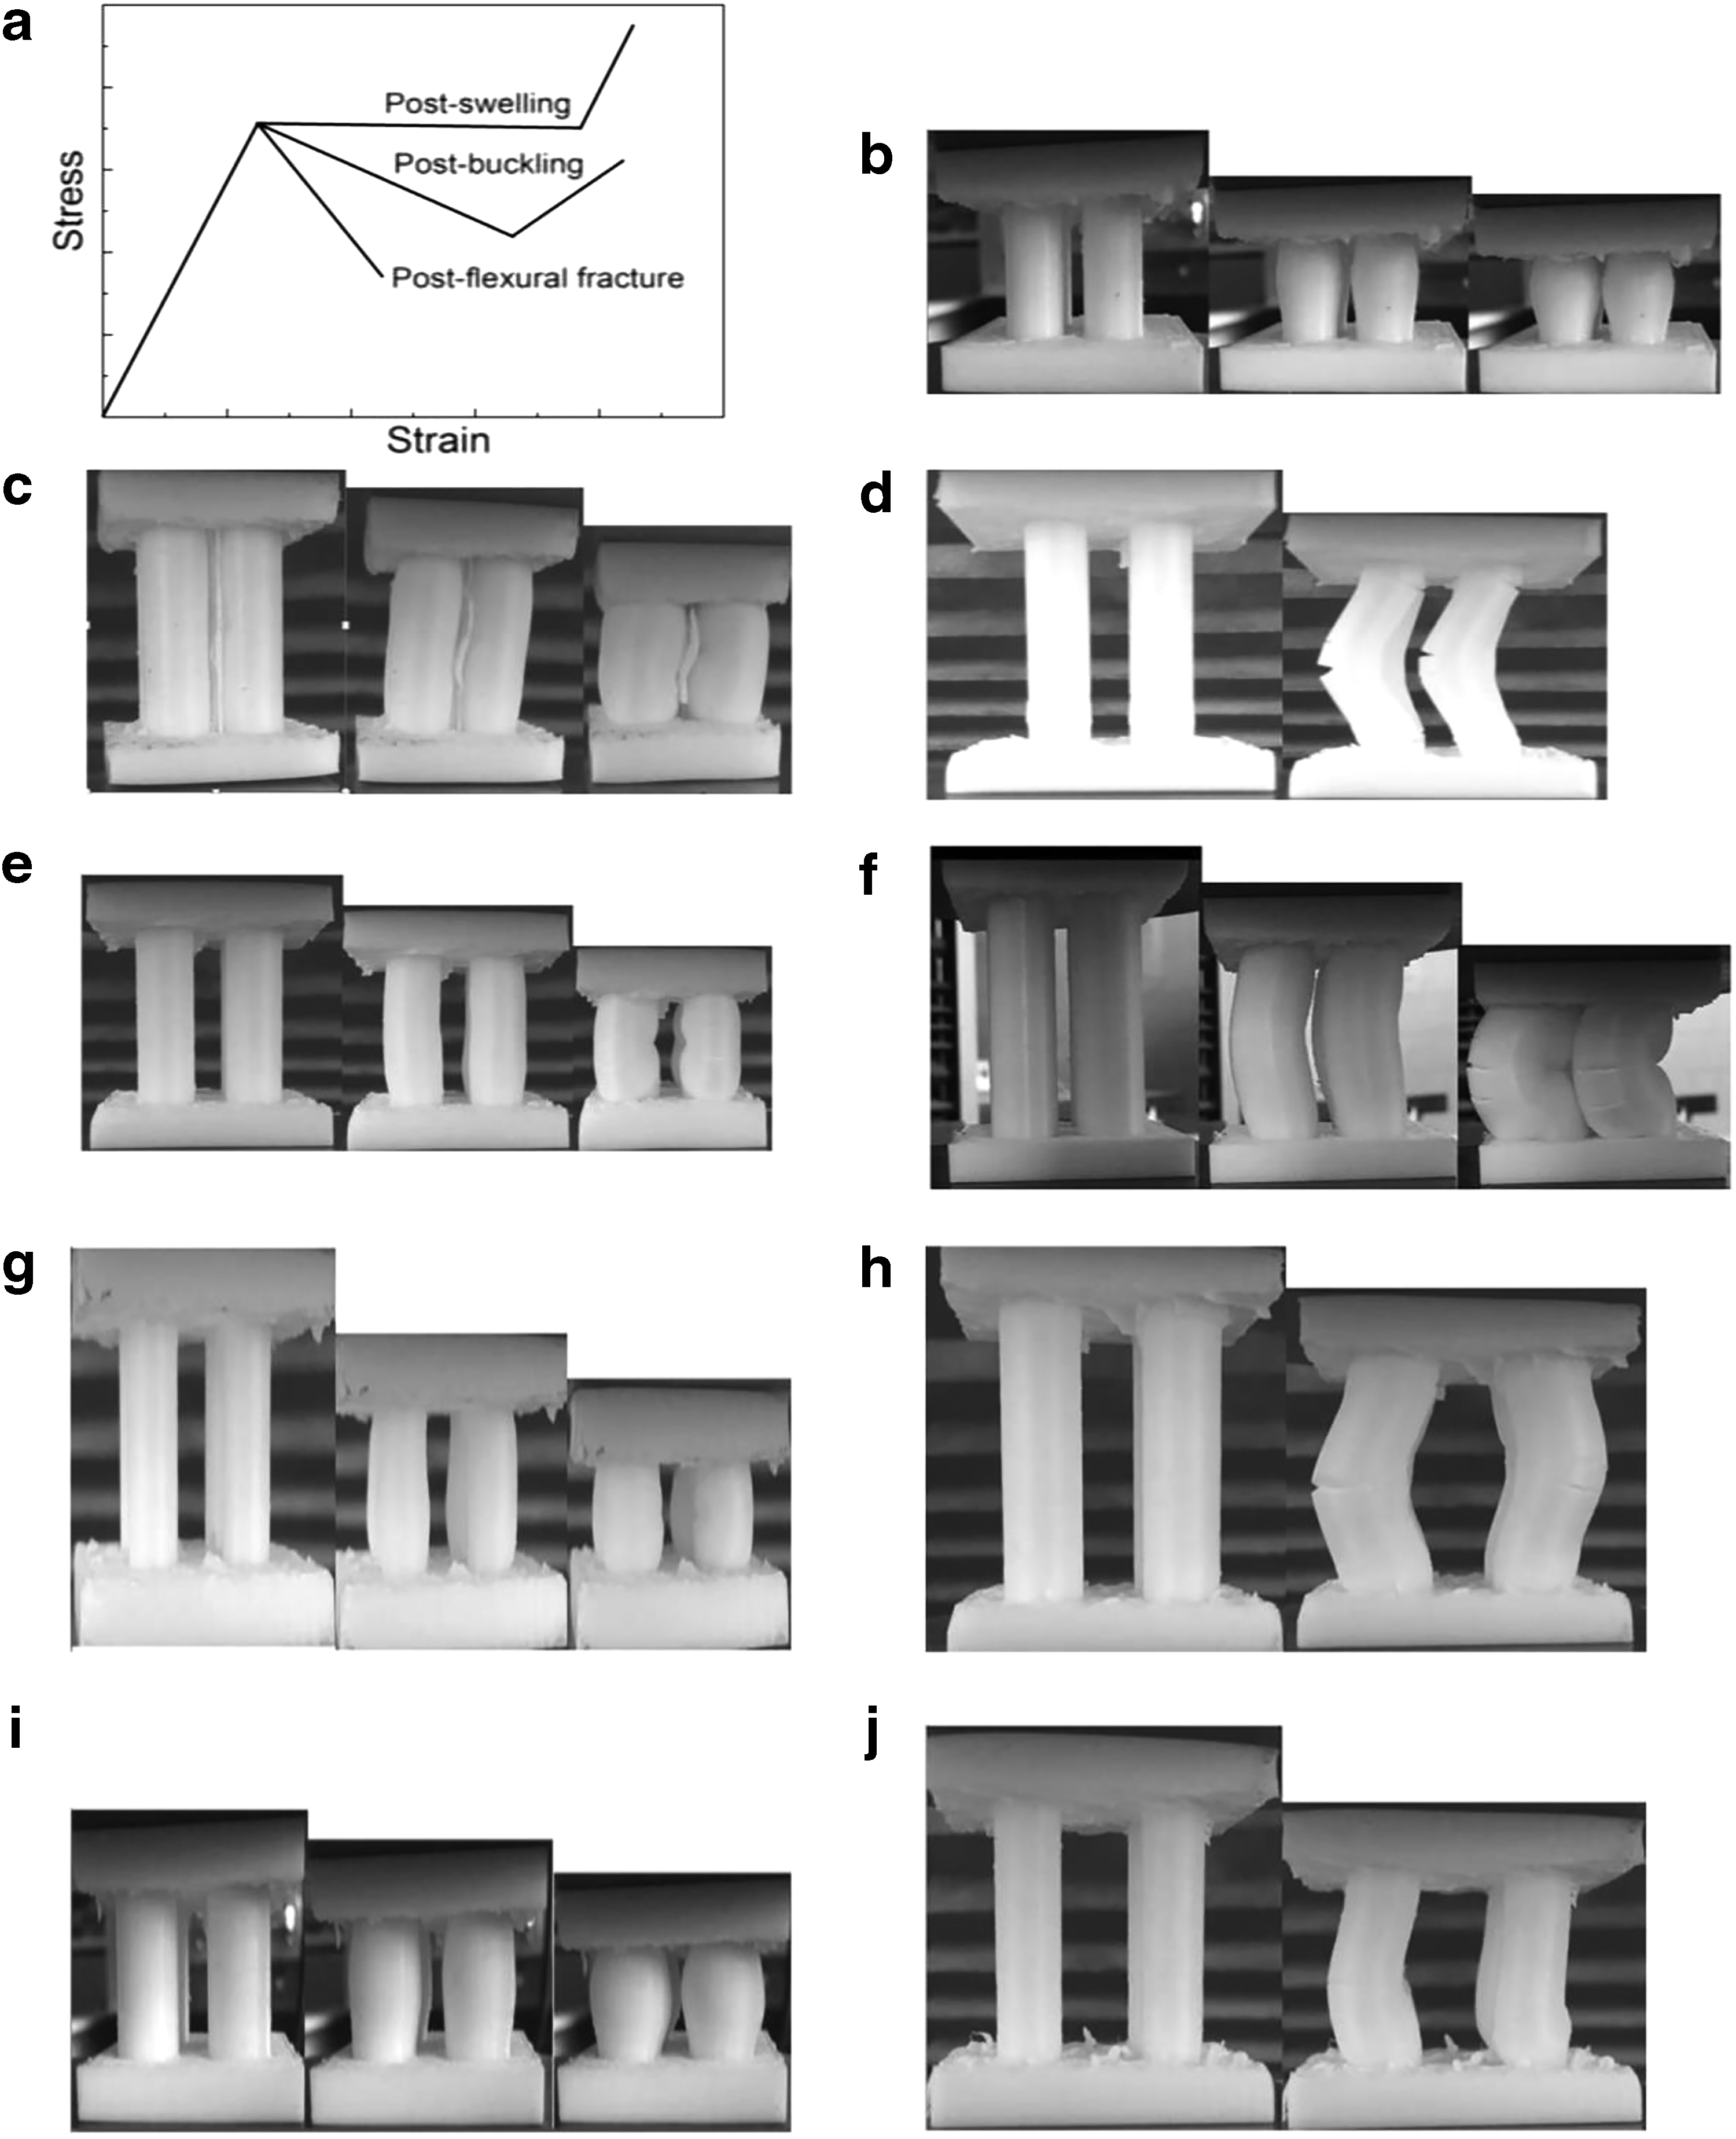
Table 2 shows the strength of each test specimen of the 3D printed lattice structure and its standard deviation. As can be seen from Table 2, the maximum standard deviation of strength is 0.794, which is within an acceptable range. It indicates that the mechanical property of the lattice structure prepared by the 3D printing technology has good uniformity.
Average Value and Standard Deviation of Lattice Structure Strength
Finite element method model
To verify the compression failure mechanism of lattice structures, the finite element method (FEM) was applied based on the ABAQUS/Standard. Young's modulus, Poisson's ratio, and yield stress of 1150 MPa, 0.3, and 64.1 MPa, respectively, were used for the panel and core material. Solid element C3D4 was used to simulate the lattice structure. The compression process can be seen as a quasi-static process. The mesh sensitivity analysis was performed. The mesh size was divided into 1, 2, and 3. When the mesh size is 2, simulation results were close to the actual (Supplementary Table S1; Supplementary Fig. S1). The simulated failure mechanisms of lattice structures are shown in Figure 5. The simulated failure mechanisms of lattice structures are similar to that of the actual, respectively, and also can be divided into two deformation types: the drum-type core and bent core.
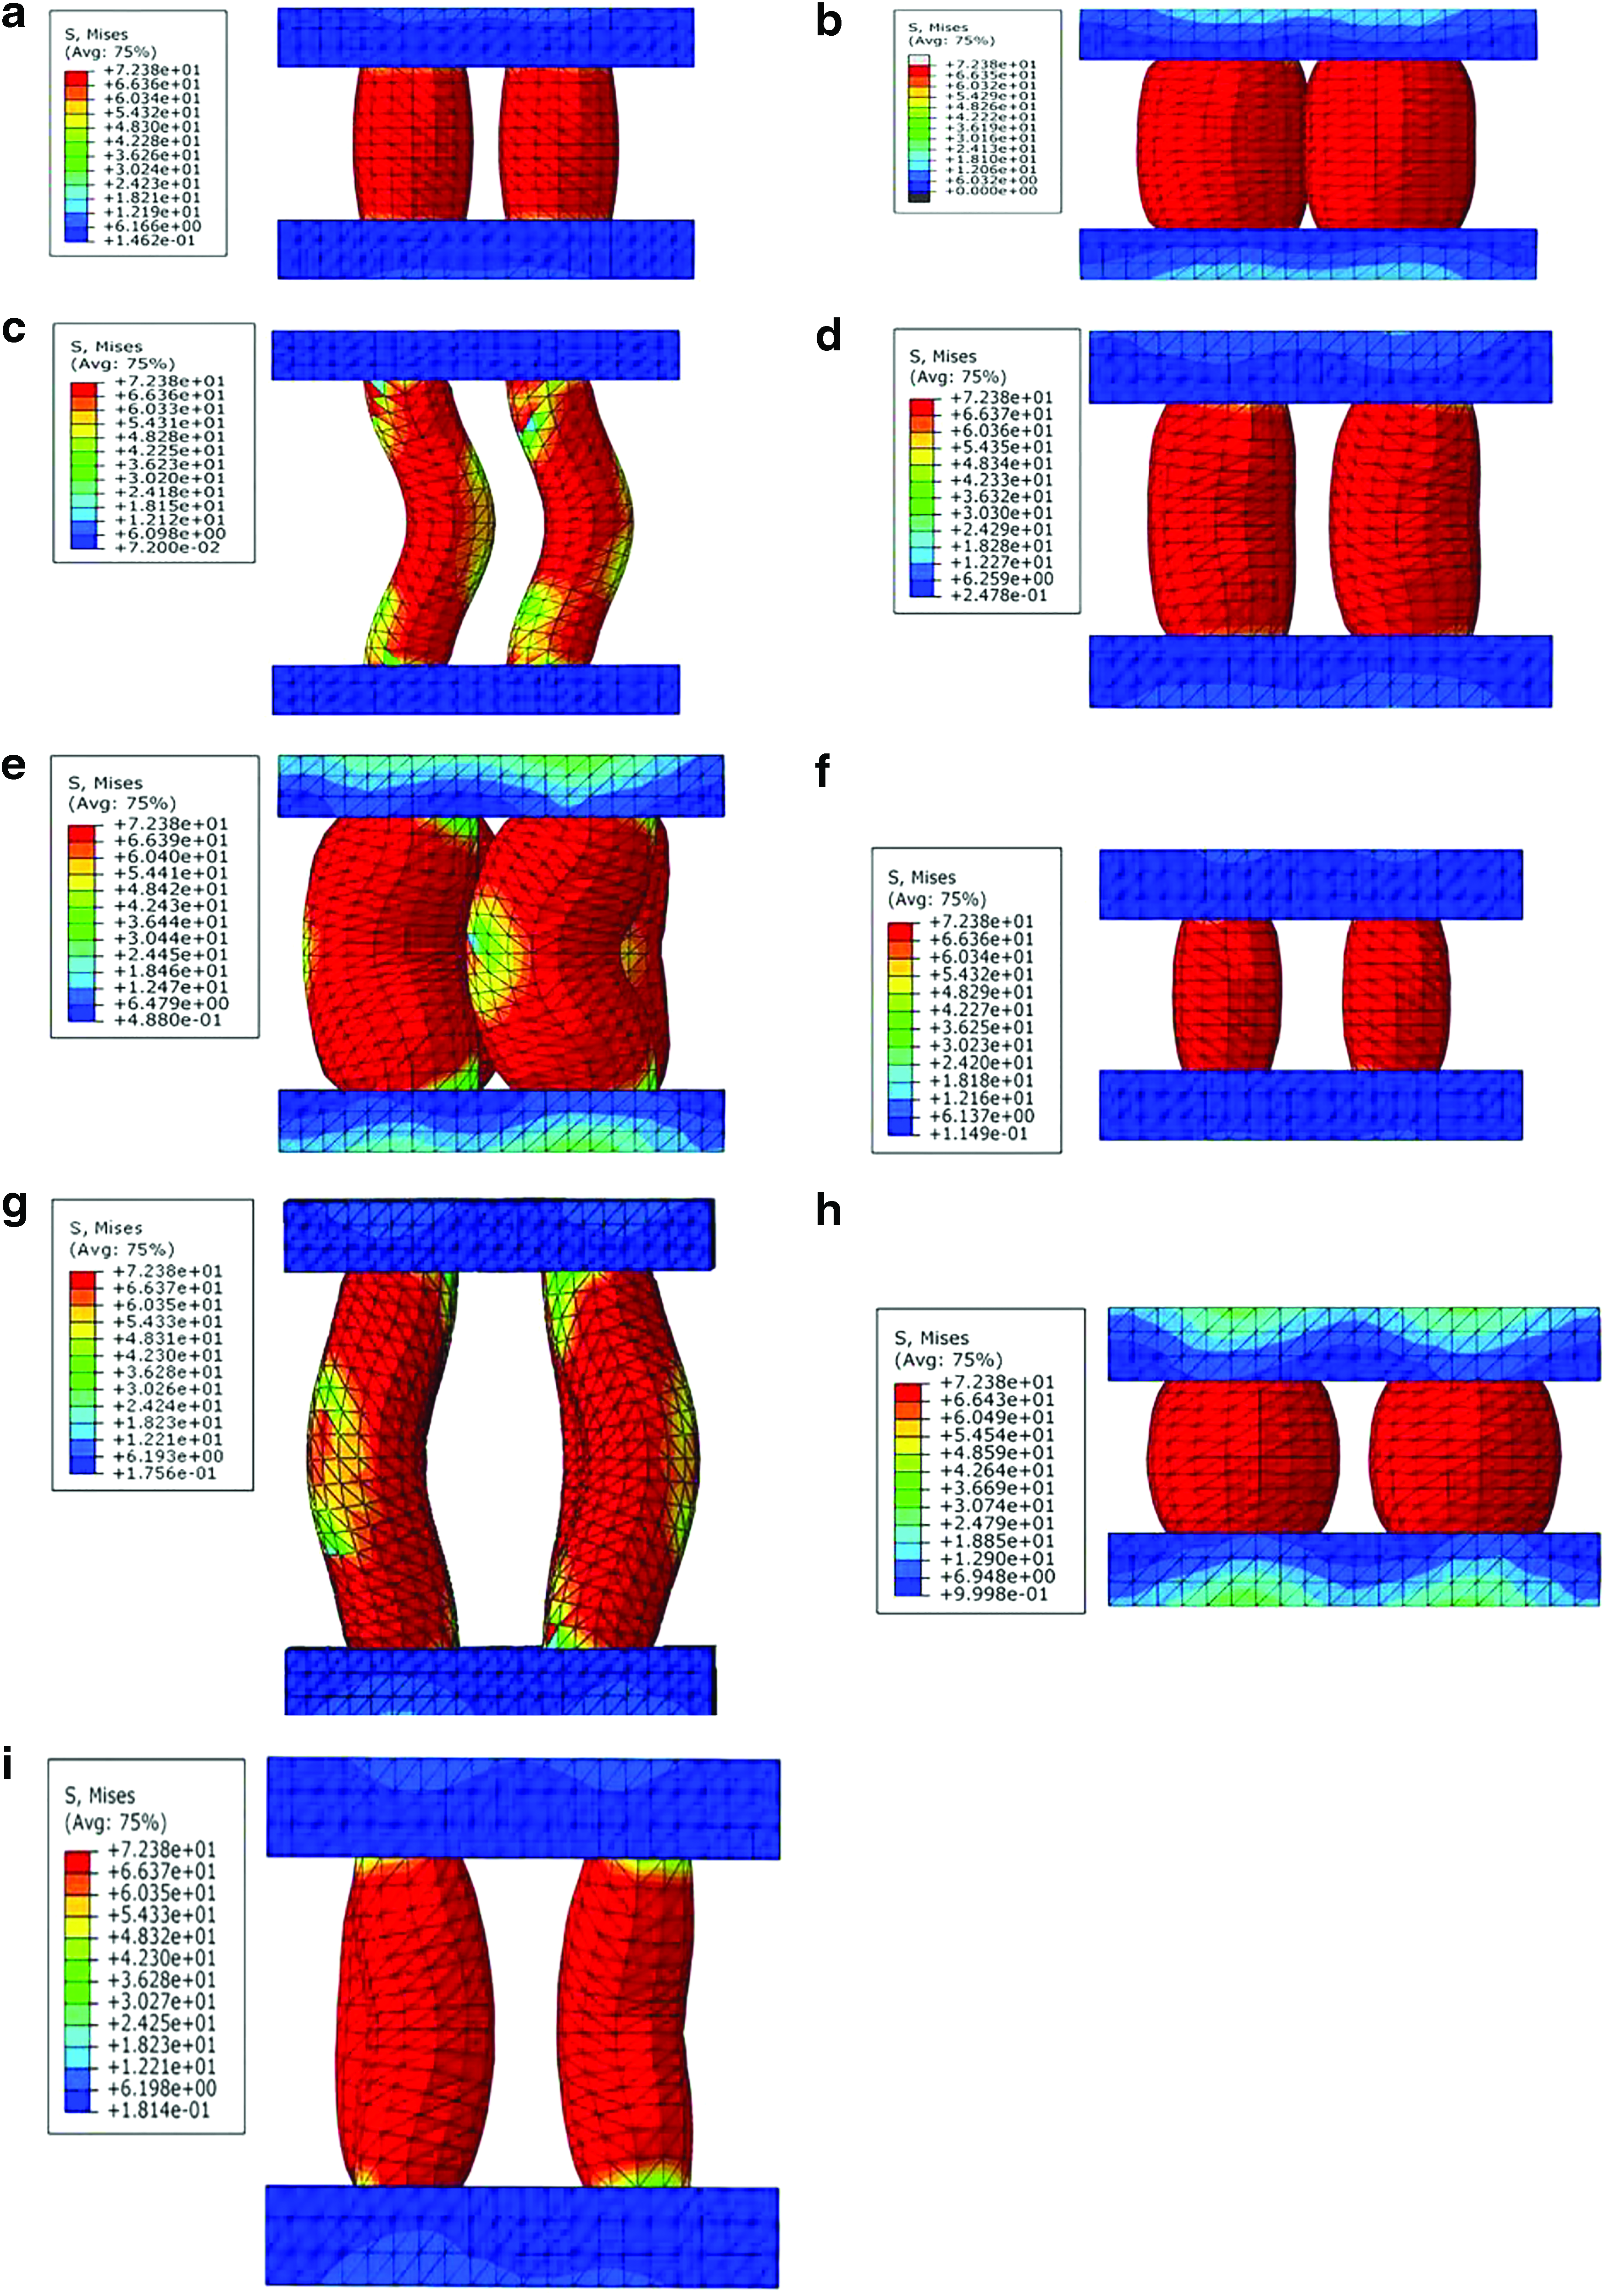
The simulating failure mechanisms of
Comparison of the experiments and FEM results are listed in Table 3 to verify the availability of FEM simulations. The experiment and simulating results are close. The maximum error is 12.3% and minimum error is 1.8%. The main reason for error is that material damage is not included in the simulation.
Comparison of Experiment and Finite Element Method Results
FEM, finite element method.
Mechanical properties of the lattice structure
The specific strength is one of the key indicators to measure the performance of lattice structures, so specific strength is measured in the article. A specific strength analysis table of the lattice structure was prepared using this calculation, as shown in Table 1.
By comparing the magnitude of the range
The flat compression performance of the lattice structure, that is, the core distance is 18 mm, core diameter is 12 mm, and core length is 20 mm, is shown in Table 4. The average load–mass ratio is defined as
Mechanical Properties of the Lattice Structure
where X is the average load–mass ratio,
The specific strength of 3D printed, straight column lattice structures was compared with other structures, including metal and composite, as shown in Figure 6. SS denotes stainless steel. The specific strength of the PLA lattice structure is 66.51 103 m2/s2, higher than that of stainless steel structures,26,27 carbon fiber lattice structure, 4 and aluminum cellular structure, 28 and similar to that of the aluminum lattice structure. 29 The result fully demonstrates the advantages of a 3D printed, straight column lattice structure in terms of specific strength.
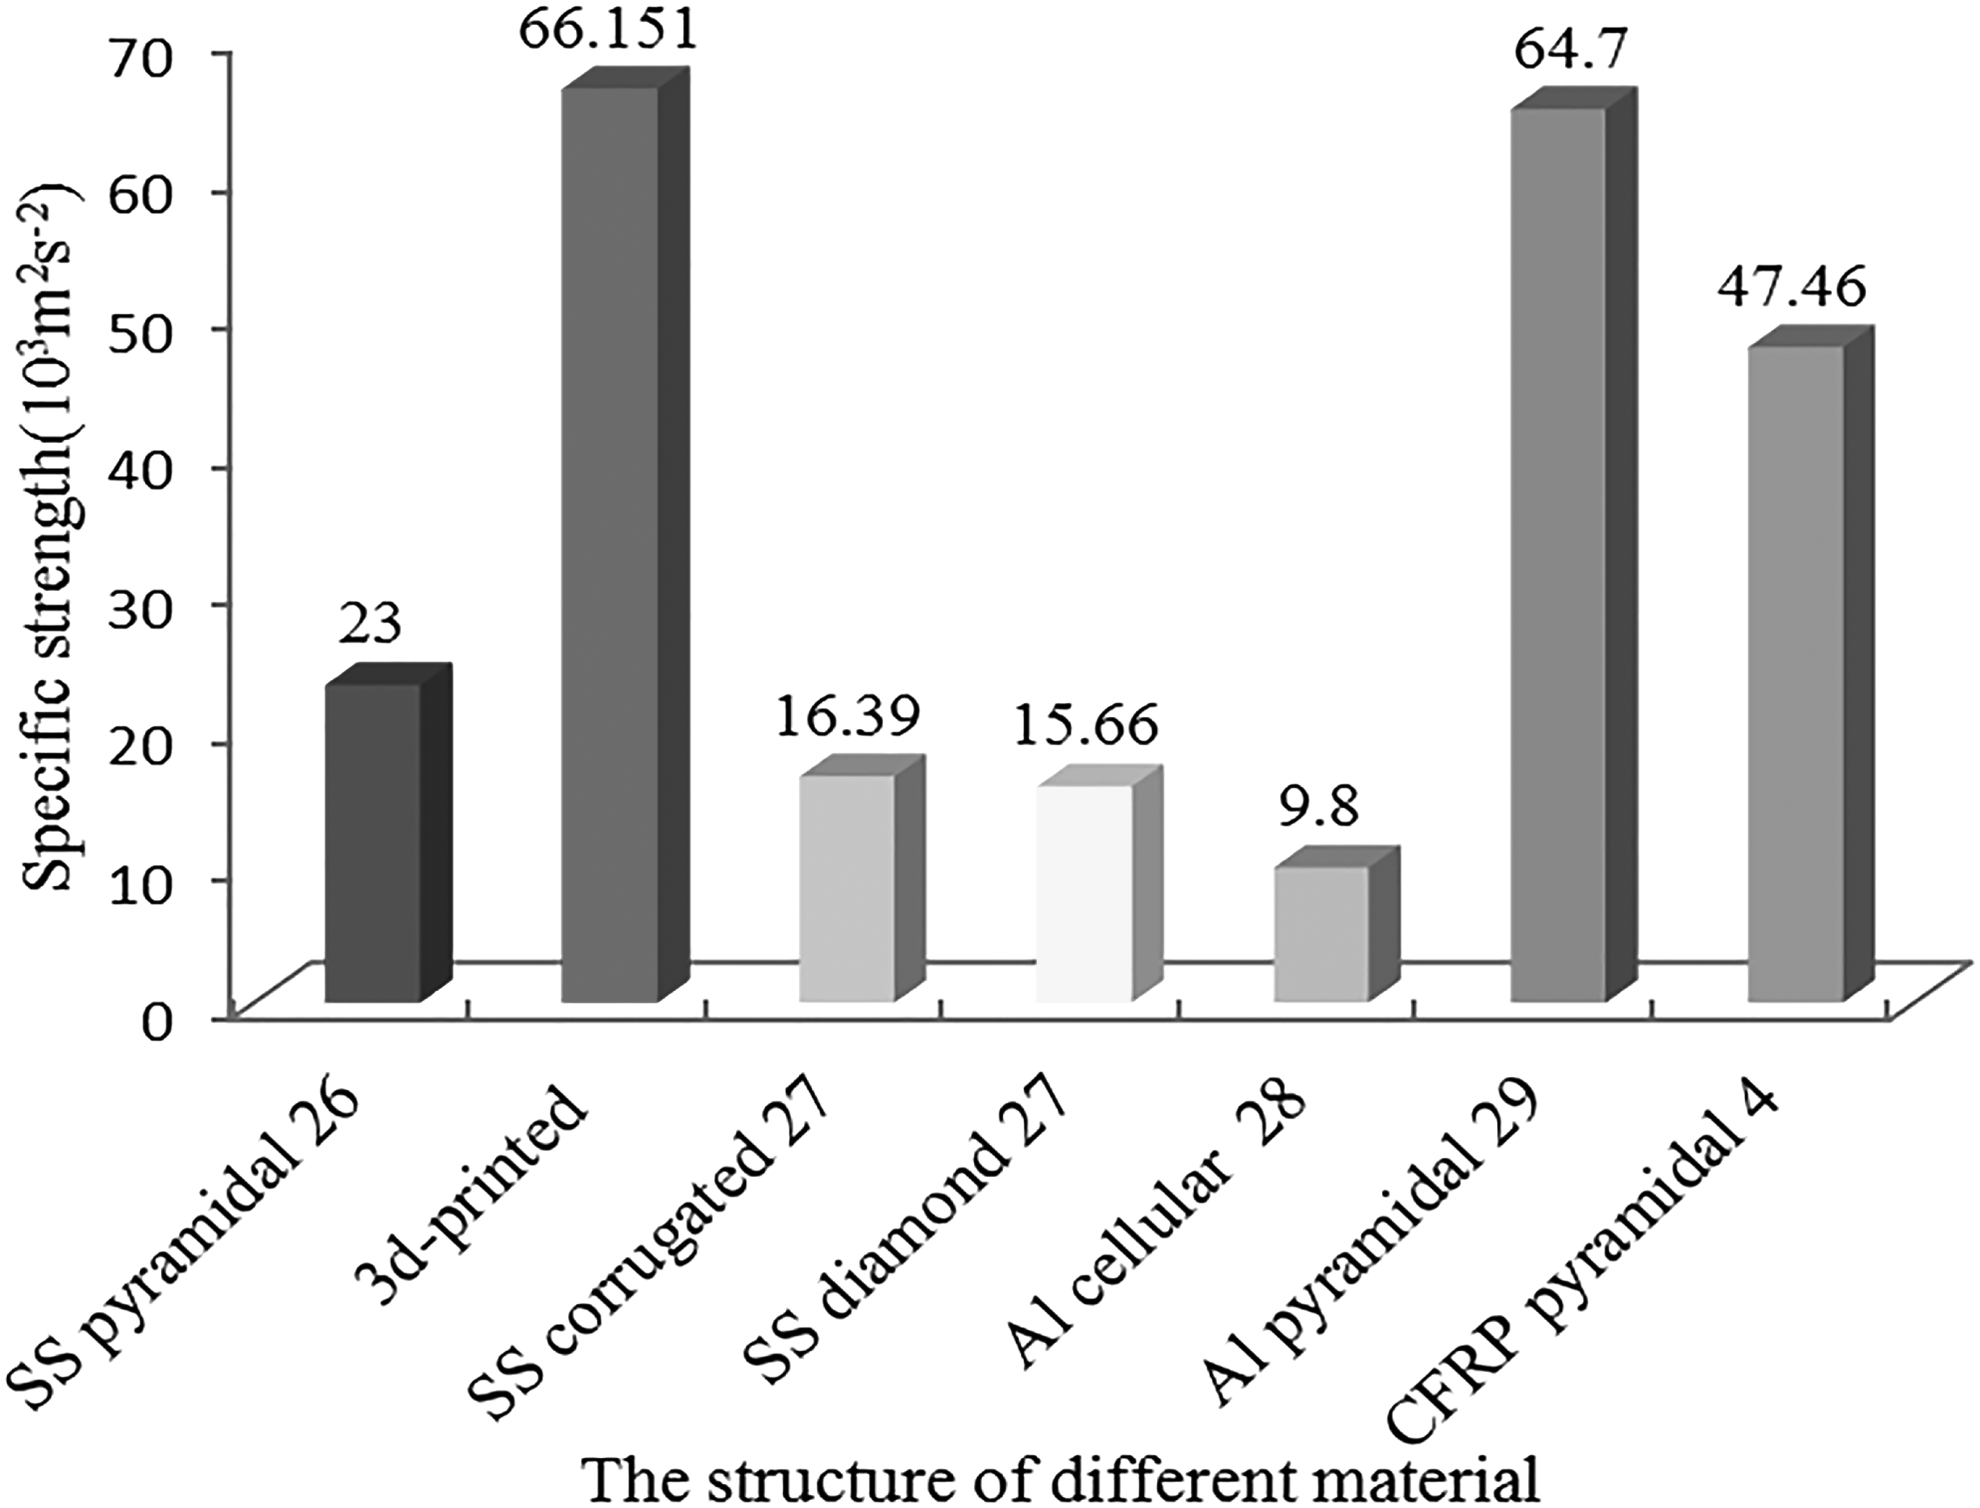
Comparison of specific strength. CFRP, carbon fiber reinforced plastic; SS, stainless steel.
Prediction and analysis of the compression performance of lattice structures
A single cell has four cores, and the four cores experience the same force; therefore, the force of a single core was analyzed. Figure 7 is a force diagram of a core. As shown in Figure 7, assuming that the displacement of the core in the Z direction under the action of force F is
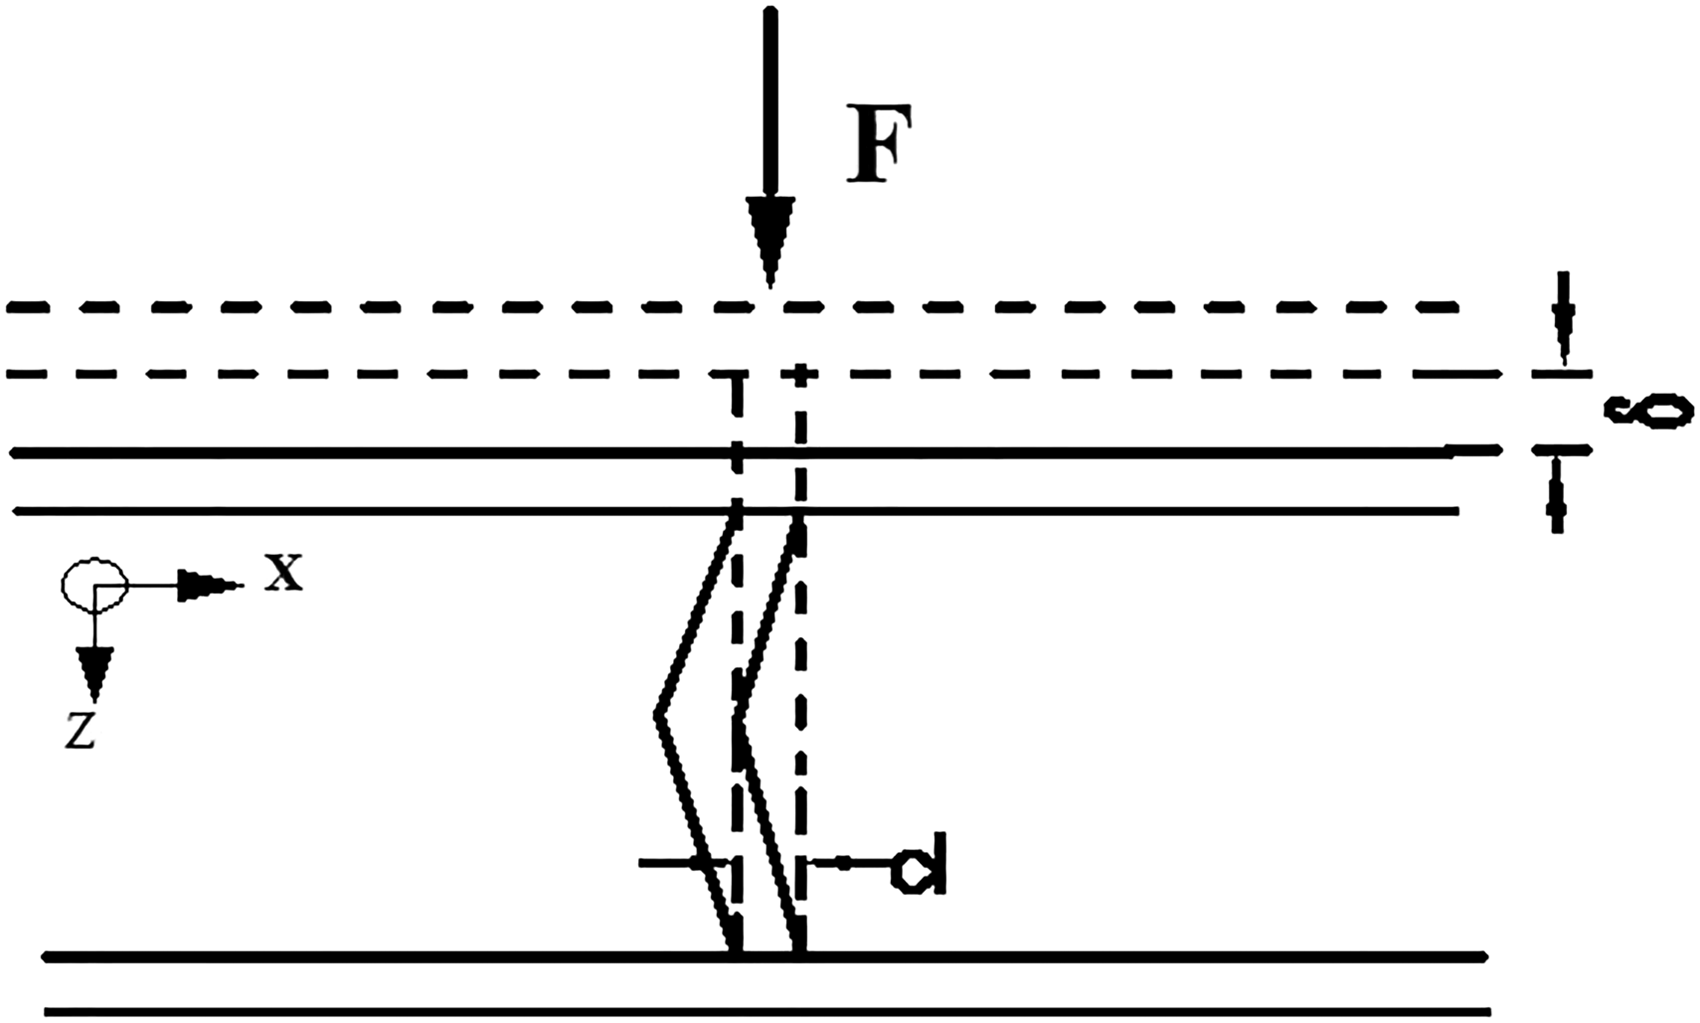
Force diagram of the lattice.
where
A single, complete, straight columnar cell comprises four columns. The stress of a single cell in the Z direction under the action of force F is
The formula for calculating the modulus of elasticity is
Substituting Equations (3) and (5) into Equation (4) yields
Equation (1), which is used to calculate the relative density can be substituted into Equation (6), yielding
When the cell is crushed, the ultimate compression strength of the lattice structure is
Equation (1) is replaced by Equation (8), which yields
where
Because the core is fixed, k = 4. Equations (1) and (10) are substituted into Equation (8) to yield
Because the relative density of the lattice structure is high, the core of the lattice structure is short and the diameter is large; thus, the critical load of buckling is increased and the core tends to be crushed before it exhibits buckling. Therefore, Equations (7) and (9) can be used to calculate the properties of the lattice structure.
The compression performance of a cylindrical core with a lattice structure is shown in Table 5. The measured mechanical properties and theoretical prediction of the lattice structure are shown in Table 6, which shows that the measured performance of the lattice structure is similar to the theoretical prediction. The maximum difference between the measured strength of the lattice structure and the theoretically predicted strength is <13% of the measured strength, and the maximum difference of the elastic modulus is <20% of the measured elastic modulus. The main reason for the error is that the lattice structure is regarded as having no defect in the theoretical analysis, but problems typically occur in the printing process, such as the uneven extrusion of material and warping of the structure.
Cylindrical Core Flat Compression Performance
Measured Flat Compression Performance and Predicted Flat Compression Performance for the Lattice Structure
The critical diameter-to-length ratio is obtained when the critical buckling stress of the core is equal to the yield stress of the material. The critical diameter-to-length ratio is
where
Energy absorption characteristics of the lattice structure
The lattice structure exhibited good energy absorption properties, which were examined. The mean crushing force is an important parameter that is used to measure the energy absorption characteristics of lattice structures. The mean crushing force is defined as
where
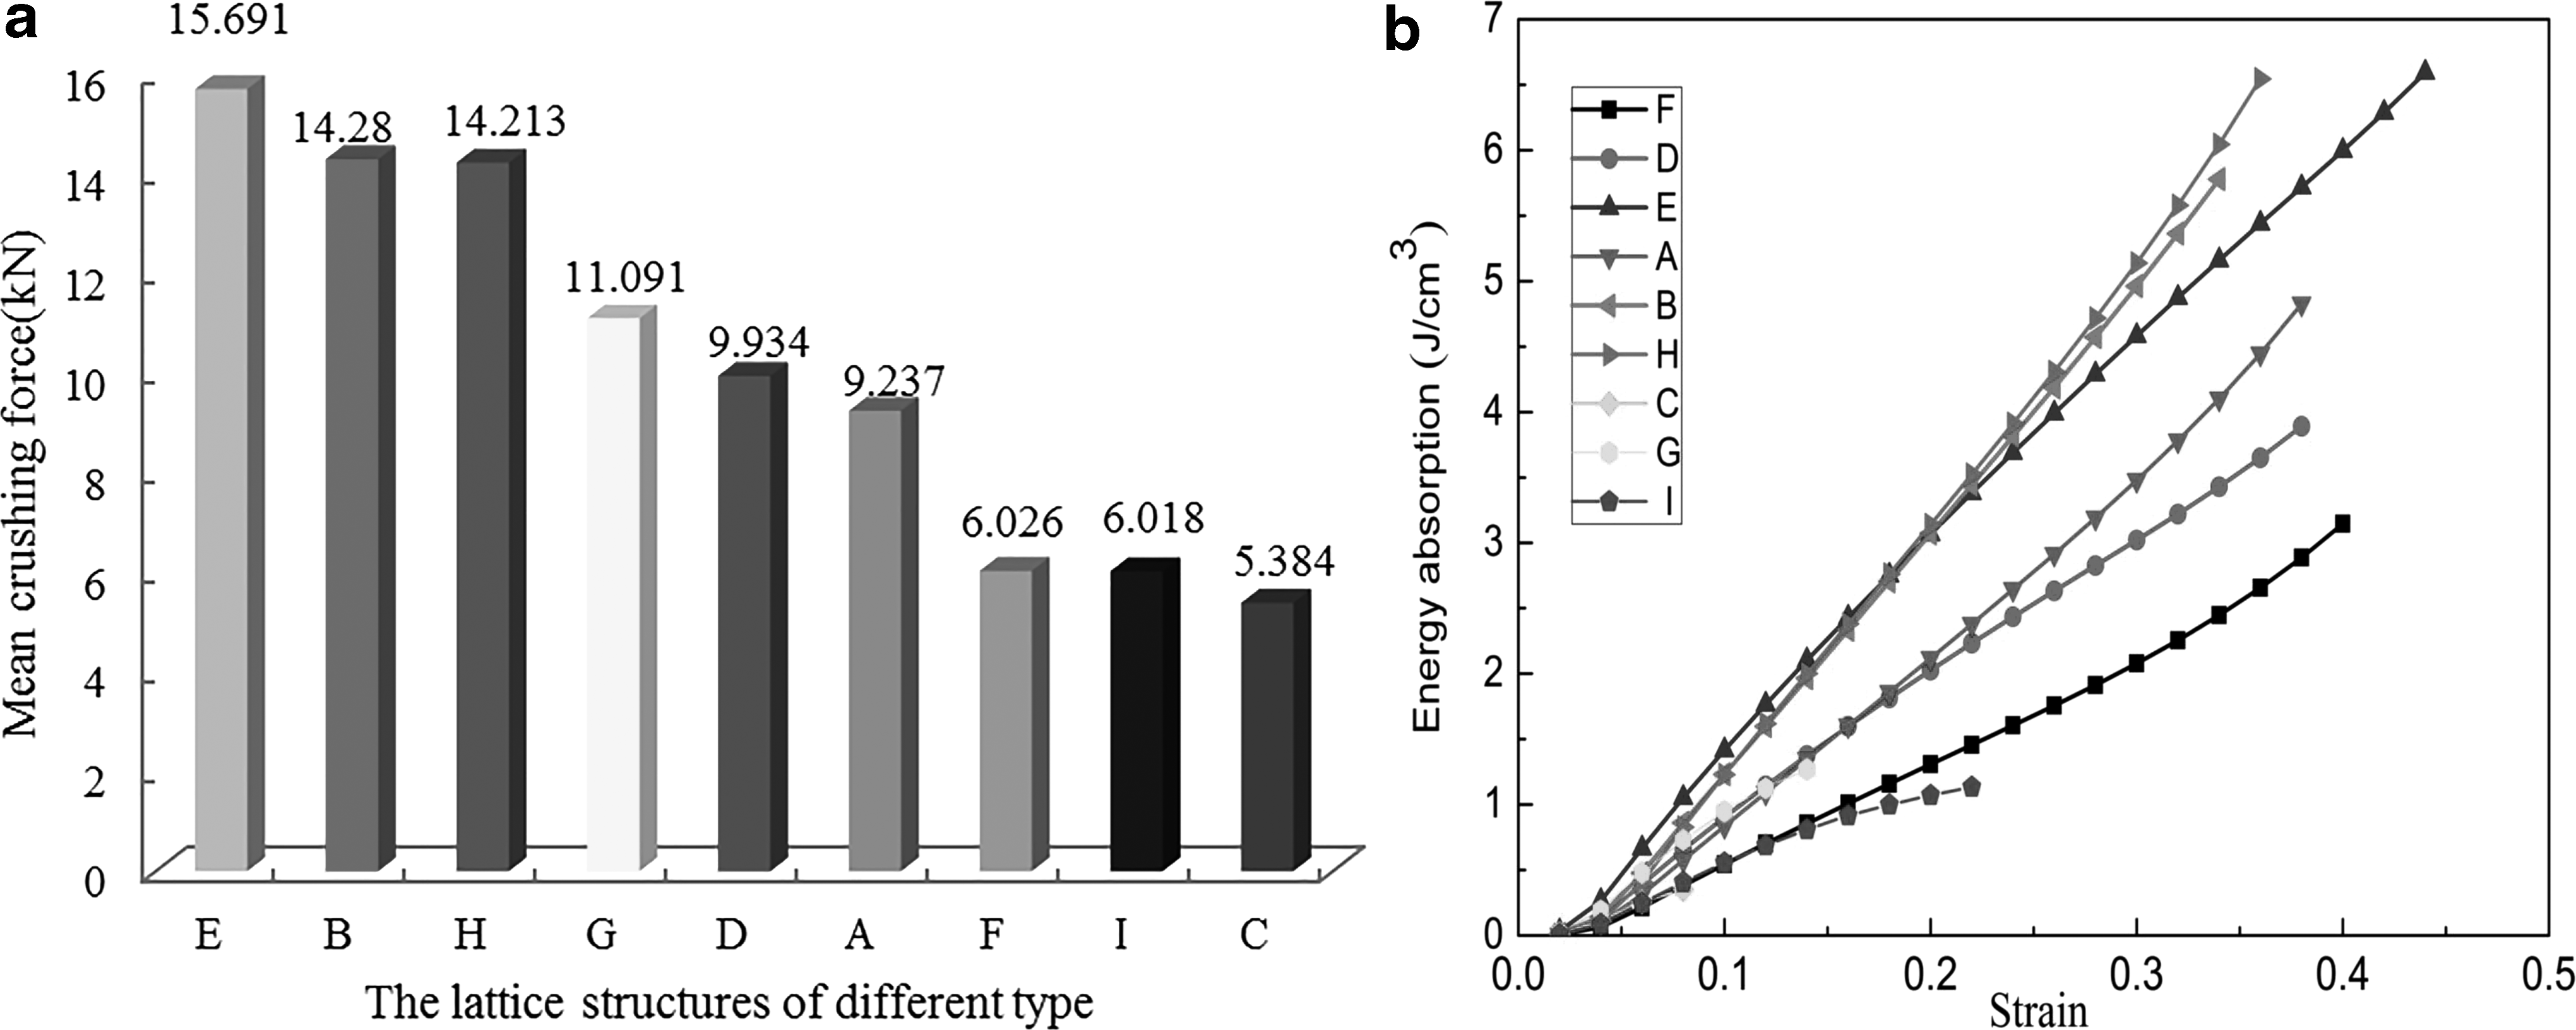
Energy absorption characteristics
Considering the volume increase of the lattice structure, specific energy absorption (SEA) is used to evaluate the energy absorption characteristics of the lattice structure, and SEA stands for unit volume energy absorption; SEA is the area surrounded by the stress–strain curve. Figure 8b shows the SEA of nine curves. The maximum SEA of three curves, C, G, and I, is low due to lack of plateau and densification stages. A lattice structure with a diameter of 12 mm has the highest SEA, followed by a structure with a diameter of 10 mm; the lattice structure with the lowest SEA has a diameter of 8 mm. Although the larger-diameter lattice structure has a larger volume, its total energy absorption is also higher. Therefore, larger-diameter lattice structures have larger SEA capacities. For lattice structures with the same diameter and different lengths, the SEA of a lattice structure with a longer core length is higher at the elastic stage. Because the diameters of the cores are the same, the longer the core, the faster it enters the elastic stage and the greater the stress under the same strain. When the lattice structure enters the plateau stage, a lattice structure with a longer core will have a smaller load under the same strain than a structure with a shorter core. Therefore, SEA of a lattice structure with a shorter core will exceed that of a structure with a longer core at the plateau stage.
Comparison
The SEA of the PLA lattice structure is compared with that of metallic materials and composite in Figure 9. Among metals in Figure 9a, lattice structures constructed of aluminum manufactured by Kooistra 30 have greater energy absorption capacity than other metal structures,31–33 and the SEA of the PLA lattice structure is comparable. Among composites, the SEA of the PLA lattice structure is greater than other structures34–39 shown in Figure 9b. The above findings demonstrate the superiority of PLA lattice structures regarding energy absorption.
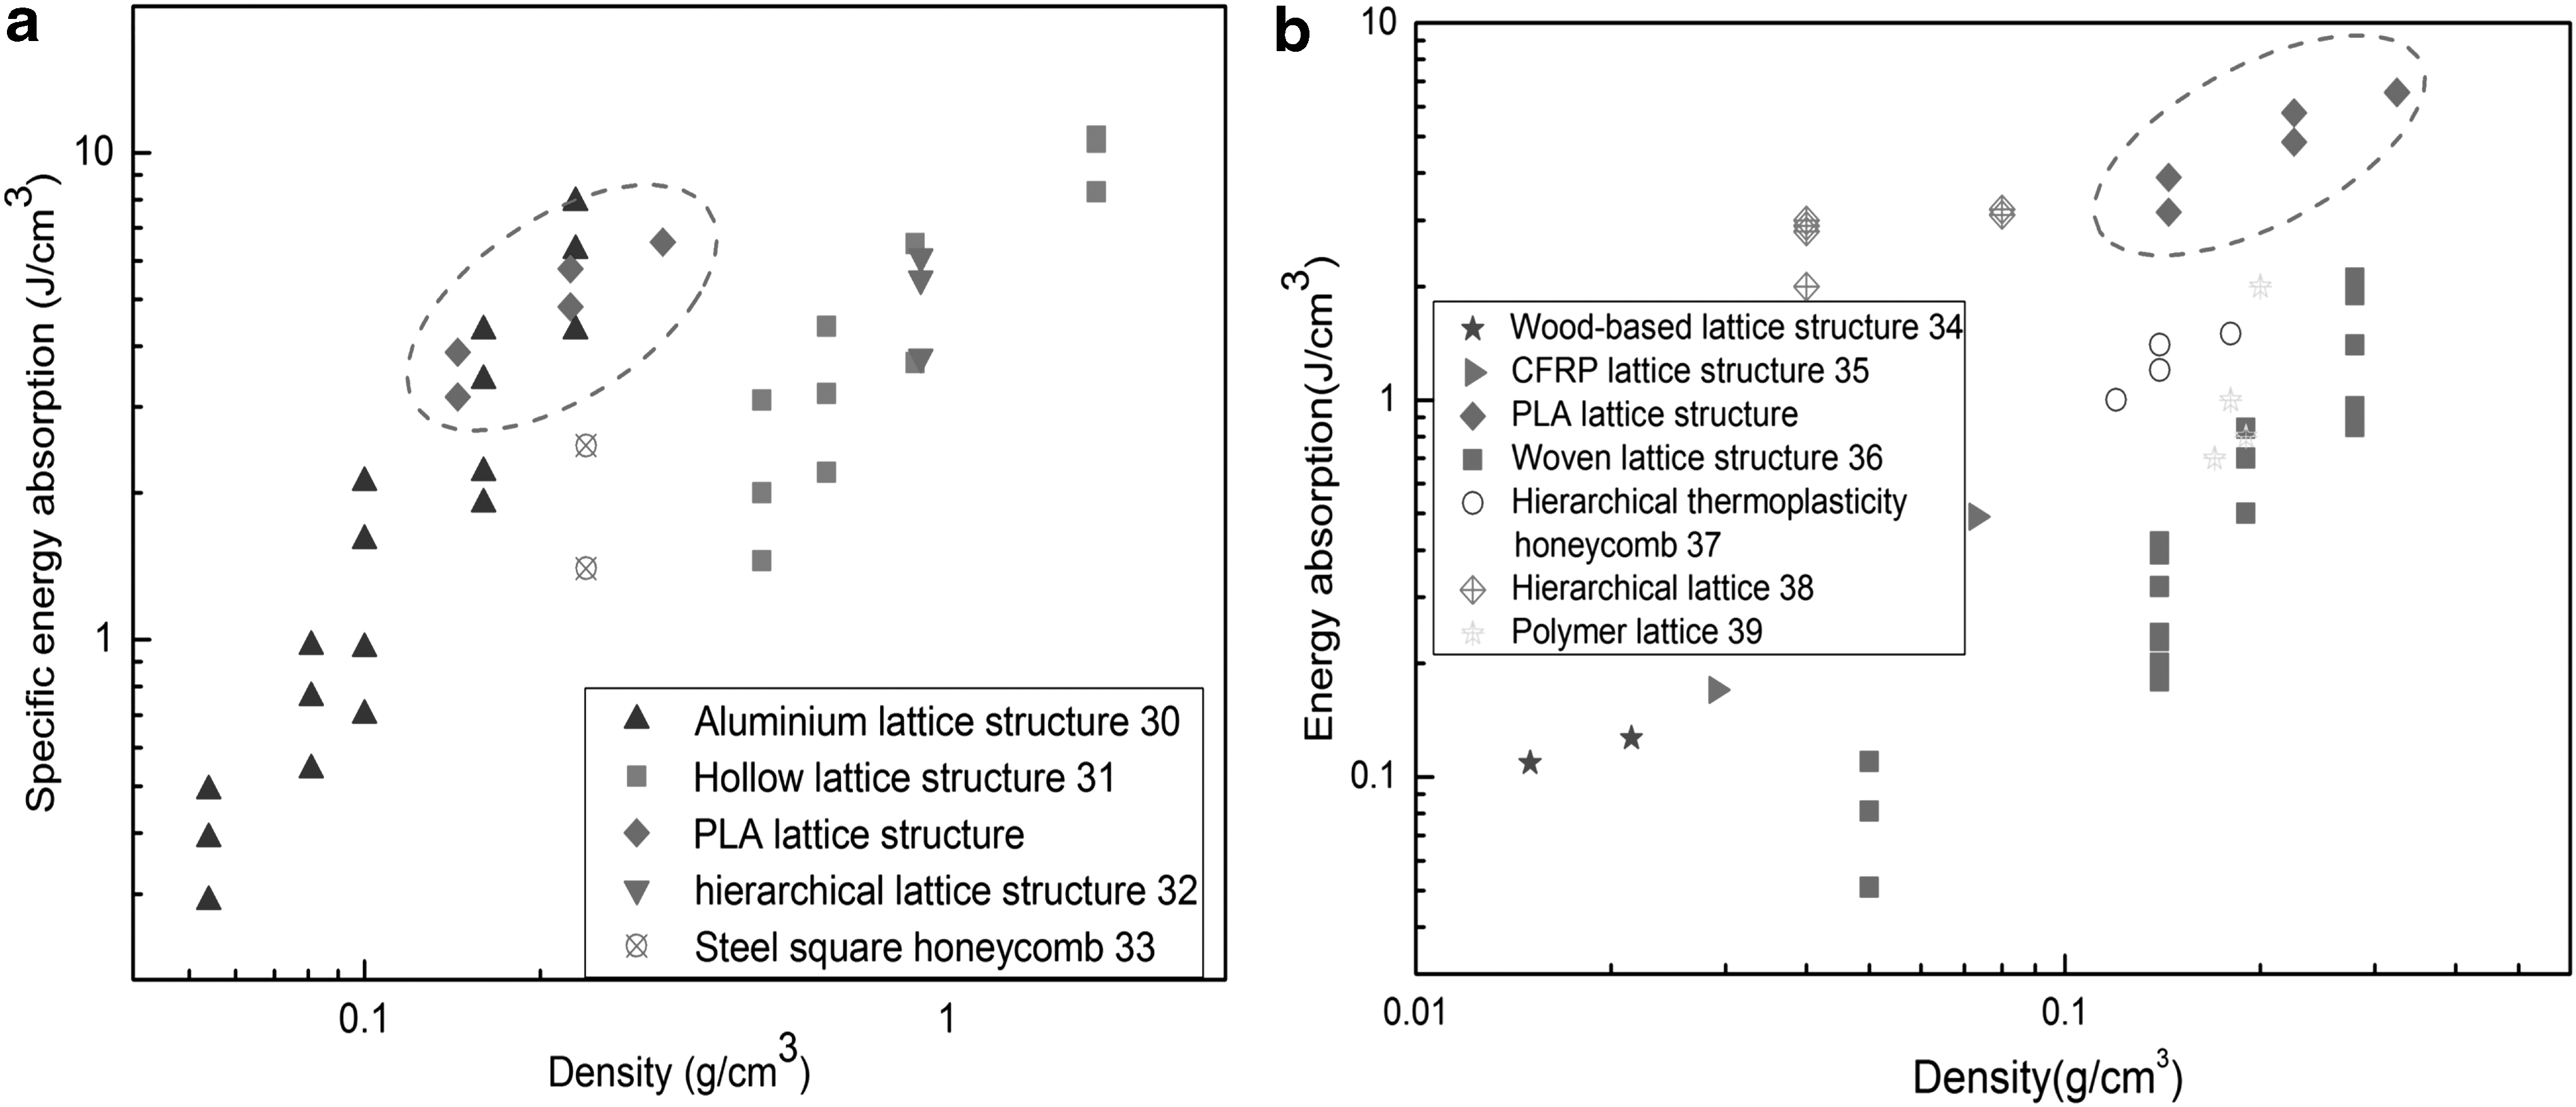
Comparison of SEA per unit volume with
Although the straight column lattice structure has advantages in uniaxial compression strength and energy absorption, it also has some defects such as high anisotropy and shear defects.
Conclusions
Using FDM 3D printing technology, the lattice structure can be integrally printed. The compression and energy absorption characteristics of the straight column lattice structure were examined in this study by experiments, FEM, and theoretical analysis. The conclusions are as follows:
According to specific strength, the optimum specifications of the lattice structure in the article are the following: a core distance of 18 mm, core diameter of 12 mm, and core length of 20 mm. Among these, the factor that most influences specific strength is the core distance. To a certain extent, the specific strength of this structure can compete with the specific strength of aluminum lattice structures and the mass–load ratio is far more than that of the pineapple leaf fiber lattice cylindrical structure and carbon fiber lattice cylindrical structure. The failure mode of the lattice structure was crushing of the core, and the connection between the core and panel is not damaged. Densification of the lattice structure will only occur when the diameter-to-length ratio is ≥0.3, according to the experiment. The failure mode of lattice structures with diameter-to-length ratios ≥0.4 is alteration of the core into a drum type. The failure mode of lattice structures with diameter-to-length ratios <0.4 is core bending. The simulating failure mechanisms by FEM are the same as the actual. The compression performance obtained by theoretical analysis is close to the experimental result. The diameter has the greatest influence on the SEA and mean crushing force. The 3D printed lattice structure has a superior energy absorption capacity compared with metal and composite structures.
Footnotes
References
Supplementary Material
Please find the following supplemental material available below.
For Open Access articles published under a Creative Commons License, all supplemental material carries the same license as the article it is associated with.
For non-Open Access articles published, all supplemental material carries a non-exclusive license, and permission requests for re-use of supplemental material or any part of supplemental material shall be sent directly to the copyright owner as specified in the copyright notice associated with the article.