
Abstract
Additive manufactured light components are desirable for airspace and automobile applications where failure resistance under contact is important. To date, understanding the nature of subsurface damage in contact is still lacking. In this research, we investigated 3D-printed aluminum-silicon (Al-Si) alloys in the lattice structure under a rolling contact condition. Using the microtomography technique, we were able to construct a 3D image of the lattice structure being plastically deformed. Finite element analysis was conducted about the strain and stress on struts of different dimensions. Results showed that morphology dominated the deformation. The significant factors affecting the deformation were the strut aspect ratio, and their relative diameter. When the aspect ratio of a strut is smaller than 0.5, the plastic deformation is distributed in the subsurface region and when it is larger than 0.5, the deformation concentrates on the top layer of struts. This research indicates that the dimensional parameters of lattice structures can be designed for optimization to achieve higher resistance to deformation.
Introduction
Aluminum-silicon (Al-Si) alloy systems are among the most abundant on earth, second next to iron.1–3 These alloys are widely used in many engineering applications.3,4 Their combination of low density and high impact resistance and toughness make them ideal for aerospace, aviation, and automotive applications.5,6 In addition to these attractive properties, Al-Si alloys have been excellent candidates for processing using laser-based additive manufacturing (AM) technologies,7,8 which enables the production of lightweight structures known as lattice structures.9–15 Such structures with a periodic arrangement of unit cells have been reported to possess high impact resistance, toughness, and strength-to-weight ratios relative to their bulk counterparts.16–18
To ensure the safe operation of additively manufactured Al-Si lightweight lattice structures, the ability to predict the initiation of subsurface damage is of crucial importance. One of the major wear mechanisms for ductile materials is surface delamination. These delaminations are caused by subsurface damages.19–23 Under cyclic loading or stress concentration, subsurface defects such as voids and cracks could propagate to surface, coalesce, and form wear debris.20,24 For Al-Si systems, the main culprit of their wear is the fragmented brittle silicon phase caused by subsurface deformation. 25 The problem is exacerbated in the case of lattice structures due to the nature of the interconnection between recurring unit cells. The main failure was often initiated with that of an individual strut.26,27 When the stress concentration exceeds a certain threshold, struts could buckle or fracture under compression. 28 In some cases, the failure of an individual strut can cascade, resulting in failure of the entire structure. 18 The stress concentration can be caused by inadequate design 26 or by manufacturing defects.11,29–31 In addition, nodes on the surface have less support compared with the nodes inside the structure. This lack of support can cause stress concentration on the surface.11,26,28 Thus, we consider the near-surface deformation of a 3D-printed lattice a source of subsurface damage, yet with length scale in millimeters instead of micrometers.
Most of the prior studies have focused on analyzing the deformation of lattice structures subjected to uniaxial loading or bending.11,18,26,28,32 However, an understanding of the contact mechanism of such AM-fabricated lattice is still lacking.
To understand mechanisms of subsurface deformation and subsequent damage often encountered in mechanical systems in motion, we designed experiments to investigate the state of deformation of a lattice structure. To focus on the subsurface regime, we used rolling contact to avoid the effects of surface sliding wear. Micro X-ray computational tomography (μ-XCT) was used to measure the deformation inside lattice structures. In addition, the finite element method was used to explain the observed phenomenon.
Materials and Methods
AM of specimens
Specimens were fabricated by using laser powder bed fusion AM (L-PBF AM). L-PBF is a laser-based AM process where parts are fabricated through selectively fusing metallic powder particles by using a high-energy laser beam guided by a CAD model.33–35 A ProX 200 DMP commercial L-PBF system was used. The system uses a 300 W fiber laser to melt metallic powder under an argon inert protective atmosphere. The metallic powder used in this study is Al-Si12, with the composition shown in Table 1.
Composition of Al-Si12
The diameters of powder particles range between 11 and 45 μm, with D50 < 15 μm and D80 < 23 μm. The D50 and D80, respectively, denote that 50% and 80% of the powder particles have diameters less than these values. All specimens were printed with the same processing parameters optimized to achieve nearly fully dense parts. The laser power was set at 225 W with a scanning speed of 1200 mm/s and a hatch spacing of 100 μm. The spot size of the laser was 80 μm. The hatch spacing refers to the distance between two adjacent passes of the laser beam within the same layer. The thickness of successive powder layers was set to 30 μm. The geometry of the fabricated specimens was 10 × 10 × 10 mm cubes filled with recurring octahedral lattice unit cells with different strut diameters. The unit size of the three lattices was 1 mm for specimen A and 1.2 mm for specimens B and C. Specimen A had 10 U cells in each direction, and specimens B and C had 8 U cells in each direction. The thickness of the strut was 0.25 mm for specimen A and 0.3 mm for specimens B and C. A more accurate description of geometric parameters measured from μ-XCT would be discussed in later chapters. The fabricated specimens and a lattice unit cell are shown in Figure 1. Three lattice configurations with different pore sizes were fabricated, referred to as lattice A, lattice B, and lattice C, respectively, in the remainder of this article.

To introduce damage, rolling contact was applied to the fabricated specimens by using a tribotest with a bearing-on-disk arrangement. This tribotest experiment used a tribometer (CSM instruments). The bearing was held on a force-sensing transducer and pressed downward into the specimen with a dead weight. The specimen was moved perpendicular to the bearing in a reciprocal motion. This arrangement ensured that the deformation inside the sample was caused only by the contacting force in the moving direction. The printed specimens were secured inside a plastic fixture before the tribotest. The fixture makes full contact and holds tightly on all but the top side of the specimen. To minimize surface friction and wear, a Koyo Corp. EE0M3 steel rolling element ball bearing with an outer diameter of 9.5 mm and a radial width of 4 mm was used. The normal force applied to all specimens was 3 N. The bearing moved in reciprocal motion on the specimen at a 4 mm amplitude. A total of 50 cycles of rubbing were performed on each specimen. The lateral force was minimized to lower than 0.15 N for all three samples.
Micro-tomography
Synchrotron μ-XCT experiments were conducted on the Beam line 8.3.2 instrument at Lawrence Berkeley National Laboratory. All three specimens were illuminated with 20 keV X-rays. Projections were imaged with a LuAG:Ce scintillator, a Nikon macro lens with approximately 1 × magnification, and a PCO.edge sCMOS detector. Tomographic reconstruction was conducted by using Xi-CAM 36 with a Tomopy tomography plugin. 37
A computational model to quantify subsurface damage related to wear
To explain the experimental results, we implement a discrete finite element model by using the numpy and scipy package with python language (Table 2). This model treated the lattice consisting of connecting identical struts. Those struts were fixed at their ends. To have a simple model to analyze, we consider that there are two stiffness terms when the struts deform: the stiffness against dilation (compression or tension) of the strut and the stiffness against the deflection of the strut. A simple finite element 2-D model was built based on these strut elements.
Discrete Model Parameters
By minimizing the strain energy of the whole structure, the distribution of the strain can be calculated. The components of the potential energy function are:
A—Matrix describes the geometry of the lattice
If we take the length of the original strut as 1, the potential energy is:
Vectors
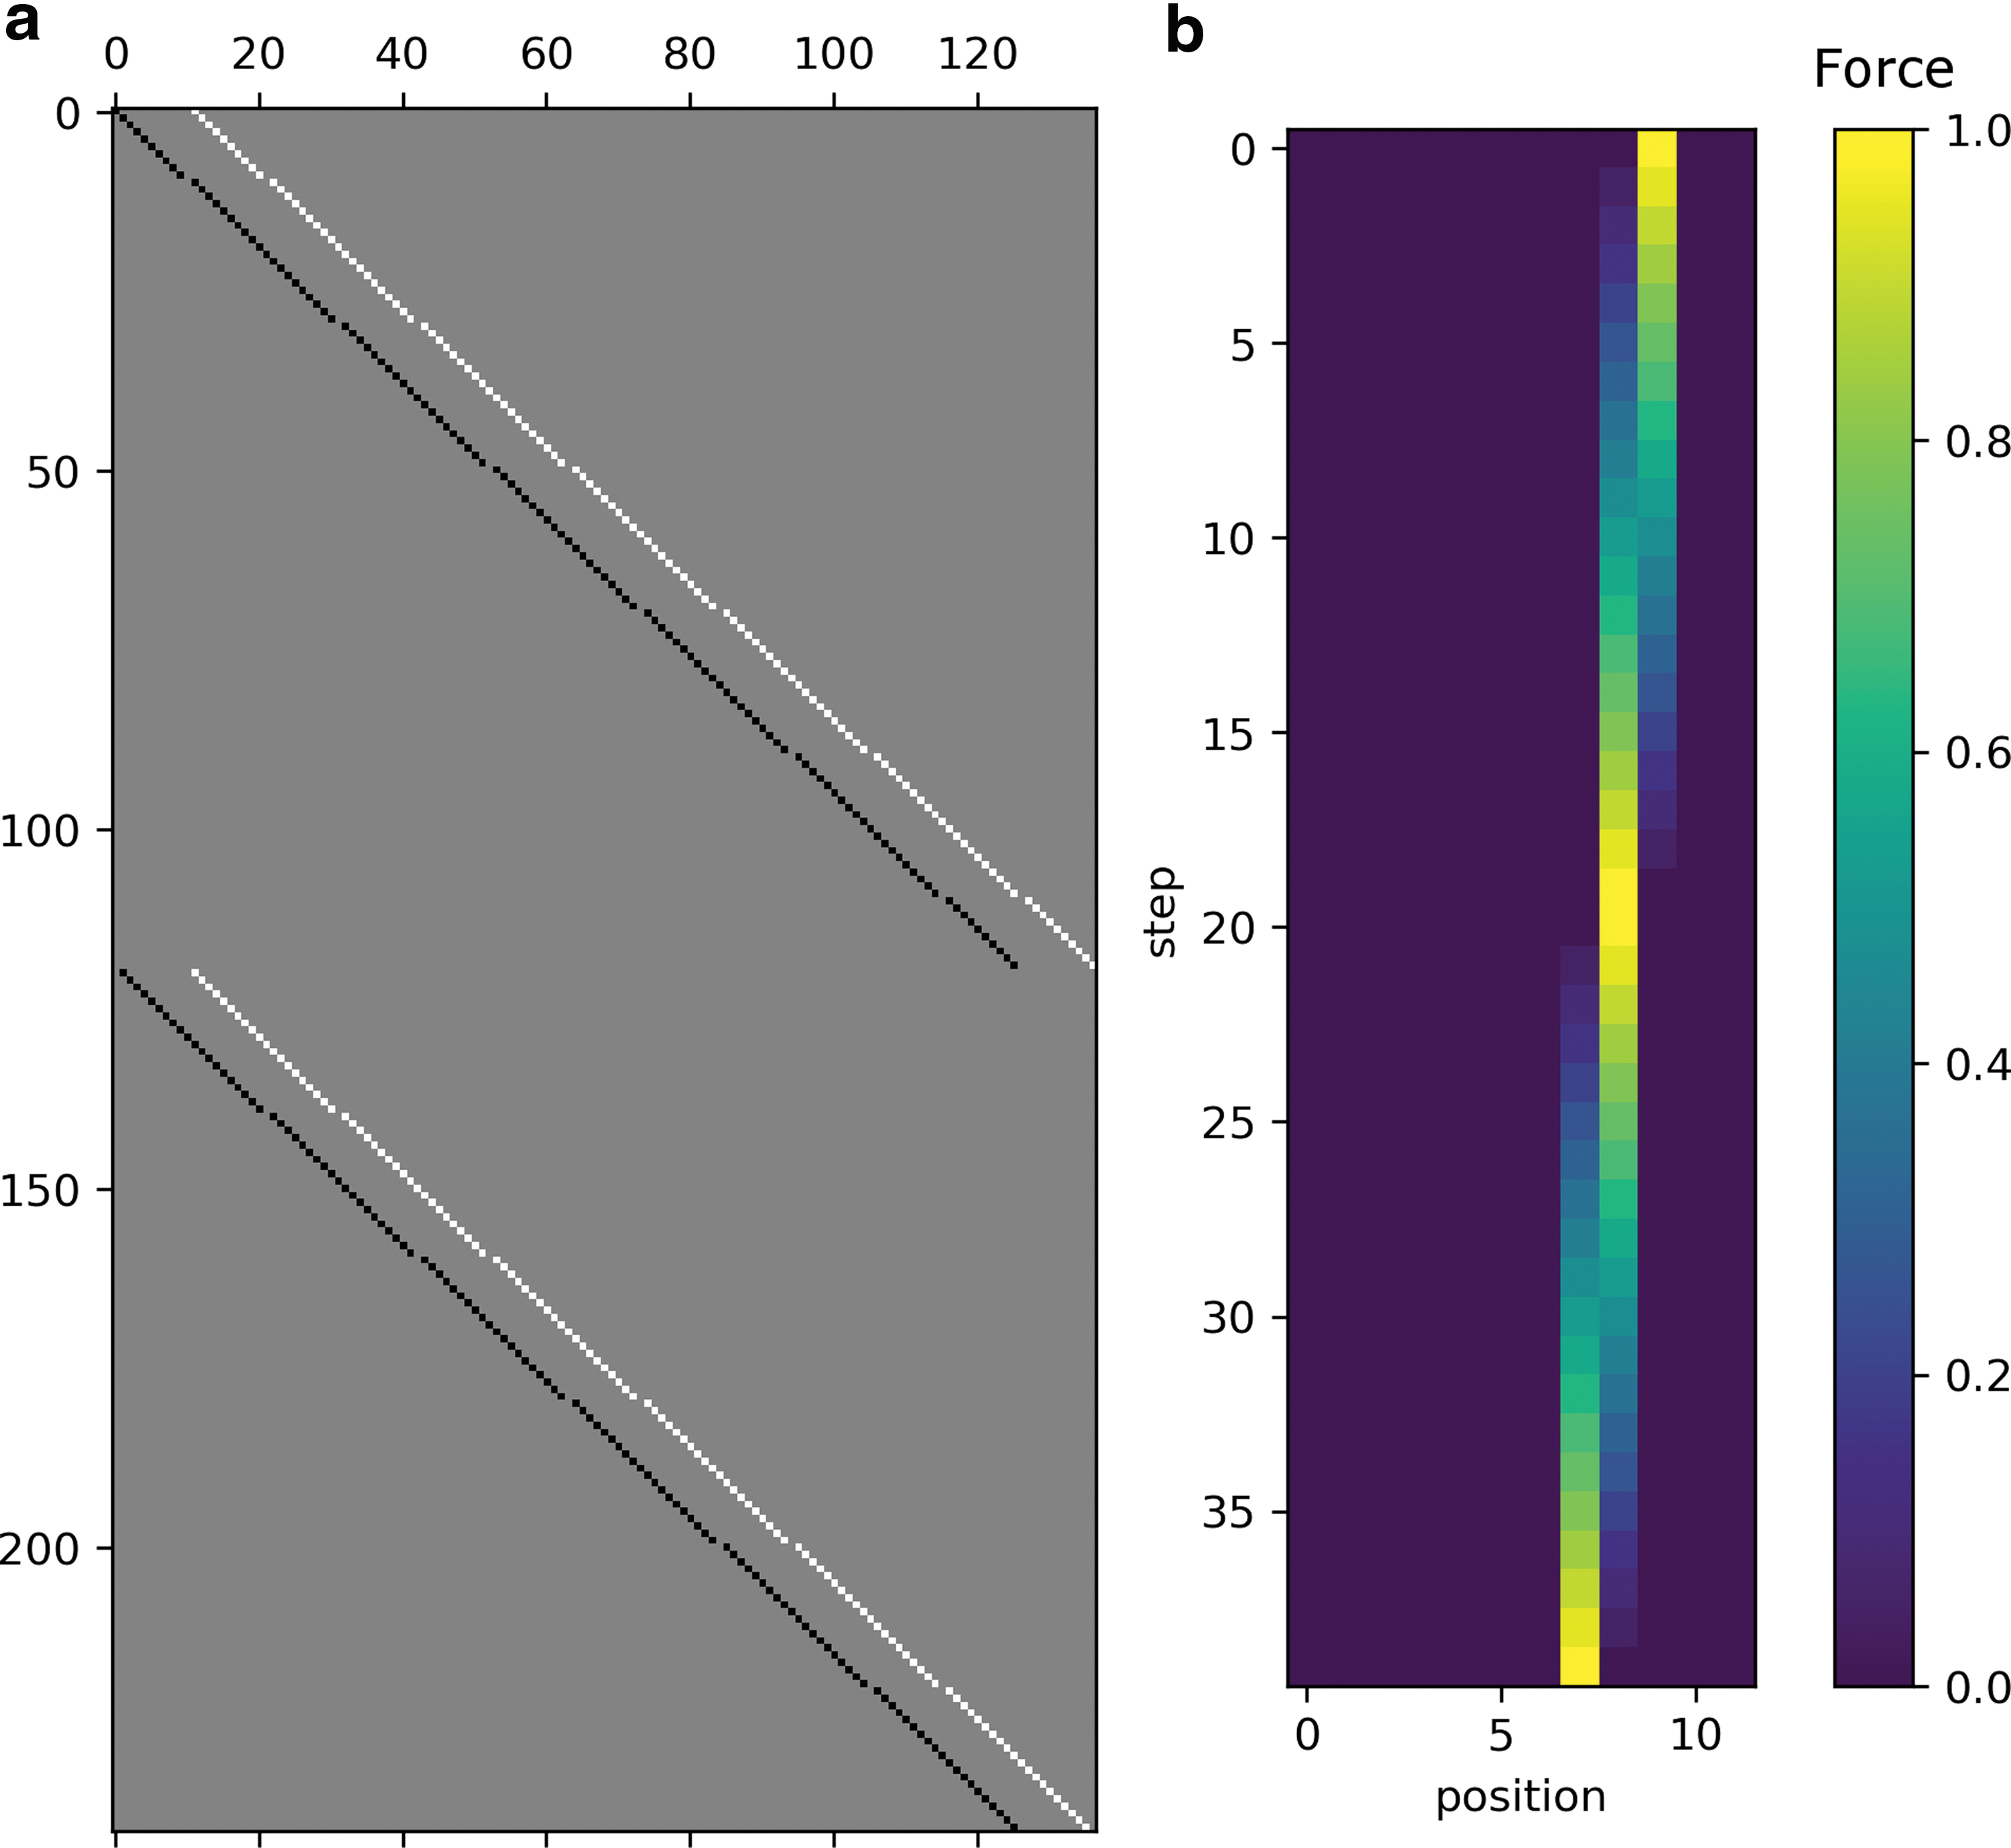
The ratio between the stiffness factor C1 and the stiffness factor C2 is the only factor influencing the strain distribution. The simulation result shows that when a point force is exerted on the top surface of this lattice, the distribution of strain is controlled by this ratio. Because C1 is related to the deflection of struts and C2 is related to the dilation of struts, we call this ratio D/E. It is apparent that the strain is more distributed underneath the surface when the struts are more easily deflected than compressed/stretched.
To illustrate the effect of plastic deformation without the involvement of the plastic behavior of the material, a simple routine was used to record the amount of strain that exceeded a certain threshold. Because the plastic deformation in this experiment is so small that it has little impact on the elastic behavior of the lattices, this routine can be used to estimate the distribution of plastic deformation of the lattice.
Using this routine, the plastic effect of a surface contact force similar to the wear experiment was simulated. The force used to generate this profile is shown in Figure 2b. For each step, the force profile on the surface of the lattice changed gradually from one-point contact to another, whereas the strain exceeding a limit was recorded.
Result and Discussion
Friction and subsurface morphology
The rolling contact used in this experiment results in very small friction (Fig. 3). The coefficients of friction (COF) of all three wear tests were plotted. The COF value was directly measured with the tribometer. All three lattices experienced a COF smaller than 0.1. The lattice B had a higher COF compared with the other two lattices. This could be caused by its geometric features on the surface to conform more to the geometry of the bearing. These small friction coefficients indicate that the tested specimens experienced very little tangential force.

Measured friction coefficients on three samples. Color images are available online.
The accurate measurement of geometric features from the 3D-printed lattice is important in assessing the influence of the geometric factor of the lattice. However, the 3D printing process was known to produce an inaccurate size of struts that deviate from the input CAD files. In this article, the dimension of lattice geometry was measured from the data collected in the CT scan.
There are three steps in data processing to evaluate the geometric parameters: First, compute average images of the struts to eliminate the variation of individual struts. Second, calculate the effective strut length. And third, find the diameter of the struts. The first step was achieved by averaging every projected image of struts under the subsurface region. The result of this averaging is shown in Figure 4. The reason why averaging the image was performed before any calculation was to avoid the strut's surface roughness influencing the result. The second step was to find the region of struts that is susceptible to bending. We can achieve this by finding the “slim” region of the strut between nodes. In Figure 4 column 2, the edge of the struts is shown as black lines. This edge was calculated by a simple threshold method. Integrating the image after thresholding over the y-axis, we can calculate the distance between those two edges:
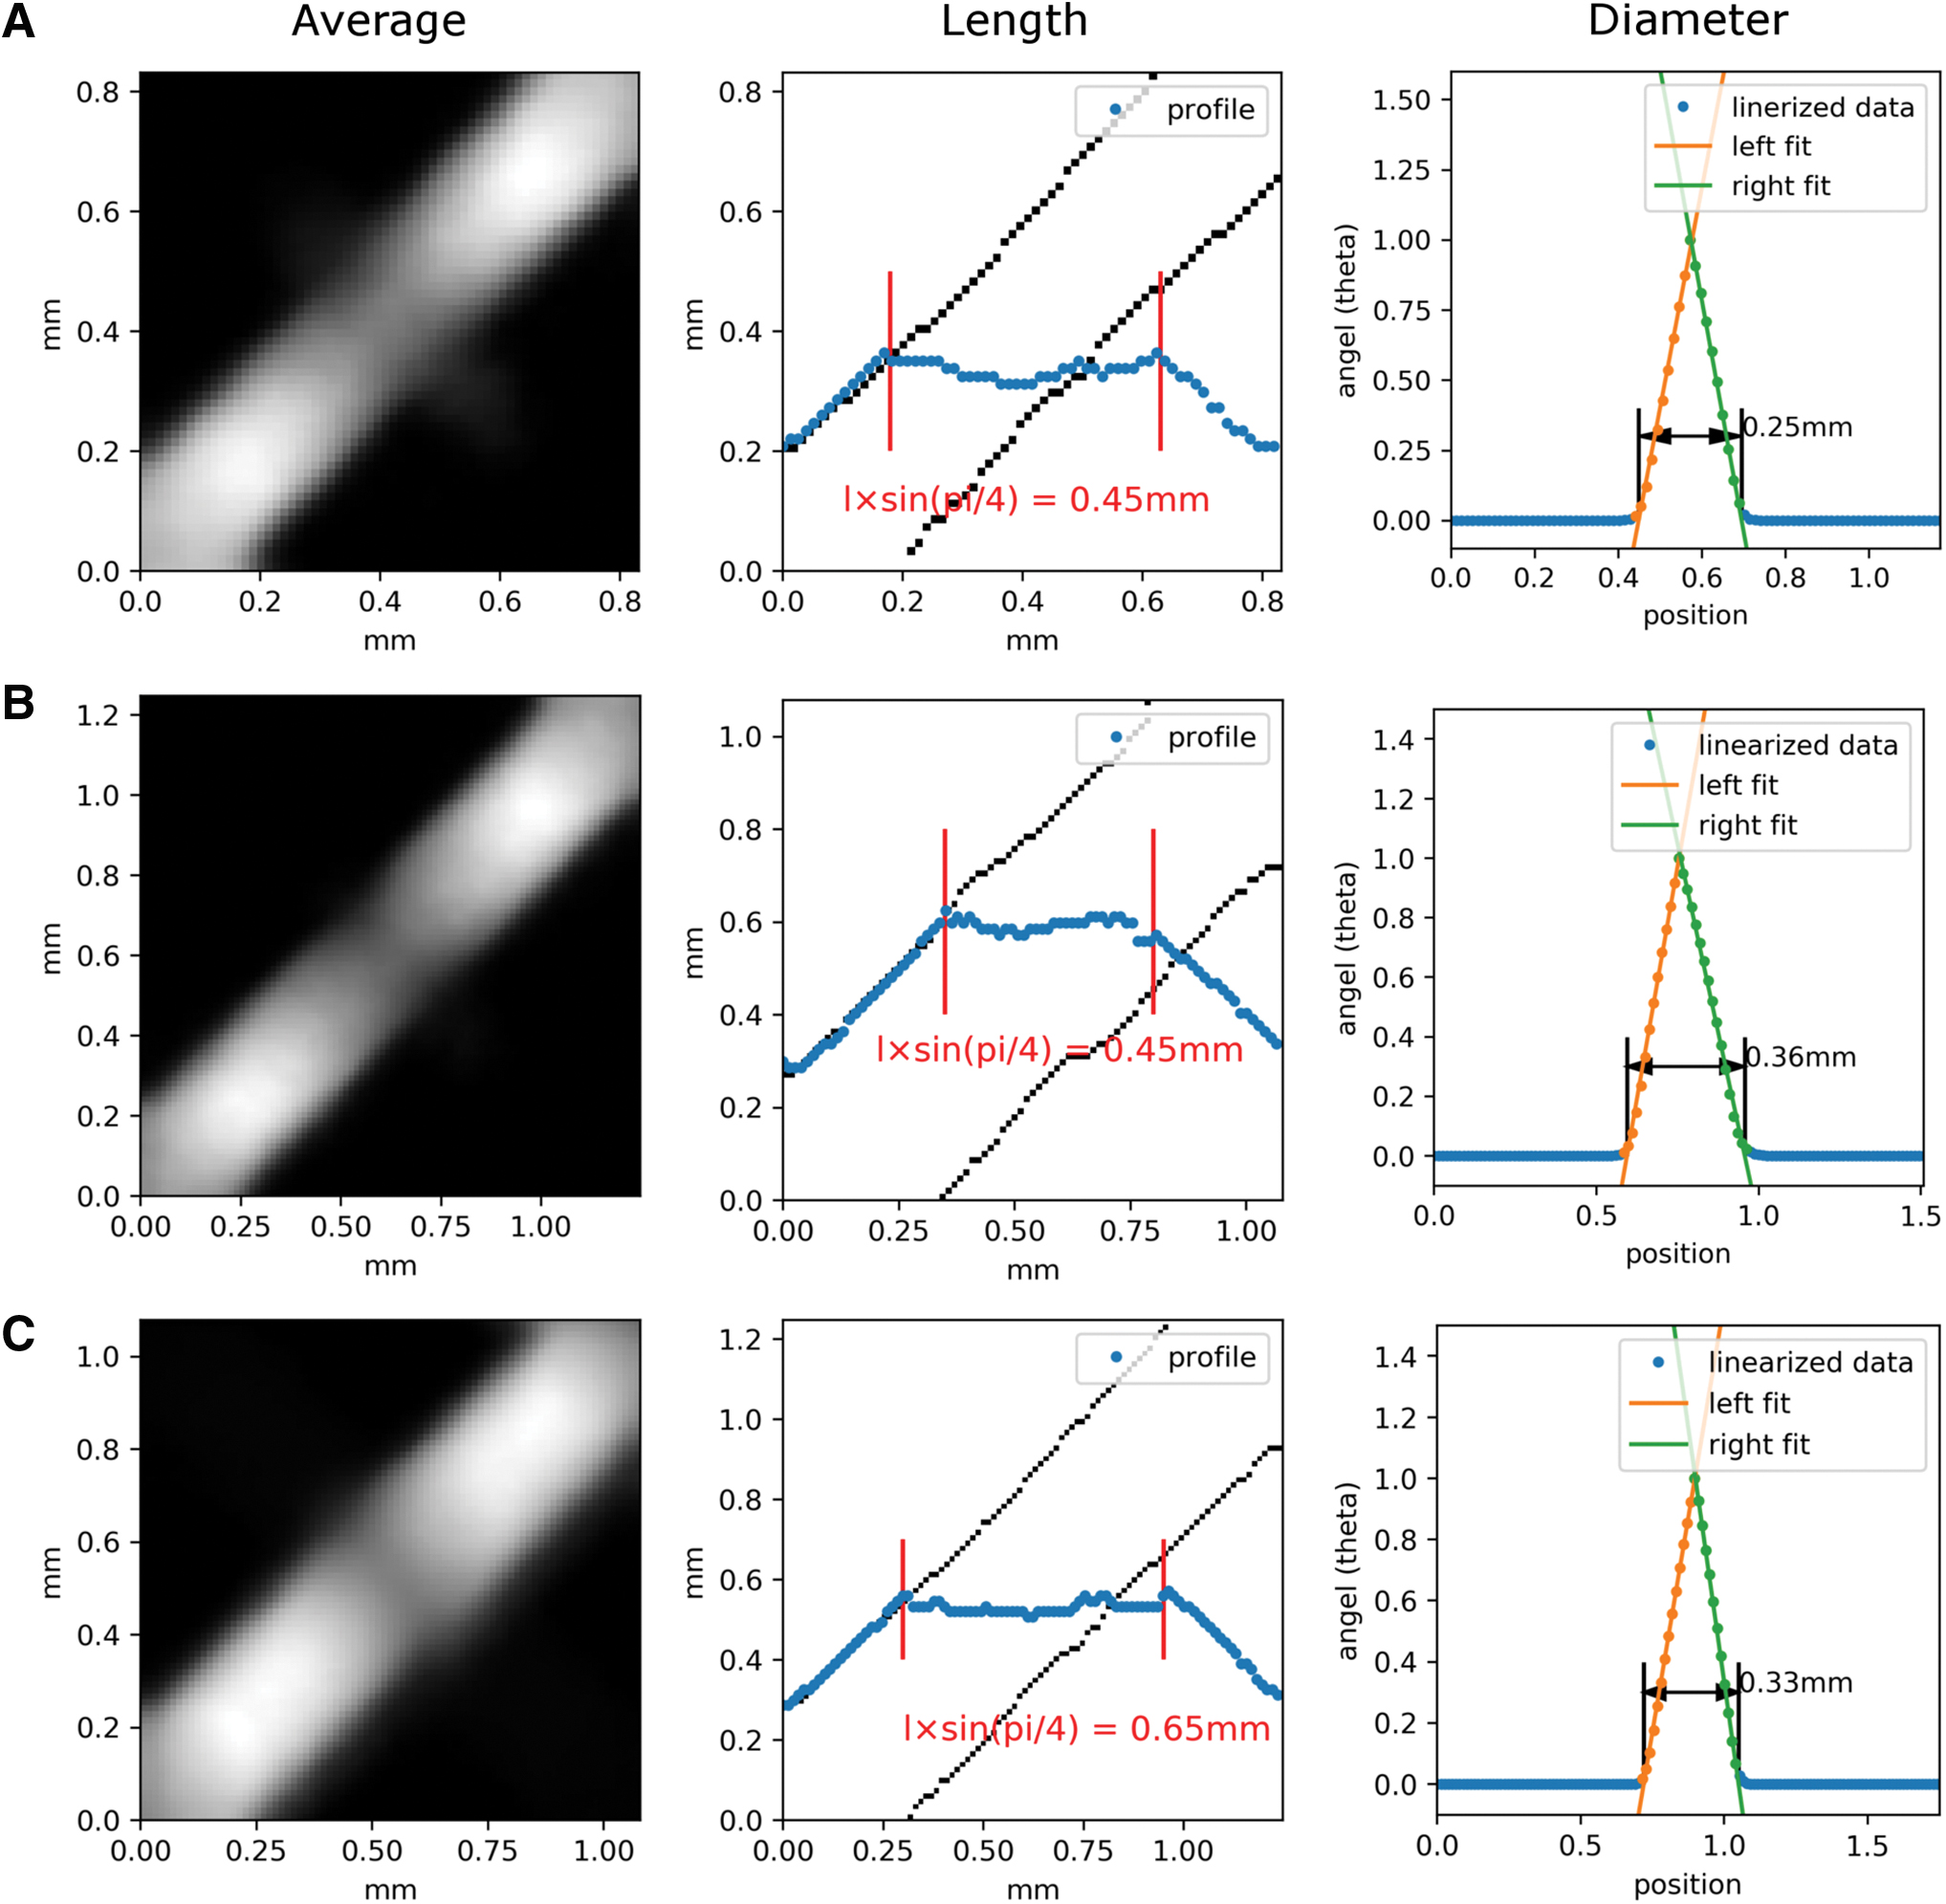
The evaluation of geometric parameters of printed lattices.
where z1 is the size of an image, and I is the intensity of the image. The resulted function d has two tilted regions and one plateau. The length of the plateau times the
This transformed profile is plotted in the third column of Figure 4. Because of this transformation, the edge of the projected sections becomes two straight lines. Using linear regression, we can find the intersection of those two straight lines. The diameter of the strut is the distance between those two intersections. The result of this calculation is summarized in Table 3 in the Deformation of lattice structures section.
Geometric Parameters Measured from the CT Scan Data
Deformation of lattice structures
The deformation caused by wear is too small to be directly observed with the naked eye. To characterize the shape change caused by the strain, the degree of deformation needs to be calculated. The lattice used in this research can be divided into repeating structures containing two v-shaped struts (Fig. 5). Those two struts are opposing each other at a 90° angle. Under plastic deformation, those two will rotate against each other. Thus, the intensity of deformation can be characterized by the relative rotation between those two adjacent struts.
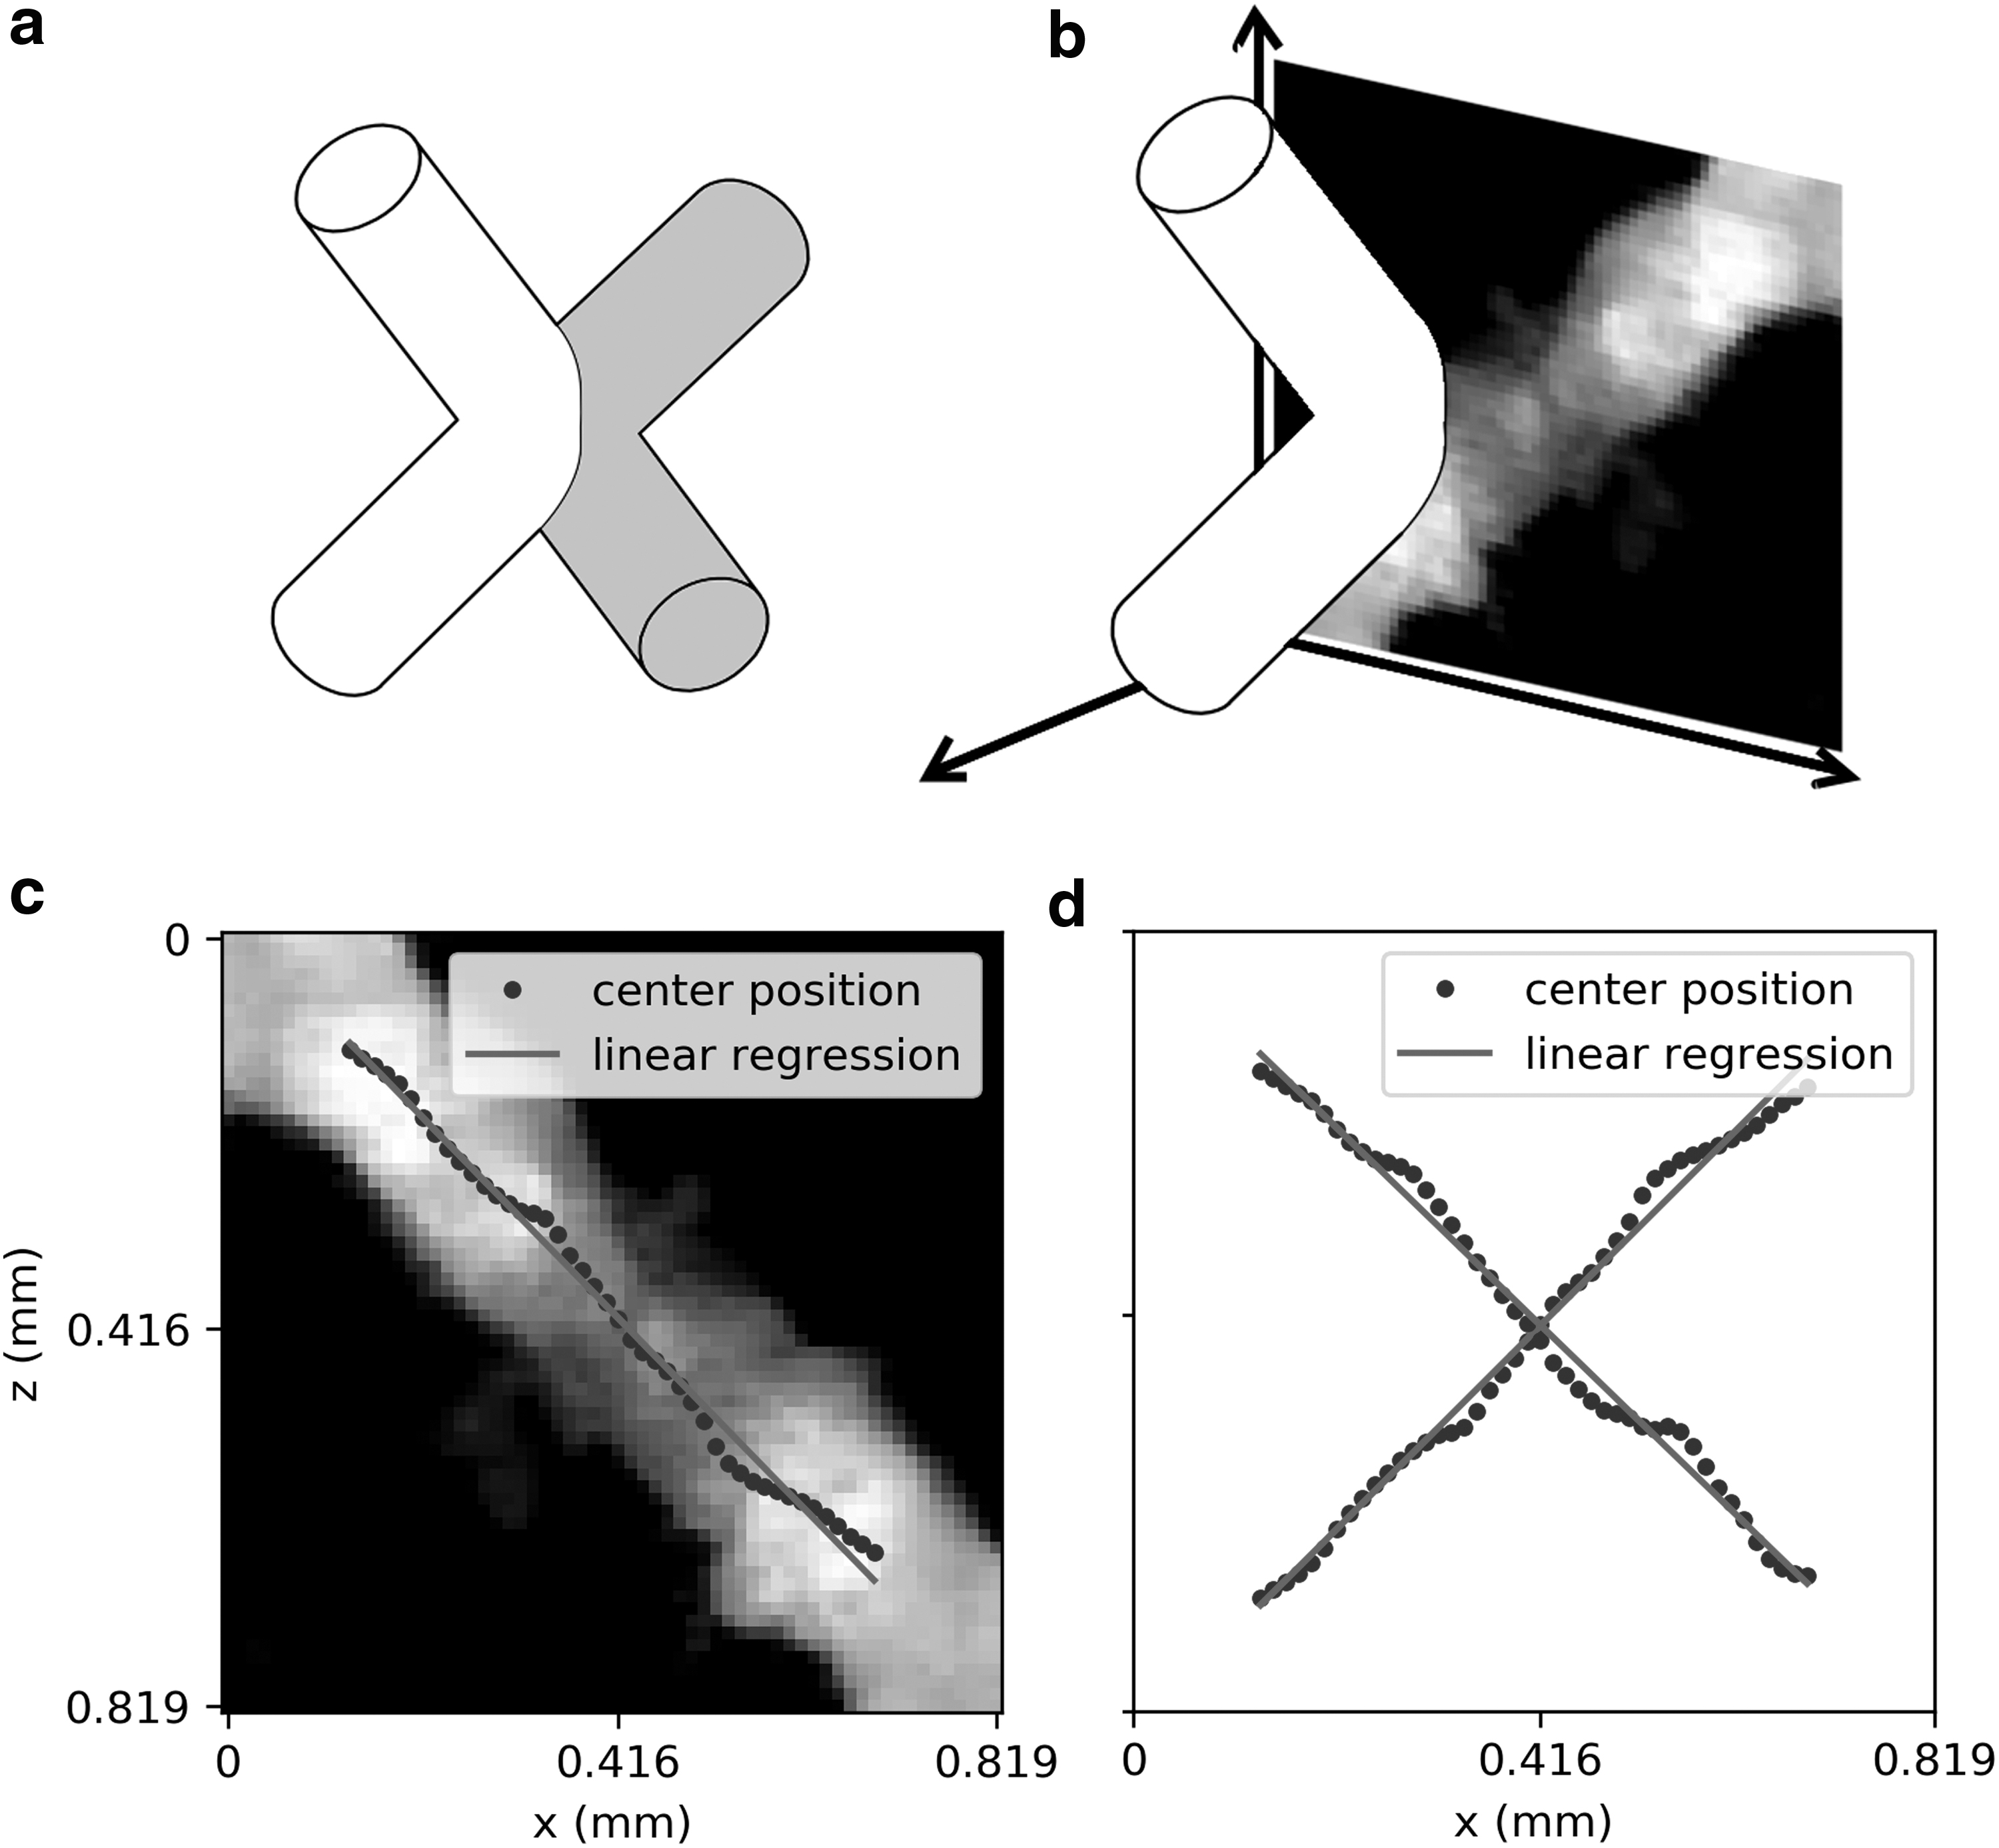
Data process procedure.
The first step of calculation was to determine the position of the strut from the μ-XCT data. The μ-XCT data could be treated as the density D(
One of the results of the calculation is shown in Figure 4. From this projection of density distribution, the centerline of this strut on the x-z plane was calculated by:
However, this centerline could not directly be used to calculate the plastic strain in the lattice, and the relative change between four adjacent struts was calculated. Because of the surface roughness and unevenness in thickness of the component, the calculated results were not a perfectly straight line (Fig. 5c). This is likely caused by surface roughness. To eliminate this influence, a linear regression was performed on the calculated centerline. The angle between the four adjacent struts (Fig. 5a) was calculated through these fitted straight lines (Fig. 5d). The angle before the wear process was already known to be 90°. By comparing this calculated angle with the 90°, the amount of relative deformation was quantified by a simple equation:
Subsurface deformation underneath the contact was observed in all three specimens (Fig. 6). In these figures, the deformation value calculated by Equation (6) for each unit was superimposed on each unit of the specimen. A Gaussian blur filter was applied to the color map to illustrate the continuity of the deformation field. Lattice A had a subsurface deformation that was distributed about 3 mm under the surface; lattice B had a moderate degree of subsurface deformation; and lattice C had almost no subsurface deformation.

The printed lattice under the wear track. The image was the projected 3D image of the units underneath the wear track (x-z plane). The red rectangle marked the wear track position. The calculated relative deformation [as defined by Eq. (6)] was plotted on top of the image projection as the color.
One possible reason for the variation in subsurface deformations was the difference in mechanical properties of the consisting units between three types of lattices. The material itself had identical mechanical properties. The only difference was the geometric parameters of the printed structure. These lattices were constructed by struts with different aspect ratios, which are the ratios between the diameter of the struts and the length of the struts. This ratio can directly correlate to the ratio between the stiffness of dilation and deflection. Consider those struts as Euler-Bernoulli beams with both ends fixed, the stiffness of dilation is proportional to
Another factor we need to consider is the change in yield stress. In the case of dilation, the force to cause plastic deformation to an individual strut is proportional to
The geometric factors of these three lattices are different. To obtain accurate geometric measurements, an image processing routine (Friction and Subsurface Morphology section) was used to access the geometric parameters. The result of the measurement and calculated deformation factors is listed in Table 2. Lattice A will have more distributed elastic strain compared with lattice B. Thus, it has a larger subsurface deformation. Lattice C would have a similar elastic subsurface deformation; however, it would be harder to plastically deform, resulting in a more subtle deformation compared with lattice A.
An FEM simulation was performed to illustrate the influence of these geometric factors (Fig. 7, details of the simulation in A Computational Model to Quantify Subsurface Damage Related to Wear section). This figure shows the four lattices with different geometric factors under a contact condition such as tribotests performed on the specimens. The specimen with low yield stress and strut aspect ratio has larger subsurface deformation; however, when either factor increases, the subsurface deformation decreases. This result has good agreement with the μ-XCT observation. This agreement illustrated that the key factor influencing the subsurface deformation of the 3D-printed lattice under sliding contact was the aspect ratio of the struts. A lattice with small aspect ratio struts will more easily plastically deform in the subsurface region, whereas a lattice with a large aspect ratio of struts will have the deformation concentrated near the surface.
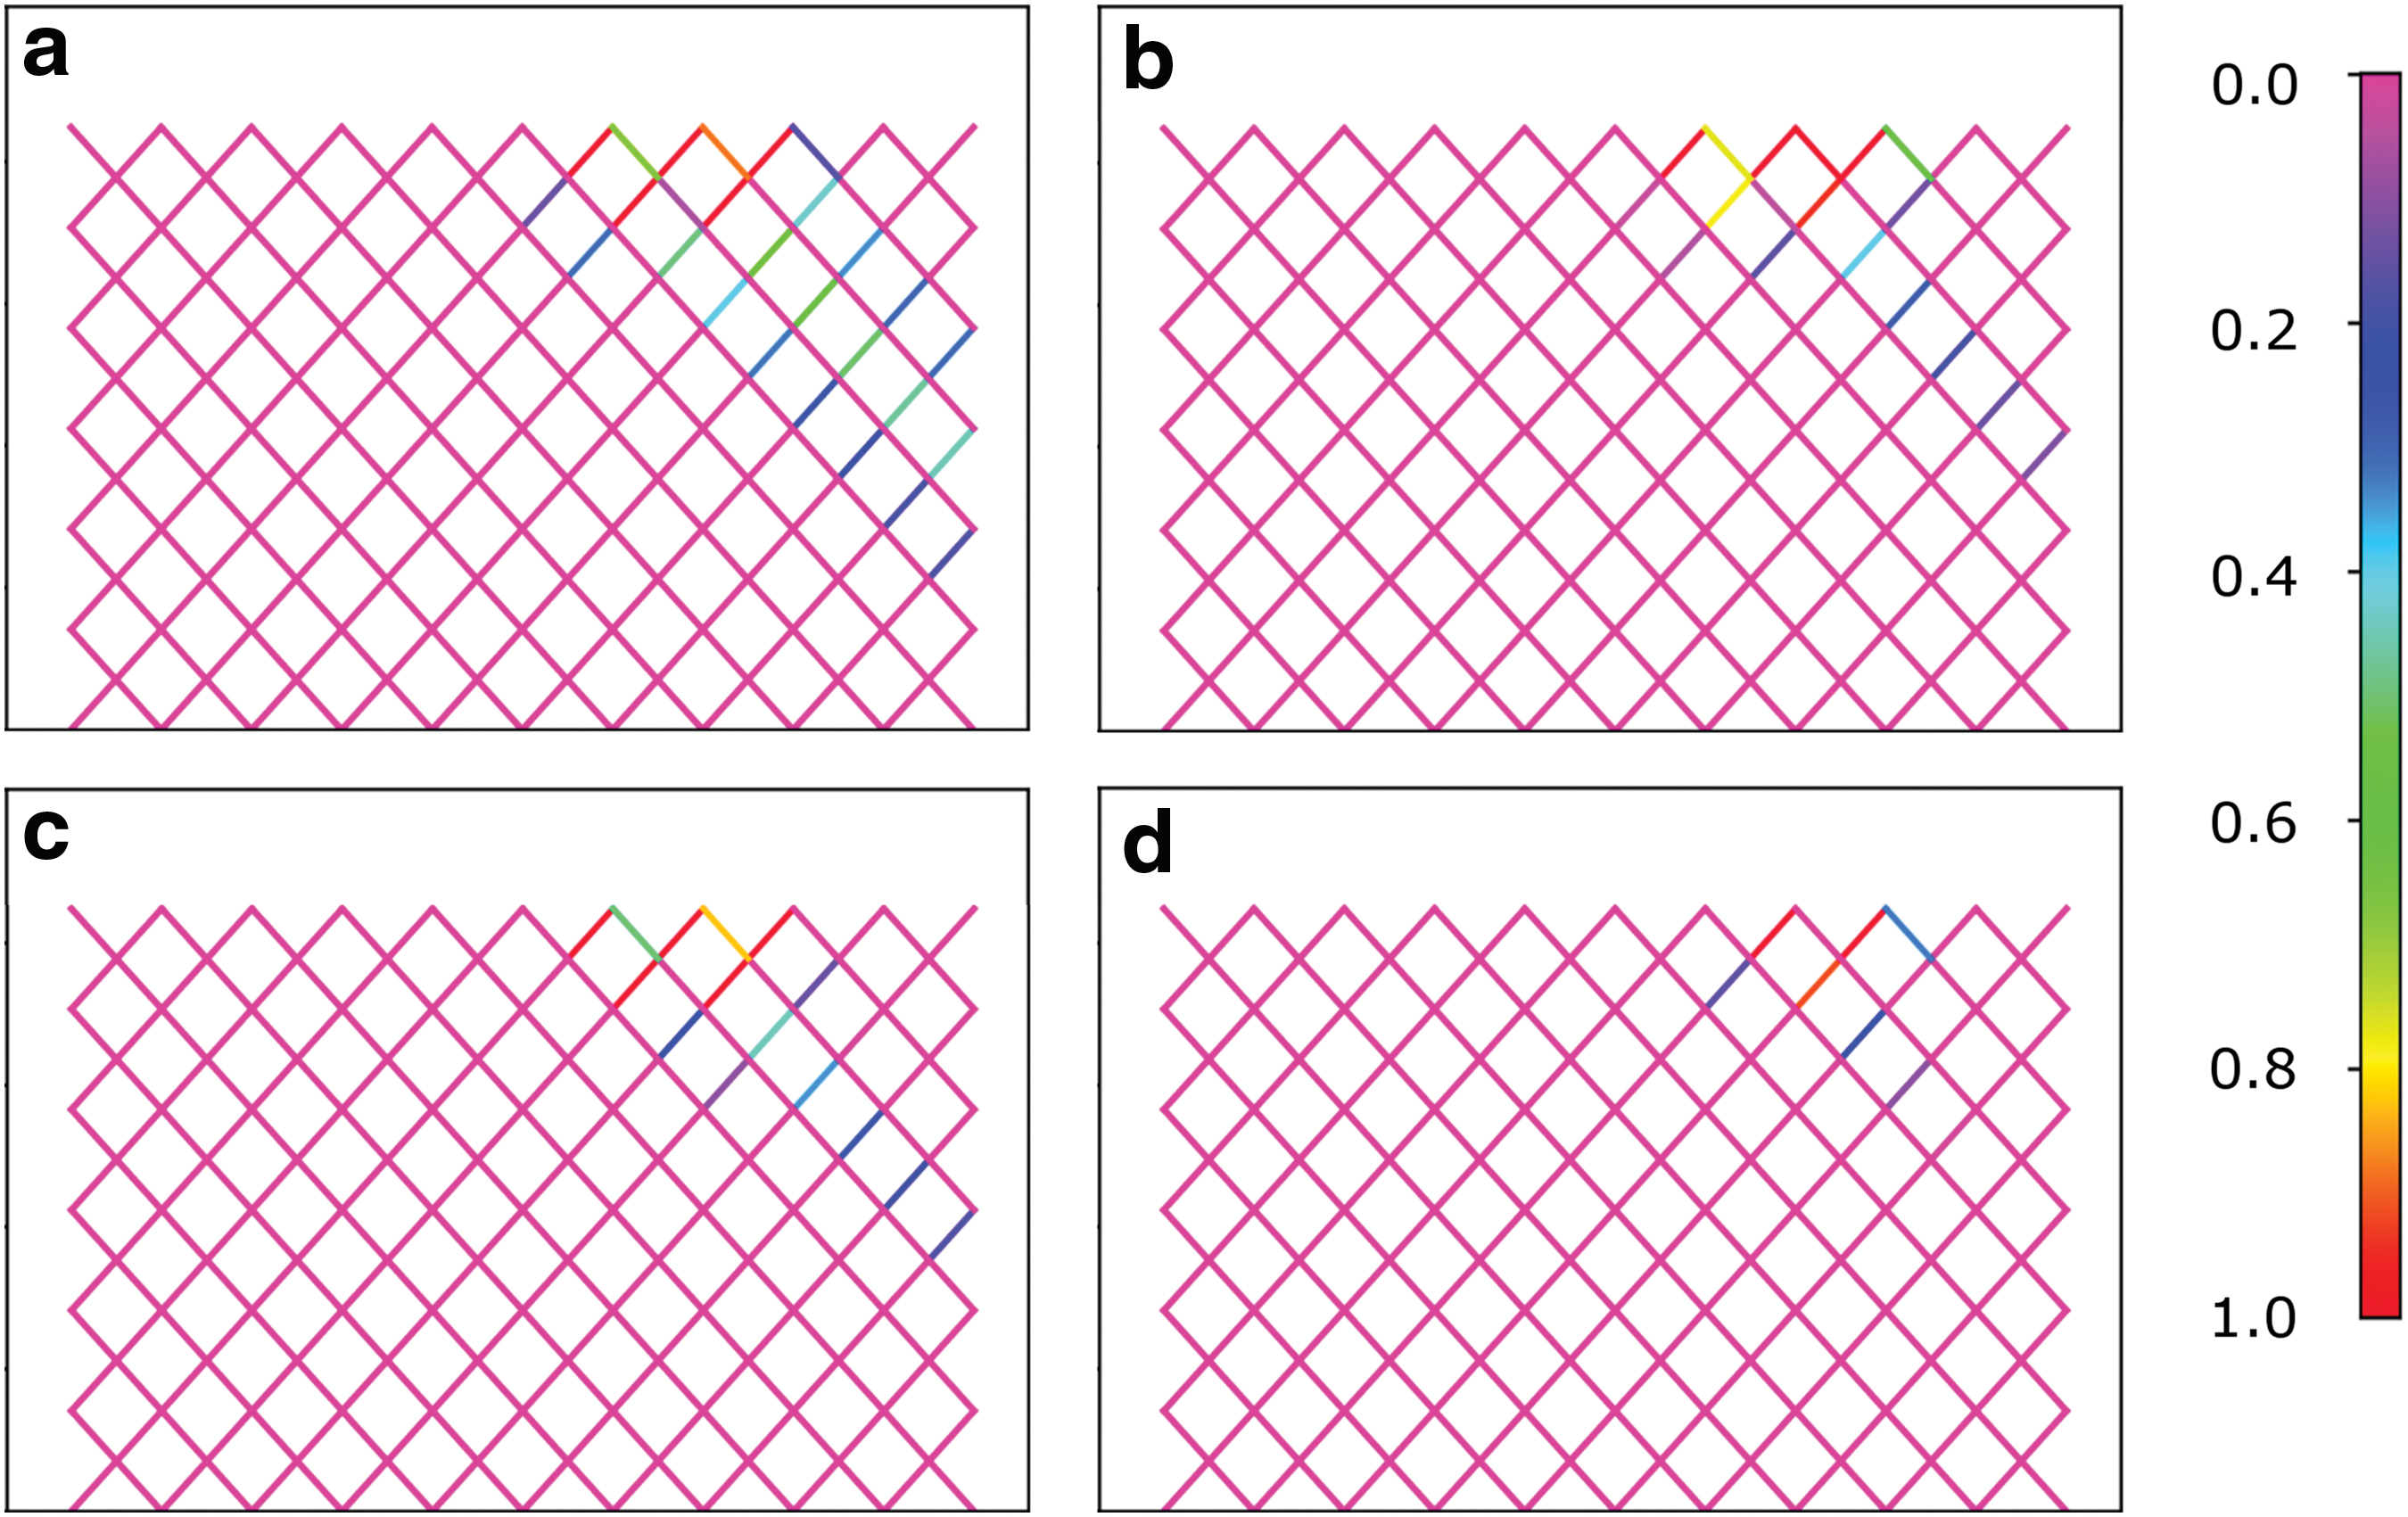
Simulated result from a 2D scaffolding. The color shows the amount of strain that was normalized by the maximum strain in the lattice.
Conclusions
To understand the initiation of subsurface failure of the 3D-printed Al-Si lattice due to rolling contact, we investigated the deformation of a strut. Experimental characterization was conducted by using μ-XCT tomography combined with finite element analysis. Results displayed that due to rolling contact, the plastic deformation region changed with dimensional parameters of the strut. Two factors were identified to have an influence on the lattice mechanical behavior, the strut aspect ratio, and the relative diameter of struts. The plastic strain tends to concentrate on the surface of the specimen when their values increase. When the aspect ratio of a strut is smaller than 0.5, the plastic deformation is distributed in the subsurface region and when larger than 0.5, the deformation concentrates on the top layer of the struts. This research revealed that using a lattice structure with struts having a small diameter and lower strut aspect ratio could prevent stress concentrated on the top layer of lattices, thus providing better performance.
Footnotes
Author Disclosure Statement
No competing financial interests exist.
Funding Information
This research is self-funded.