
Abstract
Additive manufacturing (AM) enables the fabrication of lattice structures with optimal mechanical, fluid, and thermal properties. However, during the AM fabrication process, defects are produced in the strut and node elements, which comprise the lattice structure. This leads to discrepancies between the AM fabricated lattice and its idealized computer-aided design (CAD) model, negatively affecting the ability to predict the mechanical behavior of the fabricated lattice via numerical models. Current research is focused on quantification of geometric uncertainties in the strut elements of the lattice; as-manufactured node geometries remain relatively unexplored on an individual scale, despite their criticality to the mechanical response of the structure. Understanding the geometrical properties of as-manufactured nodes relative to CAD idealizations can be used to improve lattice designs and numerical models. In this research, X-ray microcomputed tomography (μCT) is used to analyze and quantify the as-manufactured nodal geometry, found in face-centered cubic and face-centered cubic with axial struts lattices fabricated via selective laser melting. A custom tool is developed that enables auto-isolation and classification of nodal joints from μCT-derived cross-sectional slices. Geometrical properties are extracted from the isolated nodal cross sections and compared with their idealized CAD model counterpart. Quantification of geometrical defects provides insight into how nodes within an AM lattice structure differ from each other and their idealized design. Overall, this research is an initial step toward developing accurate and efficient numerical models, as well as better node design for AM.
Introduction
Metal additive manufacturing (MAM) processes, such as selective laser melting (SLM) and electron beam melting (EBM), can be used to fabricate components with lattice-structured architecture. This enables further customization of the components: stiffness, strength, energy absorption characteristics, as well as thermal and acoustically insulative properties.1–3 MAM lattice-structured components can be utilized in a range of applications from simplistic weight-saving structures to complex conformal orthopedic implants.4–6 Lattice structures refer to a type of cellular solid, which consists of a network of intersecting struts or plates. More recently, triply periodic minimal surfaces7,8 are also included in the discussion of additive manufacturing (AM) lattice structures. In this research, the term lattice structure refers to those strut based. These lattices can be broadly categorized as being periodic or stochastic. The former (periodic lattice) describes a structure based of repetitions of a unit cell topology or strut arrangement, whereas a stochastic lattice typically refers to a structure that has been designed or produced using a stochastic process. 9
The mechanical response of a lattice structure is determined by its design and can be classified as bending- or stretch-dominated. Bending-dominated lattices exhibit relatively low strength and high compliance, and conversely, stretch-dominated lattices exhibit high strength and low compliance. The low structural efficiency associated with bending-dominated lattice structures can be attributed to their deformation behavior, as applied loads induce bending moments at nodes. Conversely, stretch-dominated lattices achieve high structural efficiency via induced tensile or compressive loads in struts.10,11
Fabrication of lattice structures via powder bed fusion processes (SLM, EBM) relies upon the solidification of a melt pool in a bed of metallic powder.
12
This process produces defects and discrepancies between the desired and fabricated lattice geometries. Some of the factors associated with the MAM process that produces these defects are as follows:
Inconsistencies in melt pool solidification.
13
Melt pool solidification is a complex highly transient thermal-fluid event that dictates the behavior of the melted metallic powder particles during the build process as well as the fabricated geometry. Other factors that also impact melt pool dynamics and associated defects are processing parameters such as scan speed and heat source power, as well as neighboring temperature fields and previously fused geometry. Powder morphology and material.
14
The behavior of the powder particles during energy deposition and subsequent melt pool formation depends on the powder particles: thermal diffusivity and contact resistance, proximity to the melt pool, and powder morphology. These factors dictate if a particle is absorbed by the melt pool, partially melts to the bulk geometry, or remains solid and unattached. Desired geometries' surface orientation.
15
Fusion of partially melted particles and the fabricated component surface roughness is dependent on the desired orientation of the part's surface in the build chamber. With downward-facing or “down skin” surfaces having a relatively higher surface roughness and amount of partially melted particles as a result of being supported by the powder bed. Stairstepping effect.
16
The inherent loss of geometric resolution in AM processes as a result of discretization of the desired geometry into cross-sectional layers for fabrication. It results in a visually regular pattern in the build orientation and is intensified by overhanging geometries with acute angles to the build platform as well as large layer thicknesses. Slumping.17,18 The term “slumping” describes the melt pools spread laterally or toward the powder bed and is mainly due to gravitational forces. This not only distorts the shape of the melt pool and the subsequently solidified geometry, but it also causes undesired contact with powder particles below the melt pool, therefore increasing the melt pool size. Balling.12,19 The phenomenon that causes a molten track or pool of material to separate and form spheres. Balling leads to high surface roughness and in some cases porosity, therefore causing a discrepancy between the as-designed and as-manufactured components. The cause of balling is attributed to poor wetting of the substrate, and consequently, spheres form by the mechanism of surface tension. Balling is still a complex phenomenon, as it is the culmination of physical, chemical, and laser interactions.
Other defects such as porosity may also be produced during the SLM process. 20 These factors all combine to make the simulation of the SLM process and subsequent prediction of a fabricated lattice geometry computationally intensive. 21 Alternatively, geometrical defects and discrepancies in AM lattices can be accounted for in design processes via the development of design for additive manufacturing (DfAM) tools.
A straightforward method of developing DfAM tools is the statistical analysis and characterization of defects in fabricated lattices. These methods typically include the use of image-based measuring techniques, such as microcomputed tomography (μCT) and scanning electron microscopy (SEM), or physical measuring tools such as Vernier calipers. Gorguluarslan et al. 22 used a combination of μCT reconstructions and digital Vernier calipers to measure “short” and “long” diameters, fabricated angles, and porosity of struts in an SLM fabricated body-centered cubic (BCC) lattice structure. Probability distributions (lognormal, normal, and gamma) were selected and fit to the aforementioned measurements with the Bayesian information criterion method used to determine the optimal fit.
Weißmann et al. 23 used a combination of digital microscopy and 3D digital laser scanning to obtain surface quality measurements and the deviation between designed and fabricated struts manufactured via SLM and EBM. The mean and standard deviation of the fabricated struts' equivalent diameter were reported and compared with the desired strut diameter. Lei et al. 24 studied defects in SLM fabricated AlSi10Mg lattices using μCT and SEM, from μCT reconstructions of five random struts for each inclination angle within the fabricated BCC, and body-centered cubic with Z-struts (BCC-Z) lattices were selected for measurement. One hundred sixty cross sections for each strut were analyzed, and the normalized deviation of the cross-sectional radius was reported. Also discussed was the larger than designed nodal intersections in the fabricated lattices, however, no measurements were reported. Lozanovski et al. 25 measured geometric properties of Inconel 625 fabricated components, which mimicked the struts found within lattice structures. The research utilized μCT to report on the maximum and minimum principal moments of inertia, centroid deviation, and principal axis inclination angles found in cross-sectional slices of the component.
Karamooz Ravari et al. 26 reported the strut diameter probability distribution of a modified BCC-Z lattice fabricated via fused deposition modeling. Physical measurements of the fabricated struts were used to construct the probability distributions. Sing et al. 27 measured strut diameters on a square pyramid, truncated cube, and octahedron lattice structures fabricated using SLM. SEM was utilized for measurements, adhered powder particles were ignored during fabrication, and the mean strut diameter and standard deviation were reported and compared with the designed diameter. Gümrük and Mines 28 fabricated stainless steel 316L lattices via SLM and utilized the measured relative density and mass of the structure to determine the average strut diameter. du Plessis et al. 29 also reported on the statistical distributions of strut diameters in SLM fabricated Ti6Al4V lattices found via μCT.
Current research is focused on the characterization and statistical analysis of defects generated in the strut elements of fabricated lattices, as well as their inclusion in numerical models. Equivalent research on the second fundamental component of a lattice structure, the strut intersections, referred to as nodes, is relatively unexplored. However, recent research conducted by Alghamdi et al. 30 displayed the severity of these defects and the deviation of SLM as-manufactured nodes from their design. Figure 1 is a qualitative comparison of the as-designed and as-manufactured nodes from the research. In addition, Alghamdi et al. 31 also conducted further research that utilized optical microscopy for the creation of finite element models that contained the as-manufactured nodal geometry; this allowed for quantification of the effect of defects on a node's mechanical response. Figure 1 displays the regions of plasticity in the node found via finite element analysis, of both the as-manufactured node and its corresponding idealized design.
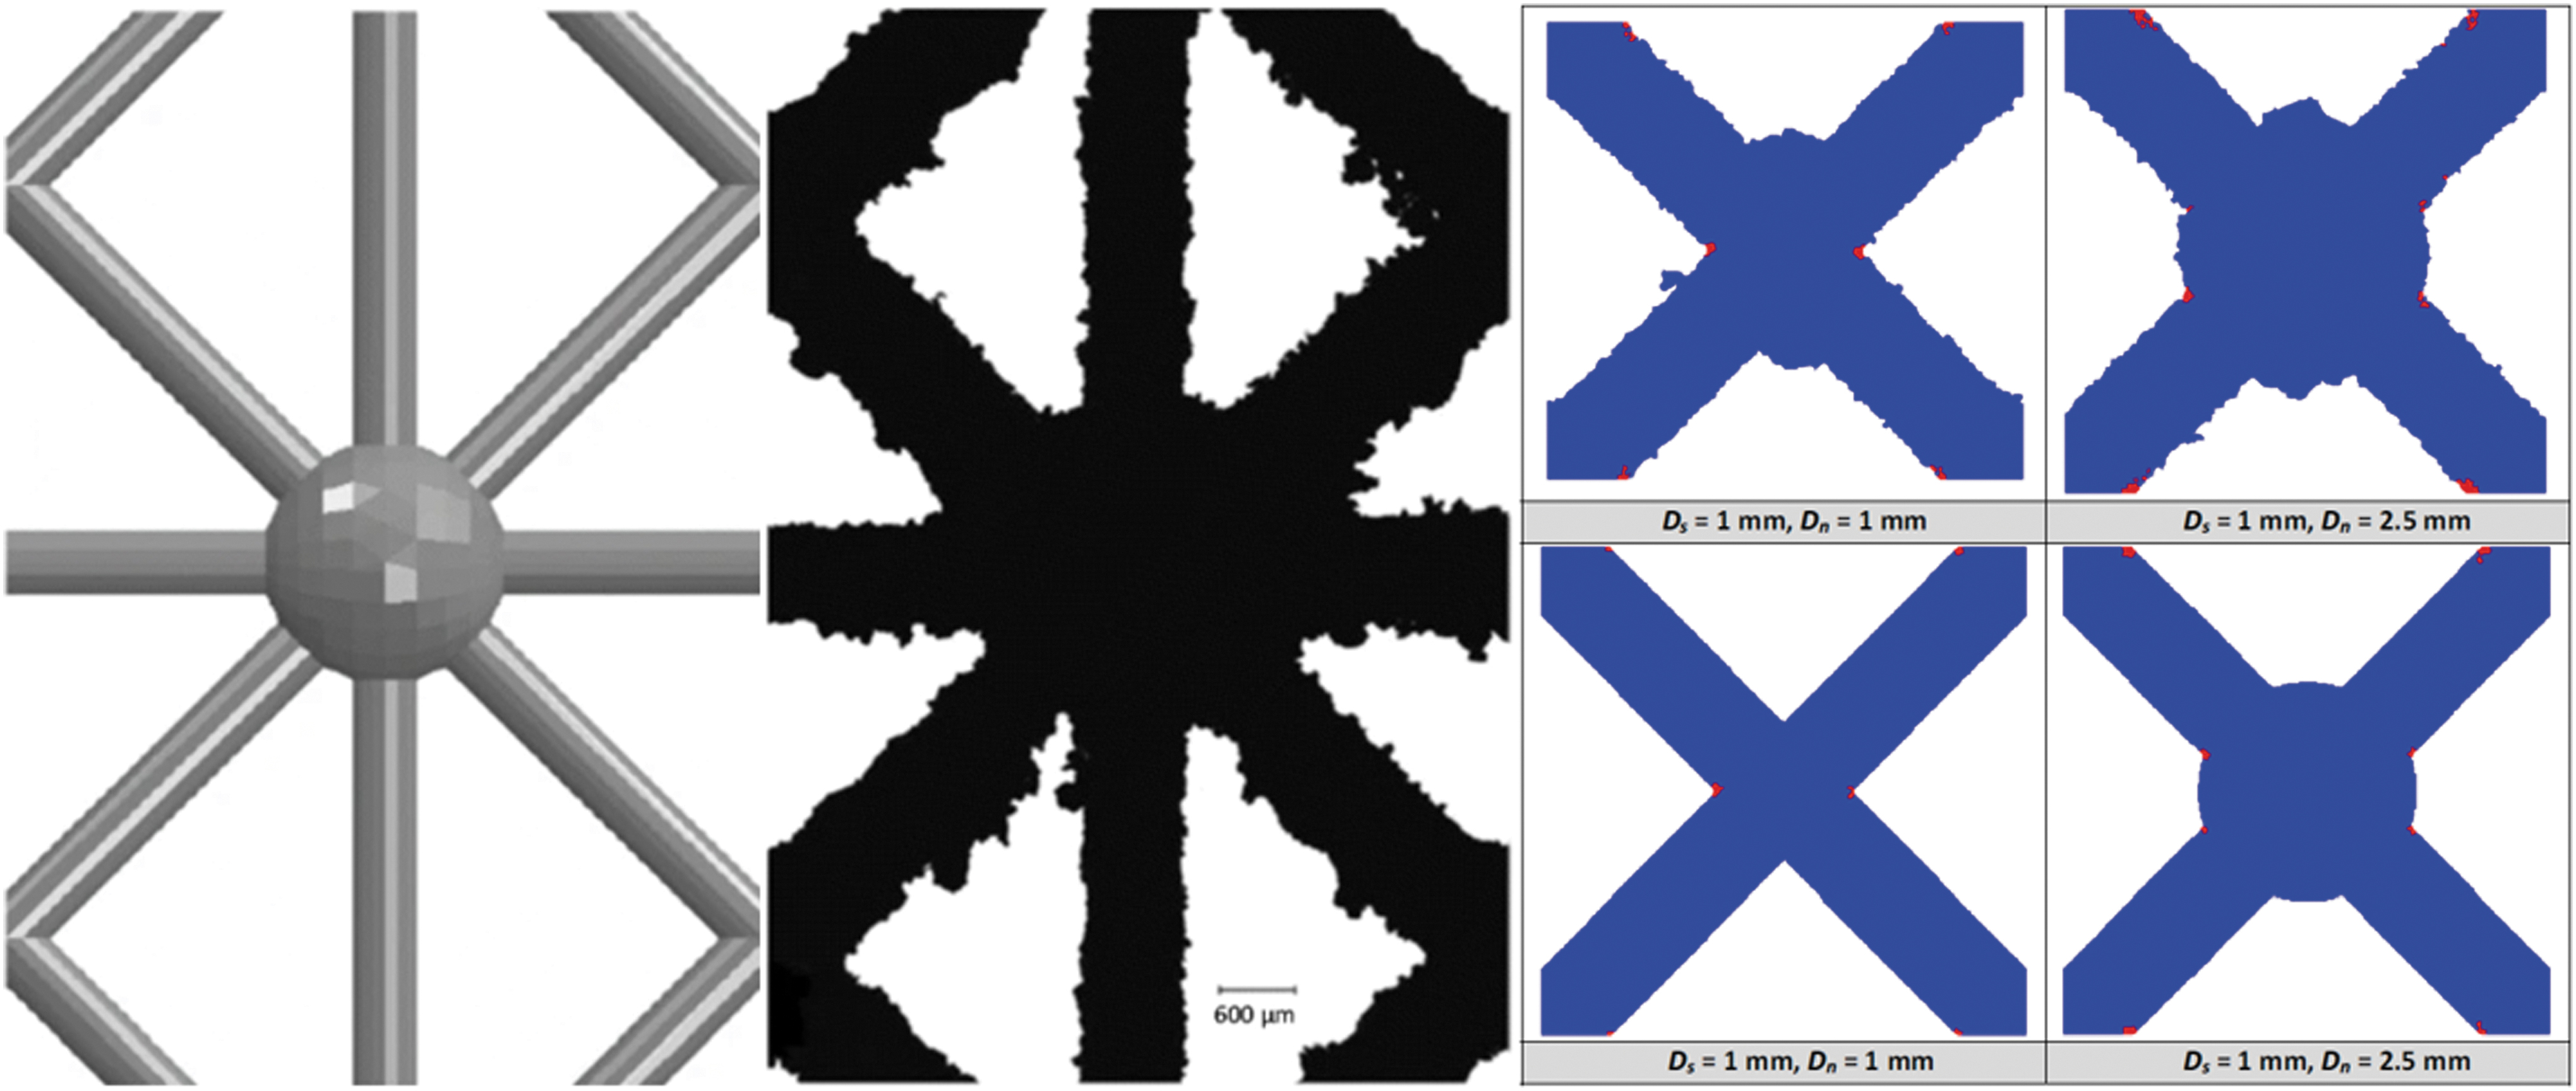
Comparison of idealized node design (left) and its corresponding manufactured geometry (middle). Also displayed is a comparison of plasticity regions in designed and manufactured nodes found by finite element analysis (right). Ds and Dn are strut and node diameters, respectively. Images are adapted from the research of Alghamdi et al.30,31 Color images are available online.
This research utilizes μCT and a custom-developed algorithm to extract and analyze the geometric properties of individual nodes in an as-manufactured lattice. The custom algorithm developed in this research is designed to separate computed tomography (CT) reconstructions of regular periodic lattice structures into their fundamental strut and node components. Not discussed in this research is the ability of the custom-algorithm to analyze the individual struts in a lattice structure. This will enable a more appropriate approach to strut characterization when compared with the single fabricated strut approach such as in the research.23,25,32,33
The lattices studied in this research are fabricated via SLM and have face-centered and face-centered cubic with axial strut (FCC and FCCZ, respectively) unit cell topologies. Nodes are classified into four different types depending on their spatial location and the number of struts. The four node types are as follows: External Lattice Corner, External Lattice Face, Cell Wall, and Internal Cell Edge nodes. Idealizations of these nodes are displayed in Figure 2, for the studied FCCZ and FCC lattices.
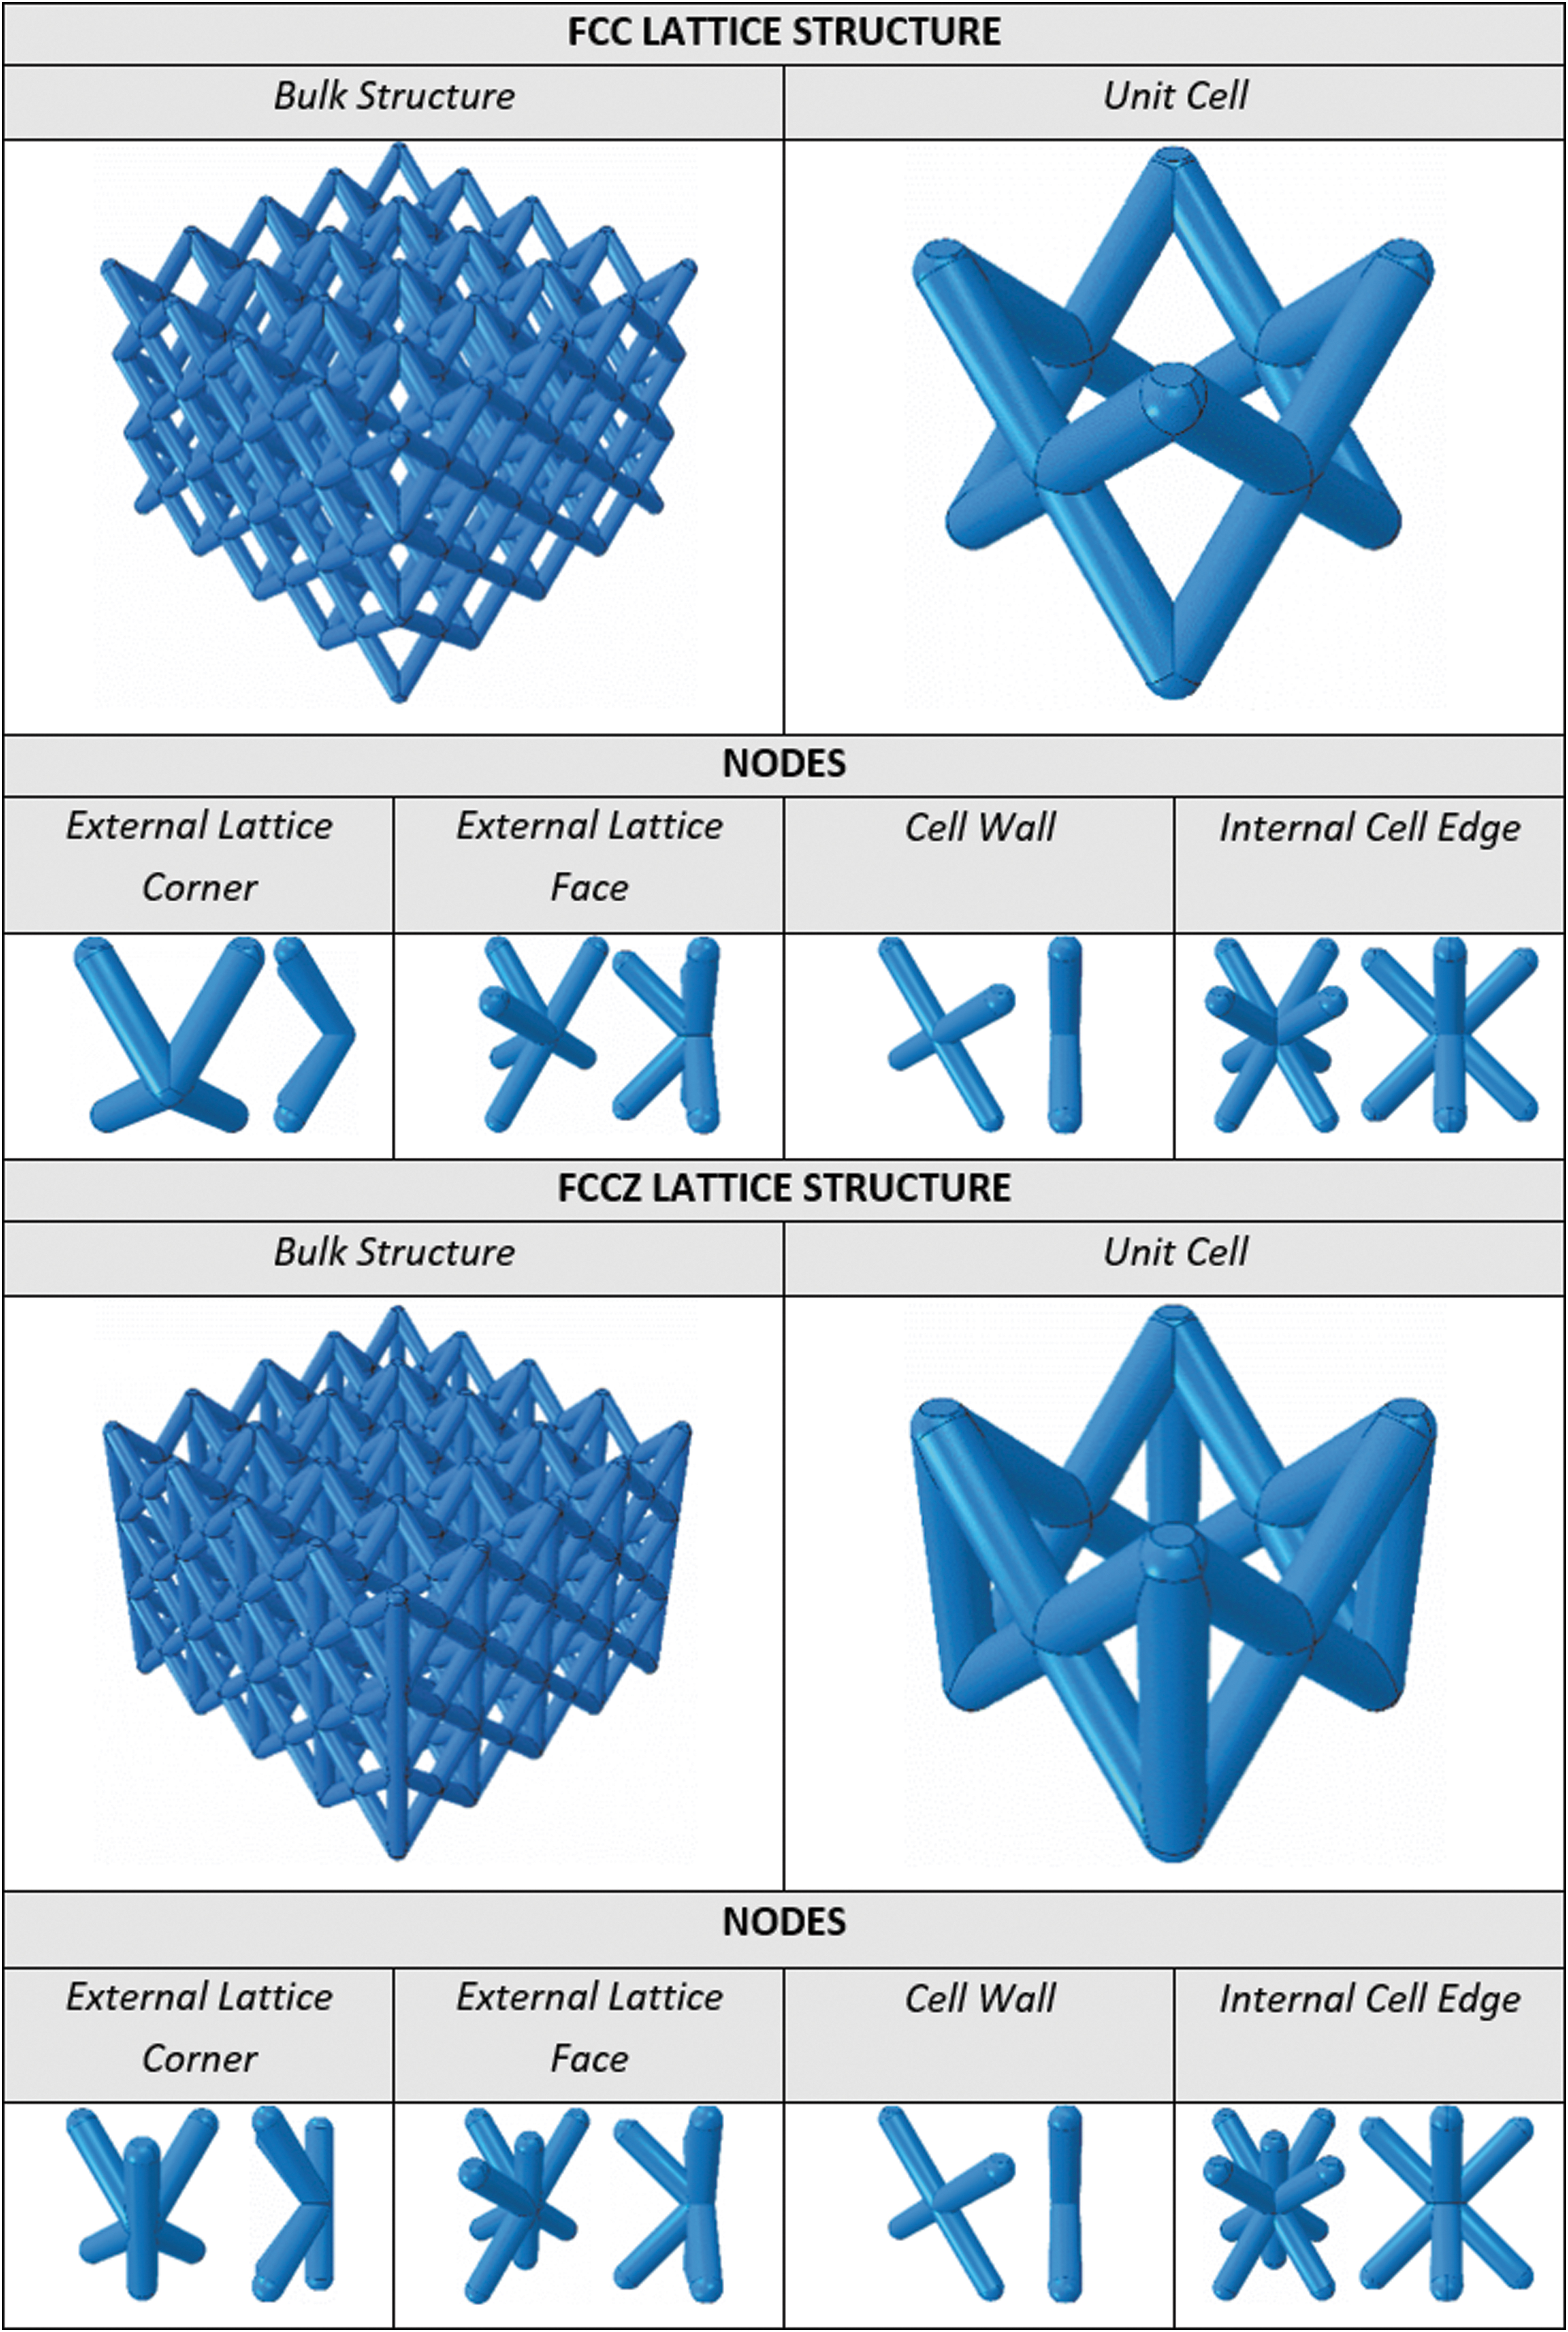
Unit cell and bulk structure CAD model for the FCC and FCCZ lattice structures studied. Also displayed are the four unique strut intersections found within the lattice. CAD, computer-aided design; FCC, face-centered cubic; FCCZ, face-centered cubic with axial struts. Color images are available online.
The geometric properties analyzed for each μCT-derived node cross section include the following: cross-sectional area, principal moments of inertia, and Feret diameters. The geometric properties are then compared with their idealized computer-aided design (CAD) counterparts. The outcomes of this research provide novel insight into the dimensions of nodes within a lattice structure and how they differ from the idealized CAD design. This research is also a step toward providing simple DfAM tools for the accounting of fabricated node geometry in numerical simulations of AM lattice structures.
Methods
Lattice structure design and fabrication
Periodic lattice structures with FCC and face-centered cubic with axial or Z-strut unit cell topologies are studied. Both structures have similar topology and dimensions, although the FCCZ lattice contains additional vertical struts along vertical cell edges. The lattice structures are both manufactured directly on the build platform (no support material) from titanium alloy Ti6Al4V via SLM on SLM Solutions 500 HL machines. The FCCZ lattices were oriented in the build platform with their axial strut's axis parallel to the build direction; the FCC lattice was oriented the same way. The lattice geometry and SLM processing parameters are displayed in Table 1.
Overview of Lattice, Unit Cell, Strut Dimensions, and Selective Laser Melting Processing Parameters
X-ray μCT
The μCT scanning process was conducted in a Bruker Skyscan 1275 machine, a 1 mm Cu filter was applied to a 100 kV and 100 μA energy source with a voxel size of 35 μm. Energy source parameters were selected to produce a minimum and maximum attenuation of 10–20% and ∼95%, respectively. Data output represents a 360-degree-view data set (.tif format). The reconstruction process utilized proprietary software (N-Recon, Micro Photonics, Inc.) to extract cross-sectional data from the image file data set. Ring artifact and beam hardening corrections were ignored. Cross-sectional data were extracted as grayscale files (.bmp format). An open-source imaging processing software was utilized (Dream3D and ParaView) to conduct postprocessing of reconstructed CT files, with binarization completed using the Robust Automatic Thresholding Selection (RATS) algorithm. 34 Figure 3 displays the raw X-ray μCT image and the binarized output from RATS; Table 2 is an overview of scan process and postprocessing parameters.
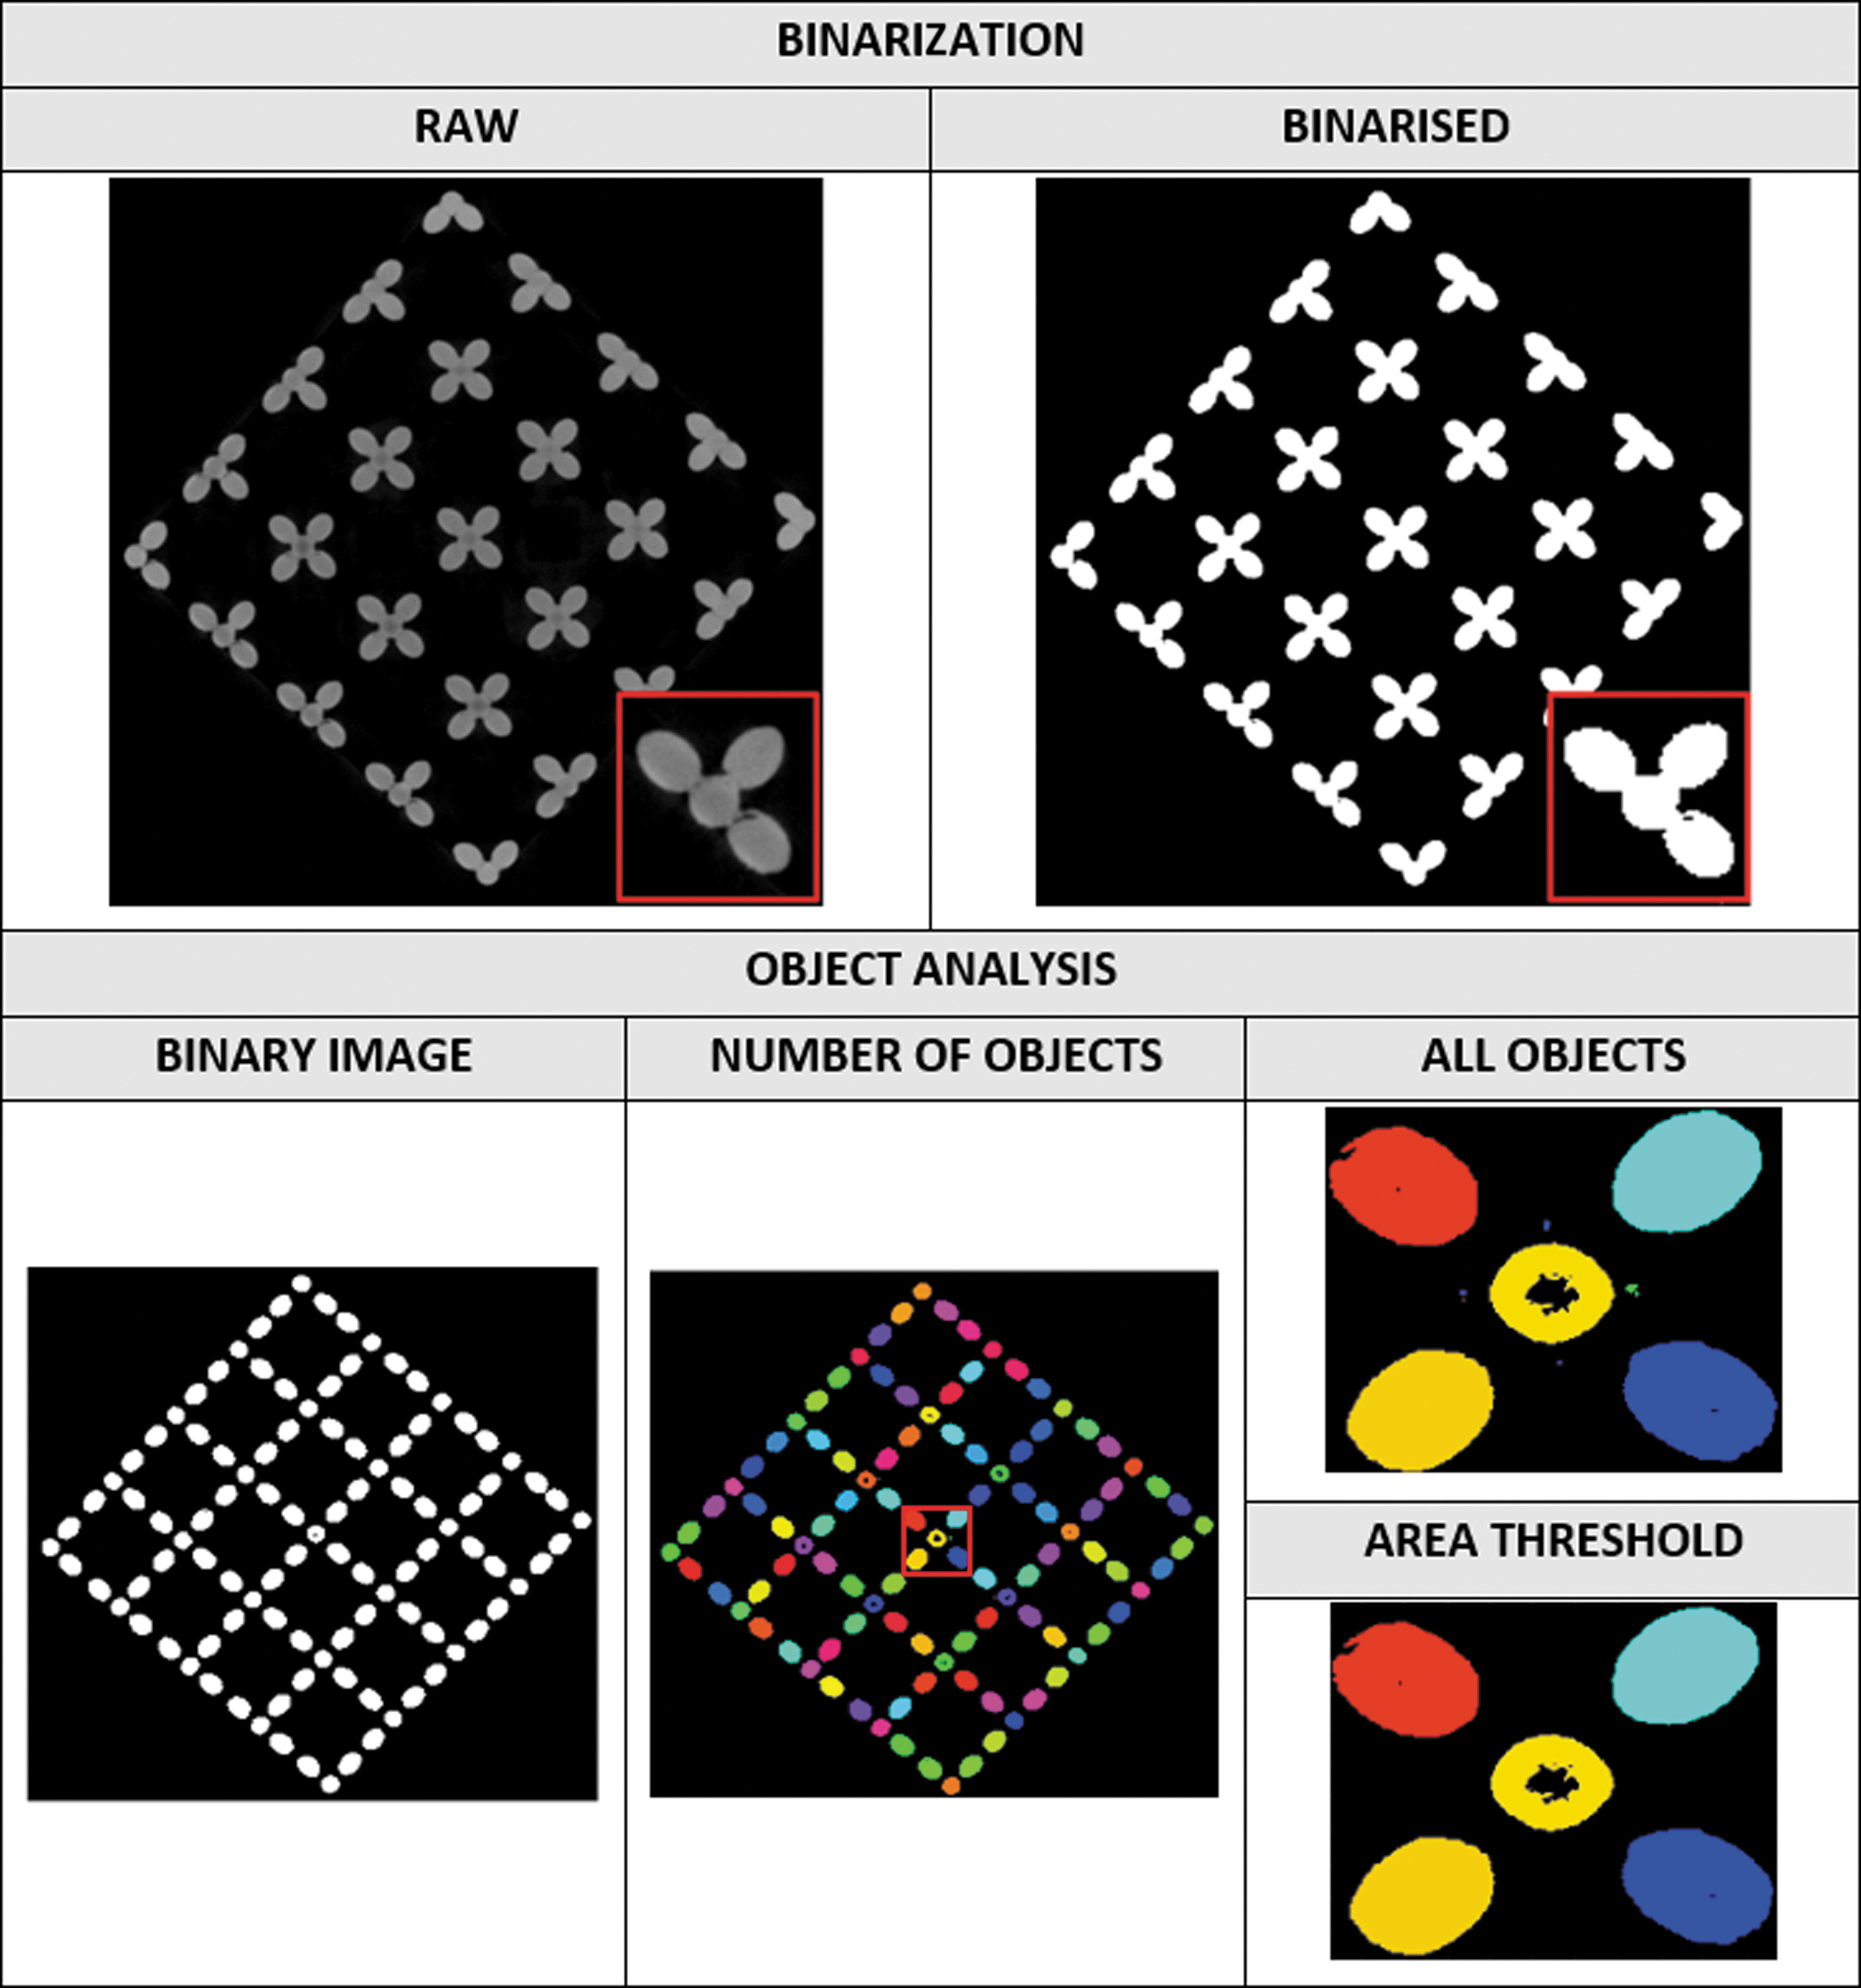
Binarization: Raw X-ray μCT cross-sectional slice and the corresponding binarized image obtained via RATS. Insets display magnification of the same nodal cross section. Object analysis: Binarized CT image alongside a color representation of the number of objects in the image. Also displayed is object area thresholding for the removal of CT artifacts. μCT, microcomputed tomography; CT, computed tomography; RATS, robust automatic thresholding selection. Color images are available online.
Microcomputed Tomography Scan Process and Postprocessing Parameters
CT, computed tomography.
The algorithm used to isolate nodal geometry (Extraction of Individual Lattice Nodes section) requires accurate perpendicular slicing of the lattice during reconstruction; in addition, correct slicing also ensures reliable 2D image-based measurements. A spirit level is used to position the lattice perpendicular to the surface of the stage, and a misalignment compensation function (N-Recon; Micro Photonics, Inc.) is used during reconstruction. The function counteracts misalignments between the axis of rotation and the X-ray detector.
Extraction of individual lattice nodes
Individual nodes were extracted from the binarized cross-sectional image data set using a custom algorithm developed in MATLAB (MathWorks, 2019). The algorithm is intended for use with CT data of periodic or regular lattice structures. Inherently, the number of objects found within cross-sectional slices (at equal intervals) of a regular periodic lattice will also be periodic. The developed algorithm is centered around this characteristic of a regular-shaped periodic lattice and it allows separation of nodal and strut regions. The remainder of the section describes the algorithm in a series of steps, for a given input binarized lattice cross-sectional data set.
Step 1: Boundary extraction and area thresholding
Initially, the number of objects in each image is calculated using Connected-component labeling and stored in a number of objects' array (n):
where ni is the number of boundaries in the i-th image of the CT data set and N is the total number of images (image N corresponds to the top cross-sectional slice of the scanned lattice in the build direction). Area thresholding per image is then applied, objects below 10% of the mean object area are considered CT artifacts, and the number of objects' array (n) is recalculated. Figure 3 displays a binarized cross-sectional image alongside a colored representation of the number of objects in the image. Also displayed is a magnified region of the image showing the effects of area thresholding.
Step 2: Binary image data set discretization
The number of boundaries to the number of boundaries in a cross section containing only struts' (nstrut) ratio is then calculated by the following:
where r is the column matrix of ratios. The number of boundaries in a cross section containing only struts (
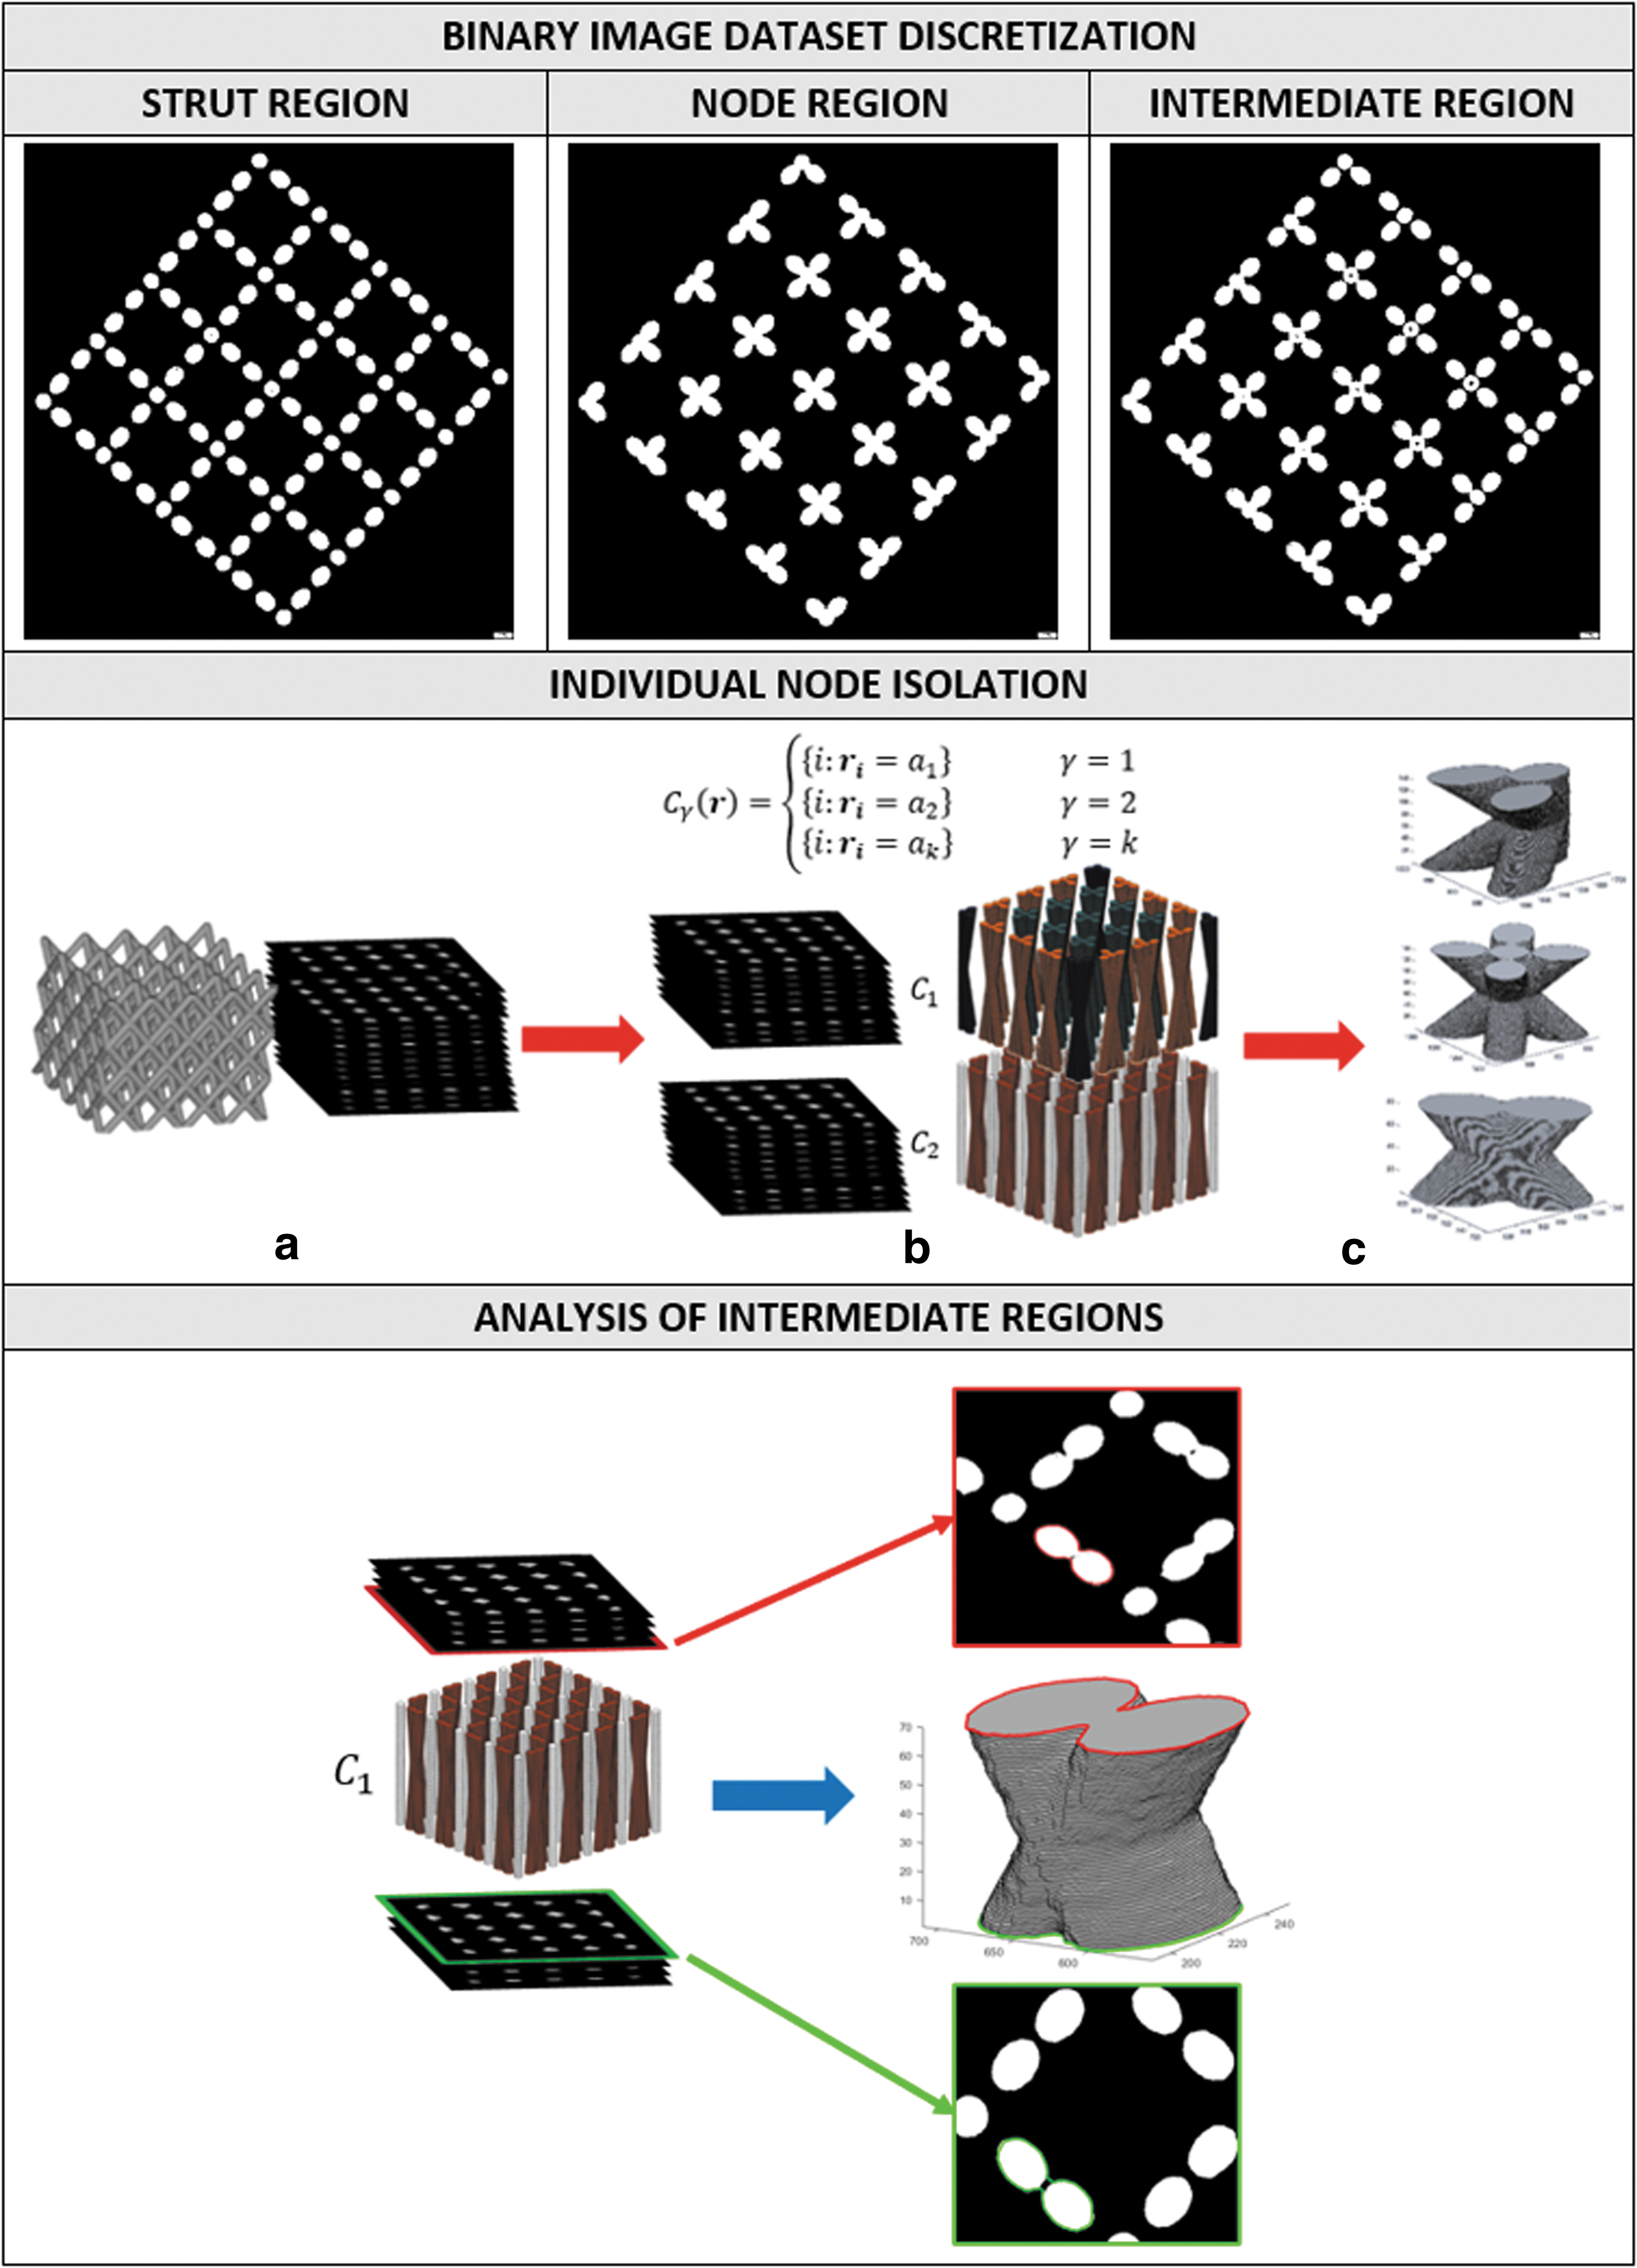
Binary image data set discretization: The three regions typically seen when analyzing cross-sectional CT data set of a regular periodic lattice structure. Strut regions are consecutive images displaying only cross sections of struts, Node regions display only nodes, and intermediate regions display both strut and node cross sections. Individual node isolation: Node isolation process where
Step 3: Individual node isolation
A Node region (
For each nodal region,
Step 4: Analysis of Intermediate regions
Intermediate regions are stacks of binary cross-sectional images that are a mixture of both strut and node cross sections. To ensure that all nodal cross sections are obtained, these images are analyzed and the additional nodal cross sections are added to their corresponding isolated node. The algorithm used to obtain the extra cross sections iteratively projects the top and bottom cross sections of the isolated node on to the bottom and top cross-sectional images of the adjacent Intermediate regions, respectively. If the projected cross sections are connected to a cross section in the Intermediate region, it is added to the geometry of the isolated node (VOI). The process of adding Intermediate region cross sections is recursive and continues until one of the two stopping criteria is met. The first is if the end of the Intermediate region stack is met (i.e., the next binary image belongs to a strut region). The second stopping criterion is met if a projected cross section is connected to more than one cross section in the Intermediate region image (i.e., the node has either split into its connecting struts or is not a full node geometry). Figure 4 displays the analysis of Intermediate regions for a single node, the uppermost surface of the isolated node is projected on to the bottom image of the above Intermediate region. As it intersects, the single cross section in the intermediate region will be added to the isolated node's geometry. Figure 4 also displays the bottom cross section of an isolated node projected on the top image of the Intermediate region below. The bottom projected cross section is connected to multiple cross sections (i.e., cross sections of the two intersecting struts) of the Intermediate region image; the stopping criteria are therefore met, and no further cross sections are added to the bottom of the isolated node.
Measuring dimensions of strut intersections
Each isolated nodes' VOI is examined, and the following geometric properties are measured over the length of each isolated strut intersection:
Area (A). The area bounded by a cross section of a node.
Maximum and minimum principal moments of inertia (I1 and I2, respectively). The centroidal moments of inertia about a cross section's principal axes.
Maximum and minimum Feret diameters (
Figure 5 displays the geometric analysis of an isolated node's cross section. For comparison with idealized nodes, a mock binarized image data set (Fig. 5) is generated using idealized lattice slice data (STL slice data). The same measurement techniques are used for mock binarized image data sets to ensure that equivalent measurements are made. The lattice STLs are sliced in 35-μm layers, equal to the CT scan resolution (35 μm).
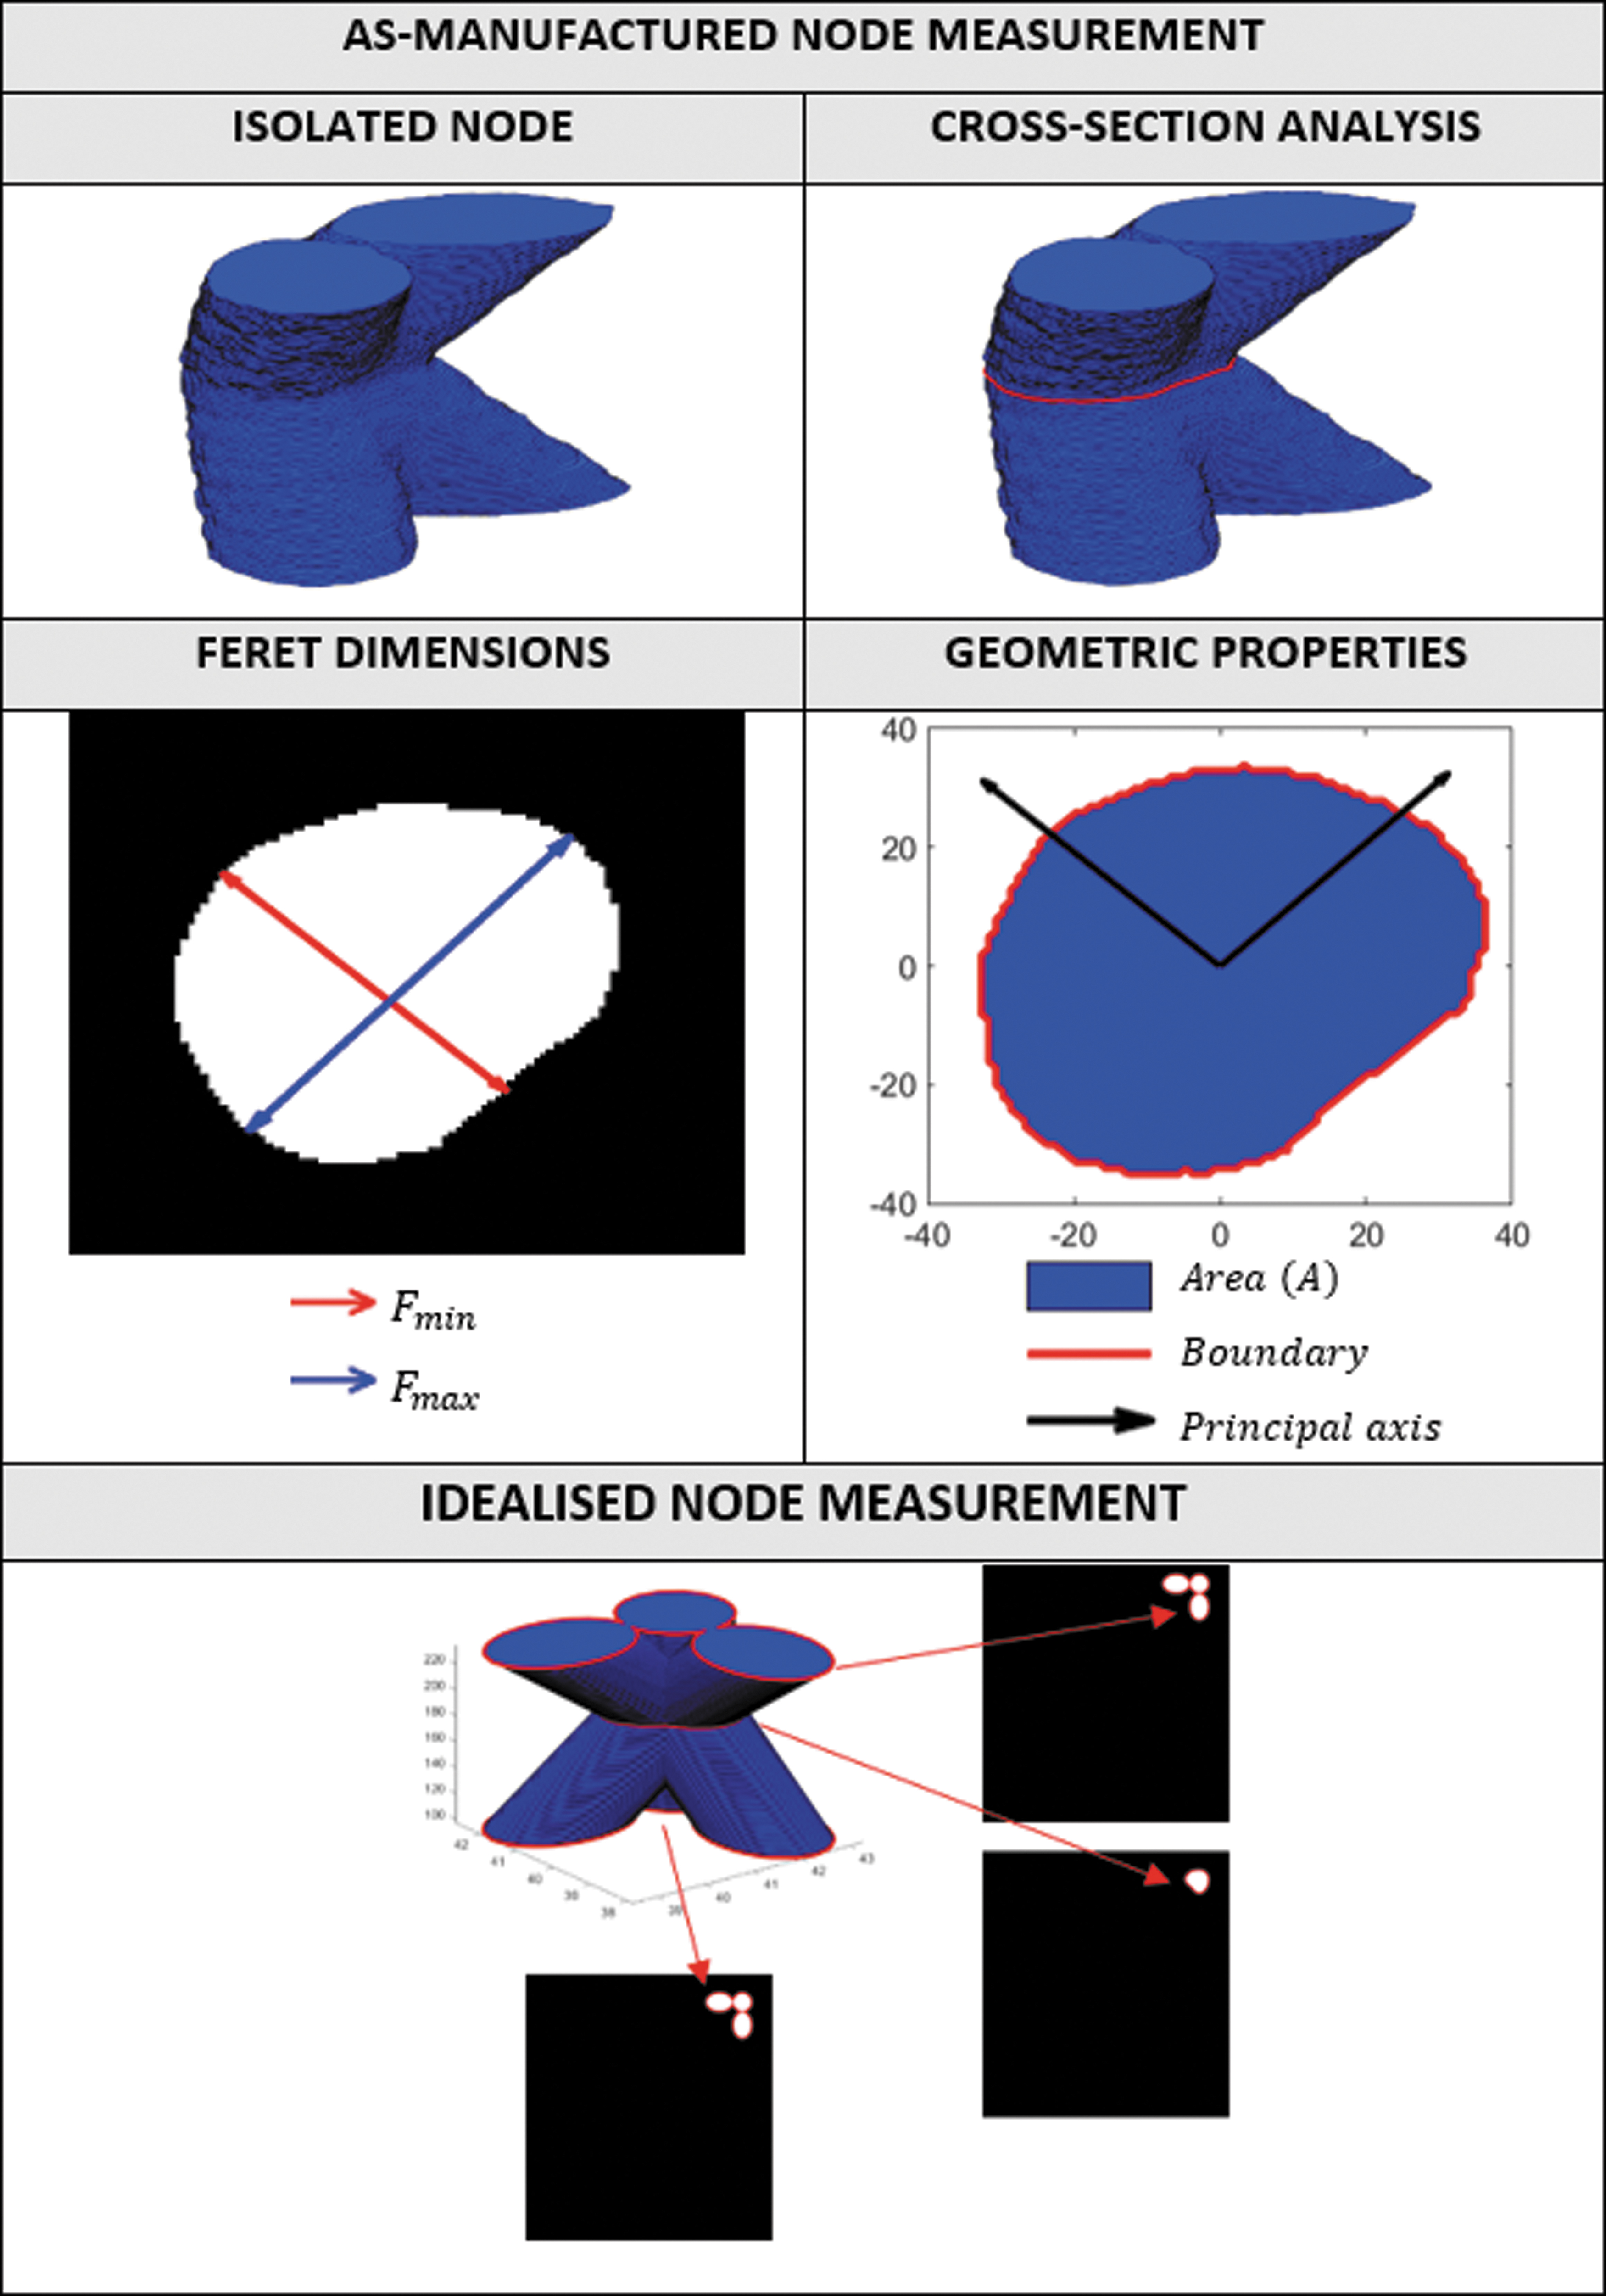
As-manufactured node measurement: representation of geometrical property analysis on the center cross-sectional slice of an FCC lattice's External Lattice Corner node isolated from CT.
Results and Discussion
The section is split into two subsections, with the first discussing CT reconstruction of scanned lattice structures, nodal layer extraction, and isolation of individual nodes. The second subsection introduces how the difference between the fabricated and designed nodes is reported. The remainder of the second subsection provides general and then specific observations for each node classification (Fig. 2).
CT reconstruction and nodal extraction
Figure 6 displays the CT reconstructions of the fabricated lattice structures (Lattice Structure Design and Fabrication section) alongside the two types of extracted Node regions, the midcell nodes and edge-cell nodes. The two Node regions refer to strut intersections at the edge and middle of the unit cells. The midcell nodes for both unit cell topologies (FCC and FCCZ) consist of Cell Wall intersections only (Fig. 2). The edge-cell nodes exist at the bottom and top of unit cells and contain the following: External Lattice Faces, External Lattice Corners, and Internal Cell Edges. The bottommost and topmost rows of nodes are ignored as they are incomplete and effected by removal from the build platform (electron discharge machining process).

CT reconstruction of the SLM fabricated FCC and FCCZ lattice. An example of isolated and classified nodes at the edge and middle of the unit cells is displayed. SLM, selective laser melting. Color images are available online.
Geometrical properties
General observations
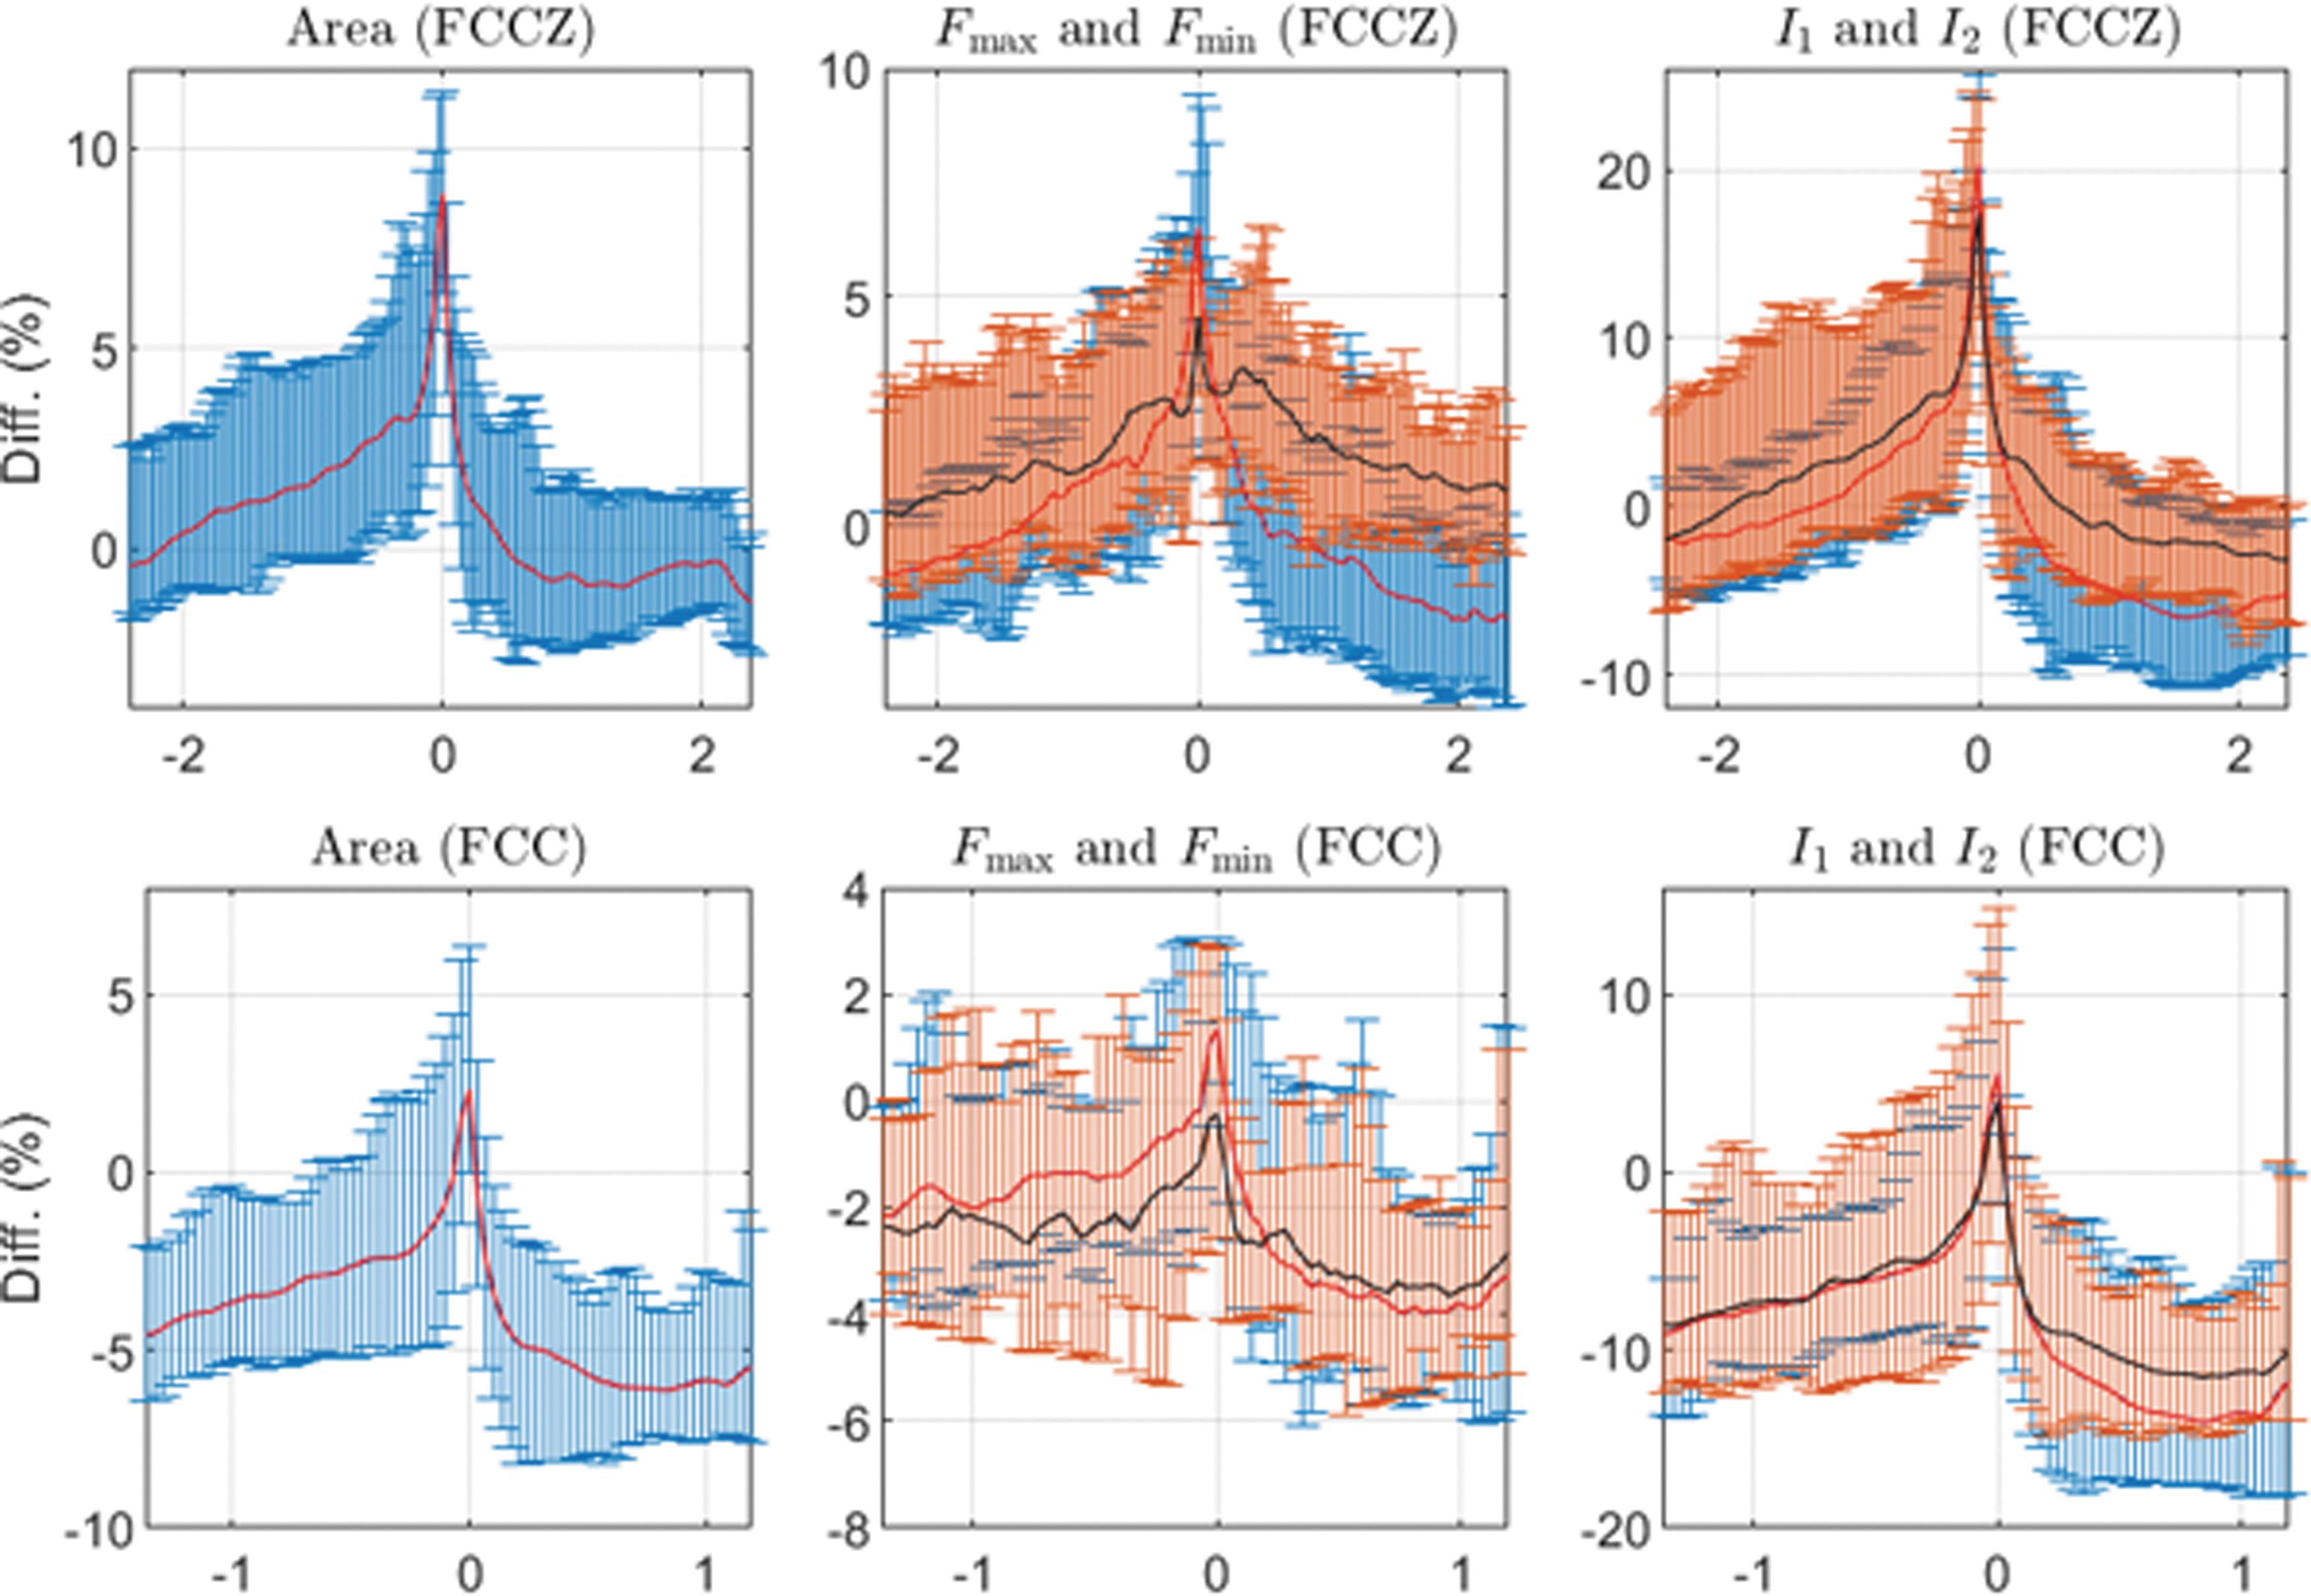
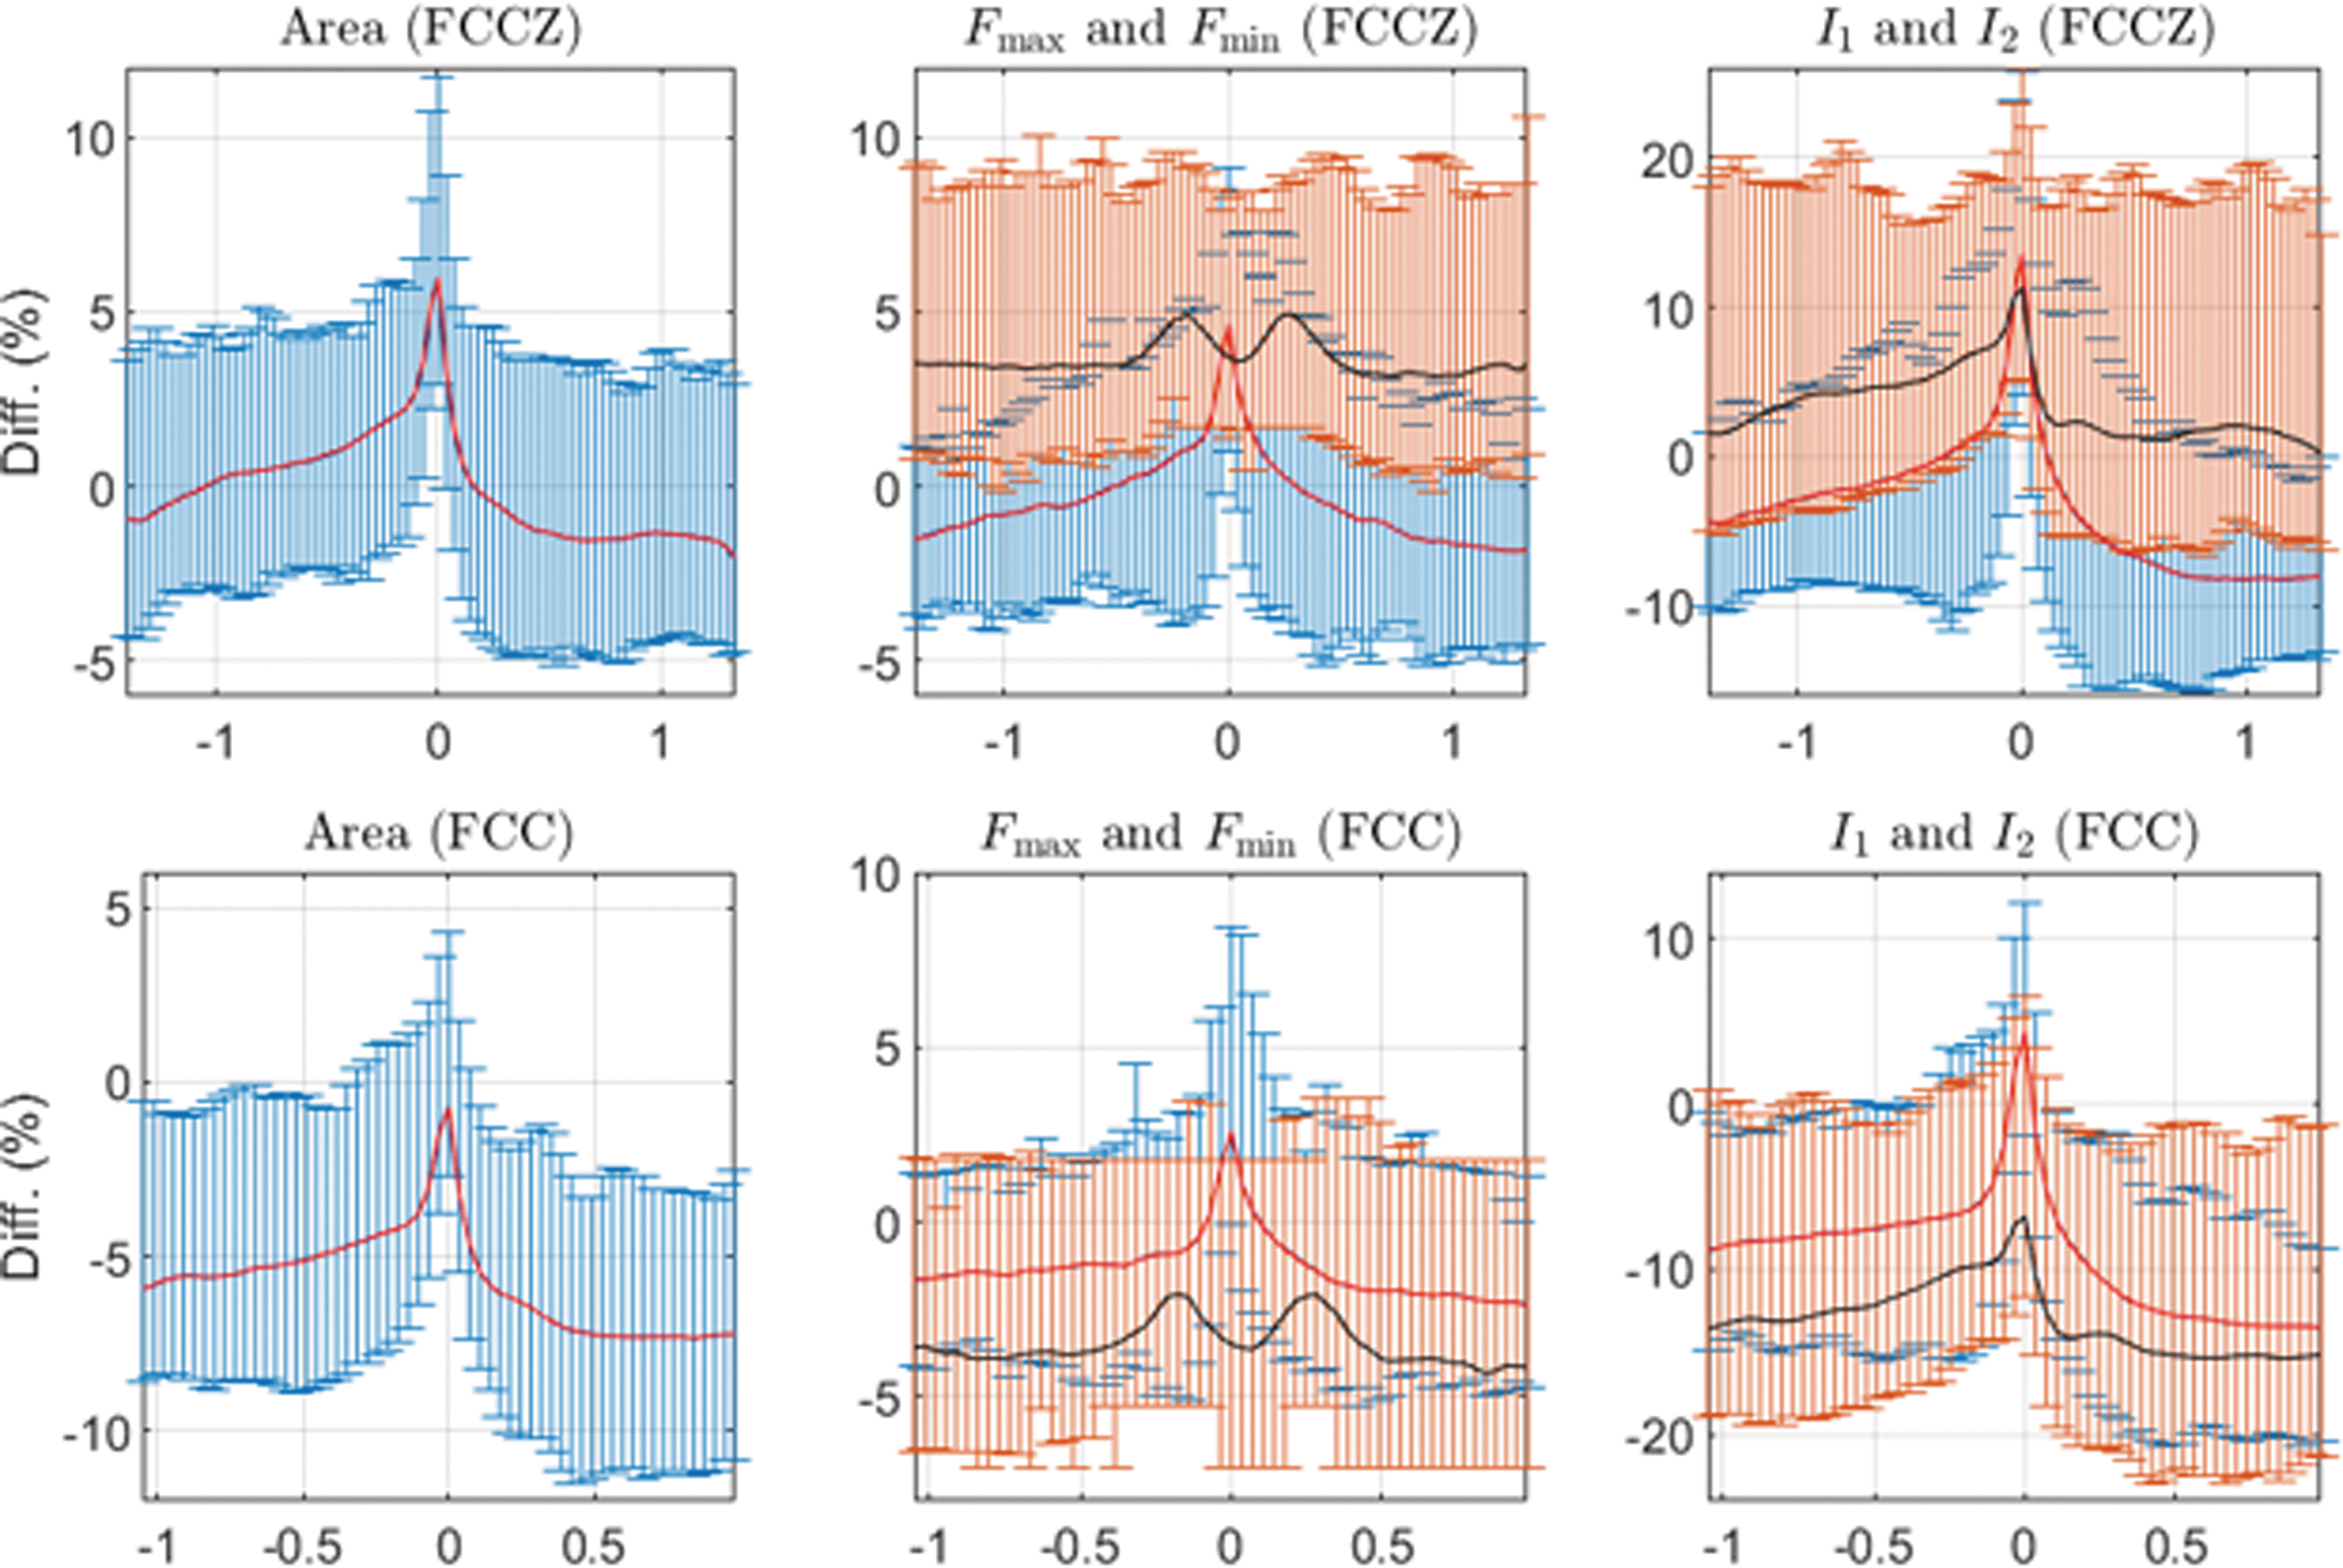
Figures 7–10 display the mean, upper, and lower bound percentage differences between the idealized and experimentally measured geometric properties (
The percentage difference between idealized and fabricated External Lattice Corner nodes' cross-sectional geometric properties. Horizontal axis refers to the distance from the center of the node in the axial direction. Mean percentage differences are [Eq. (5)] indicated by red (Area,

The percentage difference between idealized and fabricated Internal Cell Edge nodes' cross-sectional geometric properties. Horizontal axis refers to the distance from the center of the node in the axial direction. Mean percentage differences are [Eq. (5)] indicated by red (Area,
where
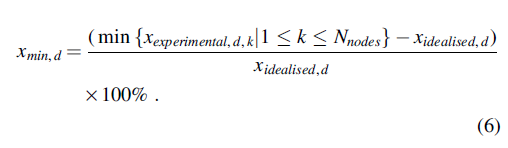
And the upper percentage bound is calculated by the following:
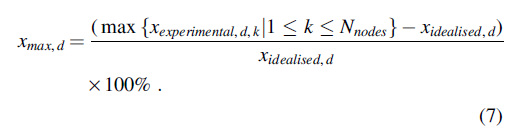
Negative percentage differences indicate measurements that are smaller than idealized. The horizontal axes in Figures 7–10 indicate the distance (d) in mm from the center of the node. A positive
Slight angles in slicing due to nonperpendicular CT scanning introduce errors in image-based measurements of a nodal cross section's geometric properties. In the case of Feret diameters, this is analogous to measurements made with a Vernier caliper on a node at a small angle. Methods to reduce these slight angles (X-ray μCT section) included the use of spirit levels before CT scanning to correctly orient the lattice. Chosen segmentation techniques also affect the accuracy of the image-based measurement technique. An example of this is the use of inadequate thresholding causing cross-sectional geometries that are larger or smaller than the fabricated component, as well as reduction or addition of porosity. Overall, the quality of the acquired μCT data is a factor of both resolution and scan quality, as well as the skills and experience in segmentation of the CT operator or analyst. For further information, a review of X-ray μCT in AM was completed by Du Plessis et al. 36
The mean percentage differences for
Overall, relatively good agreement between the idealized and fabricated nodes is seen. This is primarily due to the unit cell and strut dimensions being relatively large and well above the minimum resolution of the SLM machine and process. FCCZ lattices tended to have longer nodes in the build direction (Z-direction), which is primarily due to the axial or Z-struts. The central cross-sectional area for all the FCCZ node types was larger than idealized, with the Internal Cell Edge (Fig. 10) having the largest mean difference to the idealized. FCC lattices tended to have a cross-sectional area that is smaller than designed, except in regions around node centers.
Feret diameters (Measuring Dimensions of Strut Intersections section) in this research are interpreted as equal to the maximum and minimum possible physical measurements made with a Vernier caliper along the length of a node. In the center of all FCCZ node types,
Overall, the FCC lattice's nodes tended to be slightly smaller than idealized; conversely, the FCCZ's were slightly larger. A factor that could contribute to these differences is the addition of axial struts in the FCCZ lattice, as further material requires melting to form the lattice's nodes, an increase in the amount of heat is transferred from nodal regions to the surrounding powder bed. This may lead to a larger amount of powder particles absorbed by the melt pool, as well as more that are partially melted to the bulk lattice geometry. The raw geometrical properties for the FCCZ and FCC are displayed in Appendix A1 and A2, respectively. Blue curves in each of the Appendix A1 and A2 correspond to the idealized measurement, the red dashed curves correspond to the mean of the properties of the fabricated node, and the gray region displays bounds of these properties. The remainder of this section discusses observations across individual node types.
External Lattice Corner
For both fabricated lattices (Lattice Structure Design and Fabrication section), there existed eight External Lattice Corner nodes (
For both FCC and FCCZ lattices (Fig. 7), a slightly larger cross-sectional area occurs in regions below the center of the node, this finding is consistent with the slumping phenomena and the adherence of partially melted particles on the bottom facing surfaces. The effects of these phenomena are also seen in the mean percentage difference graphs of the
For the FCCZ lattice,
External Lattice Face
For both fabricated lattices (Lattice Structure Design and Fabrication section), there existed 24 External Lattice Face nodes (
The percentage difference between idealized and fabricated External Lattice Face nodes' cross-sectional geometric properties. Horizontal axis refers to the distance from the center of the node in the axial direction. Mean percentage differences are [Eq. (5)] indicated by red (Area,
For the FCCZ lattice, the
Cell Wall
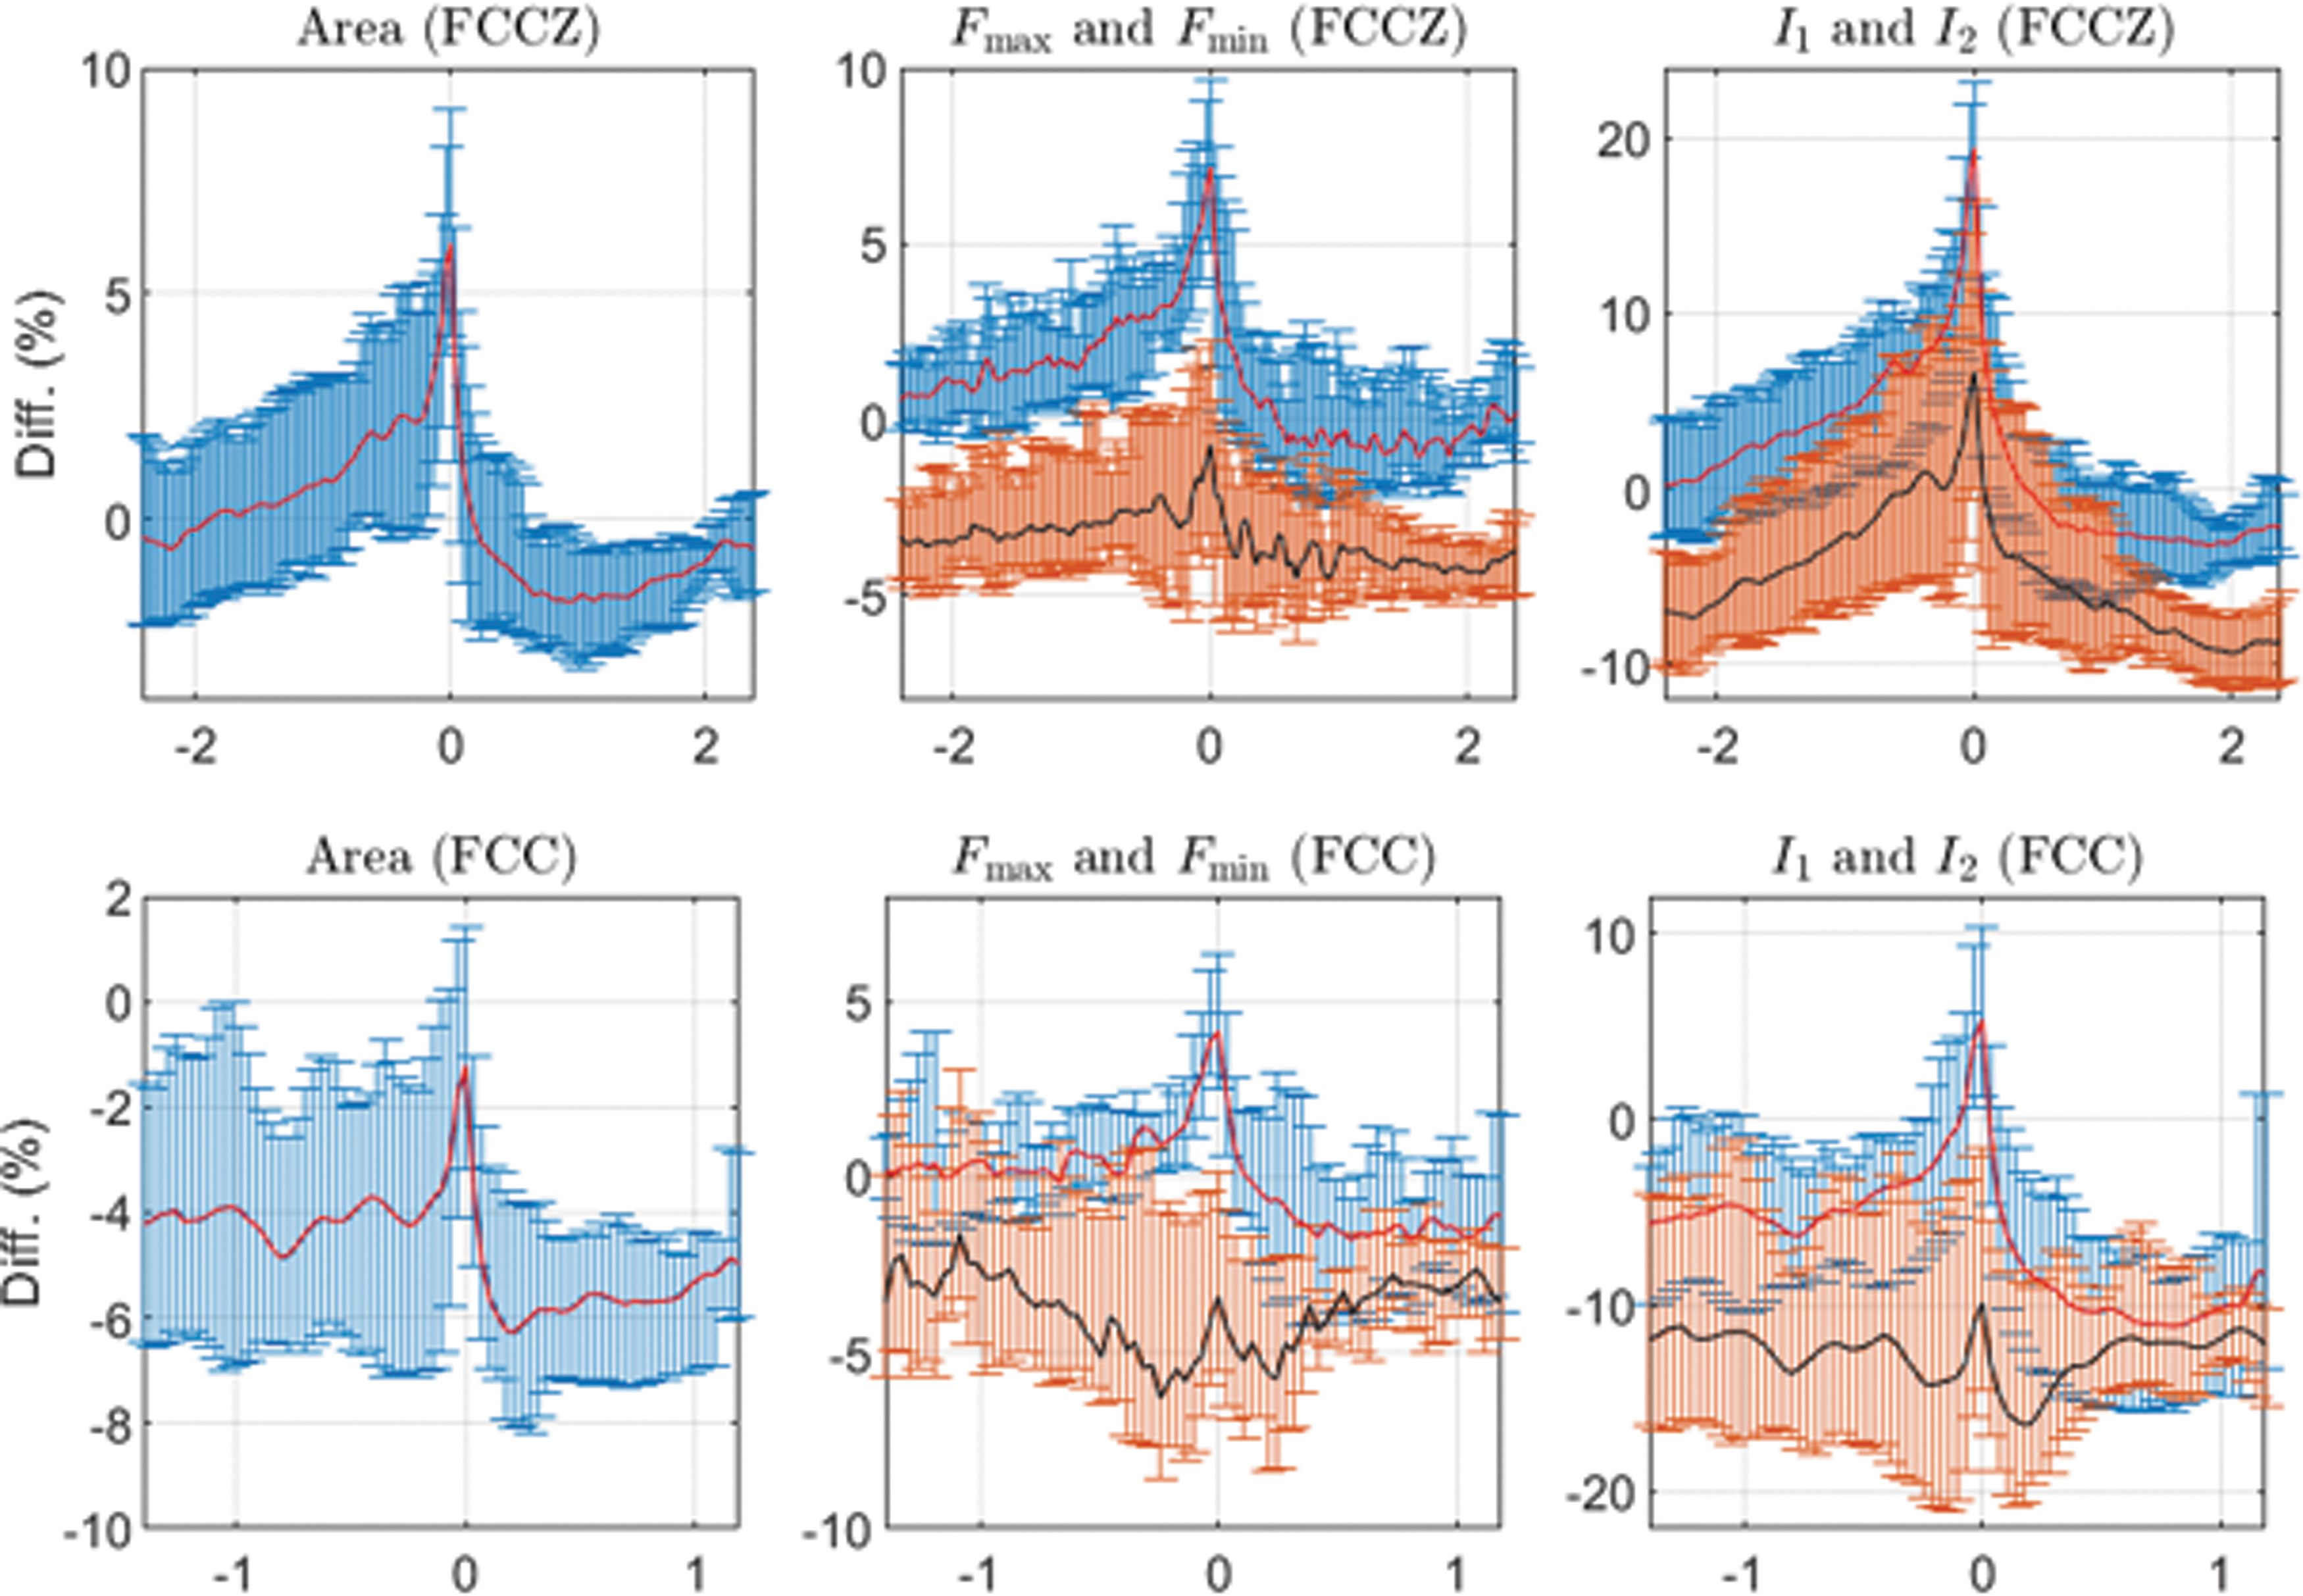
Cell Wall intersections were the most abundant nodes in both fabricated lattices, with 120 Cell Wall nodes existing for each fabricated lattice (
The percentage difference between idealized and fabricated Cell Wall nodes' cross-sectional geometric properties. Horizontal axis refers to the distance from the center of the node in the axial direction. Mean percentage differences are [Eq. (5)] indicated by red (Area,
The
The FCCZ nodes' I1 and I2 mean deviation from the design peaked at the center of the node, displaying a 13.6% and 11.3% difference, respectively. The FCC nodes I1 and I2 behaved in a manner opposite to that of the FCCZ, with the mean difference reducing toward zero in regions surrounding the center of the node. The center of the FCC nodes had a mean I1 and I2 difference of 4.4% and −6.8%, respectively. This indicates FCCZ Cell Wall nodes that may be more resistant to bending loads than designed.
Internal Cell Edge
For both fabricated lattices (Lattice Structure Design and Fabrication section), there existed 18 Internal Cell Edge nodes (
The
For the FCCZ nodes, the I1 and I2 properties' mean differences at the node centers are 24.8% and 20.9%, respectively. The FCC nodes display the mean difference for the I1 and I2 properties of 7.6% and 5% (Fig. 10), respectively. For both unit cell topologies, this is an indication of increased material at the node centers. More specifically, this increase occurs in regions where the idealized moment of inertia is at its minimum and maximum.
Conclusion
Despite the criticality of nodal geometry in understanding and predicting the mechanical behavior of AM lattice structures, there exists virtually no research that quantifies the differences between the designed and fabricated nodal intersections. In response to this, a novel algorithm is developed that analyzes μCT data and isolates individual nodal intersections for geometric property analysis and comparison with design. Outcomes are aimed at increasing understanding of nodal geometries in AM lattice structures as well as providing an effective method of isolating nodes.
Image-based measurement techniques were utilized to study the geometric properties of nodal cross sections. The method also provides data that enable classification of nodes dependent on their spatial location and number of intersecting struts. In this research, nodes were classified (Fig. 2) into four categories: External Lattice Corner, External Lattice Face, Cell Wall, and Internal Cell Edge nodes. The percentage differences between the design and fabricated measurements are reported for each node classification (Figs. 7–10).
Overall, this research provides a novel method and insights into the geometric properties of nodes within an SLM fabricated lattice structure. The methods proposed in this research have been specifically applied to the geometrical characterization of fabricated nodal intersections; however, they can also form the foundation for as well as complement current studies by providing the following:
A library of nodal geometries can form the basis for further studies of the differences between designed and fabricated nodes.
The ability to perform intralattice experiments, including analysis of gradient lattice structures.
Processing capabilities. Geometric data for processing capability analysis, enabling comparison of various AM techniques, materials, machines, processing parameters, and deviation from design.
Improved numerical models. The ability to improve accuracy in the more efficient beam element-based finite element models via the understanding of nodal geometry and behavior. The increase in diameter and length of beam elements typically used to account for material aggregation at nodes can be more precisely specified28,37–39 by studying individual node geometries.
Certification. The proposed algorithm may be applied during nondestructive X-ray certification to isolate and ensure the qualification of each individual strut and node within a periodic lattice.
Generation of statistically shaped models that may be used to understand typical node build qualities, as well as enable coupled finite element and reliability analysis of nodes.
Footnotes
Acknowledgments
The authors acknowledge the use of facilities within the RMIT Advanced Manufacturing Precinct (RMIT AMP) and the RMIT Microscopy and Microanalysis Facility (RMMF). This research was conducted by the Australian Research Council Industrial Transformation Training Centre in Additive Biomanufacturing (IC160100026) (![]() ).
).
Data Availability
CT reconstructions of lattice structures, as well as isolated nodes, are available by request from martin.leary@rmit.edu.au. ![]() of each isolated strut and node from the fabricated FCC lattice is also included.
of each isolated strut and node from the fabricated FCC lattice is also included.
Author Disclosure Statement
No competing financial interests exist.
Funding Information
This research was funded by the Australian Research Council Industrial Transformation Training Centre in Additive Biomanufacturing (IC160100026).
Appendix
References
Supplementary Material
Please find the following supplemental material available below.
For Open Access articles published under a Creative Commons License, all supplemental material carries the same license as the article it is associated with.
For non-Open Access articles published, all supplemental material carries a non-exclusive license, and permission requests for re-use of supplemental material or any part of supplemental material shall be sent directly to the copyright owner as specified in the copyright notice associated with the article.