
Abstract
This article presents the effect analysis of the printing time sequences on the mechanical properties in correlation with the crystallization kinetics and rheological behavior. For this purpose, two printing order of 3D printed samples (printed simultaneously or in sequence) were chosen. In addition, two different infill patterns (line and gyroid) and building directions (horizontal and vertical) have been used. Concerning the polymer filaments, two commercial polylactic acid (PLA 3D870 and PLA 3D850) having different crystallization kinetics were used. The effect of the printing time delay between each layer on the temperature profile and the crystallization evolution was studied using a finite element analysis method simulation. The simulation results show a greater thermal excursion for longer delay times between the layers and with a crystallization degree evolution characterized by a step pattern. Moreover, a major density of crystals appears in the center of the final part. A new approach was adapted to measure the volumetric contraction of the material as a function of the temperature; it was performed with a gap test using a rotational rheometer under static conditions (without external deformation). The normal force measured from the test has shown a faster and higher increase of the contraction for the material with faster crystallization kinetics and with a higher degree of crystallinity. The results concerning the tensile properties show better rigidity for the samples printed in sequence due to the minor time of delay between the deposited layers. The mesostructure of the printed parts was analyzed with an X-ray tomography and a scanning electron microscope. The highest difference is presented from the PLA 3D870 characterized by the highest rate of crystallization resulting in more microvoids compared with the PLA 3D850, due to the less welding cohesion between the layers.
Introduction
In the field of additive manufacturing (AM), different AM technologies are developed continuously to give more flexibility to the choice of materials (metals, polymers, ceramics, etc.). There was a strong interest for the material extrusion process (MEP), and in the literature, the effects of process parameters on the mechanical properties of different commercial polymer filaments as acrylonitrile butadiene styrene, polylactic acid (PLA), polycarbonate, and polyether ether ketone (PEEK) have been studied.1–3
Although different studies have been conducted from various points of view, there is a lack of experimental information concerning the effect of printing time sequences on the mechanical properties in function of the 3D infill pattern and crystallization kinetics/rheological behavior of the polymers used. This knowledge could be of interest in case of studies such as the one presented by Li et al., 4 they have studied a way to minimize the material consumption by optimizing the internal density shape modeling of 3D printing objects, without loss of the mechanical properties. Also, the case study analyzed by Podroužek et al., 5 which regard the bio-based 3D infill pattern used in 3D printing. This approach is useful for generative design, such as the presented branching structure, or any complex shape and boundary condition.
About the rheological behavior of the polymers used in MEP fabrication, several studies have been performed for food application. However, for the 3D printing polymers, the current most used rheological measurements to analyze the viscoelastic behavior are steady-shear flow curves, oscillatory data, creep, and temperature sweeps. 6 In other words, in the literature, the possibility of analyzing the viscoelastic behavior of the polymeric material under static conditions (without external deformation) through the measure of the normal force is not yet considered. Concerning the effect of the crystallinity degree of the materials used in MEP, higher crystallinity of the printed part corresponds to a high tensile and impact strength.7–13
Specifically, the results obtained in the literature suggest that the final properties of the final piece can be modulated as a function of the applied thermal history, which has an effect on the crystalline structure of the material.
An important point is related to the influence of surrounding heat transfer of the printed part in the printer chamber. Concerning this aspect, the cooling rate has a relevant effect on the mesostructure, the bond strength, and the residual strain of the printed part.
However, the analysis of the thermal profile that occurs during printing is complex to measure given the complexity of the process. Although some studies on the effect of crystallinity on the mechanical properties of parts 3D printed using PLA or PEEK have been conducted,14,15 there is a lack of experimental information concerning the effect of printing time sequences on the crystallization kinetic behavior of the polymers used in the field of the MEP.
In the literature, researchers have obtained different mathematical models and implemented simulations to better describe the temperature profile during the deposition process. Therefore, the use of simulations can be an alternative to analyze in more detail the thermal history and the crystallization evolution in different printing conditions.16–22
In a previous article, 8 the effect of the printing order was studied on the mechanical properties of the final printing part with different build orientation obtaining interesting results.
In this work, two kinds of commercial PLA filaments for MEP fabrication with different thermal behaviors were used. The thermal decomposition was studied with a thermogravimetric analysis (TGA), whereas the thermal parameters and the kinetics of crystallization were investigated with a differential scanning calorimetry analysis.
Finite element analysis was used to determine the temperature history and crystallization kinetics of the raster lines for different deposition time sequences of printing. The same two kinds of PLA filaments for MEP fabrication were used to compare the effect of the delay printing times on the mechanical properties in correlation with the crystallization kinetics.
The temperature range calculated during the simulation was used as an indication to choose the temperatures for the rheological experiments. In particular, the rheological behaviors in dynamic and quiescent condition were explored with a rotation rheometer. Concerning the morphology, an X-ray radiography and tomography was used to analyze the porosity structure of the tensile test samples, while the fracture cross section of the tensile specimens was observed with a scanning electron microscope (SEM).
Simulation of Heat Transfer During Raster Line Deposition
The temperature and the crystallization kinetic evolution on the raster line section of the printed part were evaluated by the finite element analysis method based on the continuous media theory. This simulation aims to analyze the temperature and crystallization kinetic evolutions for different deposition times of the 3D printing part layers.
Crystallization evolution prevision by the Nakamura model
To calculate the overall crystallization kinetic profiles in function of temperature and time, the model developed by Nakamura
23
was used in the time differential form:
where α(t, T) is the crystallization degree defined as the ratio between the crystallized volume xc and the crystallizable volume x∞, n is the Avrami exponent, and K(T) is the Nakamura and Avrami rate constant.
Nakamura and Avrami rate constant
The Nakamura and Avrami rate constant can be expressed by the Hoffman–Lauritzen theory:
where K0 is the pre-exponential constant and U = 6270 J/mol, which is the universal value of the activation energy of the crystallization transport. R is the universal gas constant (8.314 J/mol K) and T∞ = TG − 30 K is the temperature at which the crystallization transport finishes in relation of the glass transition temperature TG. T0 is the equilibrium melting point, which can be determined by the Hoffman–Weeks construction, while Kg is related to the nucleation.23,24
Heat transfer process during raster line deposition
The model that governs the heat transfer process during the deposition is given by the energy equation coupled with the crystallization latent heat term. The crystallization latent term is equal to:
and the final equation is given as follows:
where ρ is the material density (kg/m3), C is the specific heat (W/kg K), T is the temperature (K) function of x, y and t, t is time (s), k is the thermal conductivity (W/m K), and ΔHc is the crystallization enthalpy. For this simulation, the following approximations were considered: material density, specific heat, and thermal conductivity had constant value, and no irradiation phenomena were studied. The boundary conditions for an MEP system are function of the deposition sequence.
For this study, it was used for adjacent raster lines the transport by conduction, while the convection was considered for the heat transport between the material and the 3D printer room environment since the movement of the head and the extrusion plate perturb the surrounding air. 22
The simulation was performed with COMSOL® 5.5 software using 2D domain. The used deposition sequence is schematically described in Figure 1 where the raster line deposition starts with L1 and finishes with L18. Two different deposition time sequences were simulated (DTS1 and DTS2) using different delay time per layer. In particular, 0 s of delay per layer was used for DTS1 and 30 s for DTS2. Moreover, the simulation of the last layer is completed after 30 s for both case studies. The parameters used for the calculus are reported in Table 1. The average printer room temperature was measured experimentally.

Schematic representation of the deposition sequence used for the simulation.
Model Parameters
Materials and Methods
Materials
The polymer filaments used in this work are the commercial PLA provided by NatureWorks named Ingeo Biopolymer 3D850 (transparent) and 3D870 (white) with a diameter of 2.85 mm. The supplier's properties are reported in Table 2. Before each experiment, the polymer was dried to remove all the water content.
Thermal characterization
TGA was performed using a PerkinElmer TGA 4000, at a heating rate of 10°C/min under N2 atmosphere from 30°C to 600°C.
The study of the thermal properties and crystallization kinetics was carried out on samples using a differential scanning calorimetry (Mettler DSC-3+), calibrated with high-purity standards. A mass ranging between 6 and 12 mg was used for analysis, and the samples were covered in an aluminum pan. The calorimetric measurement was performed under inert atmosphere (N2 flow) at a heating rate of 10°C/min in the temperature range from 25°C to 210°C using a heat/cool/heat method. The glass transition temperature (Tg), melting temperature (Tm), and crystallization enthalpy (ΔHc) were measured from the cooling and second heating thermograms. The degree of crystallinity (xc) from the second heating and the crystalline phase amount can be estimated by dividing the measured melting enthalpy by the enthalpy of theoretical 100% crystalline PLA:
where the value of xpol was the fraction of polymer. In the case of MEP filament with a white colorant, the fraction was measured from the TGA. In this work, xc was determined considering the enthalpy of fusion equal to 93 J/g for 100% crystalline PLA. 25
To study the crystallization kinetics in isothermal condition, the samples were heated from 25°C to 210°C at 40°C/min and held at 210°C for 3 min. Subsequently, it was rapidly cooled (−40°C/min) to the isothermal evaluation temperatures of 105°C, 110°C, 115°C, and 120°C. The samples were held at the isothermal temperature for a sufficient time to allow the complete crystallization. Therefore, only four temperature isotherms are performed in a temperature range (105–120°C, step 5°C). The crystallization kinetics, based on these data, is mainly extrapolated, which may expand a bit the range of uncertainty. After that a heating was performed at 10°C/min until 210°C to estimate the equilibrium melting point (T0) by the Hoffman–Weeks construction.
The half crystallization time (t0.5) is an important parameter, which can be obtained from the plot of relative crystallinity versus the time in isothermal conditions. It is defined as the time needed to attain 50% crystallinity. The t0.5 is calculated using the following equation:
where K is the Avrami rate constant and n the Avrami exponent. The equation of the half crystallization time was obtained starting from the equation of Avrami, which is mostly used to determine the time-dependent relative crystallinity α(t).
K and n are parameters related to the temperature, morphology, and nucleation type of the crystalline phase. 26
Rheological measurements
An ARES Rheometric Scientific rotational rheometer manufactured by TA instruments, working in oscillatory shear mode, was used in this work for different rheological analyses. Parallel plate geometry with a diameter of 8 mm was used for all the tests. In all cases, strain amplitude values were verified to ensure the experiments within the linear viscoelastic region.
In the case of shear dynamic measurements, the tests were carried out at different constant temperatures: 185°C, 190°C, 200°C, 210°C, 220°C and a gap height of 1 mm. The range of frequency sweeps was from 0.1 to 100 rad/s. From the data, the storage modulus (G′) and loss modulus (G″) were measured and used to plot the master curve. The master curve was represented by the complex viscosity in function of the frequencies. The complex viscosity is the vector form of the complex number given from the real component η′ = G″/ω and the imaginary component η″ = G′/ω; therefore, it was calculated using the equation η* = [(η′) 2 + (η″) 2 ]0.5.27,28
To investigate the complex viscosity variation through the quiescent isothermal crystallization, the following thermomechanical method has been used: The annealing treatment has been realized at 200°C for 5 min to erase any crystalline fragments that could affect the subsequent crystallization process. Then, a cooling step to the crystallization temperature has been performed with a rate of about 50°C/min. The isothermal crystallization has been investigated at temperature of 105°C, 110°C, 115°C, and 120°C. The complex viscosity has been monitored by dynamic time sweep test at the constant deformation and frequency equal to 0.1% and 1 rad/s, respectively. The choice of a small amplitude oscillatory shearing is crucial to reduce, as much as possible, the disturbance during the crystallization.29,30
The last case of rheological study for this work was the force gap measurement in function of the temperature and time. This test was performed with a force gap test in sequence configuration. The gap was fixed at 1 mm and the temperature profile was characterized by a series of steps, each of 5°C. The initial and final temperatures are 190°C and 100°C, respectively. To ensure a sufficient time range to analyze possible material relaxation which may occur during the layers printing, a duration of 2 min has been set for each step.
Sample printing for mechanical test
The MEP samples were produced using an Ultimaker 3 3D printing machine. The infill pattern, build orientation (horizontal and vertically), and printing order on the mechanical properties of PLA were investigated. For this work, the value of raster angel at 0°/90° was defined (the direction of raster with respect to the loading stress direction with a line infill pattern) considering the part rotated through 45° (Fig. 2).
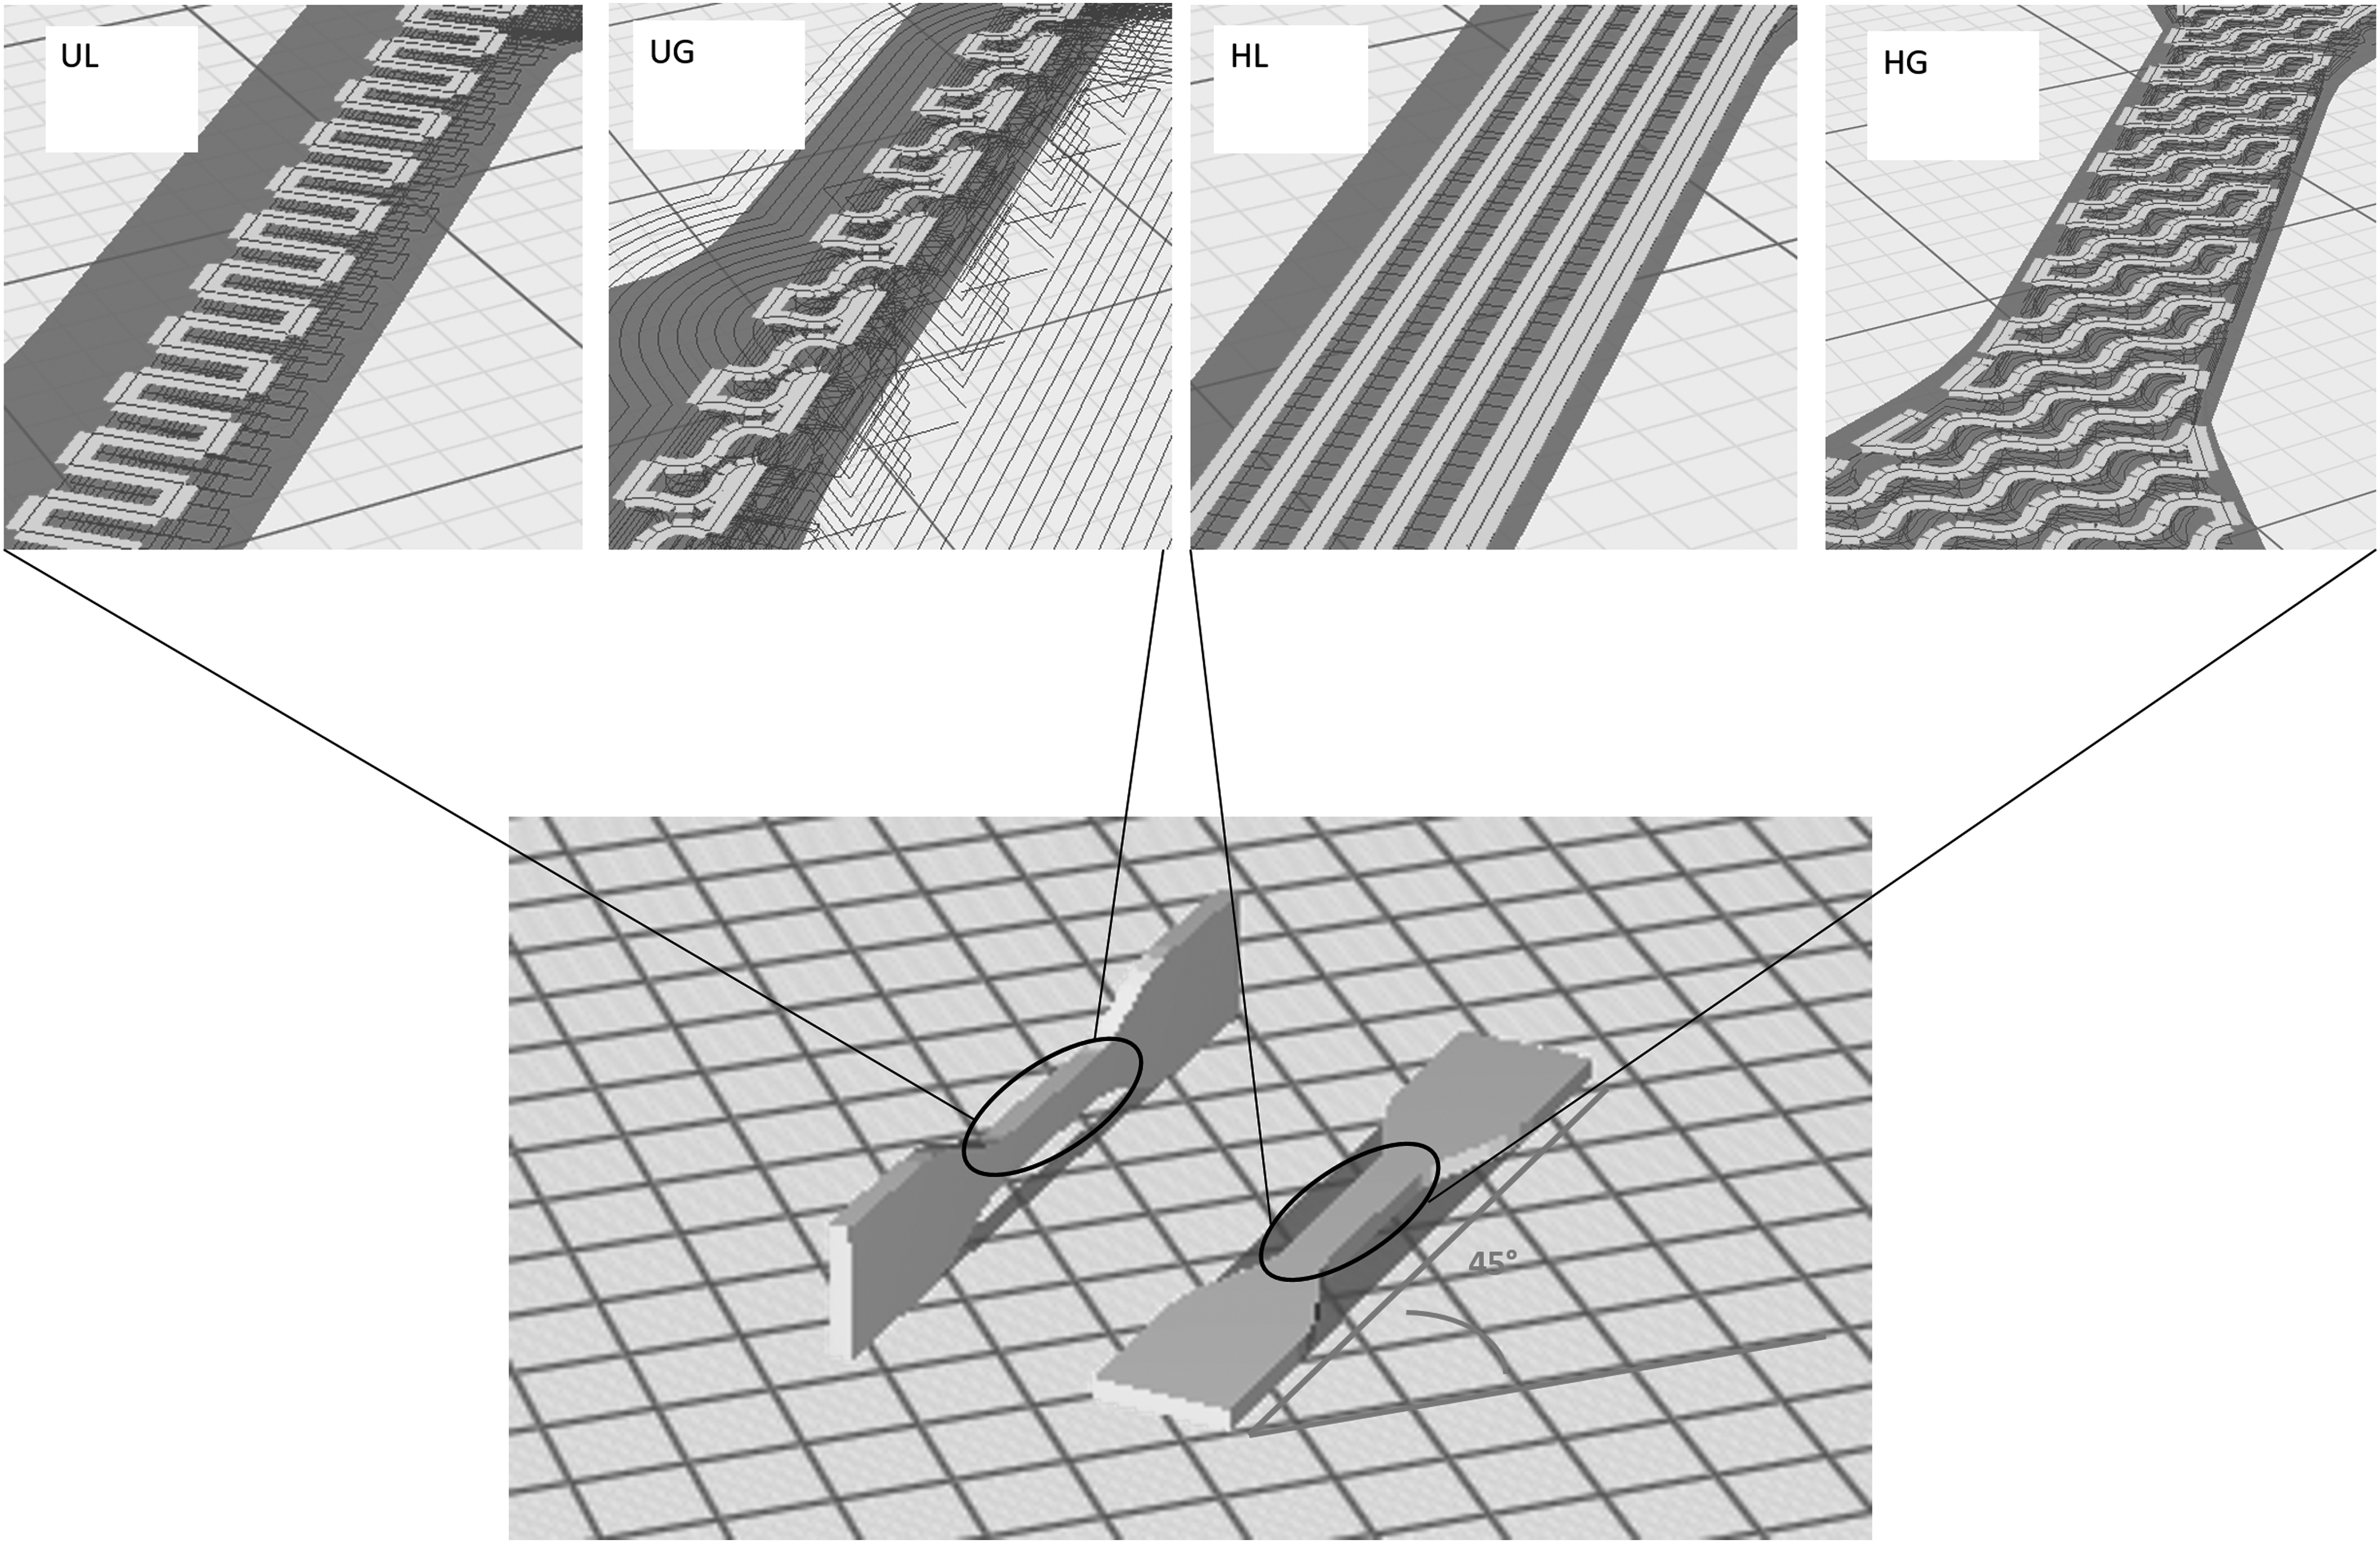
Simplified scheme of the printing methods and raster angle used.
Figure 2 shows schematically the specimens reference for different types of samples with their abbreviations. The meaning of each abbreviation is reported in Table 3.
Sample References for the 3D Printed Specimens
Five specimens for each type were built with two different printing orders; the first set of samples was produced simultaneously (indicated with A1), which means that the printing of the second layer for any sample did not occur until the first layer had been printed for all samples. By contrast, the second set of samples was manufactured in sequence (indicated with A2).
All the samples were printed according to the parameters given in Table 4 and without wall around the infill pattern structure. For the samples printed in vertical build direction, a support was used.
Parameters Used for the Printing
Mechanical tests
The tensile properties were evaluated according to ASTM D638 (IV), using a Lloyd EZ50 mechanical test machine at a crosshead speed of 5 mm/min. Specimen dimensions were 25 mm length, 4 mm width, and 2 mm thickness. Tests were carried out at room temperature; at least five specimens were tested for each sample, and the results were averaged to obtain a mean value. The impact properties were also evaluated according to ASTM D256 using a Pendulum impact testers Zwick/Roell HIT with a pendulum of 50J in Charpy configuration.
X-ray microtomography analysis and scanning electron microscopy
To analyze the morphological structure, a SkyScan 1174 (SkyScan, Belgium) X-ray radiography and tomography was used for image acquisition of the tensile test samples central part. Each sample was placed on a rotating plate while the X-ray beam passed through. The images were recorder by a CCD camera with resolution of 1024 × 1024 pixels, which revealed different levels of X-ray absorption of the sample. The total exposure time for each sample was 450 s, and the pixel size was 29.7 μm. Two images were taken per angular position and were averaged. After reconstruction of the 3D structure part of about 1.5 cm, the CT analysis software was used to measure the open/close porosity and specific surface of the voids. Furthermore, the isometric projections of the printed parts were obtained using the DataViewer software.
The fractured cross section from the tensile test printed samples was analyzed using the HIROX SH4000M SEM. The coated samples were left to dry at room temperature before SEM could be performed. The SEM analyses were performed at 20 kV and a magnification equal at 41 × .
Results and Discussion
Thermal properties
The TGA was carried out to analyze the thermal stability of the polymers used for the MEP filaments and to measure the amount of colorant used for the PLA 3D870. Regarding the kinetics of decomposition, no significant differences between the two PLA are observed, showing the mass loss in the temperature range of 300–550°C and the residual value read for the PLA 3D870 is 2.9% of white colorant.
Differential scanning calorimetry analysis was performed to measure and compare the thermal parameters. The values recovered from the cooling and second heating thermograms are reported in Table 5 for each kind of used PLA (3D850, 3D870).
Thermal Parameters Measured from Differential Scanning Calorimetry Analysis for PLA 3D870 and PLA 3D850
The materials do not show important differences in respect to the glass and melt temperature; furthermore, the PLA 3D870, for the experimental condition used, is characterized by the highest crystallization degree (xc) and crystallization enthalpy (ΔHc) compared with the PLA 3D850.
Regarding the crystallization kinetics, the PLA 3D850 and PLA 3D870 have been analyzed in isothermal condition. To visualize the isothermal crystallization kinetics, the degree of crystalline conversion could be used in function of time and constant temperature. The relative crystallinity at different crystallization time,
where Qt and Q∞ is the heat generated at time t and infinite time, respectively, and dH/dt is the rate of heat evolution.
Figure 3 shows the relative crystallinity as a function of the time for each polymer and at different crystallization temperatures. As can be seen from the curves, the crystallization half-time increase with the increase of crystallization temperature under the experimental conditions, which meant that slower crystallization rate appears at a higher crystallization temperature. As well known, the changing of the temperature has an effect on the rate of nucleation. In particular, the nucleation decreases when the temperature increase and then the overall crystallization rate decreases.31–35
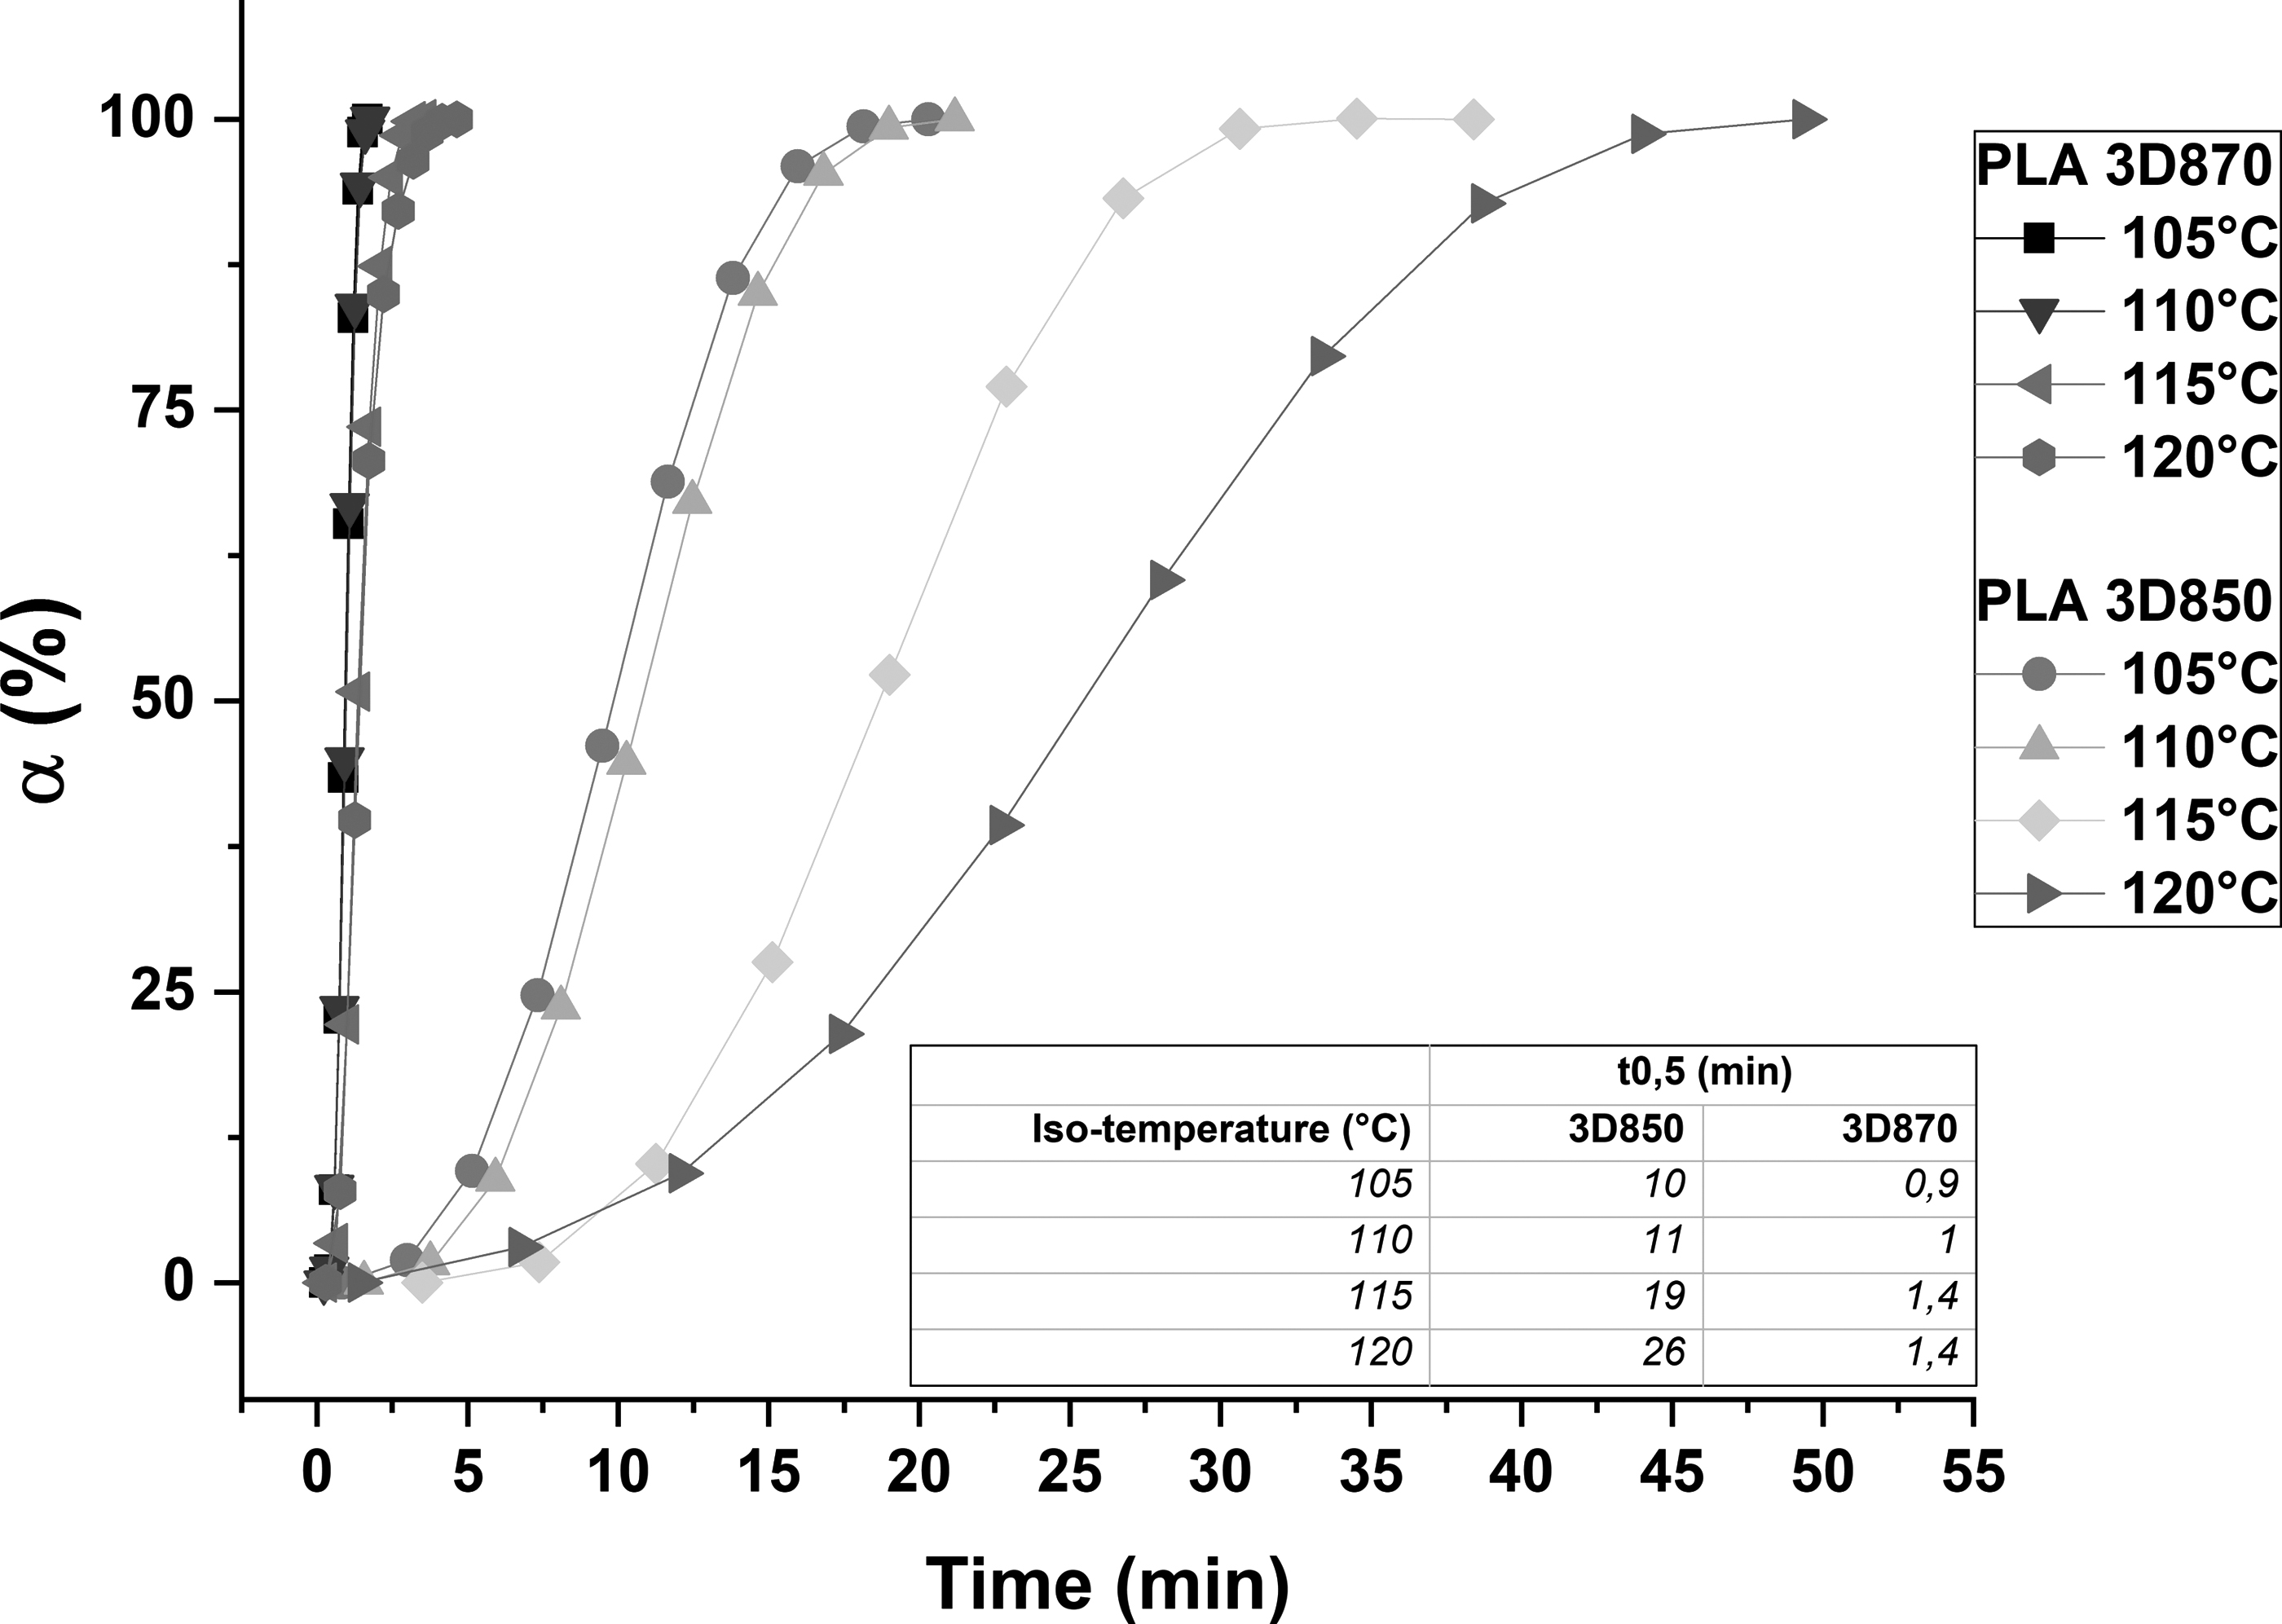
Relative crystallinity and half-crystallization time at 105°C, 110°C, 115°C, and 120°C for the PLA 3D870 and PLA 3D850.
Instead, it is interesting to observe the large difference between the PLA 3D850 and PLA 3D870 in terms of t1/2. In particular, the 3D870 has a higher rate of crystallization with a slight dependent of the t1/2 with the crystallization temperature. From 105°C to 120°C, the Δt1/2 for 3D870 is 0.5 min and for 3D850 is 16 min. The Avrami index measured for the two PLA is 3.6 and 3.3 for PLA 3D870 and PLA 3D850, respectively. The Hoffman–Lauritzen parameters are shown in Table 3. T0 was estimated finding the cutoff line with the graphic Tm versus Tc, whereas the K0 and Kg were obtained by a linear least square fitting.23,24
The evident difference in the crystallization behavior observed for the materials used in this study is a point of interest considering the different time of printing in the field of MEP fabrication. Moreover, the crystallization behavior can have an effect of the rheological behavior, very important for the bound welding of the material between the raster lines during the deposition.30,36,37
Temperature profile simulation
The temperature history has a significant impact on the thermal and rheological properties of the polymers. In particular, the MEP could be an important parameter for the bonding quality between each deposed layer and therefore of the mechanical properties of the final product. In the case of semi-crystalline polymers, the cooling rate and the range of temperature during the printing can have a significant effect on the viscous flow mechanism that appears during the sintering of adjacent raster lines.16,20–22,38 About these considerations, it was interesting to analyze the effect of the crystallization kinetics respect to the viscosity variation from the molten state to the solid state of the material. For this reason, a simulation was used to analyze more in detail the temperature profile and the crystallization kinetic evolutions of the deposed raster lines during the 3D printing.
The simulation was implemented considering a printing rate of 80 mm/s to print the final 3D part. A rectangular elements were considered as raster lines with a volume dimensions equal to 0.8 × 0.6 × 75 mm, obtaining a printing time of each raster line of 0.9 s. It was considered a perfect contact between each raster line. The average temperatures and crystallization degree on the x–y section for each raster line deposited during printing are shown in Figures 4 and 5, respectively. All the graphs in the figures are arranged on the left column for the sequence DTS1 and right column for DTS2. As can be observed, the average temperature (Fig. 4a, b) at the beginning of the deposition was the same for each raster line, corresponding at the initial condition value (215°C) used for the calculus. From the temperature profiles, it was possible to analyze the cooling rate during the deposition, marking that the cooling rate slows down adding the raster lines.
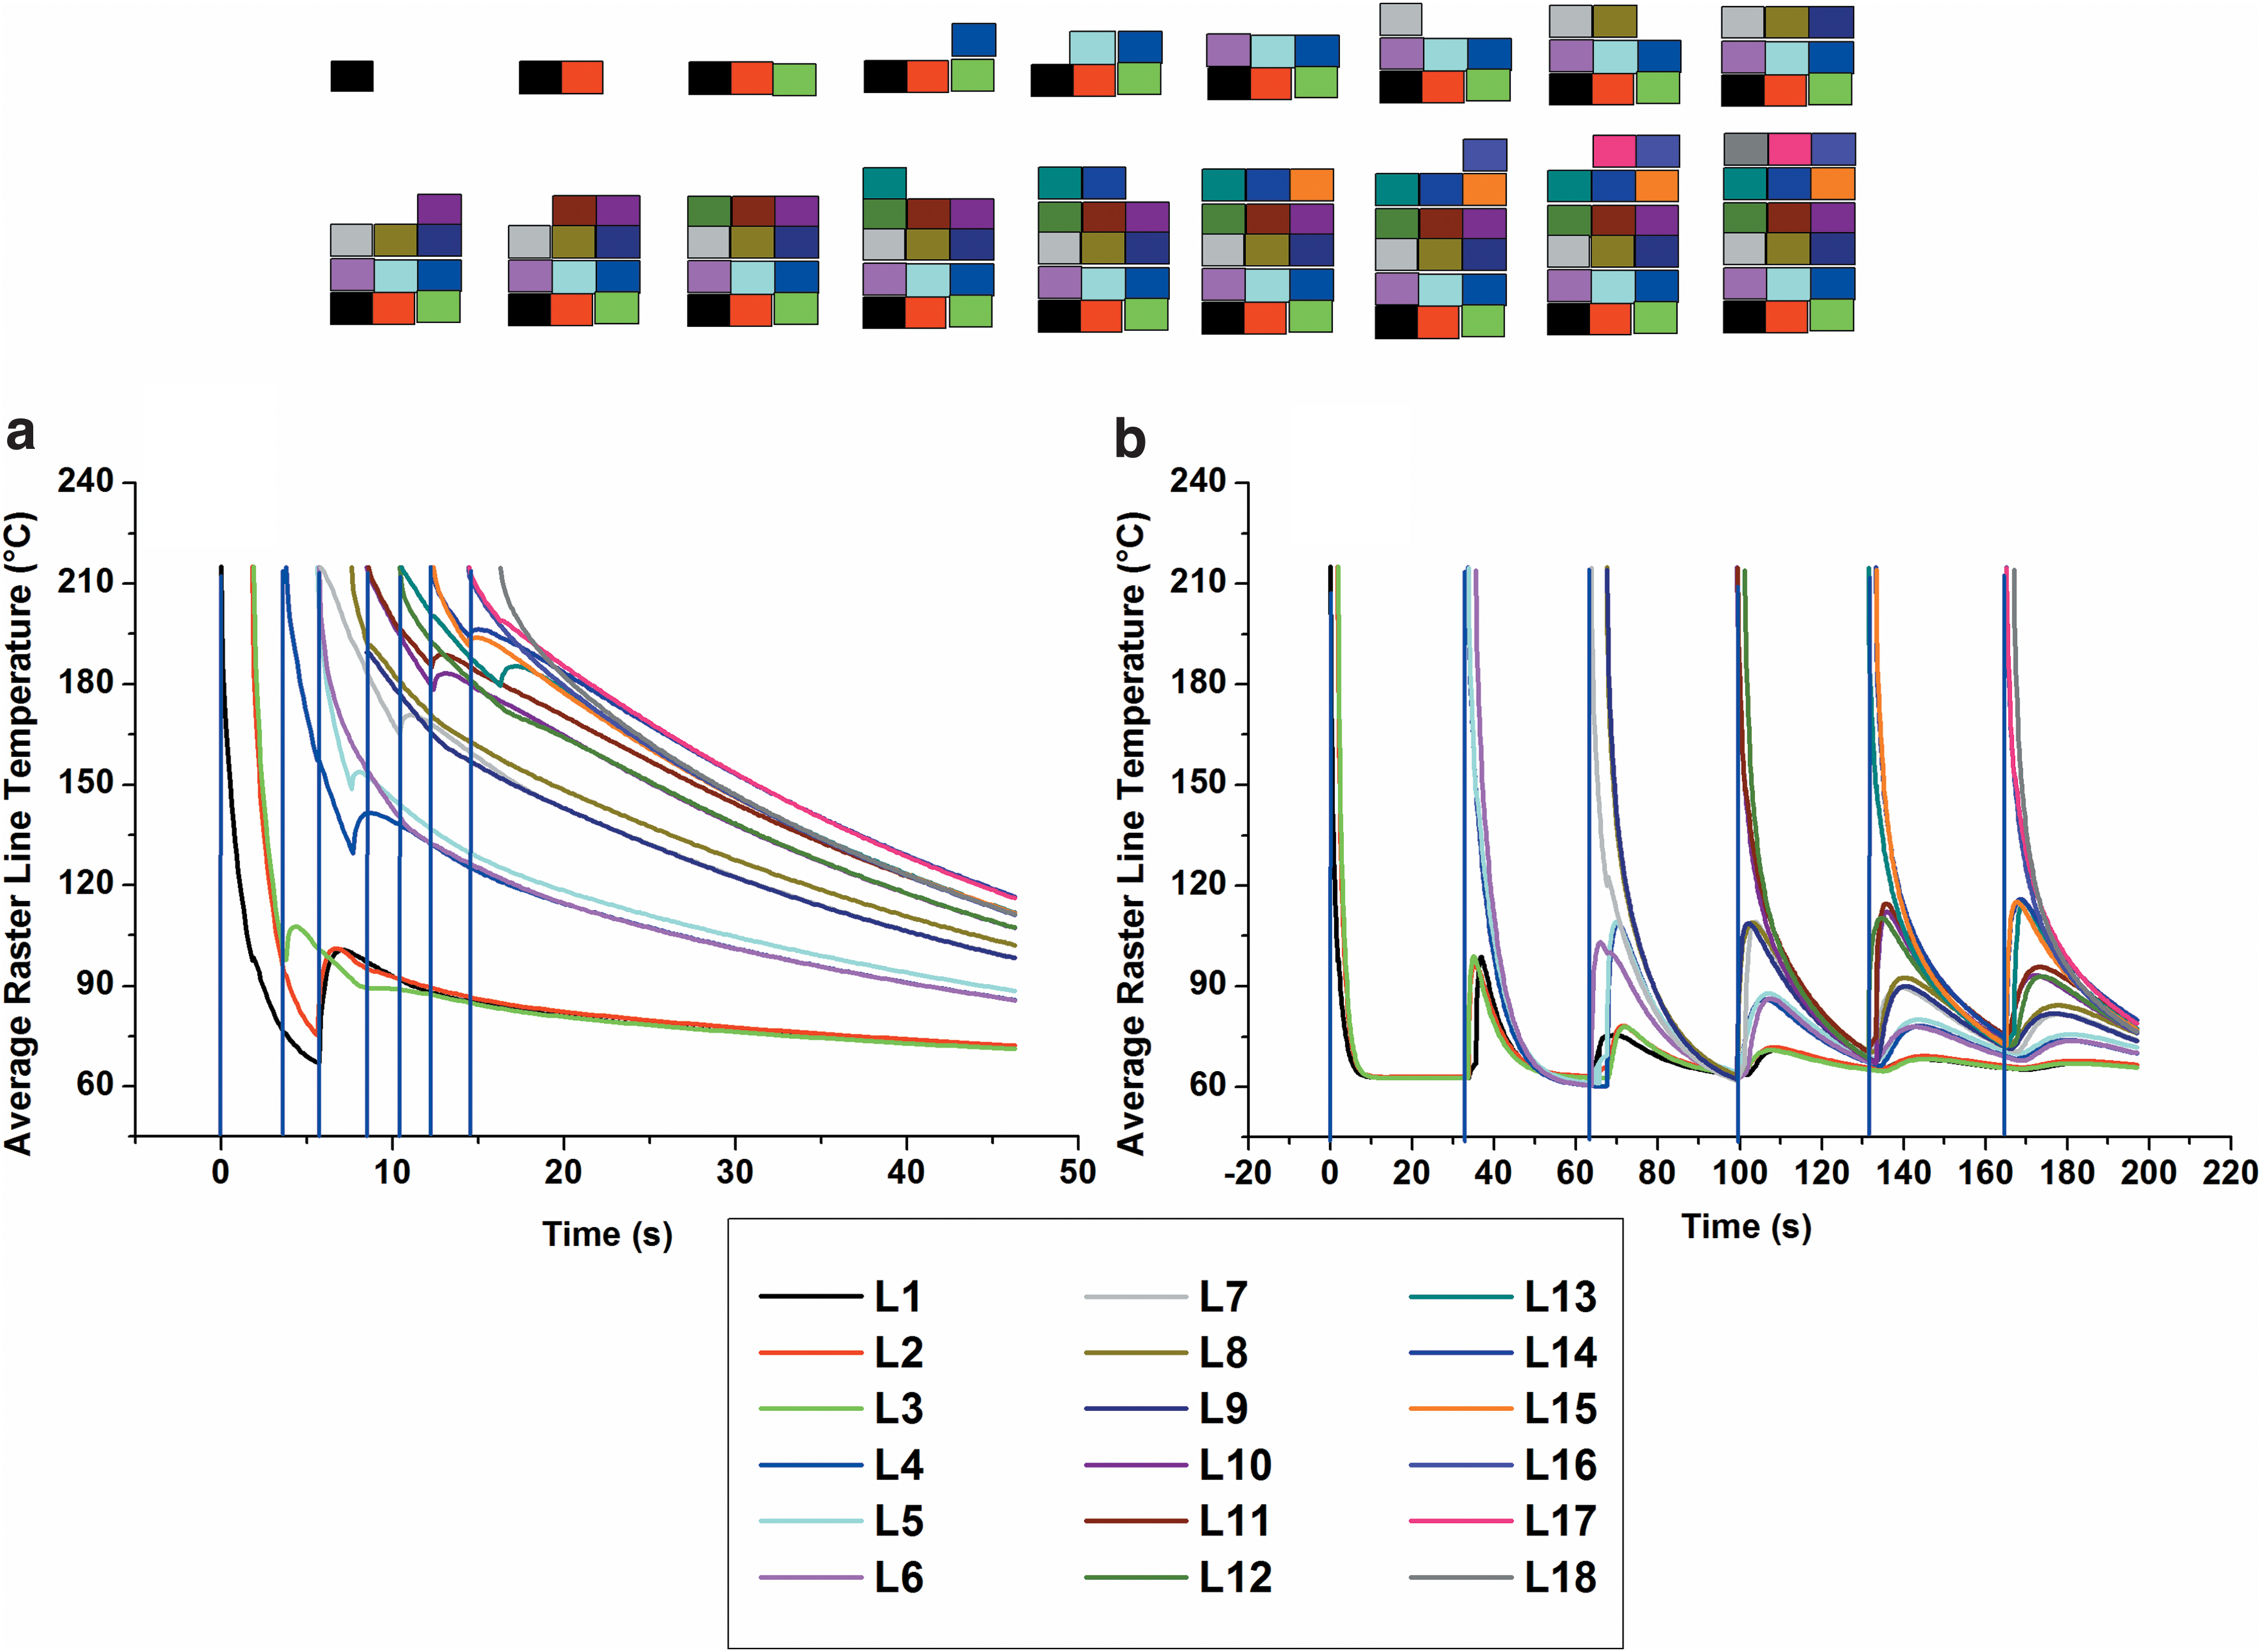
Average raster line temperature for the DTS1

Average raster line crystallization degree for PLA 3D870
The cooling rate depends on the heat exchange that is formed between the raster line deposited and the room of the 3D printer. Thus, the cooling rate reduction denoted in the DTS1 case (Fig. 4a) is due to the low temperature difference that is established by adding a new raster line. In fact, in these set conditions, the previously deposited layers do not have sufficient time to reach a stationary temperature before the arrival of a new raster line.
In contrast, the DTS2 (Fig. 4b) presents a different thermal history since the deposition sequence of each layer had 30 s of delay compared with the DTS1. In this case, the average temperature presents significant heating of the underlying raster lines to the new additions one. Then upon a cooling step that with the addition of successive layers reduces the global rate of cooling.
The graphs in Figure 5 show the average crystallization degree evolution for each raster lines in the case of the PLA 3D870 (Fig. 5a, b) and the PLA 3D850 (Fig. 5c, d). Concerning the case DTS1, no considerable differences are observed between the two types of PLA, remaining close to 0.1% before final cooling. Instead, the crystallization degree of the PLA 3D870 at the end of the simulation is slightly higher for all the raster lines. Regarding the DTS2, a stepwise effect is observed for each layer, highlighting the increase of the crystallization degree rate starting from the fourth layer. This behavior is linked to the re-heating due to the addition of the new layers as analyzed from the temperature profiles. Consequently, the raster lines remain in a more favorable temperature range for the crystallization. In this range, the crystal growth rate raises, which is described by a higher value of the Nakamura and Avrami constant rate. In terms of crystallization profile evolution, the PLA 3D870 presents the highest values, nevertheless, the stairs pattern has no significant differences.
Figure 6 depicts the temperature and the degree of crystallization contour on the section of each raster line at three different times in the case of the PLA 3D870 and for the DTS1 sequence.

Temperature (first row) and crystallization degree (second row) contour simulated for the PLA 3D870 and DTS1. Color images are available online.
As shown in the graphs, the temperature is higher in the center of the piece due to the presence of the surrounding layers, which cause a lower heat exchange and a lower cooling rate. This thermal behavior leads to a higher density of crystals in the center of the layers, consequently on the overall central region of the geometry (time = 189 s). Moreover, if it examines the distribution of crystallinity for the single raster line sections, and it grows from the bottom to the up. This result is strictly connected to the temperature difference that occurs in the deposition step, in fact, the bases of the raster lines coincide with a lower temperature being in contact with the cooled layer.
Rheological behavior
The master curve obtained with a frequency sweep test is reported in Figure 7a. The figure displays the complex viscosity at different temperatures for both studied PLAs. The results show a viscosity reduction with the increase of the temperature, and a negligible difference of the shear thinning behavior between the materials. As noted in other studies, 8 the typical temperatures used for the printing are relatively high concerning the thermal stability of the PLA, including in the range equal to 200–230°C. However, the residence time of the material in the 3D printer nozzle is short; in consequence, an unimportant thermodegradative effect appears. The frequency sweep test can describe only the viscosity changes during the extrusion through the nozzle, but not the real material viscosity after leaving the nozzle. 5

Master curves of the PLA 3D870 and PLA 3D850 at different temperatures: 185°C, 190°C, 200°C, 210°C, and 220°C
In fact, after the material leaves the nozzle, the mechanical stresses due to the walls of the nozzle disappear and the viscosity change is mostly due to the molecular relaxation and the material cooling. 36 To analyze the rheological behavior during the quiescent crystallization, the measurement of the viscosity was performed in function of the time and at various constant temperatures equal to 105°C, 110°C, 115°C, and 120°C. The induction time of crystallization (t0) is used. It is defined as the intersection between the largest slope and the line through the initial plateau of the complex viscosity–time curve and represents the onset of the crystallization kinetics (indicated by two red lines in Fig. 7b).30,37
The square symbol curves in Figure 7b represent the evolution of the complex viscosity for the PLA 3D850 in function of the time. It can be observed that the induction time increases with the increase of the temperature. As observed with the scanning calorimetry analysis, the quiescent crystallization kinetics of the PLA 3D870 (empty dot symbols) also shows a significant difference compared with the PLA 3D850. It presents a short induction time and a negligible dependence with the temperature. In addition, the maximum viscosity reached at the end of the crystallization is similar for both PLA types, and this is true for different crystallization temperatures.
The effect of the cooling on the residual stresses of the PLA was analyzed with a gap test at a constant gap by monitoring the normal force. The analysis was performed for 2 min at various temperatures.
Figure 7c and d shows the results obtained for the PLAs used. The normal force variation for the PLA 3D870 is significant in the temperature range of 120–130°C. It takes place in correspondence with the crystallization transition because of a volume retraction of the material. The same behavior is also observed for the PLA 3D850 in the temperature range of 110–115°C, but with less intensity in terms of increase in normal force. From the curves, for each temperature, a minimum can be detected corresponding to the maximum force value of retraction for each PLA used. This characteristic of the materials can indicate that after each temperature change, there is a reorganization time of the polymer chains.
In the first moment, when the temperature reduces, the contract force increases. However, after a peak force, the macromolecules are brought to restore an internal energy balance. By joining the minimum of each curve, maximum retraction force profiles were been drawn. It can be noted that as the temperature decreases, the peak reaches more slowly. This phenomenon can be associated to the increase in the crystalline phase, which reduces the mobility of macromolecules.38,39 The different intensities of the variation in the retention force between the analyzed polymers agree with the results obtained at the differential scanning calorimetry. In fact, the greatest variation occurred for the PLA 3D870, which presented a higher crystalline content (degree of crystallinity equal to 46%).
Morphological properties
In Figure 8a, the images show the isometric projections obtained with X-ray tomography of the tensile specimens printed with different fabrications (A1 and A2) and building directions (vertical and horizontal). As it is possible to observe, the presence of voids (black regions in the object section) are more evident in the case of the samples produced simultaneously compared with the samples produced in sequence, where the final parts are less dense and uniform in the microstructure. That observation is confirmed by the values of porosity reported in Table 6 and by the SEM images of fracture cross section of the samples subjected to traction shown in Figure 8b.
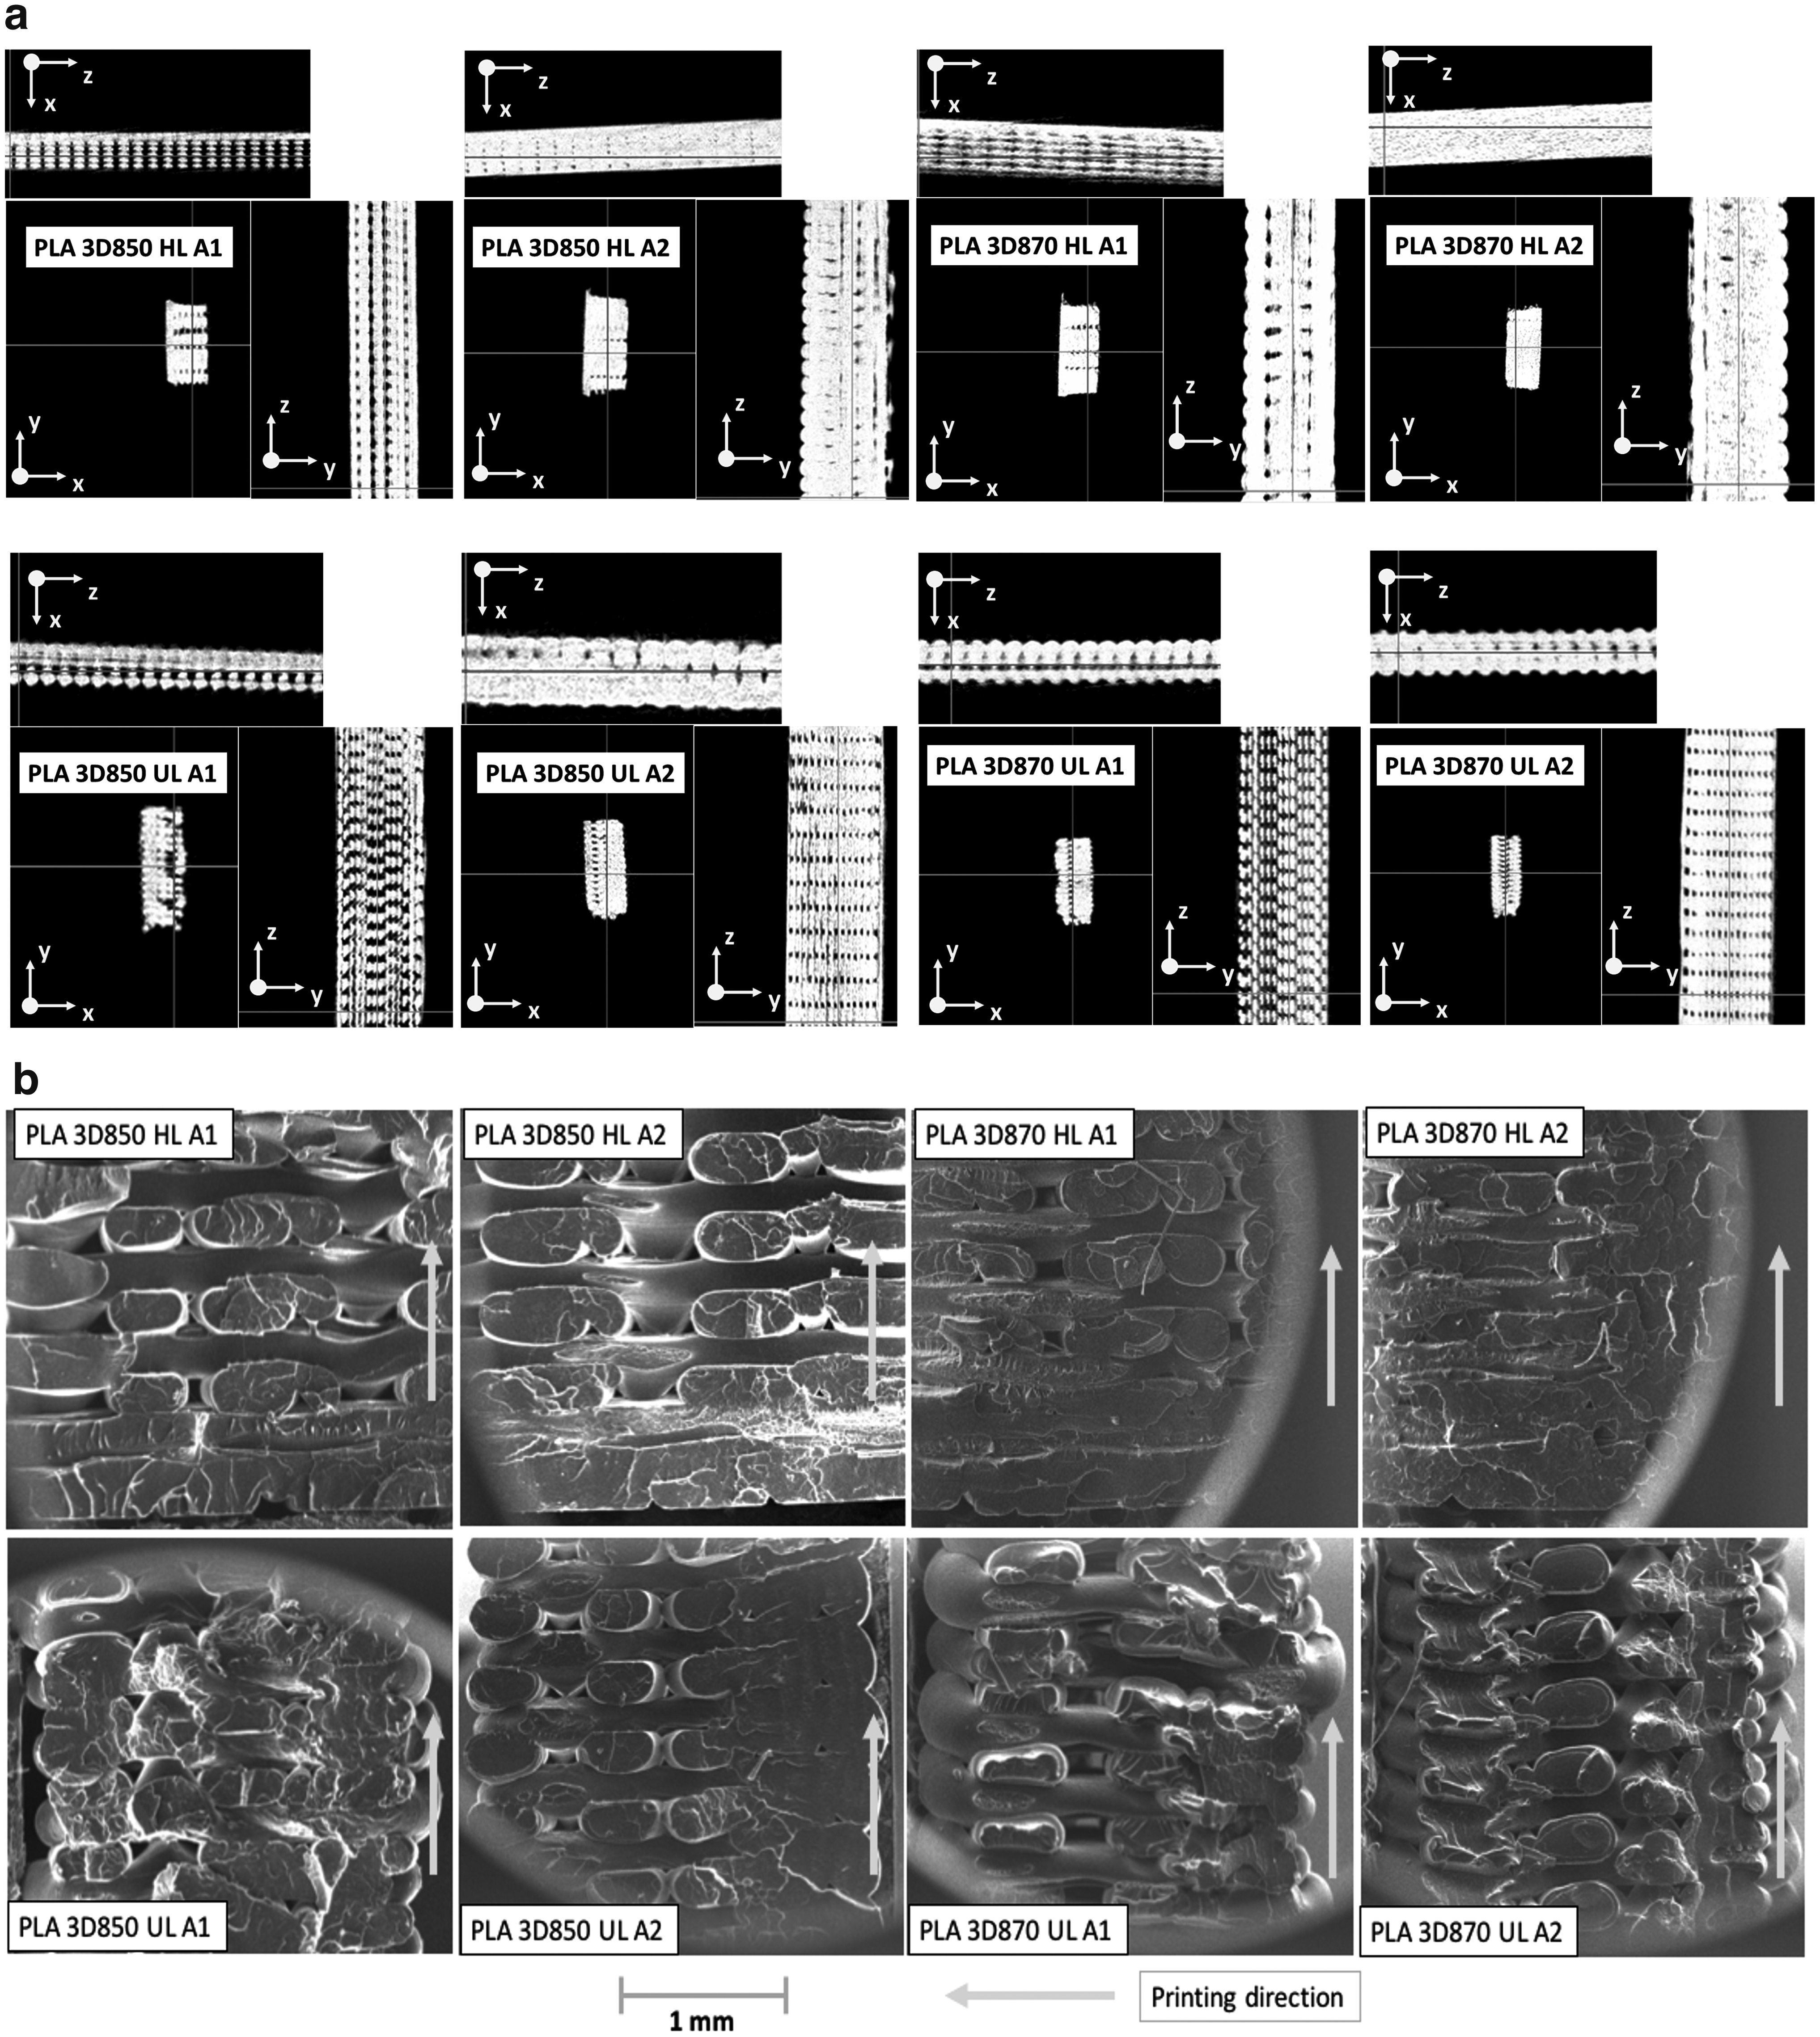
The isometric projections obtained with X-ray tomography
Porosity Analysis Values
The presence of voids and the poor uniformity of the microstructure found in the case A1 can be explained by the different thermal history of the layers during the printing. In fact, the time delay between every layer deposition is higher than in the case A2, having an effect on the bound welding. As observed previously from the simulation, when the time delay increases, the temperature profile of the materials during the printing has several fluctuations, passing over a large range. As consequence, the material presents significant viscosity variations and different crystallization rates along the print volume and between the top and bottom sections of each raster lines, interfering on the uniform diffusion time of the macromolecules chains between the filaments layers.
In conclusion, the bound welding can be arrested when the material does not achieve significant coalescence, obtaining less interlayer cohesion.4,40
Bakrani compared experimental and simulation results of the welding depth of PEEK polymer for different temperatures, concluding that a higher temperature profile increases the contact area between the raster lines. 41 Similar results were obtained by Seppala et al. In this work, the evolution of welding times for samples printed with mono-raster lines layers was analyzed. The experimental results showed a similar effect of the temperature on the material welding. 42 These results are in accordance with this article, the sequentially printed samples (higher temperature profile) show greater cohesion between the layers.
Mechanical properties
The elastic modulus of the specimens prepared by 3D printing is reported in Figure 9a and b. Generally, for each sample, the fabrication in sequence (A2) has shown a higher value than simultaneously one (A1). Concerning the results obtained for PLA 3D870, the difference in elastic modulus between the A1 and A2 fabrication was more evident. In particular, A2 samples have about 35% higher values than A1 samples made in the vertical direction and about 20% for samples made in the horizontal direction. However, the PLA 3D850 shows slight differences between the printing A1 and A2.

Young's modulus of the tensile specimens printed:
These differences in elastic modulus between the samples printed with both kinds of PLA can be explained considering the different thermal/rheological behaviors of the materials. In accordance with what is shown in the previous paragraphs, the PLA 3D870 has a strong increase in viscosity during the printing because of the high crystallization rate and higher crystallinity content. This phenomenon causes the reduction of the reptation time of the macromolecules and their intramolecular diffusion between the deposited layers during the printing, consequently, more voids in the final parts appear as observed from the morphological analysis. 43
The voids formed during printing generate discontinuities of the polymeric phase causing a reduction in tensile strength of the printed parts. Yang et al. and Liao et al. showed similar results by analyzing the mechanical properties as a function of the porosity of the 3D printed samples.14,15 Instead, for PLA 3D850, greater cohesion has been observed as it has almost an amorphous character, showing slight differences in terms of elastic modulus.
Between line and gyroid patterns, enormous variations are not observed for both the case A1 and A2. If it considers the absolute value of the elastic modules concerning the building direction, it can be noted from the graphs in Figure 9a and b that the values are higher than the vertical direction one. Thus, the horizontal direction is the most convenient option for mechanical tensile rigidity.
The ultimate strength and the elongation at break are reported in Figure 9c, d, and e, f. The samples produced with the PLA 3D850 (Fig. 9c) show an ultimate strength trend of the mean values higher for the pieces printed in sequence and in the horizontal direction, where the highest is for gyroid pattern. However, if one takes into account the standard deviations shown in the column chart, it can be observed that the deviation dispersion of the ultimate strength is relatively large, mostly for the samples printed simultaneously.
This result can be linked to several factors, such as unevenness of the temperature on the printing plate, unevenness of the PLA filament coming from the roll, and temperature profile in the printing chamber. The results obtained for the elongation at break in the case of the PLA 3D850 (Fig. 9e) present higher mean value for the samples printed in sequence, but there are no differences between the values related at building direction and infill pattern. Indeed, the PLA 3D870 shows higher mean value for the samples printed simultaneously and with gyroid pattern. However, also for the elongation at break, the standard deviation is noted with a relatively large dispersion, confirming the previous considerations about the several factors during the printing, which have an effect on the variability properties of the final part.
The ultimate strength measured for the specimens produced with PLA 3D870 is reported in Figure 9d. The most evident difference is observed between the samples produced with A1 and A2 fabrication and in the vertical direction, showing lower values for A1. A reduction is also examined for the elongation at break (Fig. 9f) for all the samples.
A great uniformity of the microstructure, as observed for the final part printed in sequence, normally gives higher ultimate strength and elongation at break. 44 Thus, a possible explanation of the behavior shown for the 3D870 printed samples may be related to the less crystallinity degree of the final part printed in sequence, as observed in the simulation performed in the first part of this work. In this case, the highest values for the PLA 3D870 are presented by the samples printed in the vertical direction and gyroid pattern.
The Charpy impact strength is shown in Figure 10. As shown in this figure, the samples printed with PLA 3D870 have higher values than those printed with PLA 3D850. The results are consistent with what is observed from the supplier's data (Table 2). The Charpy impact of the samples made in the vertical direction is about 21% higher than samples made in the horizontal direction for PLA 3D870 but does not present a significant difference between the fabrication strategies A1/A2 and the infill pattern. In the same way, the PLA 3D850 samples present a trend where the vertical direction has the highest impact strength compared with the horizontal direction.
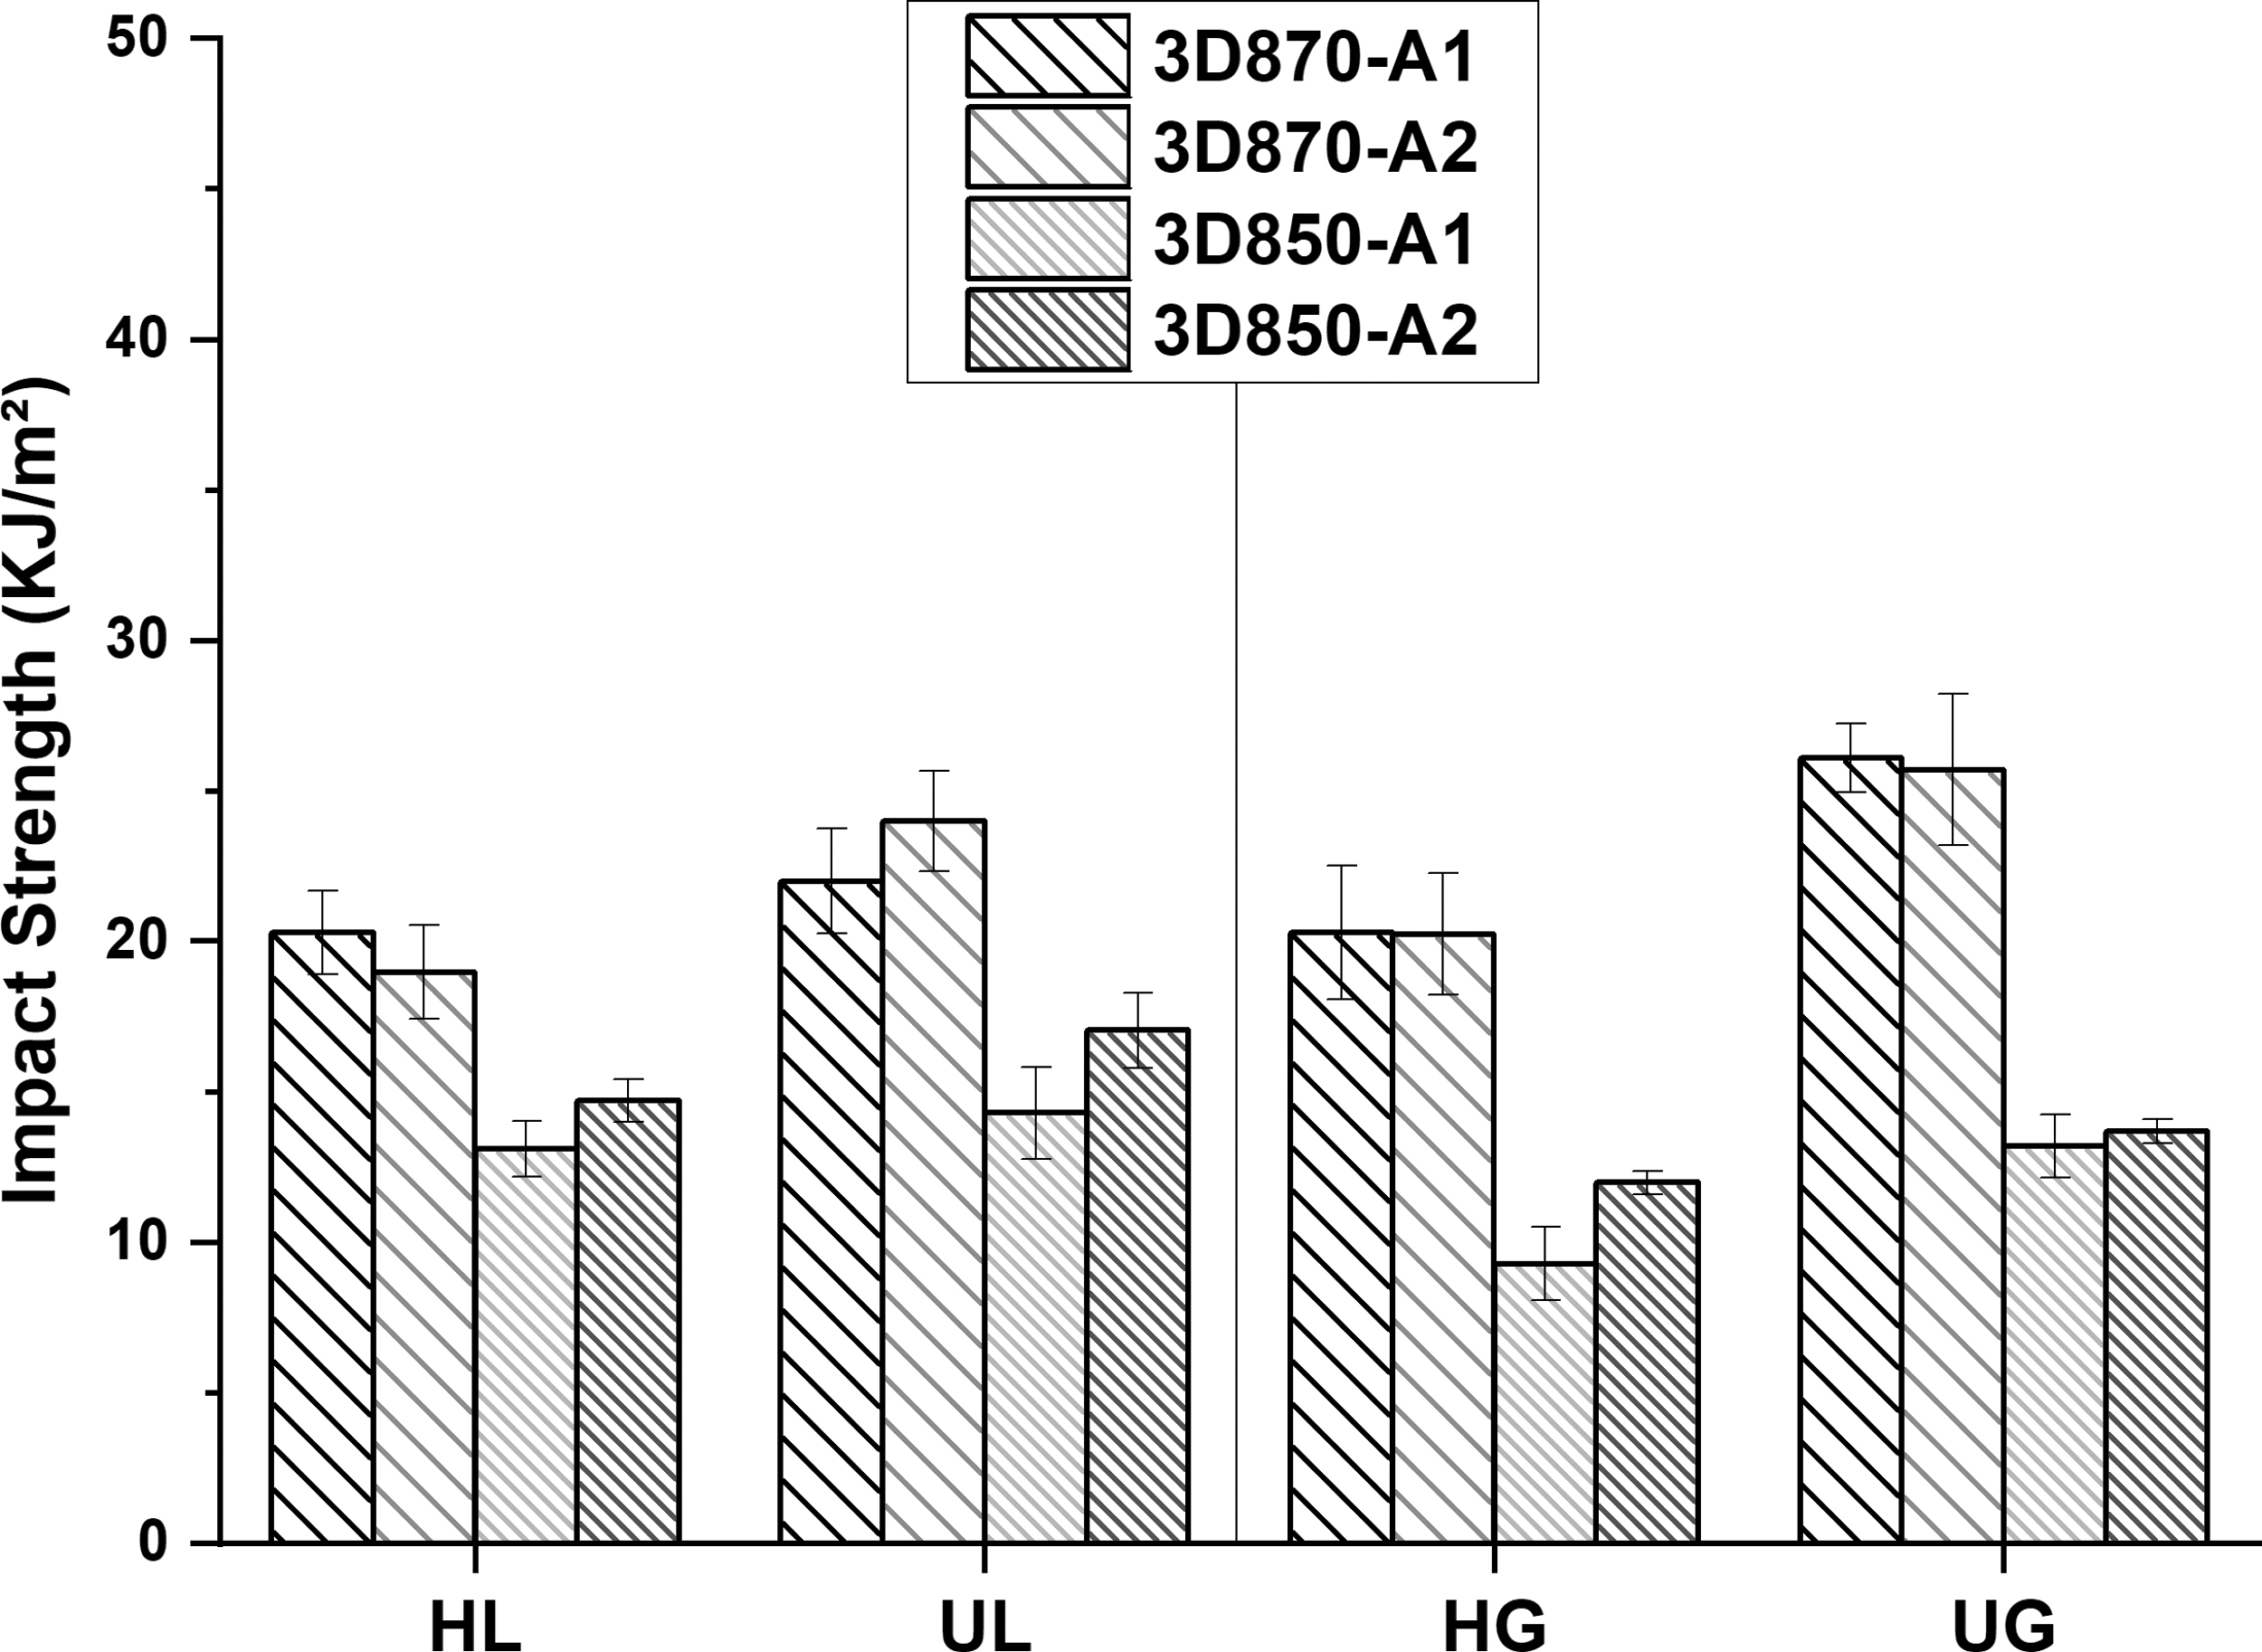
Charpy impact strength for all the printed samples.
Moreover, for this PLA, the samples printed in sequence have a slightly higher value than the other printed simultaneously. The difference observed between the horizontal and vertical directions is probably due to the layer height samples that change in function of the building direction. In fact, in the case of horizontal building, the layer height measured in the direction of the impact test is about 0.46 mm, whereas for the vertical direction building is 0.15 mm. Normally, the lowest layer height gives the highest impact value. However, the impact strength of PLA is dependent on many aspects: fracture morphology, molecular weight, crystallinity, etc. 45
Conclusions
Two commercial polymer filaments used for 3D printing with different crystallization kinetics were characterized by differential scanning calorimetry. In particular, the measurements were conducted under isothermal and nonisothermal conditions. From the results, the Avrami and Nakamura parameters are calculated.
To investigate the effect of the deposition time sequence on the thermal history and on crystallization kinetics evolution during the MEP, a numerical simulation based on the finite element analysis method is performed. The results have shown significant differences in the thermal profiles comparing different deposition time sequences, highlighting a greater thermal excursion for longer delay times between the layers. Specifically, the reheating of the layers following the addition of new raster lines leads to subsequent cooling, which allows a higher crystallization rate. This thermal behavior affects the evolution of the crystallization degree characterized by a step pattern.
Moreover, the analysis of the temperature and crystallization degree contour on the raster line sections have shown a major density of crystals in the center of the final part with a growing profile from the bottom to the top for each raster line section.
The effect of crystallization kinetics on mechanical properties was investigated in correlation with the rheological behavior of the polymer filaments used. The produced samples were printed simultaneously and in sequence, in the horizontal and vertical directions. Moreover, line and gyroid infill patterns have been used. The results obtained from the tensile tests show better rigidity for the samples printed in sequence due to the minor time of delay between the deposition of the layers. However, the highest differences are presented by PLA 3D870 because of a high rate of crystallization compared with the PLA 3D850. This characteristic of the material affects the rheological behavior during printing by promoting a reduction of the macromolecular diffusion between adjacent filaments, resulting in less cohesion.
This assumption is confirmed by morphology analysis performed with an X-ray tomography analysis and SEM observation of the fractured cross section of tensile specimens. In fact, the images show better microstructural uniformity for the samples printed in sequence. Concerning the impact properties, the samples made in the vertical direction have shown higher values than the horizontal direction for PLA 3D870 but did not present significant difference between the fabrication strategies A1/A2 and the infill pattern. However, the PLA 3D850 samples printed in a sequence have slightly higher values than the other samples printed simultaneously.
Footnotes
Author Disclosure Statement
No competing financial interests exist.
Funding Information
No funding was received for this work.