
Abstract
Cellular structures including three-dimensional lattices and two-dimensional honeycombs have significant benefits in achieving optimal mechanical performance with light weighting. Recently developed design techniques integrated with additive manufacturing (AM) technologies have enhanced the possibility of fabricating intricate geometries such as honeycomb structures. Generally, failure initiates from the sharp edges in honeycomb structures, which leads to a reduction in stiffness and energy absorption performance. By material quantity, these hinges account for a large amount of material in cells. Therefore, redesigning of honeycomb structures is needed, which can improve aforementioned characteristics. However, this increases the design complexity of honeycombs, such that novel manufacturing techniques such as AM has to be employed. This research attempts to investigate the optimal material distribution of three different topologies of honeycomb structures (hexagonal, triangular, and square) with nine different design configurations. To achieve this, higher amount of material was distributed at nodes in the form of fillets while keeping overall weight of the structure constant. Furthermore, these design configurations were analyzed in terms of stiffness, energy absorption, and the failure behavior by performing finite element analysis and experimental tests on the samples manufactured using Multijet fusion AM technology. It was found that adding material to the edges can improve the mechanical properties of honeycombs such as stiffness and energy absorption efficiency. Furthermore, the failure mechanism is changed due to redistribution of material in the structure. The design configurations without fillets suffer from brittle failure at the start of the plastic deformation, whereas the configurations with increased material proportion at the nodes have larger plastic deformation zones, which improves the energy absorption efficiency.
Introduction
Ultralight cellular structure materials1–3 have been widely used in biomedical, 4 transportation, aerospace, and automotive industries 5 due to high strength-to-weight ratio, 6 stiffness and energy absorption abilities. 7 Honeycomb is a type of two-dimensional (2D) cellular material, which consists of various shapes of unit cell, having different mechanical properties in out-of-plane and in-plane directions. 8 Different shapes of honeycomb structures have been employed for energy absorption and impact protection applications for decades.9,10 Engineered honeycomb structures were manufactured in 1930 for the first time. Conventional techniques for manufacturing of honeycomb structures and sandwich panels include resistance welding, adhesive bonding, diffusion bonding, expansion and corrugation, and brazing and thermal fusion methods. 11
Aforementioned methods have several limitations, including constraints of limited wall thickness-to-cell edge length ratio, constraint of smallest unit cell size fabrication, and infeasibility of one production system to produce honeycomb structure of several different shapes. 12 In addition, it could be time consuming and even almost impossible for conventional methods to manufacture customized honeycomb structures having variability in topological configurations, material distribution, and/or wall thickness. Therefore, the honeycomb structures designed for traditional manufacturing method and being used for the past 10 decades may not be optimized in shape, material distribution, and other characteristics.
3D printing or additive manufacturing (AM) technology 13 is capable to greatly overcome the conventional manufacturing limitations. 14 Due to recent advancements in AM technologies,15,16 complex geometries 17 including lattice 2D honeycombs and three-dimensional (3D) structures can be manufactured with several variabilities in unit cell topologies, variable densities, 18 and even customized material distribution. 19 Therefore, nonoptimized conventionally manufactured honeycomb structure that fails due to design simplicity and uniform material distribution can be redesigned for AM by using optimized topologies and material distribution for both in-plane and out-of-plane honeycomb applications.
A large number of researchers have investigated the effect of various topological configurations such as tandem honeycombs, hierarchical honeycombs, filled-type honeycombs, negative Poisson's ratio honeycombs, and embedded type honeycombs on the mechanical performance. However, very few studies have examined the effect of variable density, variable material distribution, and customized shape of honeycomb structures on performance of honeycomb structures. 11 Furthermore, many researchers have studied honeycomb structures made of metallic materials,20–24 but a few studies have also been conducted on AM using polymeric materials, 25 ceramics, 26 and carbon fiber reinforced polymer. 27
Correa et al. 28 investigated energy absorption of negative stiffness honeycombs manufactured with Nylon 11 material using selective laser sintering technology. In a recent study, Hedayati et al. 12 studied elastic and buckling properties of octagonal honeycombs 3D printed using polylactic acid material on fused deposition modeling (FDM) technique. However, they did not investigate the failure and energy absorption behavior of aforementioned honeycombs.
Chuang and Huang 29 studied the effects of solid distribution on the elastic buckling strength of regular hexagonal honeycombs through a semi-integral analytical approach, and observed that by increasing the amount of solid in the nodes, the elastic buckling strength first increases and then decreases. The values of elastic buckling strength with increasing solid distribution at nodes are compared with the value of elastic buckling strength of a regular honeycomb with no additional material at the nodes.
The trend varies for different relative densities such that at low relative densities the increase is very minimal at small values of solid distribution at nodes with a steady decrease, but for high relative densities increasing the amount of solid at the nodes allows for a greater region of increasing elastic buckling strength as compared with low relative densities. Furthermore, the peak values of buckling strength occurred at higher values of solid distribution at nodes for higher relative densities as compared with low relative densities. Similar results were reported for elastic moduli and plastic collapse strength. 30
Simone and Gibson 31 studied the effects of solid distribution on the stiffness and strength of metallic foams through finite element analysis (FEA). They noted that for hexagonal honeycombs the trend of stiffness and strength with increasing solid distribution at the vertices first increases and then decreases.
Yang et al.32,33 performed a numerical analysis of the stiffness of regular hexagonal honeycombs with varying solid distribution at vertices. Their results were similar to those of the studies presented above, such that the increase in solid distribution at nodes leads to an increase in the stiffness and strength, achieving a peak value and a sharp decline. Increasing the relative densities increases the region of greater stiffness and strength with increasing solid distribution at nodes as well as the location of peak values, which occur at higher values of solid distribution at high relative densities. It was observed that the effect of dual imperfections in the hexagonal honeycomb was to slightly increase the buckling strength followed by a decrease as the intensity of the imperfections was increased.
Furthermore, it was noted that the overall effect of imperfections could be obtained through the product of effects of individual imperfections as opposed to the additive law proposed by Grenestedt. 34
Ingrole et al. 9 designed hybrid honeycomb structures with enhanced mechanical properties by combining together regular hexagonal honeycomb with re-entrant Auxetic honeycomb. It was observed that by combining these two structures to form hybrids, the mechanical properties of the hybrids such as compressive strength and energy absorption would have higher values as compared with regular hexagonal honeycomb or re-entrant Auxetic honeycomb. Bates et al. 35 studied regular honeycombs manufactured from polyurethane for energy absorption, and revealed that the energy absorption of regular hexagonal honeycombs depends on the relative density, parent material, and loading direction.
Literature review indicates that honeycomb shape configuration and material distribution significantly influence the elastic, failure behavior, and energy absorption properties. However, optimal material distribution (more material can be distributed at nodes/edges) has not been studied well due to conventional design and manufacturing constraints. In this study, an optimal material distribution has been carried out by adding more material at the edges (by adding fillets) of three different types of honeycomb topologies, including hexagonal, triangular, and square honeycombs.
All the designed samples were fabricated using Multijet Fusion 4200 3D printer with Nylon 12 plastic material. Furthermore, deformation behavior, failure modes, stiffness, and energy absorption properties were investigated and discussed. FEAs using ANSYS were performed for the validation of experimental results. The results indicate that MJF AM technique is capable to fabricate customized honeycomb structures, which are challenging to manufacture traditionally. In addition to that, the aforementioned properties can be enhanced by designing customized honeycombs by distributing material optimally.
Design of Honeycomb Structures
In this investigation, three different design configurations including hexagonal, triangular, and square honeycomb structures were designed with uniform material distribution and variable material distribution by introducing fillets at the edges. The illustration of design methodology can be seen in Figure 1. Simple honeycomb structures with uniform material distribution are shown (Fig. 1) at the top, and the bottom figures show the material distribution of all three design configurations studied for each type of honeycomb structure. In addition, all nine design configurations are named based on the shape of honeycomb and the fillet radius used for that particular design.
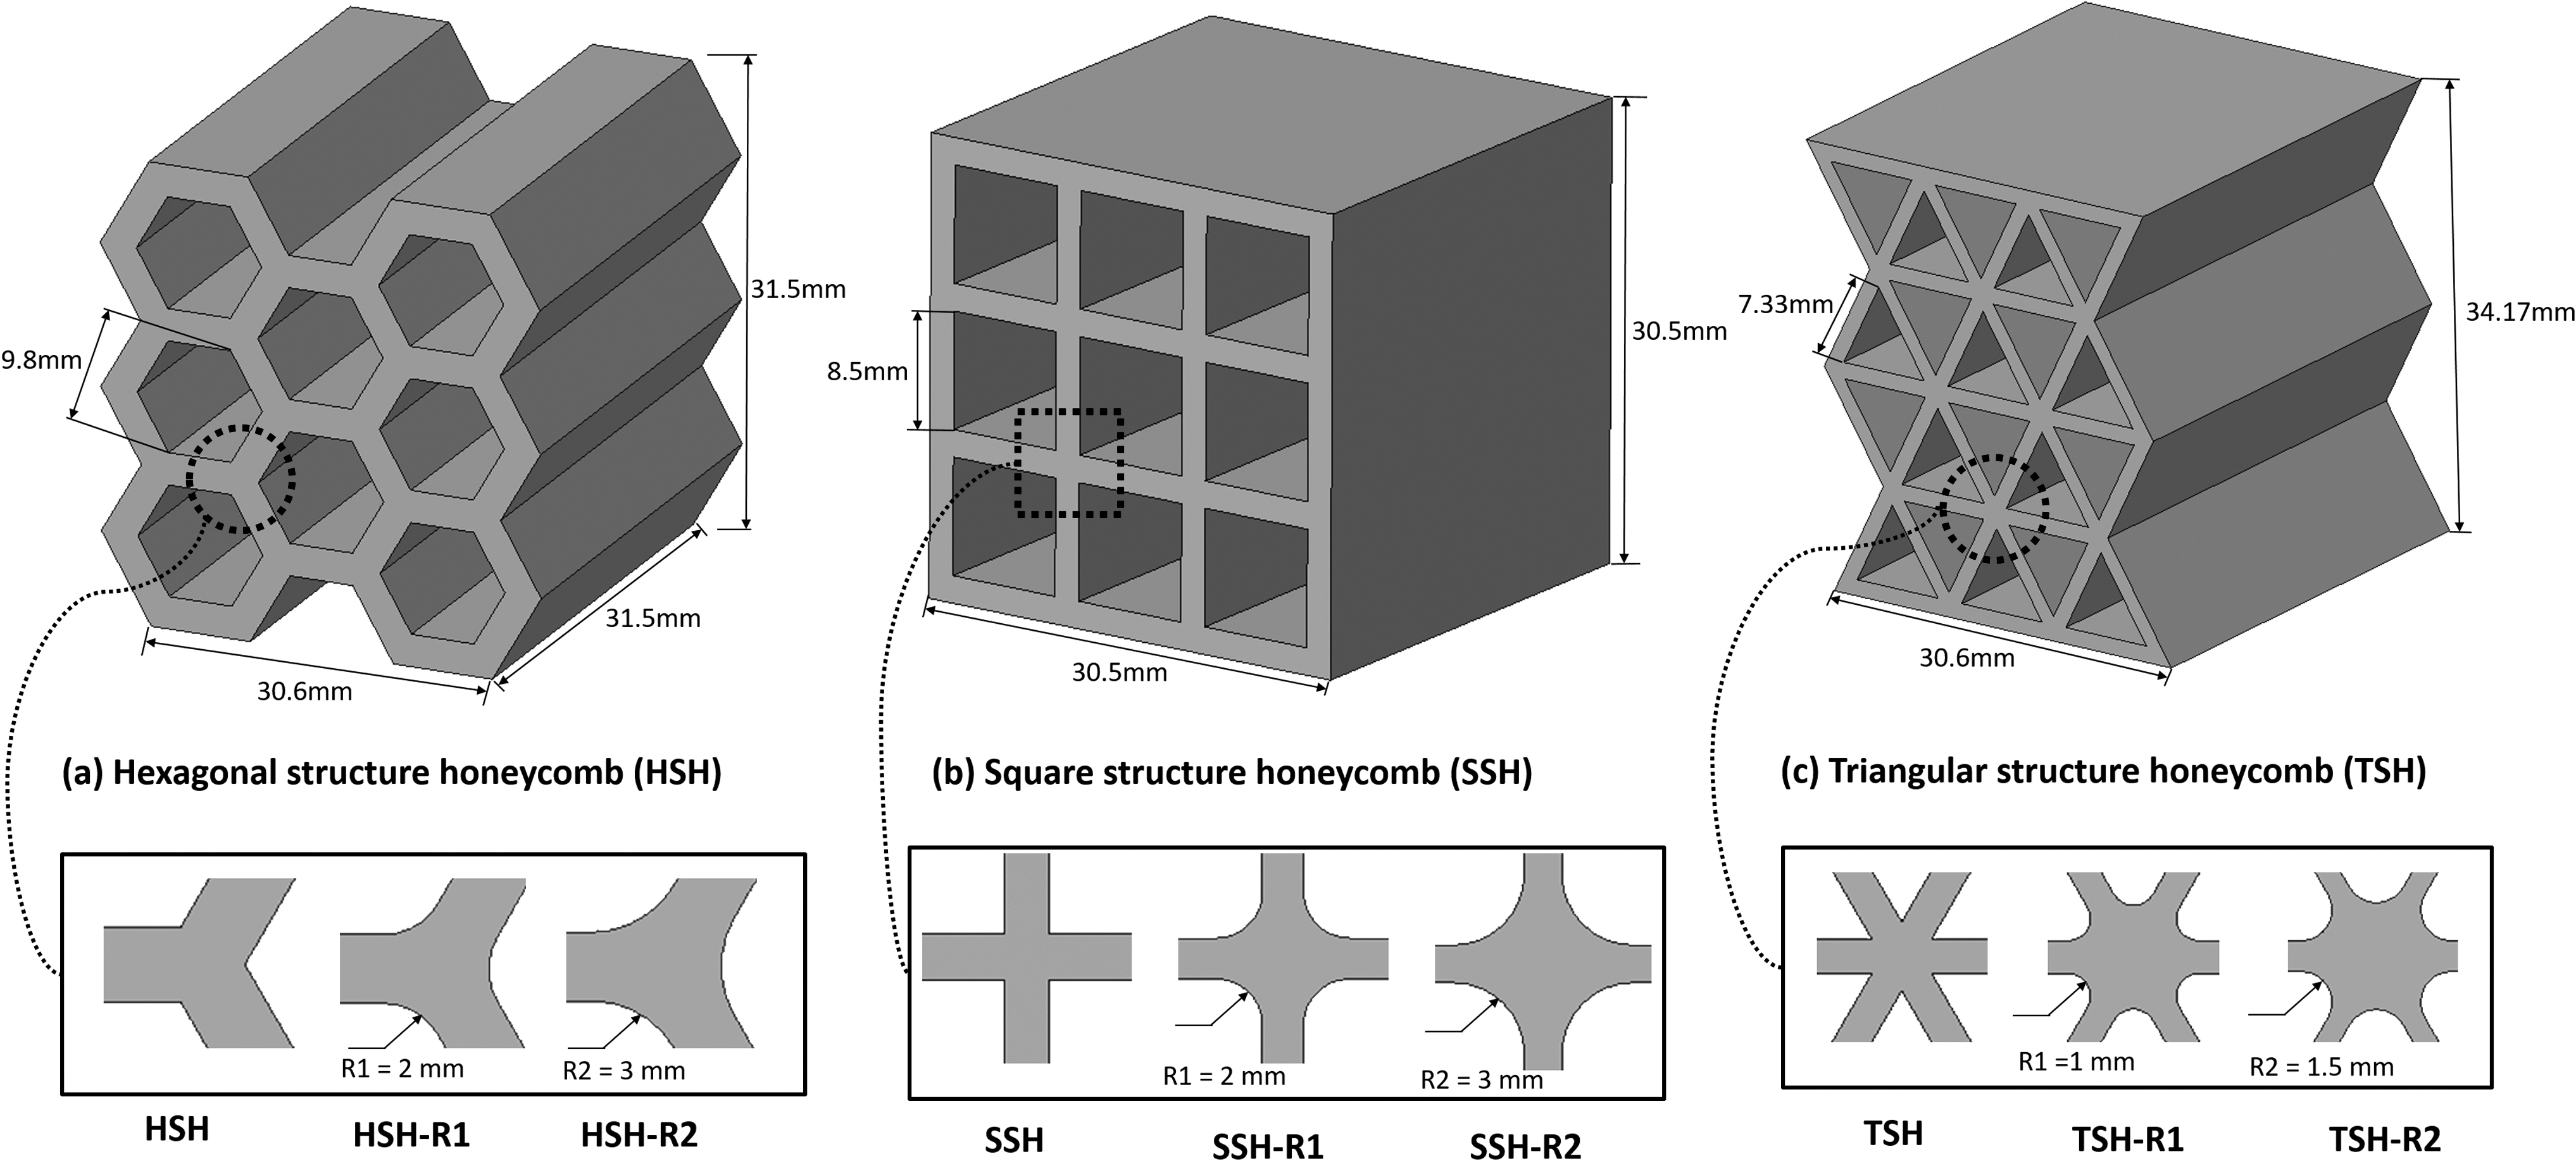
The illustration of design methodology of three different honeycomb structures with uniform and variable material distribution by adding fillets at the edges.
For all the designs, the mass and relative density were kept constant, while variable material distribution was realized by removing material from less critical regions and added to the edges due to high stress induced at the edges. Relative density is the density of the cellular solid divided by the density of the solid material. Three structures were designed for each honeycomb, one simple with uniform material distribution, and two with variable material distribution by adding fillets of two different radii. The radius of fillets was progressively increased in each of the filleted structures. The manufacturing constraint of the AM technology being used was also considered while choosing the wall thickness and fillet radius of all designed samples.
Materials and Methods
Fabrication of samples
After preliminary experimental and FEA study of several parameters, values of R1 and R2 were selected to investigate the effect of variable material distribution on mechanical performance of different honeycomb structures. The complete details of design and dimensional parameters for each design configuration are mentioned in Table 1 and Figure 1. To repeat each experiment, three specimens of each design configuration were manufactured using HP MJF 4200 3D printer with Nylon 12 (PA12) plastic material. MJF is a recently developed high-speed AM technique for plastic materials in powder form. The details of this technique have already been explained in previous studies.15,36,37
Design Values for Honeycomb Structures
All the samples were placed as closer to each other as possible (gap = 5 mm) and also near to the center on the build platform to minimize the effect of printing process parameters (material placement on build platform, fusion energy, layer thickness). In addition to that, all the samples were manufactured in the same batch. The samples were printed perpendicular to the direction of honeycomb structure as shown in Figure 2. 3D-printed samples are shown in Figure 2, and it can be concluded that complex geometries either sharp edges or curved edges can be manufactured with high accuracy. Figure 2 shows that the edges with 1–3 mm radius are printed with high accuracy and surface finish. This characteristic of AM technique opens up many areas of unexplored design, optimization, and customization for a specific application. 1

The samples of all design configurations manufactured on MJF 4200 3D printer. It can be seen that filleted edges are printed with high dimensional accuracy.
Experimental and simulation setup
The experiments were carried out according to ASTM D1621 on MTS Insight universal testing equipment with a 10 kN load cell. The samples were placed between two plate fixtures as shown in Figure 3. A preload of 10N was applied to remove planarity errors. The testing speed was set as 3 mm/min, which is 10% of the sample height/min. The test was performed till failure of the samples or densification. Values of crosshead movement and corresponding load values were measured from the experimentation. The values for load and deformation were recorded with a frequency of 10 Hz. Directional stress and directional strain were calculated for each of the samples. Tensile samples were also printed in the same batch to characterize the material properties. The uniaxial tensile testing was carried out using type IV dogbone samples according to ASTM D638-14 standard.
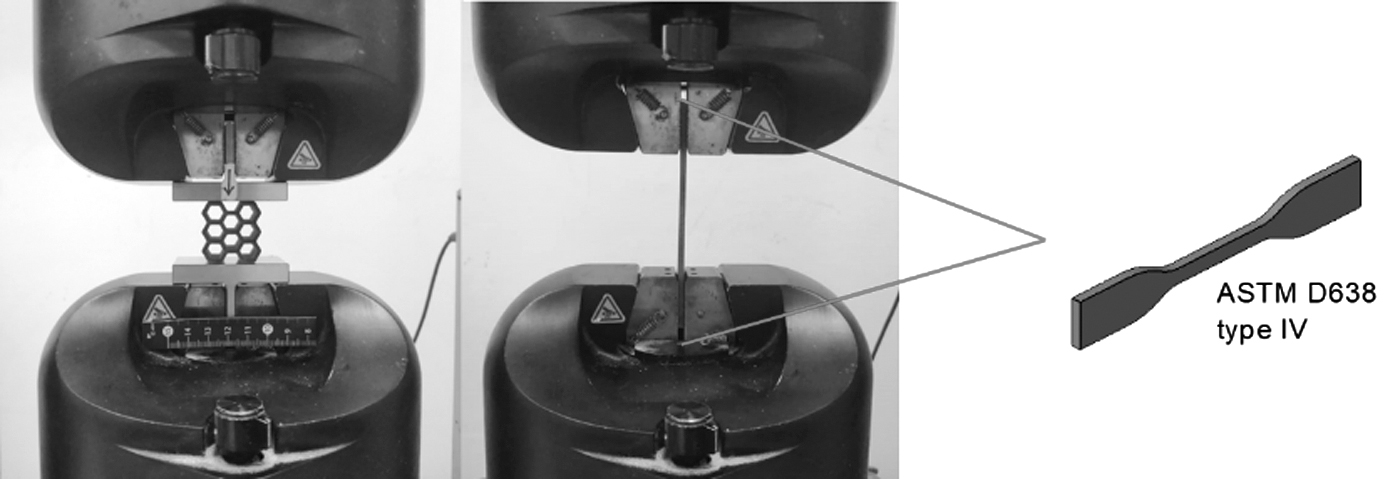
Uniaxial compression and uniaxial tensile testing setup.
Figure 4 shows the engineering stress–strain curves of the tested samples, while the linear and nonlinear plastic true stress–strain values are listed in Tables 2 and 3.
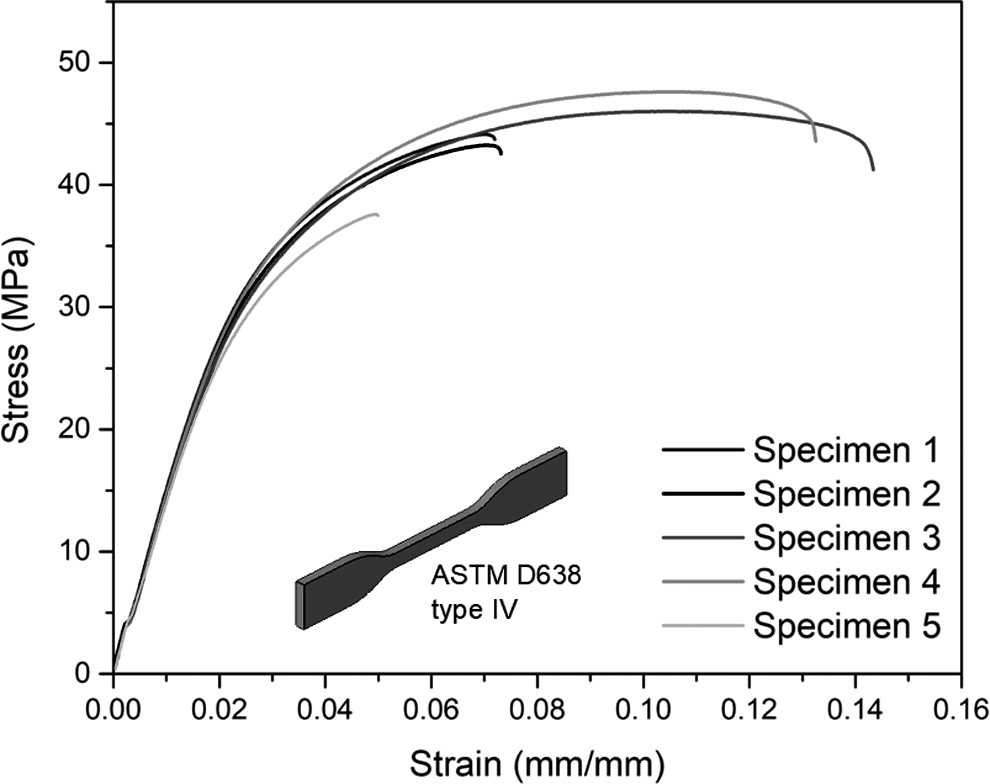
Stress–strain curves of tensile testing of type IV dogbone samples tested according to ASTM D638-14.
Mechanical Properties of Nylon 12 Polymer Material
An average value of all specimens was used for finite element analysis.
Linear Properties (Top) and Nonlinear Properties of Nylon 12 Material Obtained from Uniaxial Tensile Tests
ANSYS workbench was used to perform FEA on the samples. The 3D models were created in PTC Creo and imported to ANSYS in .step file format. The sample was placed between two plates, which were in contact with the top and bottom surfaces of the sample. For the sample PA12 material was assigned, whereas structural steel material was assigned to the fixture plates. Material properties for FEA are listed in Table 3. For creating the mesh, element sizing was used to limit the maximum size of element to 1 mm to ensure there are multiple elements in a thin wall section. This size was achieved after a convergence study of mesh in the elastic zone.
The percentage difference between two simulation runs with 2 mm element size and 1.5 mm element size was 0.7. Time stepping was applied in the simulation settings with the smallest value of step as 0.001 s and maximum value as 0.1 s. The contact between the plates and the sample was defined as frictional with a coefficient of 0.15. The boundary conditions applied to the sample were fixed support and displacement. The displacement boundary condition was applied to the top surface of the top plate, whereas the fixed support boundary condition was applied to the bottom surface of the bottom plate. The load and boundary conditions are shown in Figure 5.
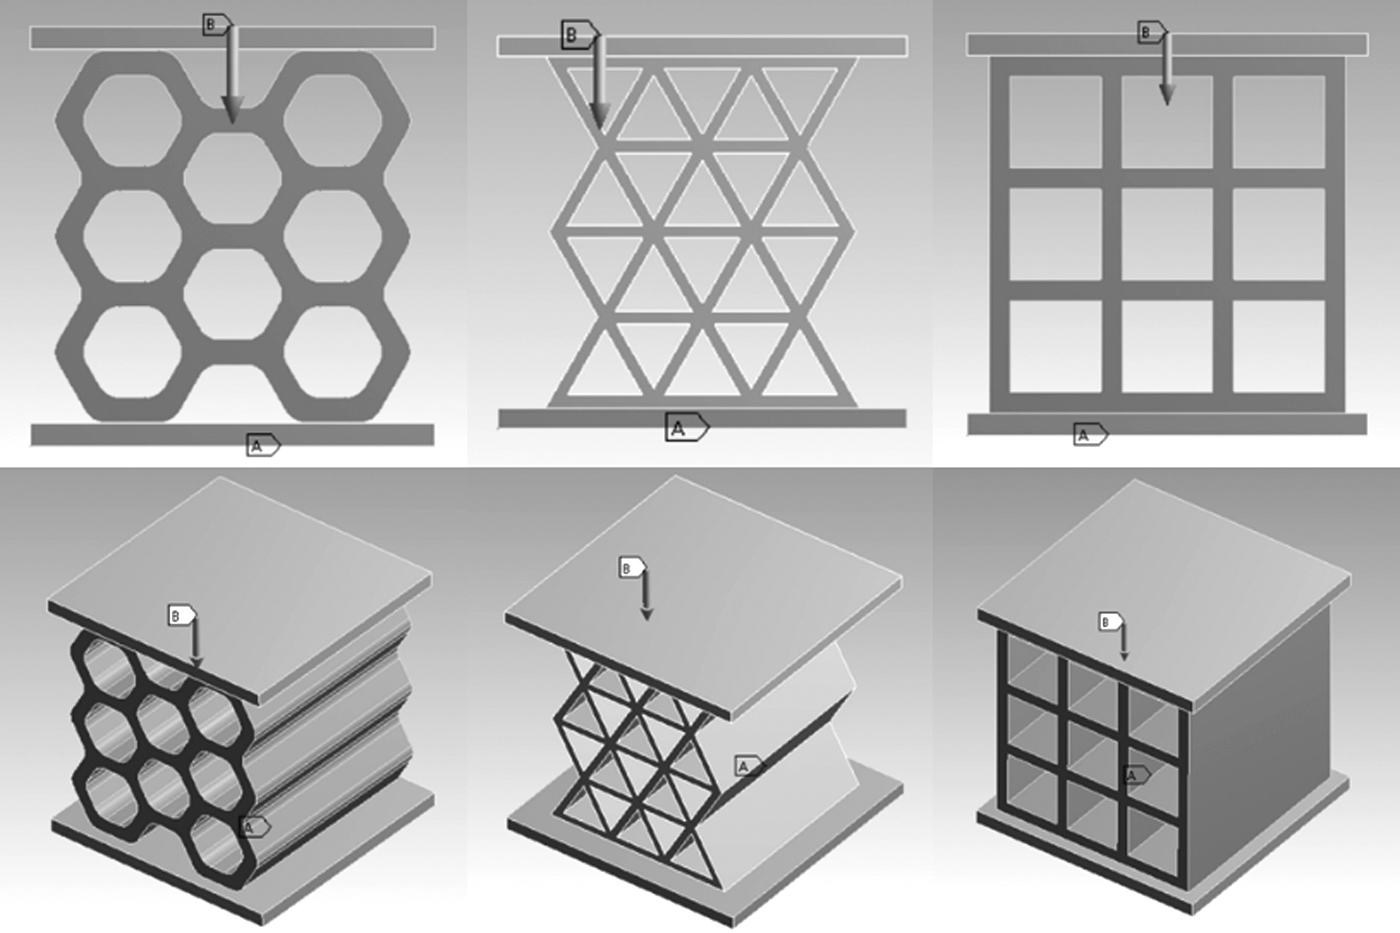
Load and boundary conditions applied on all structures analyzed in this study.
Results and Discussion
Experimental and FEA results are discussed in this section in terms of stiffness and energy absorption efficiencies, and the failure behaviors of all structural configurations. The results of the three specimens of all three samples were averaged to determine the properties. Table 4 shows the relative density of all structures and their corresponding mechanical properties. It is noted that the addition of fillets to the structures can increase the stiffness and the energy absorption efficiency of the structure. Furthermore, fillets have a huge effect on the failure behavior of these structures as well as their behavior in the plastic region.
Design and Geometric Parameters, Relative Densities of All Design Configurations Studied
From the three types of structures designed and tested, the Simple structures of Hexagonal and Triangle Honeycombs fail in a brittle manner at low strain, whereas the filleted structures exhibit strain-softening behavior and do not fail in the plastic region. Rather, the filleted structures continue to absorb energy till the onset of densification. Due to this change in failure behavior, the energy absorption efficiency of filleted structures is many times higher than those of Simple structures, which fail at low strains. All the Square samples exhibited similar behavior in the plastic zone. However, the addition of fillets to the Square samples increased their stiffness and energy absorption efficiency.
Stiffness
As illustrated in Figures 6 and 7, the stiffness can be defined by evaluating the elastic region of stress–strain curves. Figure 6 shows that Square structure honeycomb has the highest stiffness followed by Triangular and Hexagonal structure honeycombs. SSH-R2 structure has the highest stiffness among three different design configurations of Square honeycombs. Similarly, TSH-R2 structure has significantly higher stiffness of 762 MPa when compared with Triangular structure honeycomb counterpart. These trends reveal that an optimal material distribution such as adding more material at the nodes of square and triangular structure honeycombs could strengthen the overall structure in stiffness.
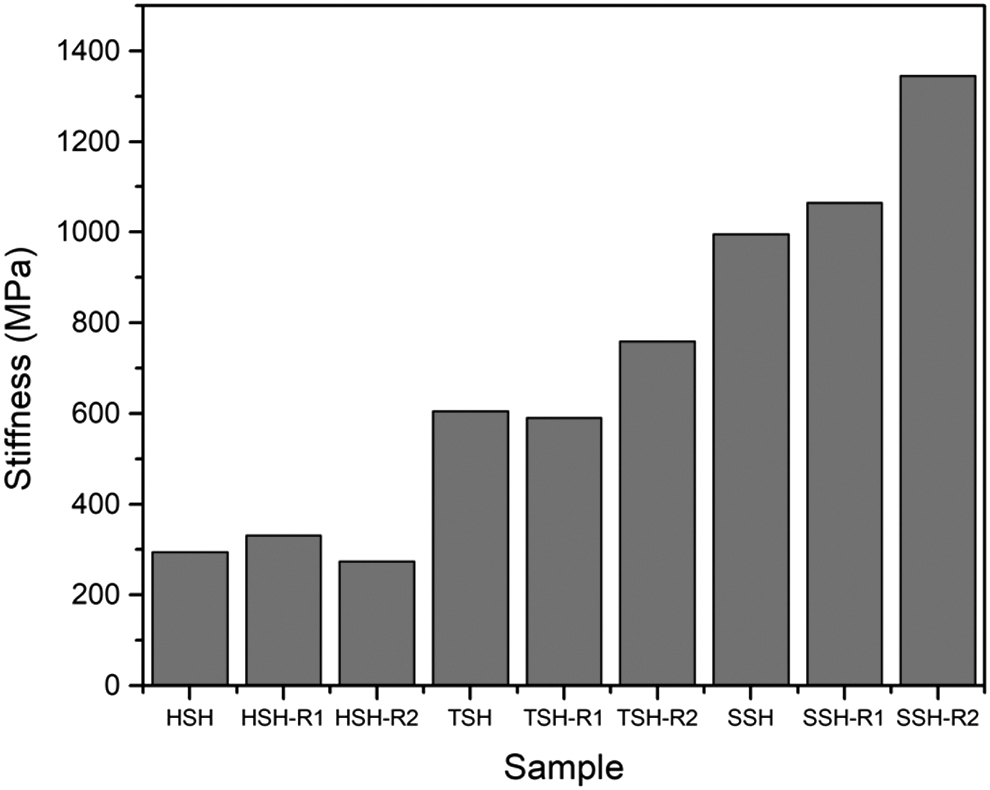
Stiffness of different honeycomb design configurations.
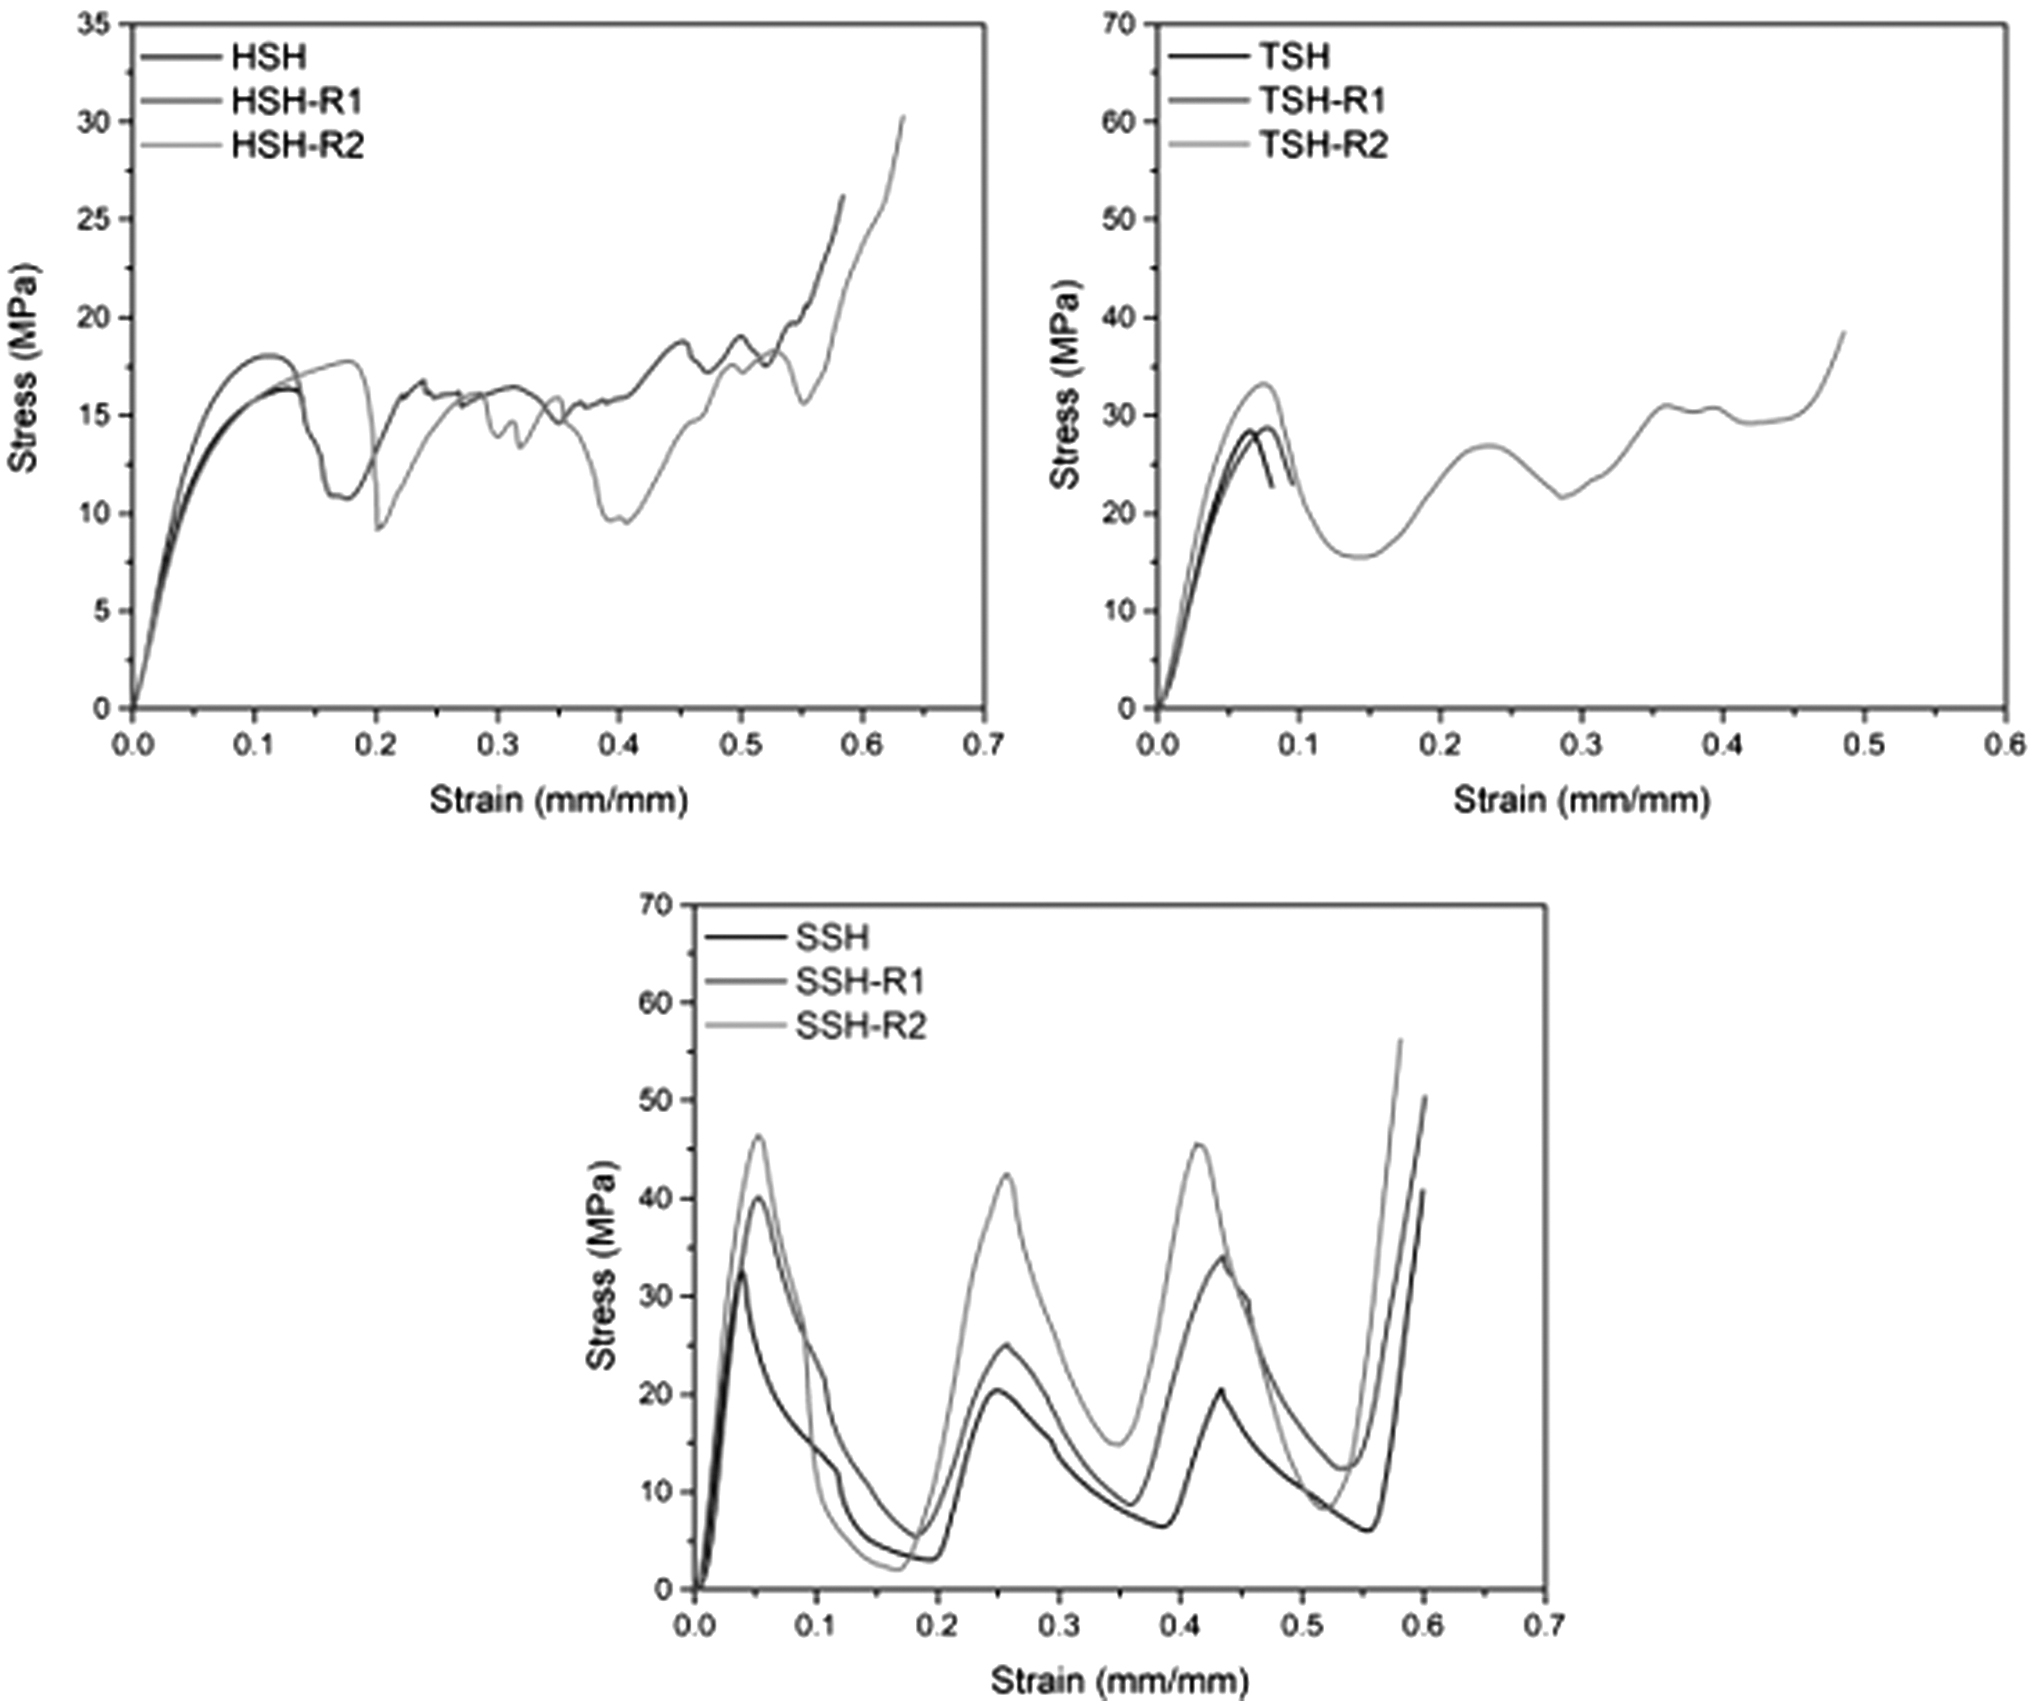
Stress–strain curves of different Honeycomb design configurations.
In contrast, HSH-R2 does not have the highest stiffness; however, HSH structure with fillet R1 has a higher stiffness as compared with HSH simple honeycomb. It can be concluded from Hexagonal honeycomb results that increasing the solid distribution at the nodes does not always increase stiffness, but can sometimes decrease it too as in the case of Honeycomb Round 3 mm, which has a lower stiffness than Honeycomb Simple. There could be a threshold value, which can define the proportion of material to be added at nodes as well as at the struts.
Energy absorption
As shown in Figure 8, the energy absorption efficiency is calculated by comparing the energy absorption of honeycomb structures with the ideal energy absorber. Energy absorption efficiency is calculated by 38

where
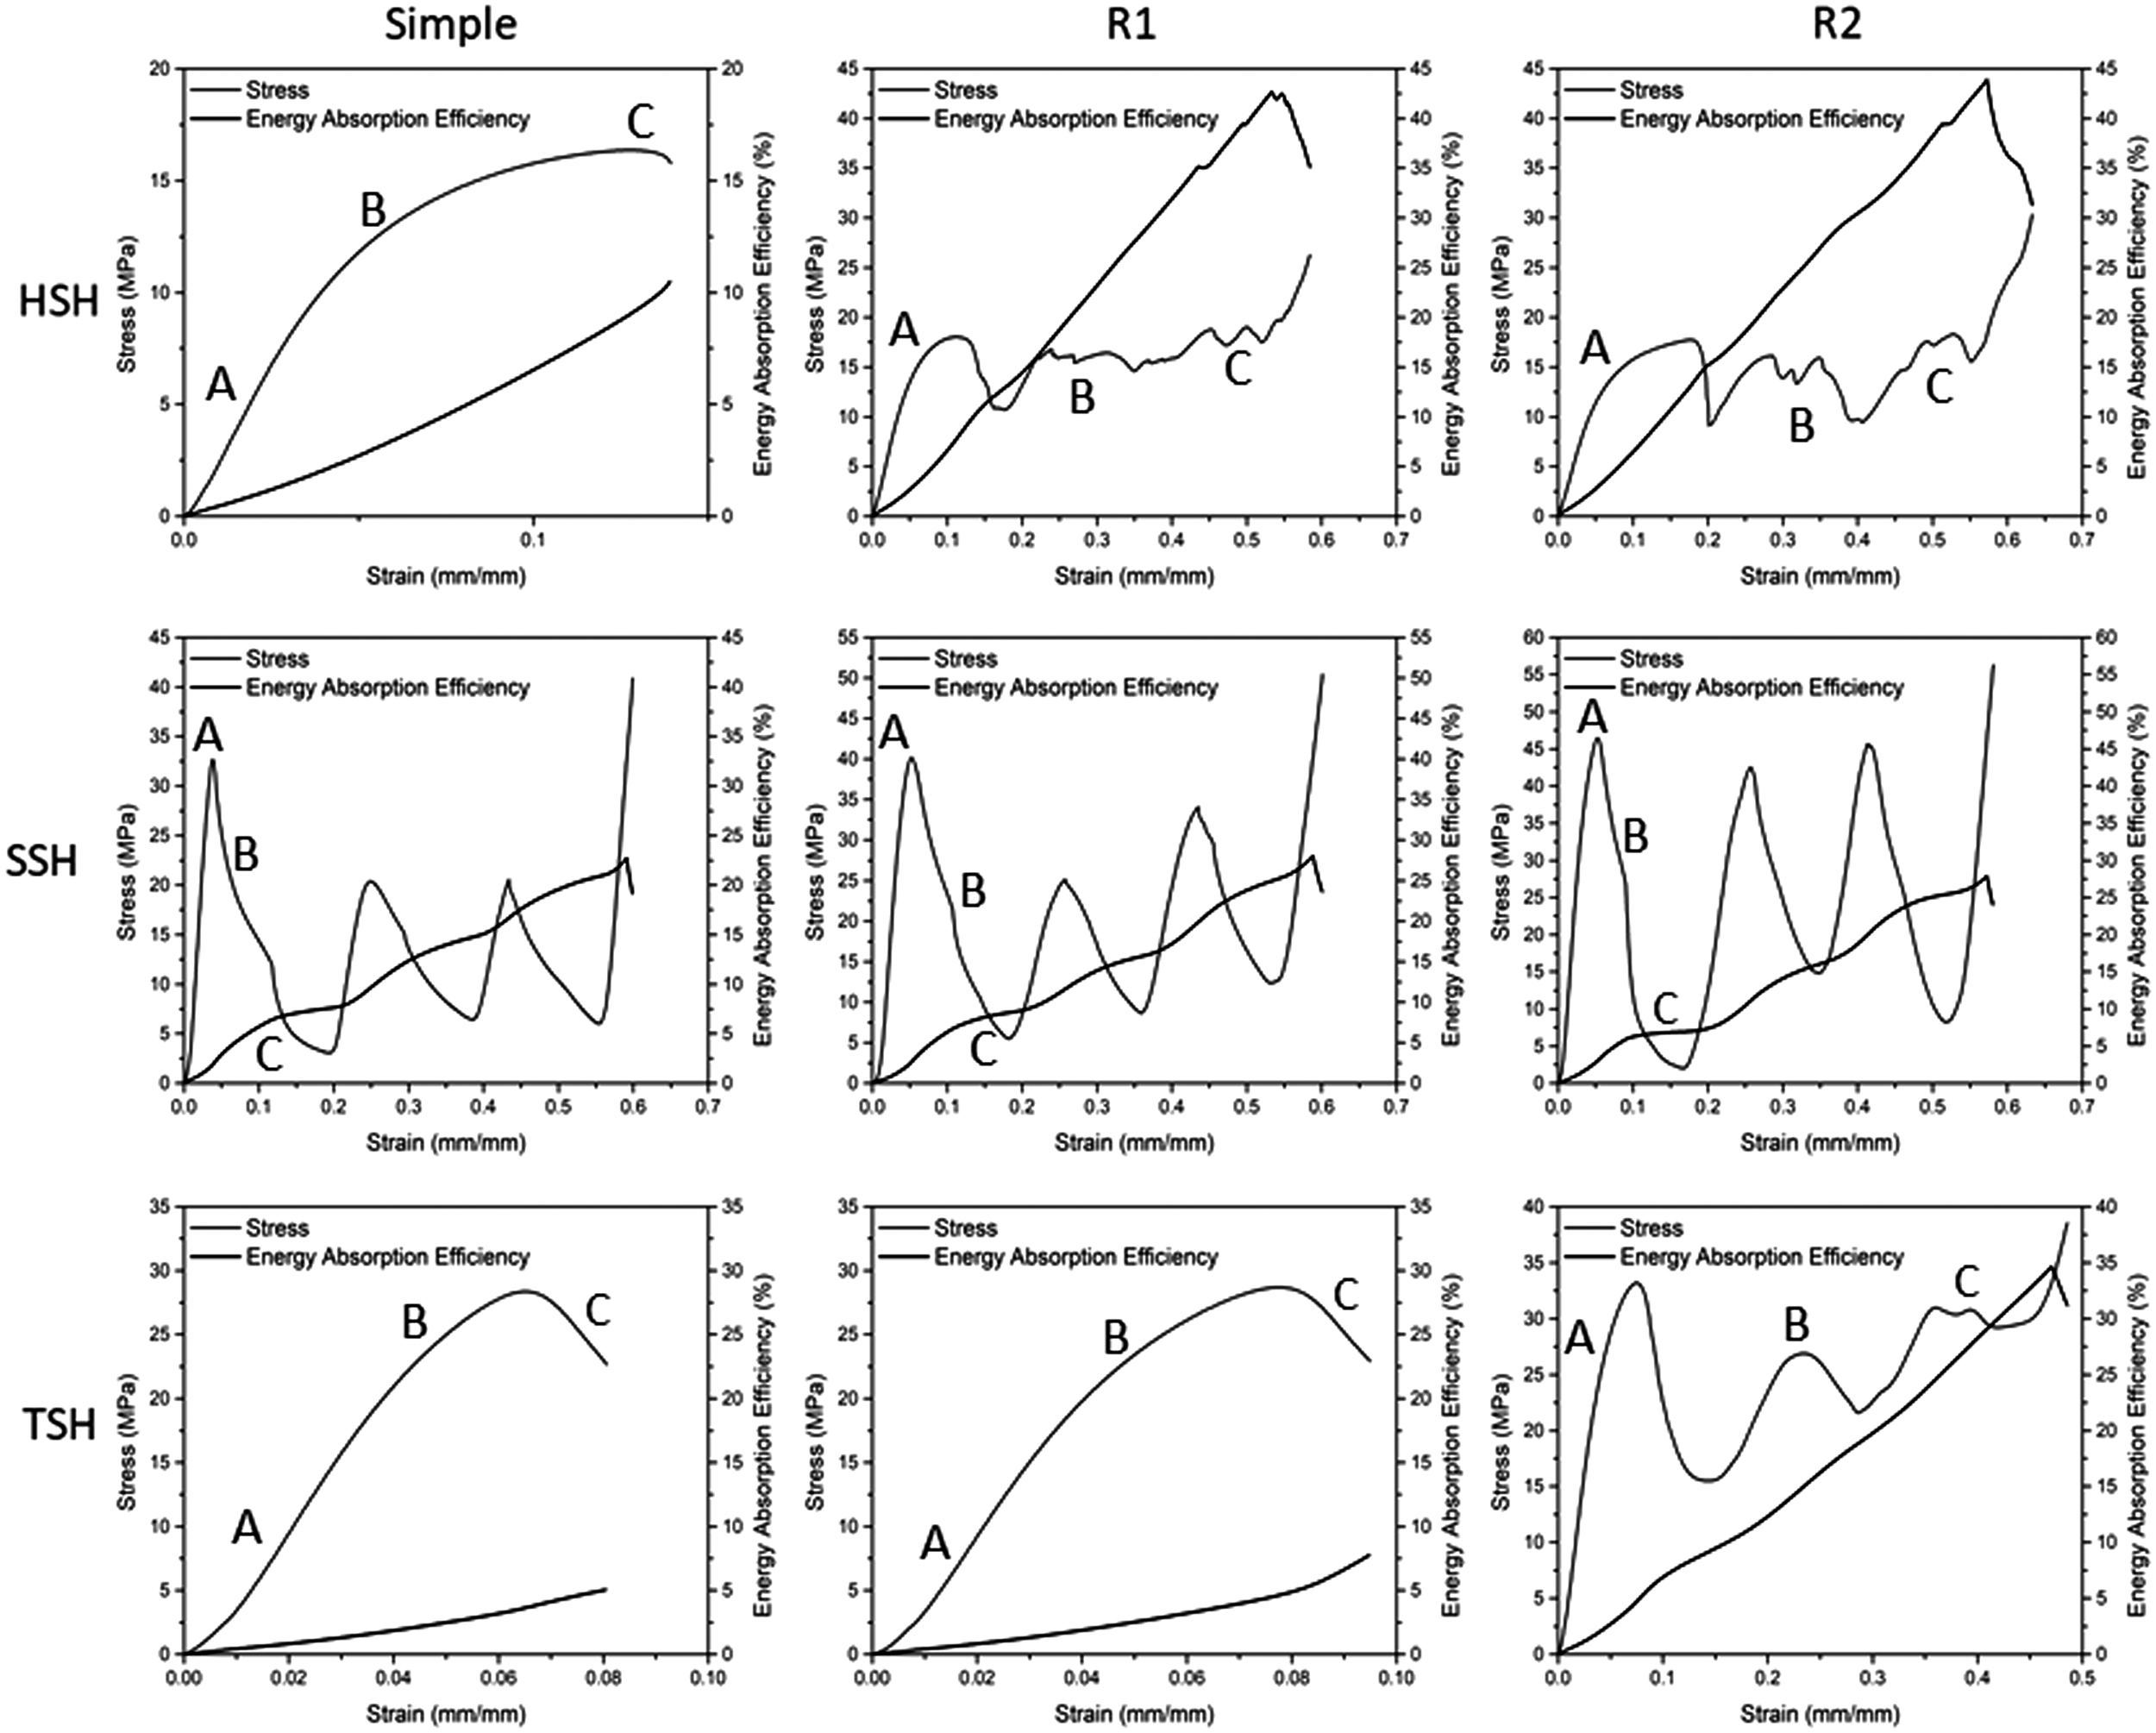
Figures 8 and 9 illustrate that the honeycomb structures with the largest fillet radius (R2) for all design configurations have higher energy absorption when compared with the corresponding honeycomb structure without fillets. HSH-R3 design has the highest energy absorption efficiency from all the designs, whereas the TSH has the lowest. From all the results, the significance of adding fillets and their effect on energy absorption of lattice structures can be visualized from Figure 9.
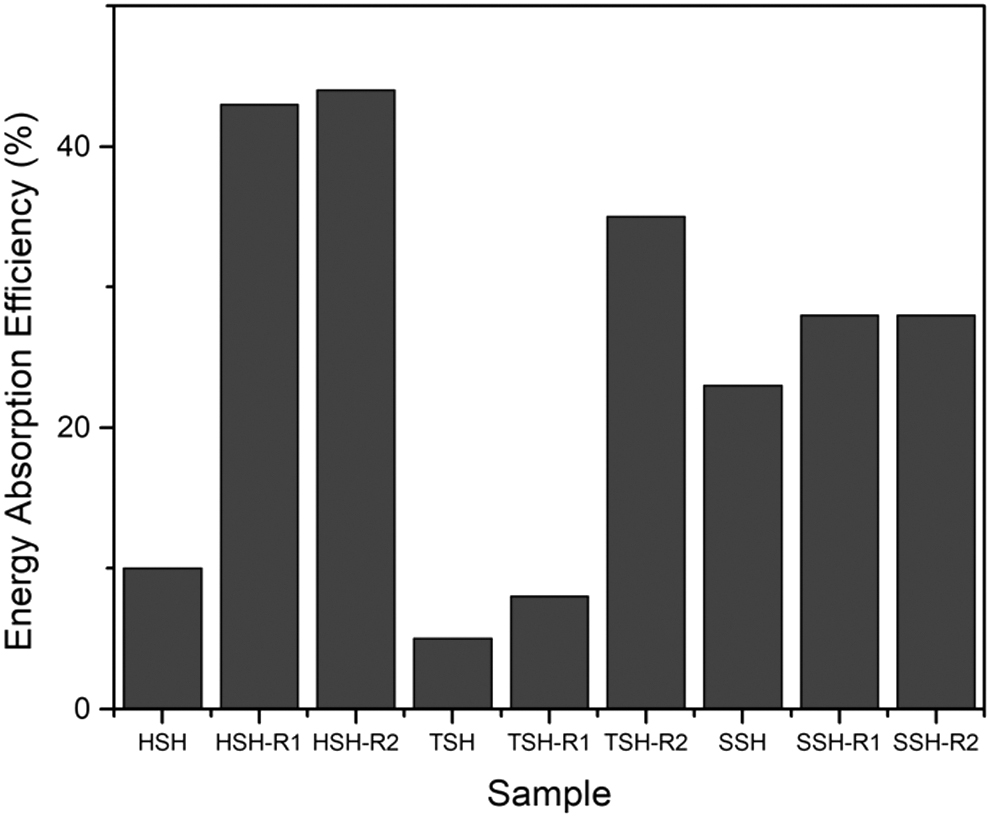
Energy absorption efficiency of different honeycomb design configurations.
The energy absorption of Square honeycomb structure is significantly lower when compared with Hexagonal honeycomb because square honeycombs has vertical wall that has increased the stiffness (Fig. 6), but this structure fails due to buckling in vertical walls, which thus reduces the energy absorption ability of the structure. The increase in energy absorption efficiencies of structures with a greater solid distribution at nodes as compared with simple structures is due to the fact that increasing the solid distribution at nodes removes the brittle failure behavior of structures, and makes the plastic region more stable.
The difference between the different values of efficiency can be understood by understanding the plastic behavior and failure mechanism of the samples. Figure 8 shows the stress–strain curves and energy absorption efficiencies of the different samples.
Plastic behavior and failure mechanism
The HSH sample has an elastic brittle failure as can be seen from the graphs shown in Figures 8 and 10. The first stage for this sample is the elastic region followed by a small region of strain softening and then brittle failure. The failure in this sample occurs from the nodes of the cell walls; that is, the location where the cell walls join each other. As can be seen from Figure 10, A represents the preloaded condition, B represents the elastic deformation zone, and C refers to the strain-softening zone. At the strain-softening stage, the cell walls that were adjacent to the metal plates have become arched as the cell undergoes compression. Because of this arching, and a greater deformation of the cells adjacent to the metal plates, the stress at the nodes of these cells is higher as compared with the nodes of other cells.
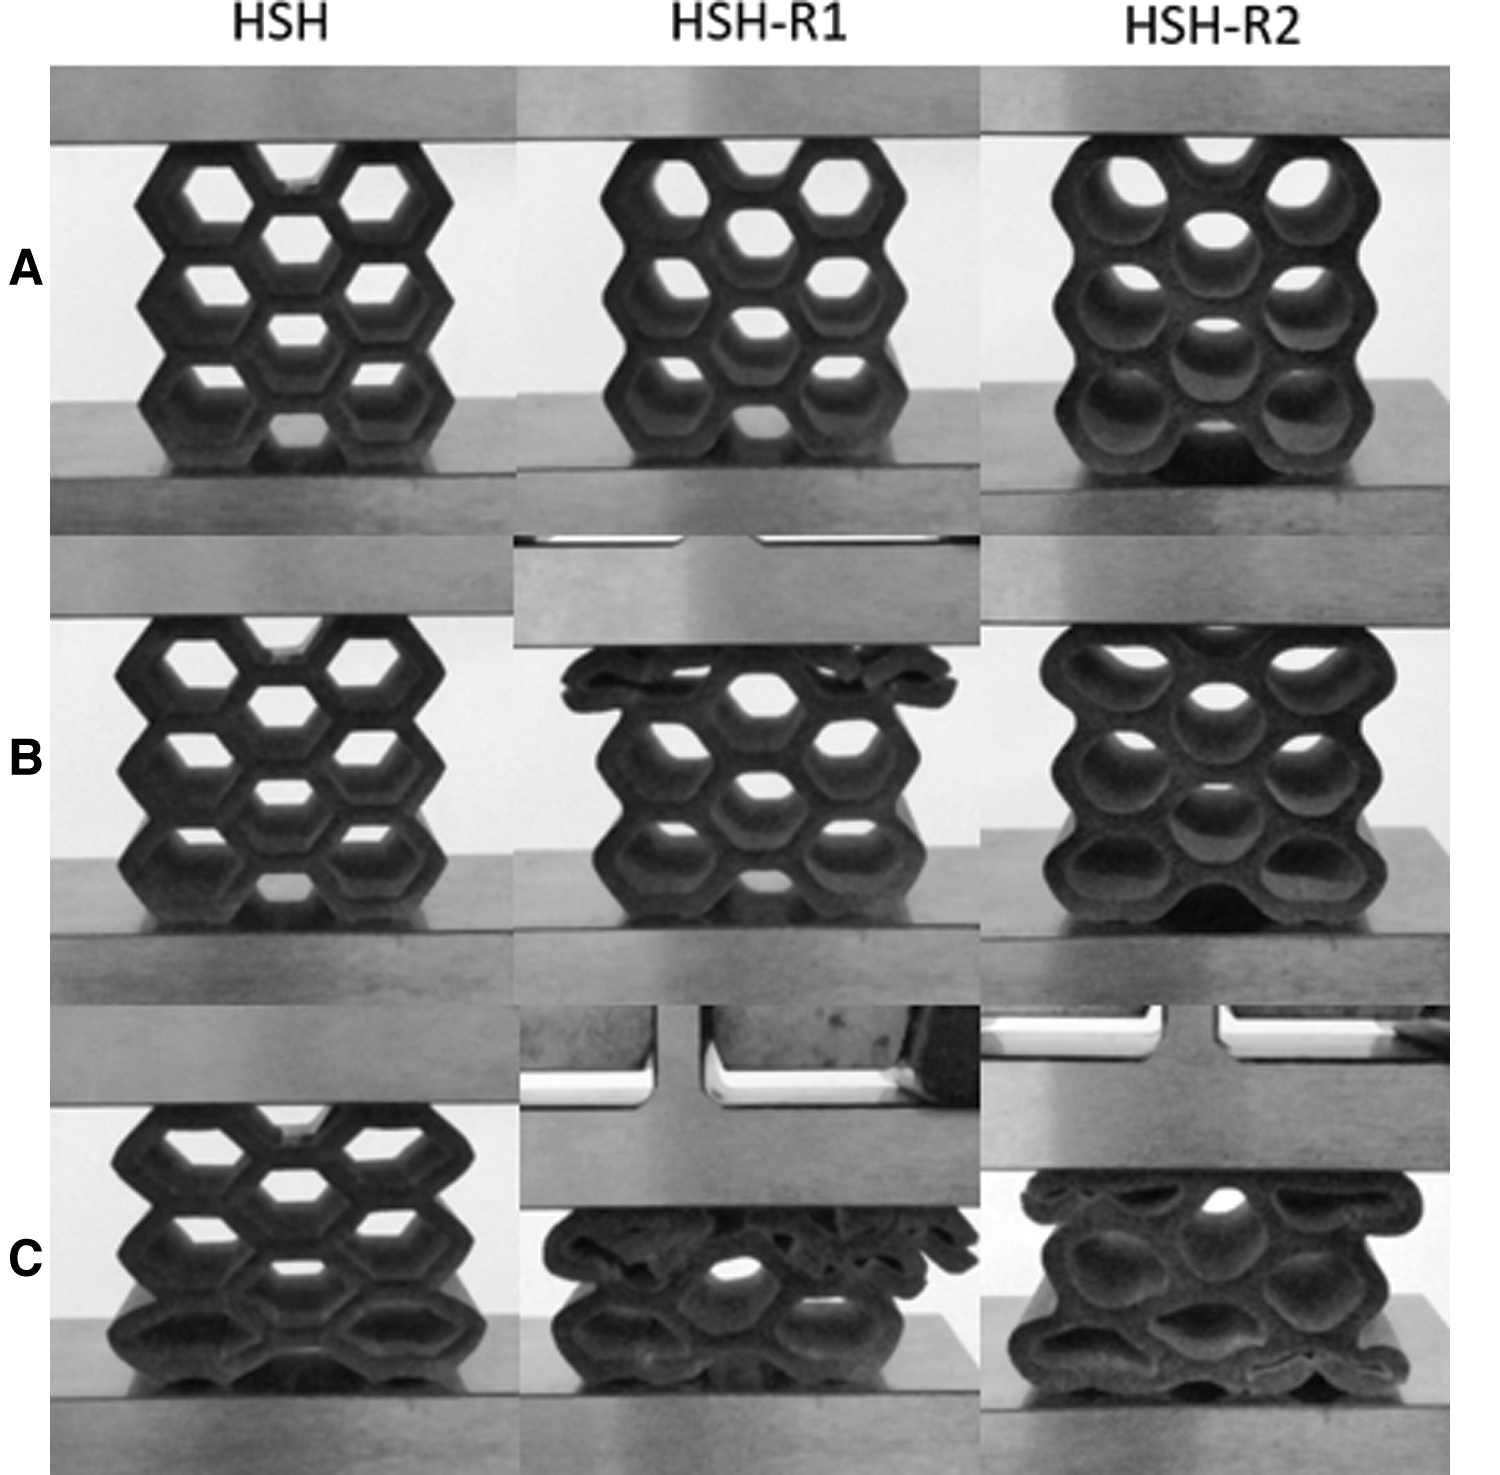
Plastic behavior and failure mechanism of Hexagonal honeycombs.
The failure of this sample occurs from the nodes of the cells adjacent to the metal plates. The cell walls split from the node in a brittle manner, and the cell is removed from the sample. Because of this brittle failure of the sample, its energy absorption efficiency is very low as compared with other samples. All the three specimens of HSH sample underwent brittle failure at low strain as can be seen from Figure 10.
HSH-R1 stress–strain curve is the closest to the ideal elastic plastic stress–strain curve as shown in Figure 8. However, the sample still undergoes strain softening as each row of cells collapses. After the collapse of a row of cells, the stress again increases until the next row of cells collapses. In the stress-softening region following the elastic deformation region, the cell walls split from the nodes as the angle between the cell walls is reduced due to compression. After the splitting of cell walls, the row of cells collapses.
As these cell walls come into contact with each other, the stress in the sample starts increasing. This phenomenon repeats itself for each row of cells as can be seen from Figure 10C. The cell walls adjacent to the metal plates also bend in the shape of an arc as evident from B and C stages. Due to the strain softening and densification at each collapse of cell rows, this sample has a curve closest to ideal elastic–plastic curve, which is signified by a straight line following the elastic zone. Because of this similarity with the ideal elastic plastic curve, this sample has the highest energy absorption efficiency among the three Hexagonal honeycomb design configurations.
The failure mechanism of HSH-R2 consists of strain softening, brittle failure of a collapse of row of cells, and densification of the row of cells. After the elastic zone, which can be seen in Figure 10A, the strain-softening behavior occurs in the plastic zone. The strain-softening behavior comes to an end by the brittle failure of the cell as represented by the sharp drop in the stress–strain curve. During this stage, the cell walls either split from one another at the nodes, or the node becomes a plastic hinge for the two cell walls to fold on one another as can be seen in C.
As the strain in the sample increases, the row of cells collapses by either splitting or folding of cell wall until the faces of the cell walls come into contact with each other. At this stage, the stress in the sample starts to increase again as another row of cells undergoes this phenomenon. There are three major troughs in the stress–strain curve of HSH-R3 sample, which correspond to different rows of cell undergoing brittle failure and collapse, followed by densification of the row.
The three different design configurations of Hexagonal honeycomb have different failure mechanisms, which lead them to have different values of energy absorption efficiencies. HSH has brittle failure as the major mechanism influencing plastic deformation. The predominant mechanism in HSH-R1 is a combination of strain softening and cellular collapse, while HSH-R2 has a combination of strain softening and brittle failure. Due to the absence of brittle failure in HSH-R1, it has the highest energy absorption efficiency among the three samples. Thus, the effect of topology of the unit cell can be seen on the stiffness, energy absorption, and failure mechanism.
TSH structure has shown elastic behavior at the start (see Fig. 11A) followed by strain softening (Fig. 11B), which is followed by brittle failure as shown in Figure 11C. From B and C, it can be seen that as the strain is increased from elastic to plastic zone, the nodes where the cell walls meet each other undergo complex deformations. In the plastic zone, the nodes start to rotate along the axis parallel to the dimension of the thickness of the structure.

Plastic behavior and failure mechanism of Triangular honeycomb structures. Enlarged view of the figures shows the c-shape and s-shape deformation patterns.
However, the nodes do not rotate in the same direction which leads to complex deformations of the cell walls. If the two adjacent nodes rotate in the same direction, or if only one of the node rotates then the deformation of the cell wall is in the shape of S. However, if both of the nodes rotates in counter directions to each other, then the deformation of the cell wall is in the shape of C. The failure of this sample does not take place from the nodes of the cell but from the cell wall. All three specimens of Triangular Simple failed in a similar manner.
The TSH-R1 undergoes strain-softening behavior in the plastic zone followed by brittle failure. The failure mechanism is similar as compared with TSH design configuration. As the strain increases, the nodes start to rotate in response to the downward displacement. As the nodes rotate, the cell walls joining the nodes undergo complex deformations depending on the direction of the rotation of nodes. The cell walls between nodes, which rotate in a direction counter to each other, deform in the shape of s C, whereas the cell walls between nodes, which rotate in the same direction, deform in the shape of S.
TSH-R2 design has a similar deformation mechanism to that of other two structures of Triangular design configuration. However, the main difference with respect to other two structures is that the failure is not brittle, rather showing a combination of elastic deformation, followed by strain-softening and densification zones.
As the strain increases, the nodes rotate, and the cell walls deform in either S or C shape as mentioned for aforementioned structures. However, these cell walls do not snap off from the nodes, rather the crack initiation and propagation are smooth, which allows for the cell walls to fold from the nodes and come into contact with the other cell walls. Due to this densification of the row of cells, the stress in the sample again increases. This process is repeated three times as evident by the three peaks in the corresponding stress–strain curve (see Fig. 8), with each trough signifying the collapse of a row and the peak signifying the next row taking up the load.
The deformation and failure mechanism of all the three design configurations of Square honeycomb structures are similar. As shown in Figure 12, it consists of an elastic deformation zone, followed by strain softening and densification. The elastic zone is signified by similar deformation scales of each row of cells. The cell walls start to buckle as the proportional limit is crossed, then unit cells adjacent to the fixture plate begin to collapse. This collapse is shown in the graph by the rapid decrease in stress as the strain increases. This decrease in stress is caused by the cell walls of a row of cells bending under compression.

Plastic behavior and failure mechanism of Square honeycombs.
As the cell walls bend, the sample also begins to slide on the fixture plate as the frictional force keeping the sample in place is smaller than the force required to buckle the cell walls. This sliding allows the vertical cell walls of the unit cells to fold from the nodes of the adjacent row of cells onto the horizontal cell walls. After the row of cells has collapsed, the load is taken up the remaining row of unit cells, which is shown in Figure 8 by the second peak in stress–strain curves. The stress after this second peak again begins to decrease due to the collapse of another row of cells. This is followed by the densification of this row of unit cells, which is followed by the last row taking up the load as evident by the third peak.
After the third peak (see Fig. 8), the last row of cells collapses, followed by the densification of the structure. Due to the addition of fillets, the strain at which the first row of unit cells begins to collapse has increased, which can be seen from the strain at the first peak of the stress–strain curve shown in Figure 8. Furthermore, the peaks are smoother in the filleted structures as compared with the simple structure. This signifies a smooth crack initiation and propagation in the filleted structures where the peaks are smoother as compared with the sharp peaks in the simple structure, which signify a brittle behavior.
Validation using FEA
Finite element analysis using static structural module of ANSYS workbench was used for the validation of experimental results. The results with good agreement with experimental results can easily be determined for the linear problems; however, there are many challenges for computation of the nonlinear simulations. The biggest challenge is convergence of the simulation, especially in the nonlinear region. For structures that exhibit elastic plastic behavior, the simulation gives accurate results in the nonlinear region; however, it is much difficult to obtain converged results for structures that exhibit strain softening or brittle failure.
The simulation results for HSH design are in good agreement with the experimental results since this structure has a small strain-softening zone followed by brittle failure. For HSH-R1, the simulation results are in close agreement with the experimental results due to the strain-softening behavior of the structure in the plastic zone. As this behavior of this structure in the plastic zone is close to the elastic plastic behavior, the simulation was able to converge; however, the densification of the structure still could not be simulated.
HSH-R2 results are similar in the elastic region, whereas a considerable difference was recorded in the plastic region. This is because in the experimentation this structure experiences a strain-softening behavior, followed by the brittle failure and collapse of the cells in the plastic zone. Since the plastic zone of this region contains brittle failure (as evident by the sharp drop in stress in Fig. 13).

FEA of different honeycomb design configurations. FEA, finite element analysis.
For the triangular design configuration, the results in elastic region are in close agreement with experimental results; however higher load in plastic region was recorded when compared with FEA counterpart. This is because during the compression, these structures have a toe region before the elastic zone, which can be seen in the form of the rise in stress at the start of the graph (see Fig. 13). Because this toe region is due to the manufacturing issues inherent in AM such as voids and porosities, the simulation results cannot take into account this effect. Furthermore, this may be due to the fact that in experimentation, even if a crack originates, it is still pressed together because of the compression. However, this is difficult to do in the static structural module, which requires contacts to be defined before the simulation, and cannot create new contacts during the simulation.
Similarly, the results of FEAs of square honeycomb designs are in good agreement with experimental results until elastic region but different after the onset of plastic deformation. This is because the plastic behavior of the square honeycomb contains a sharp strain-softening behavior followed by cellular densification since this is challenging to simulate crack initiation and propagation accurately. In the experimental results while the cracks are formed at the nodes after the local buckling of cell walls, the surfaces of these cracks are pressed together.
In the simulation, the cracks are not formed, and the stress continues to grow to the peak value of the input plastic stress (material property) after which the structure starts to exhibit the strain-softening behavior. The simulation results for every structure, which exhibits the toe region before the elastic limit, brittle failure, and strain-softening and densification behavior in the plastic limit, are different from the experimental results. As shown in Figure 14, stress distribution is improved in the structures with fillets when compared with the simple honeycomb structures of all three design configurations.

Stress distribution in FEA of different honeycomb design configurations.
Conclusion
This study investigates the effect of optimal material distribution at the nodes of three different types of honeycomb structures designed with nine different design configurations. The relative density of all the samples was kept constant for more accurate comparison of all results. Stiffness, energy absorption efficiency, and failure behavior of different configurations of honeycombs were studied through FEA and experimental tests, and the results of optimal structures compared with their simple counterparts. Based on the experimental and FEA results, the following conclusions are drawn.
Increasing the material distribution at nodes in honeycomb structures increases the stiffness and energy absorption efficiency; however, if the amount of material proportion at nodes is increased beyond a threshold value, the stiffness decreases as predicted due to higher material distribution at nodes, which consequently weakens the other regions of the structure. Furthermore, it is concluded that Square honeycomb structures have the highest stiffness from the three different configurations studied due to the vertical walls. The stiffness of Square can be further improved by addition of more material distribution at the nodes.
It is also revealed that in-plane compression of honeycombs with no addition of fillets at nodes has a brittle failure just after the yield limit where the transition from elastic to plastic behavior occurs. This behavior is present in all of the design configurations studied presently. Increasing the amount of material at the nodes changes the failure behavior from elastic–brittle to elastic–plastic. This greatly increases the energy absorption efficiency of the structures; therefore, a lightweight honeycomb structure can be designed using the approach presented in this study.
Finally, it is concluded that the failure behavior of honeycomb structure depends on the unit cell configuration, which defines that the failure behavior can be progressive cell collapse, buckling, twisting of nodes, and brittle collapse. This study focuses on three different material distributions at constant relative density; therefore, it is recommended to understand the effects of different material distributions at nodes of honeycomb structures while designing at different relative densities.
Footnotes
Author Disclosure Statement
No competing financial interests exist.
Funding Information
This work was financially supported by the Ministry of Science and Technology (MOST), Taiwan (Project ID: 109-2222-E-011-005-MY2). This project was also supported by High Speed 3D Printing Research Center (Grant No. 108P012) from the Featured Areas Research Center Program within the framework of the Higher Education Sprout Project by the Minister of Education (MOE), Taiwan.