
Abstract
The aim of this article is to study the influence of some printing parameters and postprocessing on mechanical properties of polylactic acid samples manufactured by fused deposition modeling with a 3D printer. The effects of different building orientations, concentric infill, and postprocessing by annealing were analyzed. In this sense, uniaxial tensile and three-point bending tests were performed to determine the ultimate strength, modulus of elasticity, and elongation at break. Among all printing parameters of interest, the print orientation can be considered one of the most important, being fundamental in the mechanical behavior. Once samples were fabricated, annealing processes were also considered, close to the Tg, in order to study the effects on mechanical properties. In the modified print orientation, the average values for the E and the σTS are 3337.15–3337.92 and 36.42–37.62 MPa, compared with default printing with the E and the σTS that are 2541.63–2692.34 and 28.81–28.89 MPa, respectively. In the annealed samples, the values for the Ef and the σf are 2337.73 and 63.96 MPa, compared with the reference samples with the Ef and the σf values of 2164.40 and 59.66 MPa, respectively. Hence, the print orientation and postprocessing must be taken into account as important factors for the final properties of the desired product.
Introduction
Additive manufacturing (AM) techniques, also commonly known as 3D printing, are methods of manufacture that involve the joining of materials to fabricate 3D objects for prototyping purposes as well as for end-use in rapid manufacturing.1,2 AM processes enable to create 3D objects, typically, by means of sequential deposition of layers under computer control, as opposed to traditional manufacturing (forming, molding, or machining). The advantages of these methods are the production of complex prototypes, with intricate geometries, without special tools, machines, or robots, together with the reduction of material waste, with the subsequent economic benefits in diverse fields, for example, education,3,4 construction,5–7 medical devices, 8 electronics,9,10 automotive, 11 oceanography, 12 or aerospace.13–15
AM can be considered a revolutionary technology not only in the industry sector but also in the daily life of consumers. However, although AM technology is a versatile tool with great advantages for the production of complicated objects, its utilization at industrial scale is limited because the properties of the obtained products are not only dependent on the raw materials but also on the processing parameters, and so, properties must be studied more intensively.
Fused deposition modeling (FDM)16–19 is an AM process, in which raw polymer, in the form of filament, is taken into a heated extruder by rollers, where it is melted. Then, material is extruded through a nozzle for building the object layer by layer. In this process, the nozzle moves by means of computer control, according to a previous Computer-Aided Design (CAD) model, on the x-y plane depositing the melted material to form the first printed layer on the print bed. After the completion of the first layer, either the print bed or the extrusion nozzle will move to create sufficient space for the deposition of the following layer, and so on until the piece is completed. Some benefits must be considered in FDM, such as lack of any need of solvent, low maintenance cost, low working temperature, relative high speed, and simple processing and fabrication. Once the product is finished, sometimes a postprocessing is demanded, which can include curing, annealing, or pigmentation.
Nowadays, concerning the material used, a great variety is currently available for 3D printing. The American Society for Testing and Materials (ASTM) classifies materials for AM as metallic, ceramic, polymer, and composite, where composite materials are considered any combination of the other categories, 20 with limitations and advantages that are related to AM processes for different type of materials used. Some polymers used in AM are, for example, aliphatic polyamides (nylon), polycarbonate (PC), polypropylene (PP), high-density polyethylene (HDPE), high-impact polystyrene (HIPS), acrylonitrile butadiene styrene (ABS), and polylactic acid (PLA), among which ABS and PLA are the most popular filaments. PLA is a thermoplastic polymer, semicrystalline or amorphous, that can be synthesized from lactic acid from renewable resources. 21
PLA is very interesting due to its biocompatibility and biodegradability, typically coming from plant materials (corn, wheat, sugarcane, or rice), and with relatively low melting point (160–170°C), requiring less energy for printing than other materials.22–24 PLA can be polymerized with low emission of greenhouse gases and low amount of energy production, 25 and so, it is considered a good alternative with respect to petroleum-based polymers because of its less environmental impact. Another advantage, it is related with the consideration as a safer alternative with respect to the possible toxicity of ABS plastic. ABS is produced from oil and its thermal decomposition at high temperatures can produce carbon monoxide, hydrogen cyanide, and volatile organic compounds.26,27 For this reason, PLA offers less health risk if printing is done in a nonventilated work space. Also, it is important to mention that PLA presents stronger mechanical resistance than ABS, with a lower coefficient of thermal expansion, which reduces the effects of warping during the printing phase. 28
When FDM is considered AM, a large number of parameters must be taken into account during printing. Actually, many researchers are investigating with the aim to obtain the best combination of parameters of fabrication. Among these parameters that can be considered are build orientation, 29 layer thickness,30,31 raster angle,32,33 printing angle, 31 bed temperature, nozzle diameter, 34 infill density,35,36 printing speed, 37 extruder temperature,37–39 enclosure ventilation, first layer adhesion to the printing table, and even the pigments used in the filament. 23 The combination of such parameters is crucial to the quality of the material properties of the final product.
In this work, the effects of some FDM processing parameters and postprocessing on mechanical properties are investigated for the fabrication of PLA prototypes. Several series of PLA samples were fabricated in controlled ambient conditions. Prototypes were tested with uniaxial tensile and three-point bending for mechanical characterization. For uniaxial tensile tests, the average values of Young's modulus, tensile strength, and elongation at break were evaluated. In the case of three-point bending tests, the mean values of the flexural modulus of elasticity, maximum normal stress, and maximum strain of the outer surface at midspan were analyzed. The obtained results were studied from a mechanical point of view, and they were compared with reported values in literature for similar materials. The effect of annealing temperature, after printing, is also considered in order to observe changes on mechanical parameters.
Experimental Methodology
Materials and processing parameters
A white commercial PLA filament, manufactured by 3D Invasion, was used as raw material. The specimens were designed in CREO Parametric 2.0 software, and their digital models saved as surface tessellation language (STL) format. STL files were introduced in a slicer (CURA 0.1.5) to convert the manufacturing parameters into a G-Code. The samples for testing were printed by FDM using an open source 3D printer (BCN3D SIGMA R-17). Fixed parameters during printing (Table 1) were layer width, infill density, deposition speed, extruder temperature, and bed temperature. Moisture absorption adversely affects the mechanical performance of PLA-printed materials. Once the vacuum packaged PLA filament was opened, it was stored in a dry box to minimize the moisture absorption. Since the physical properties of PLA samples can vary depending on ambient temperature, mechanical tests were carried out at room temperature. Both temperature and humidity were controlled during printing by a thermometer (PCE 313-A) and a moisture meter (CENTER 314).
Fixed Process Parameters
The thermal behavior of the PLA was analyzed by differential scanning calorimetry (DSC) in a calorimeter (Discovery DSC 025; TA Instruments). Approximately, 5 mg of sample was loaded in aluminum pan and heated at a rate of 5°C/min from 30°C to 300°C, under 100 mL/min of nitrogen gas flow.
For annealing samples, thermal treatments were applied in a vacuum oven. Thermal treatments consist in gradual heating from room temperature to a considered temperature, a dwelling phase of various hours, and slow cooling in the oven to reach the room temperature.
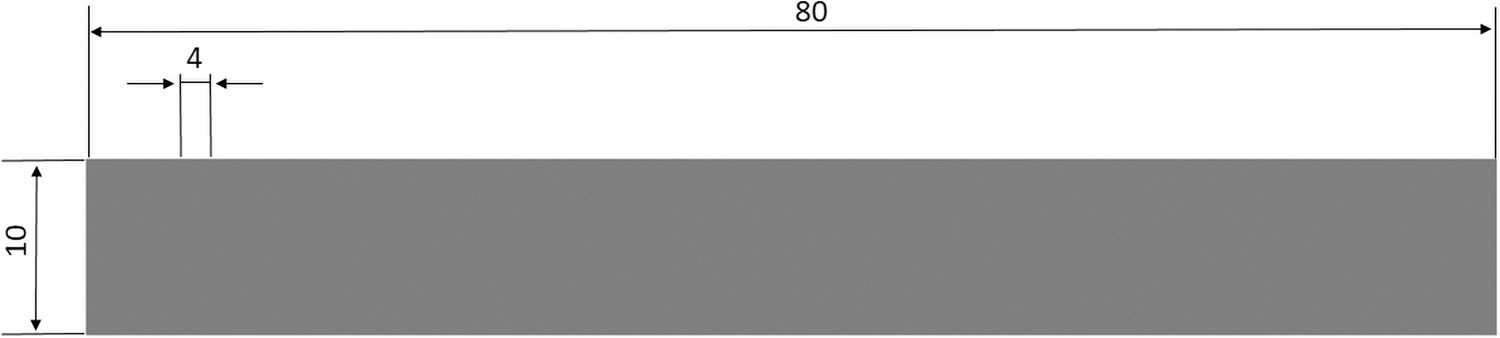
For tensile tests, six series with six specimens in each one were printed. The first ones were manufactured with two different nominal dimensions labeled as flat orientation/tensile reference (Ref 5A) and Ref 5A changing dimensions (Ref 1A) (Fig. 1), according to ISO 527–1:201940 and ISO 527–2:201241 norms (Plastics: Determination of tensile properties). From dimensions of Ref 5A, a new series was fabricated with scale factor 17/10 (amplification). Different processing parameters or conditions were considered to study the mechanical behavior of samples. With the aim to investigate the mechanical properties with respect to different build orientations on the build plate, two series were designed (Fig. 2a). The first ones were built flat on the build plate (flat-built samples), and the other ones were fabricated standing on-edge orientation (side-built samples). With respect to the print orientation, an alternate orientation of 45° (Fig. 2b), and perimeter rasters were printed (Fig. 2c). Finally, postprocessing was considered annealing some samples at 55°C for 3 h, with slowly cooling in the oven for 24 h. A summary of samples with labels and their processing parameters is shown in Table 2.

Main dimensions (in mm) of the standard 1A specimens for uniaxial tensile testing.

Samples Studied in Tensile Tests
EO, edge orientation; PLA, polylactic acid; PR, perimeter raster.
For three-point bending tests, four series with six specimens in each one were printed, according to ISO 178:201942 norm (Plastics: Determination of flexural properties) (Fig. 3). As in the tensile study, to investigate the mechanical properties, two different building orientations on the build plate were designed (flat-built samples and on-edge orientation). Also, print orientation was considered, and perimeter rasters were printed, in contrast with alternate orientation of 45°. Finally, postprocessing was considered annealing some samples at 60°C for 5 h, with slow cooling in the oven over a period of 48 h, applying vacuum. A summary of the samples with their labels and the processing parameters is illustrated in Table 3.
Dimensions (in mm) of the standard specimens for three-point bending tests.
Samples Studied in Three-Point Flexural Tests
EO-F, edge orientation-flexural; PR-F, perimeter raster-flexural; F, flexural.
Mechanical testing
As seen in Table 1, specimens were printed with an infill of 100%. It is well known that air gap has an important influence on mechanical properties as, for example, tensile strength. 43 For this reason, the maximum infill density was selected for printing, although it must be indicated that the positive or negative air gap could be affected by the printer. The real air gap between extruded filaments is not considered in this study, and the possible porosities of samples are not easy to observe from the naked eye.
The uniaxial tensile and three-point bending strength tests were performed in an electromechanical universal testing machine (AUTOGRAPH AG-IS, with a load cell capacity of 50 kN) according to ISO 527–1:2019, 40 ISO 527–2:2012, 41 and ISO 178:201942 norms, respectively. This machine has two crossheads, one is fixed and the other is electromechanically driven for applying tension to the test sample. The control of the whole tests and the data acquisition were performed by the program TRAPEZIUM.
For the tensile tests, samples were loaded, up to material failure, with a constant crosshead displacement rate of 0.5 mm/min, except for Ref 1A and 17/10 specimens, which crosshead speed was of 1 mm/min. These speeds were maintained constant during all tests because the rate test could affect significantly the measured instantaneous force. The elongation was registered using a 50-mm-gauge-length extensometer (MFA-25). The experimental values obtained from this test were force and elongation, and from these two, the stress and the strain were calculated for graphical analysis. From the stress-strain curves, the Young's modulus (E), the tensile strength (σTS), and the elongation at break (ɛf) were obtained. The E was evaluated by calculating the slope through a linear fit in the linear region of the stress-strain curves, the σTS corresponds to the maximum stress reached during the tensile test, and the ɛf is the maximum elongation reached by the sample during the test.
For the three-point bending tests, the loading nose was directly centered on the midpoint of the samples, being the distance between the support points of 60 mm. The crosshead displacement rate was of 0.5 mm/min. The experimental values registered from this test are load and displacement, which were graphically represented. From the graphics, the flexural modulus of elasticity (Ef), the maximum normal stress (σf), and the maximum strain of the outer surface at midspan (ɛ) were calculated. The Ef was determined following the previous standard, supposing that shear effects are negligible, as follows
44
:
where L is the distance between the support points, m is the slope of the load-displacement curve, and b and h are the width and thickness of the specimen, respectively. The σf is defined as follows
44
:
where F is the fracture force. Finally, the ɛ was evaluated as follows
44
:
where δ is the midspan deflection.
Results and Discussion
The DSC curve of the as-received PLA filament, from 40°C to 220°C, is presented in Figure 4. The first endothermic peak observed is 67°C, which corresponds to the glass transition temperature (Tg). The exothermic peak at around 94°C is attributed to the crystallization temperature (Tc). These peaks are close to the values reported in literature by Corre et al. 45 and Song et al. 46 The large endothermic peak centered at around 177°C can be attributed to the melting temperature (Tm), about 10°C higher than the value reported by Song et al. 46 and 25°C more than Corre et al. 45 Tm was considered the initial reference for manufacture, being the final extruder temperature of 200°C. The annealing temperatures were under the Tg with values of 55°C and 60°C for tensile and bending tests, respectively. It worth noting that both annealing temperatures fall down the Tg because the interest is centered in observing temperature effects on mechanical properties, avoiding structural changes in samples.
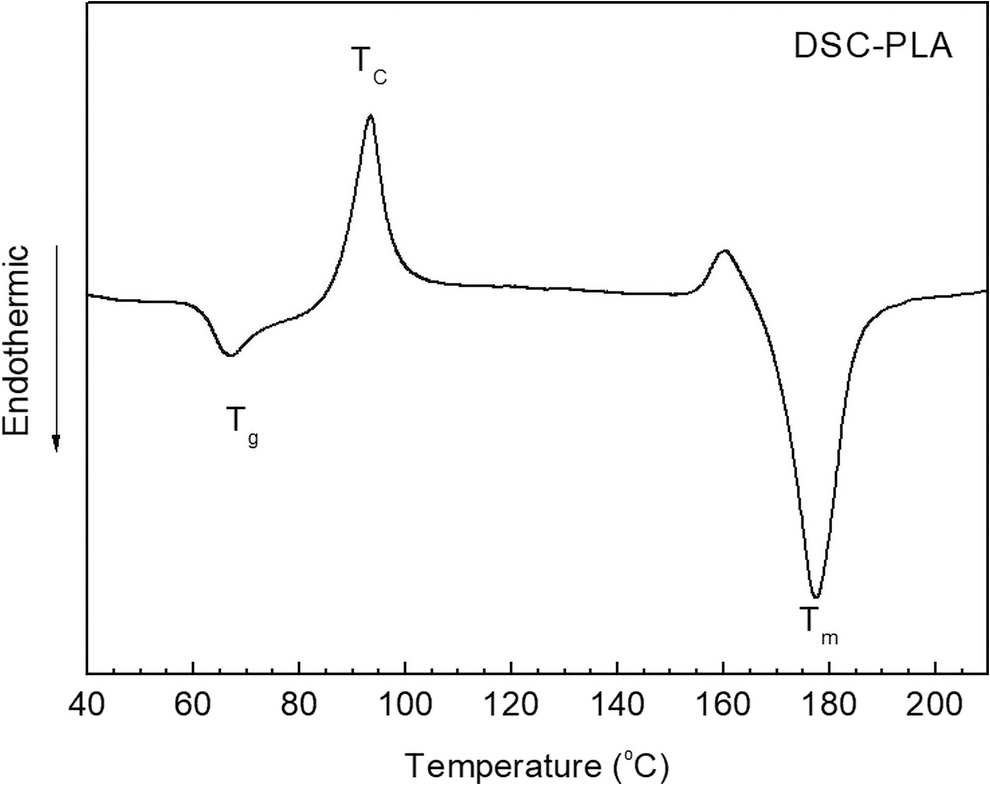
DSC of PLA raw material.
Figure 5 shows representative stress-strain curves obtained from the experimental tensile tests in the studied samples. As can be seen, initially, PLA samples exhibit a quasilinear increase of stress as function of strain, following the Hooke's law. After this elastic behavior, the samples undergo plastic deformation, and stress increases less rapidly until reaching the point of maximum stress, where failure occurs suddenly. The results point to the brittle behavior of these samples, with no significant plastic deformation.

Representative stress-strain curves of tested samples. EO, edge orientation; PR, perimeter raster. Color images are available online.
It is important to indicate that failure appeared, for almost all samples, inside the gauge length, in the zone where the extensometer was located. Nevertheless, some samples broke outside of the gauge length, due to assumed stress concentrations. But, shape graphs and behavior are similar with respect to specimens that broke inside the gauge length. So, all data were included in this study. From the fracture point of view, samples break through the thickness, almost perpendicular to the load direction and without visible necking (Fig. 6a). Also, it is worth noting to mention that no delamination was observered during or after tests (Fig. 6b).

Representative pictures of tensile tested samples.
Results of tensile test parameters are shown in Figure 7. This figure shows the average values of the E, σTS, and the ɛf calculated for each specimen. E values ranging from 2514.07 to 3337.92 MPa, σTS between 28.64 and 37.62 MPa, and ɛf from 1.23% to 1.56%. Ref 5A, Ref 1A, and 17/10 present similar values, which evidence that the studied parameters are independent of sample geometry. As can be observed, the maximum values of the E and the σTS correspond to perimeter raster (PR) and edge orientation (EO) samples, which indicate that mechanical properties are significantly affected by build orientation on the build plate. The specimens failed by propagation of a normal crack. In these cases, the stress applied is aligned with the deposition direction, minimizing the problems related to adhesion between filaments belonging to the same layer (due to the lack of pressure inherent in the 3D printing process). Thus, in these cases, the interfaces between neighboring filaments are parallel to the applied force, resulting in trans-layer failure.
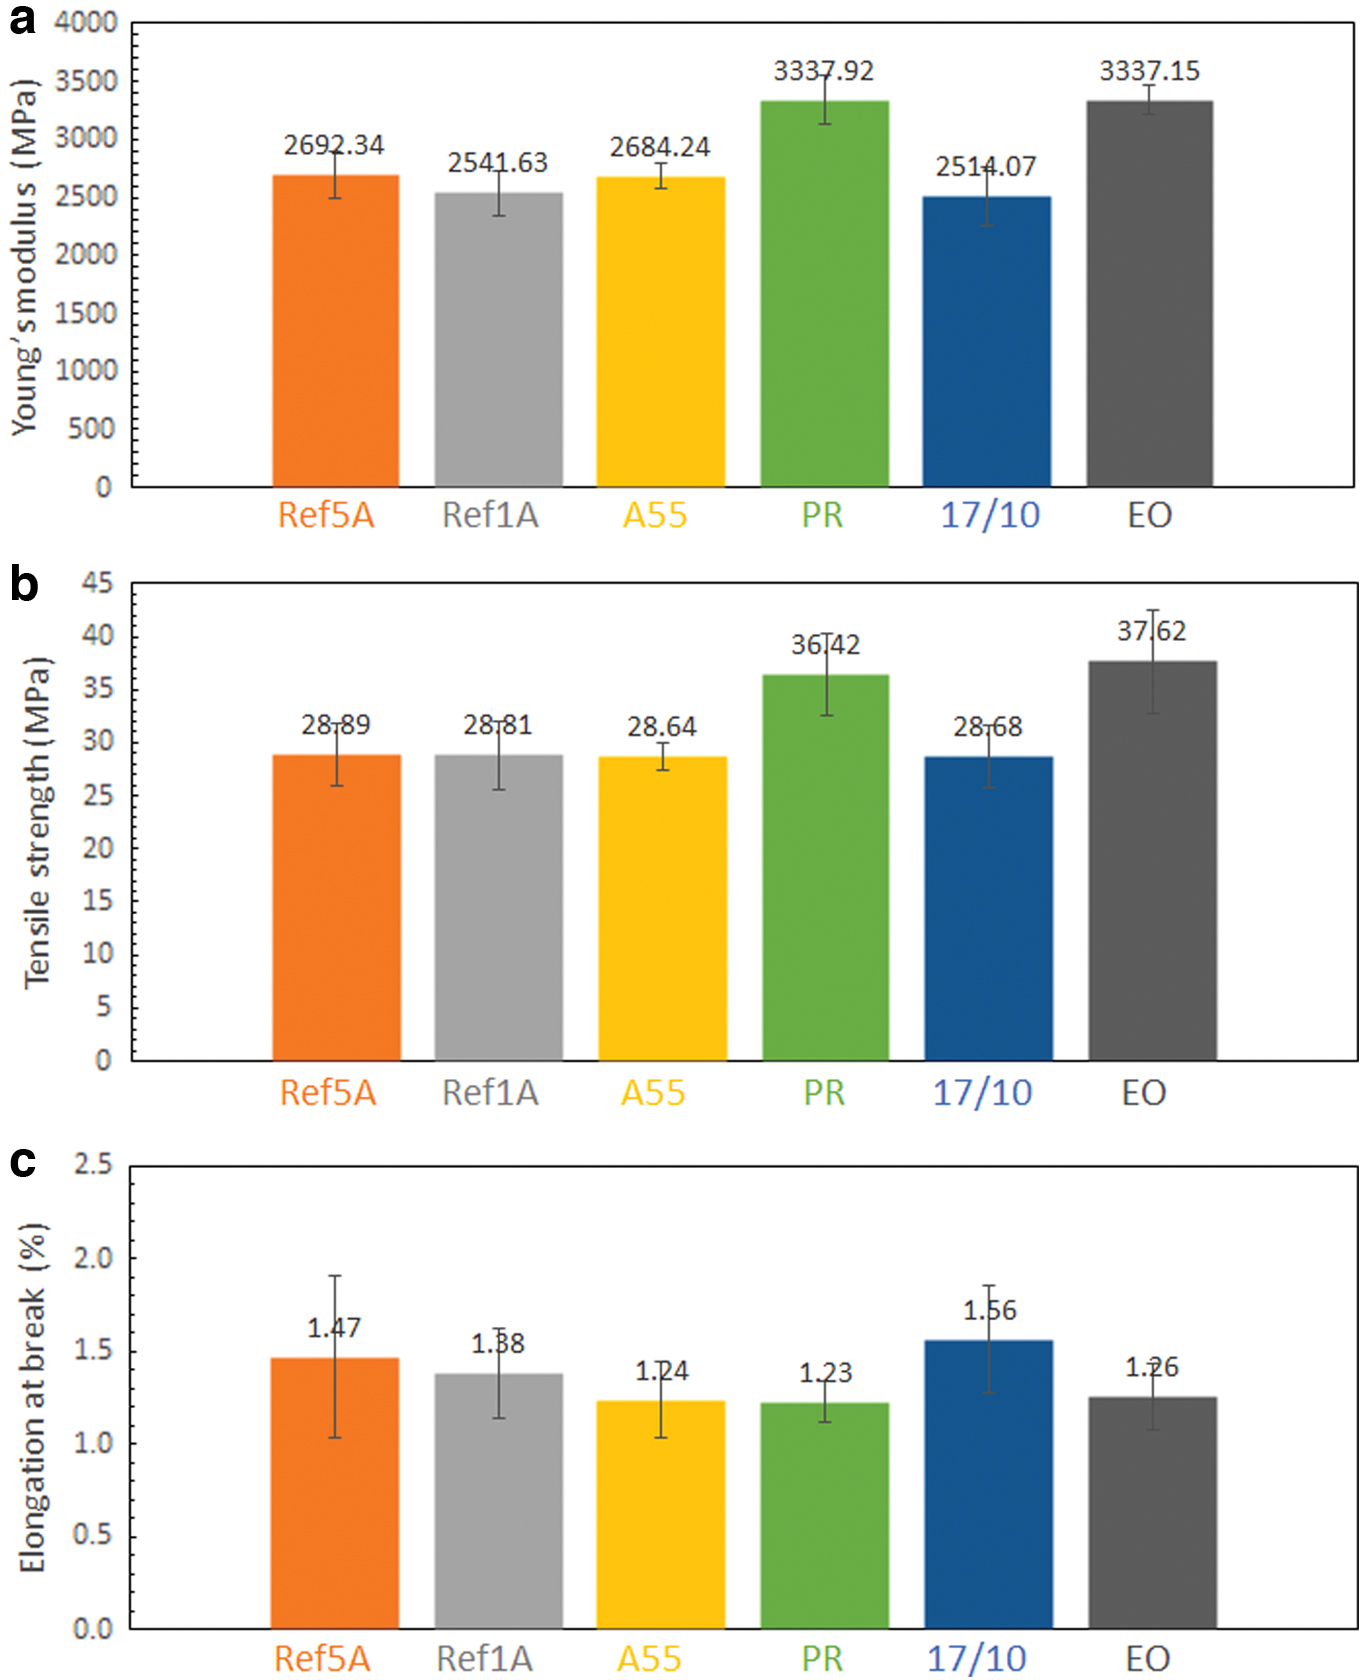
Uniaxial tensile tests parameters of samples:
Hence, it is reasonable to conclude that the PR and EO orientations showed the optimal mechanical performance in terms of strength and stiffness. In both cases, filament orientation is in the loading direction, which is related to the better mechanical properties. When samples are subjected to strain, the polymeric chains can be aligned in the direction of the axis of applied force, with possible formation of secondary bonds, increasing resistance. For other samples, with 45° raster angle, failure could occur due to the shear of the raster bonding at deposition angle, resulting in less values of the E and the σTS. In this sense, for perpendicular raster angle with respect to the loading direction (not studied here), failure could be attributed to delamination of samples. Lowest E and σTS values could be expected close to 0° print orientation, increasing when printing angle increases and obtaining highest values at 90°. Indeed, raster angle is considered one of the most important parameters for the tensile strength. 47
The observed results for the E and the σTS are consistent with the ɛf (Fig. 7c). In this case, PR and EO samples present the ɛf minimum average values. This easiness of elongation, with respect to those samples, could be associated with the 45° raster angle, and might explain the fact that the best results for the ɛf were observed for this orientation. In this sense, the material behavior changes with the loading direction with respect to the raster angle, with a possible transition from brittle (for parallel loading) to ductile (for inclined loading). Furthermore, as can be seen in Figure 5, Ref 5A, Ref 1A, and 17/10 samples present a higher plastic region than the PR and EO samples. This effect is in agreement with the fact that crack initiates in the interfiber bonding, which allows layers to turn and orientate in the load direction, leading to an increase of elongation before failure.
The annealing by heating the sample, below the Tg temperature, at 55°C (Fig. 7) for 3 h, practically does not affect the E and the σTS values with respect to the reference. In fact, a slight decrease of both the E and the σTS is noted. During printing, the deposited layer can produce a temperature change in the adjacent line, with the subsequent residual stress and stress concentration focus. After annealing, these stresses could be removed decreasing the E and the σTS. In the other sense, the ɛf slightly decreases. However, it cannot be concluded a decrease or higher acquired resistance.
In Table 4, reference results are shown for the E and the σTS in similar studies for PLA samples. As can be seen, the obtained intervals for the E and the σTS are in good agreement with intervals presented by other authors.37,52,54 This comparison must be considered carefully because both difference in processing and experimental parameters can result in discrepancies in the observed values. For example, higher strain rates can produce higher tensile strength values compared with lower rate tests.
E and σTS Interval Values Compared to Recent Works
Figure 8 shows representative load-displacement curves obtained from the experimental flexural tests in the studied samples. As can be seen, all samples present a first quasilinear increase of load as function of displacement. After the elastic region, flat orientation/flexural reference (Ref-F) and annealing at 60°C during 5 h (A60) samples exhibited quite a plastic region. In contrast, PR-F samples present a sudden break, being more brittle. From the fracture point of view, an important effect of delamination was observed for the edge orientation/flexural (EO-F) samples during testing (Fig. 9). In this case, the failure can be attributed to the interlayer adhesion fracture (Fig. 9b). For this reason, the plastic region observed could be attributed to the delamination effect instead of real ductile behavior.
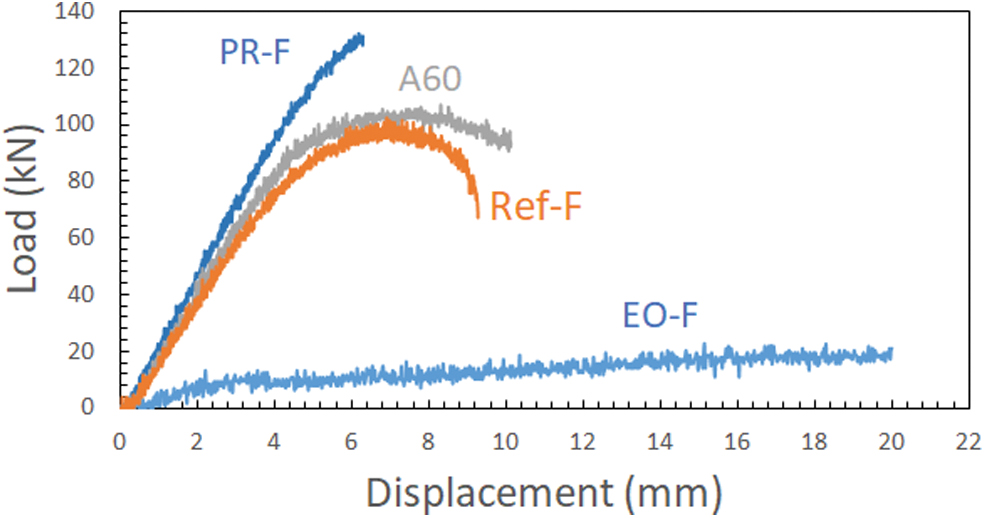
Representative load-displacement curves of tested samples. Color images are available online.

Representative pictures of bending tests of EO-F sample.
Results of bending tests parameters are summarized in Figure 10. This figure shows the average values of the Ef, the σf, and the ɛ. Ef values ranged from 433.07 to 2423.87 MPa, σf are between 13.38 and 79.02 MPa, and ɛ from 4.04% to 8.30%. Comparing the elongation of flexural and tensile tests, ɛf values are higher than ɛ. In contrast, the Ef shows lower values than the E obtained in tensile tests. As can be seen in Figure 10, the maximum values of the Ef and the σf correspond to the perimeter raster/flexural (PR-F) sample, similar to the results obtained for the E and the σTS in tensile tests for this sample type. Differences in printing direction have a significant effect on flexural properties.

Three-point flexural test parameters:
As a consequence, the maximum load received is different for each sample, and so, the value for the σf is also different. PR-F is the strongest sample in holding the load bending, whereas EO-F is less strong. In PR-F samples, raster orientation offers more resistance to bending because layers are parallel to the bending plane, presenting a a higher length. When raster orientation increases, in the case of Ref-F samples, their inclination with respect to the plane of bending changes, producing rasters of smaller length, which net effect is a decrease in resistance.
Bending tests are more delicate than tensile tests in the sense that outer layers are exposed to higher tension. For that reason, any small defect caused during printing could produce a local stress concentration producing high difference among sample results. In fact, the initial crack started to appear at the bottom surface of the samples, located at the opposite side of the applied load. Small defects produced during printing could act as local stress concentrations, favoring the crack. However, evidence of this effect has not been observed in the studied samples.
For the annealed samples (60°C during 5 h), there is an increase of both the Ef and the σf parameters with respect to the reference samples (Fig. 10). This result is in contrast with the annealed sample tested in tensile test (55°C during 3 h). These increases could be attributed to the formation of secondary bonds in the material, improving the Ef and the σf. In fact, previous works have reported the Ef and the σf increase in direct proportion with annealing time, 32 in agreement with the obtained result. Also, a slight increase of the maximum strain of the outer surface is observed with respect to the reference sample. Another possible effect of the increase of temperature and time could be related to the decrease of absorbed humidity. An adequate annealing postprocessing could eliminate the water absorption enhancing the mechanical properties of specimens.
Finally, in Table 5, reference values are shown for both the Ef and the σf in similar three-point bending test studies for PLA samples obtained by other authors. As can be seen, intervals of the Ef and the σf values of this work are in good agreement with intervals presented by other authors.30,34,54–56 The observed differences between the results of this study and other results of authors can be explained by different processing parameters (layer height, nozzle diameter, or printing speed, among others) and experimental setups. For these reasons, absolute comparison is not recommended, but relative comparison is possible, and the tendencies related in this work are in agreement with the processing parameters of previous studies.
E f and σ f Interval Values Compared to Recent Works
Conclusions
In this article, experimental results have demonstrated that tensile and flexural properties are very sensitive to print orientation manufacturing. The experimental results are useful for understanding the best parameters when manufacturing by FDM from the point of view of engineering applications.
In tensile tests, the highest E and σTS values of 3337.92 and 37.62 MPa, respectively, were acquired from PR PLA samples. In this context, fiber orientation in the loading direction is associated with better mechanical properties. PR and EO orientations showed to be the best configurations in terms of strength and stiffness.
In flexural tests, the maximum Ef and σf values, of 2423.87 and 79.02 MPa, respectively, correspond to the PR-F sample. When bending test is considered, layer orientation must be taken into account as an important factor. If deposition is parallel to bending plane, a higher layer length is obtained, resulting in a more resistant prototype. If raster orientation increases the inclination, with respect to plane of bending, a smaller fiber length is produced causing easier separation between the layers. In an extreme case, the failure can be produced by interlayer separation. Fiber orientation during printing has a significant influence on ductile or brittle behavior.
Annealing samples, after printing, close to Tg could enhance the mechanical properties. Although no changes were detected in tensile parameters, after a heat treatment of 55°C during 3 h, an increase of both the Ef and the σf parameters was observed in bending tests after 5 h at 60°C. For this reason, the potential of improving the mechanical properties, annealing at different temperatures and times must be considered in future works.
Footnotes
Author Disclosure Statement
No competing financial interests exist.
Funding Information
This work has been partially supported by the Departamento de Ingeniería Industrial of the Universidad de La Laguna.