
Abstract
3D printing has exhibited significant potential in outer space and medical implants. To use this technology in the specific high-value scenarios, 3D-printed parts need to satisfy quality-related requirements. In this article, the influence of the filament feeder operating states of 3D printer on the compressive properties of 3D-printed parts is studied in the fused filament fabrication process. A machine learning approach, back-propagation neural network with a genetic algorithm (GA-BPNN) optimized by k-fold cross-validation, is proposed to monitor the operating states and predict the compressive properties. Vibration and current sensors are used in situ to monitor the operating states of the filament feeder, and a set of features are extracted and selected from raw sensor data in time and frequency domains. Results show that the operating states of the filament feeder significantly affected the compressive properties of the fabricated samples, the operating states were accurately recognized with 96.3% rate, and compressive properties were successfully predicted by the GA-BPNN. This proposed method has the potential for use in industrial applications after 3D printing without requiring any further quality control.
Introduction
Fused filament fabrication (FFF) is a process of additive manufacturing (AM) that is suitable for producing 3D-printed parts with complex geometries.1–4 FFF has the potential to help manufacture emergency supplies flexibly and cheaply.5,6 However, it is challenging to ensure the quality of 3D-printed parts under the condition of the open-loop control of the FFF process. Unsuitable operating states induce defects, leading to off-specification products being fabricated.7–9 The standardization for metal 3D printing has already been available, 10 which guarantees the quality of products up to standard. Comparing with the metal 3D printing, the FFF process is indeed less reliable in terms of reproducibility and final part quality. Therefore, it is important to develop an in situ quality control model for monitoring the operating states and predicting the quality of the fabricated parts during the FFF process.11–13
The researches about the in situ monitoring of FFF-typed 3D printing have been carried out. A detailed summary of the mechanical properties of FFF-type 3D-printed parts for different materials is shown in Refs.14–18 The printing parameters, such as raster angle, infill, the deposition direction, have shown a significant effect on the physical properties of fabricated parts.5,14 Optimization of the printing parameters plays a key role in improving the surface roughness, interlaminar properties, dimensional accuracy, mechanical properties, and so on.16–18
Because of the fast cooling of the printed material below the glass transition temperature during the printing process, the defects, such as voids, filament nonhomogeneous distribution, and poor bonding between beads and layers, were identified. 17 The nozzle temperature, bed temperature, and printing speed of the laminate were varied to illustrate the effect of process temperature on the fracture toughness of the continuous carbon fiber-reinforced polymer composite. 18
Machine learning models have shown advantage in optimizing process parameters in FFF-typed 3D printing.19–21 The perspective on how machine learning can be used in bioprinting is discussed in Yu and Jiang. 19 A detailed summary of in situ monitoring application of machine learning in AM is illustrated and summarized in Goh et al. and Qi et al.20,21 The process parameters, such as layer thickness, the orientation, and the raster angle, are considered the inputs of the machine learning models and used to monitor or predict the dimensional accuracy, surface roughness, and mechanical properties. 20 While in Qi et al., 21 the challenges of using machine learning in AM, such as small data set, lack of experience in labeling data, and selecting features, are discussed and the potential solutions are given.
Past researches on in situ quality control during the FFF process have focused on two aspects: the states of the FFF machine 22 and the quality of the fabricated samples.11,23 Research on the first object has focused on state recognition and fault diagnosis. Wu et al. 22 developed a method of acoustic emission (AE)-based monitoring that uses data-driven methods to identify the normal, out-of-material, and plugged nozzle states of the FFF process. Yang et al. 24 used an AE sensor to monitor filament breakage and the instantaneous skewness of the sensing data to predict it. Kim et al. 25 proposed an AE sensor and three accelerometers to diagnose loosened bolts in the nozzle head during the FFF process by using a support vector machine (SVM) model.
Heras et al. 26 proposed a closed-loop system to detect filament blockage and adjust the speed of extrusion. Novel feeding mechanisms were developed and the pinch force imposed on the filament was optimized in Fiedler and Volpato et al.27,28 to avoid filament blockage. Our previous work 29 focused on diagnosing filament blockage, and we developed a monitoring model using vibration sensors and a least-squares SVM method that identified filament blockage with an accuracy of over 90%.
The second object above focuses on monitoring the geometric properties and predicting the mechanical properties of the manufactured items. Common geometric defects in the FFF process include delamination, warpage, distortion, excessive roughness, and abnormal pores. Delamination, warpage, and distortion are caused by residual stress, which can be reliably monitored by fiber Bragg grating (FBG) sensors.29,30 However, the printing process needs to be suspended to insert the FBG sensor, which can lead to variations in the sample's microstructure. Hammond and Li 31 introduced a vision-based quality assurance system to monitor and detect warpage and delamination in the FFF process, but did not study the causes of these defects.
Schimpf et al. 32 reduced the probability of warpage by improving the fusion and adhesion performance of the filament. Panda et al. 33 explored the relationship between the warpage and the process parameters during the FFF process, and found that the thickness and extrusion velocity of the layer have the most significant influence on warpage. Although these methods can be used to reduce the frequency of warpage and delamination, residual stress during the fabrication process cannot be monitored in situ.
The surface condition of product is another important geometric property of the FFF process. Li et al. 34 proposed an ensemble data-driven model to predict surface roughness in which features are extracted from the time and frequency domains by using multiple sensors, including thermocouples, infrared temperature sensors, and accelerometers. Other methods, such as the heterogeneous sensor array 35 and infrared-ray temperature sensor, 36 have also been developed to detect surface roughness. Boschetto and Bottini 37 predicted surface roughness based on a geometrical model using the thickness of the layer and angle of deposition. Abnormal pores are known to cause the mechanical properties of the fabricated parts to degrade.
Du Plessis et al. 38 found, by using the X-ray computer tomography technology, that large inclusions in the filament lead to nozzle blockage and large pores in the fabricated parts. Sergey et al. 23 combined the FBG as an AE sensor with machine learning to build a classifier that can recognize porosity during the powder-bed fusion process. However, few studies have explored predicting the mechanical properties of products manufactured using the FFF process. Zhang et al. 11 developed a machine learning method to predict the tensile strength of products based on a long short-term memory network and in-process sensing data. Yang et al. 39 introduced a mathematical model to determine tensile strength by estimating the levels of solidification in the stereolithographic process.
Tezel et al. 40 investigated the compressive strength (CS) of alternatively structured/scaled hybrid materials, and found that the highest CS was achieved using a triangle-infill printing pattern. Mei et al. 41 found that a short carbon fiber can improve the CS and modulus of the fabricated parts. Hou et al. 42 created a nickel–titanium alloy using the AM method and increased its fatigue life using microstructural control.
The abovementioned methods have been used to diagnose machine faults and detect geometric imperfections during the FFF process. However, there are some deficiencies in the attempts to monitor and predict in previous works. First, in the context of monitoring states of the machine, past research has focused on a simple binary judgment: namely, normal and abnormal. Such judgments can detect faults but cannot help improve the design of FFF machines. Second, few studies have researched predicting the mechanical properties of the 3D-printed parts based on different operating states of FFF machine; to the best of our knowledge, the relationships between the operating states of 3D printer and the mechanical properties of the 3D-printed parts have not been studied in the past work in this area.
Finally, the sensing data used in past work have not been fully exploited. These data have been used either for recognizing the states of the machine or for predicting the quality of the 3D-printed parts, but rarely for both at the same time.
To investigate the influence of the operating states of 3D printer on the compressive properties of the fabricated samples, a typical component of an FFF machine, the filament feeder, is monitored in situ using vibration and current sensors. In this article, the influence of the filament feeder operating states of FFF printer on the CS and compressive modulus (CM) of 3D-printed parts is studied. A machine learning approach, the back-propagation neural network with a genetic algorithm (GA-BPNN) optimized by k-fold cross-validation (k-CV), is developed and applied to monitor the operating states of the filament feeder and predict the CS and CM of the 3D-printed parts in the FFF process with vibration and current data.
Methodology and Experiment
Analysis of prediction mechanism
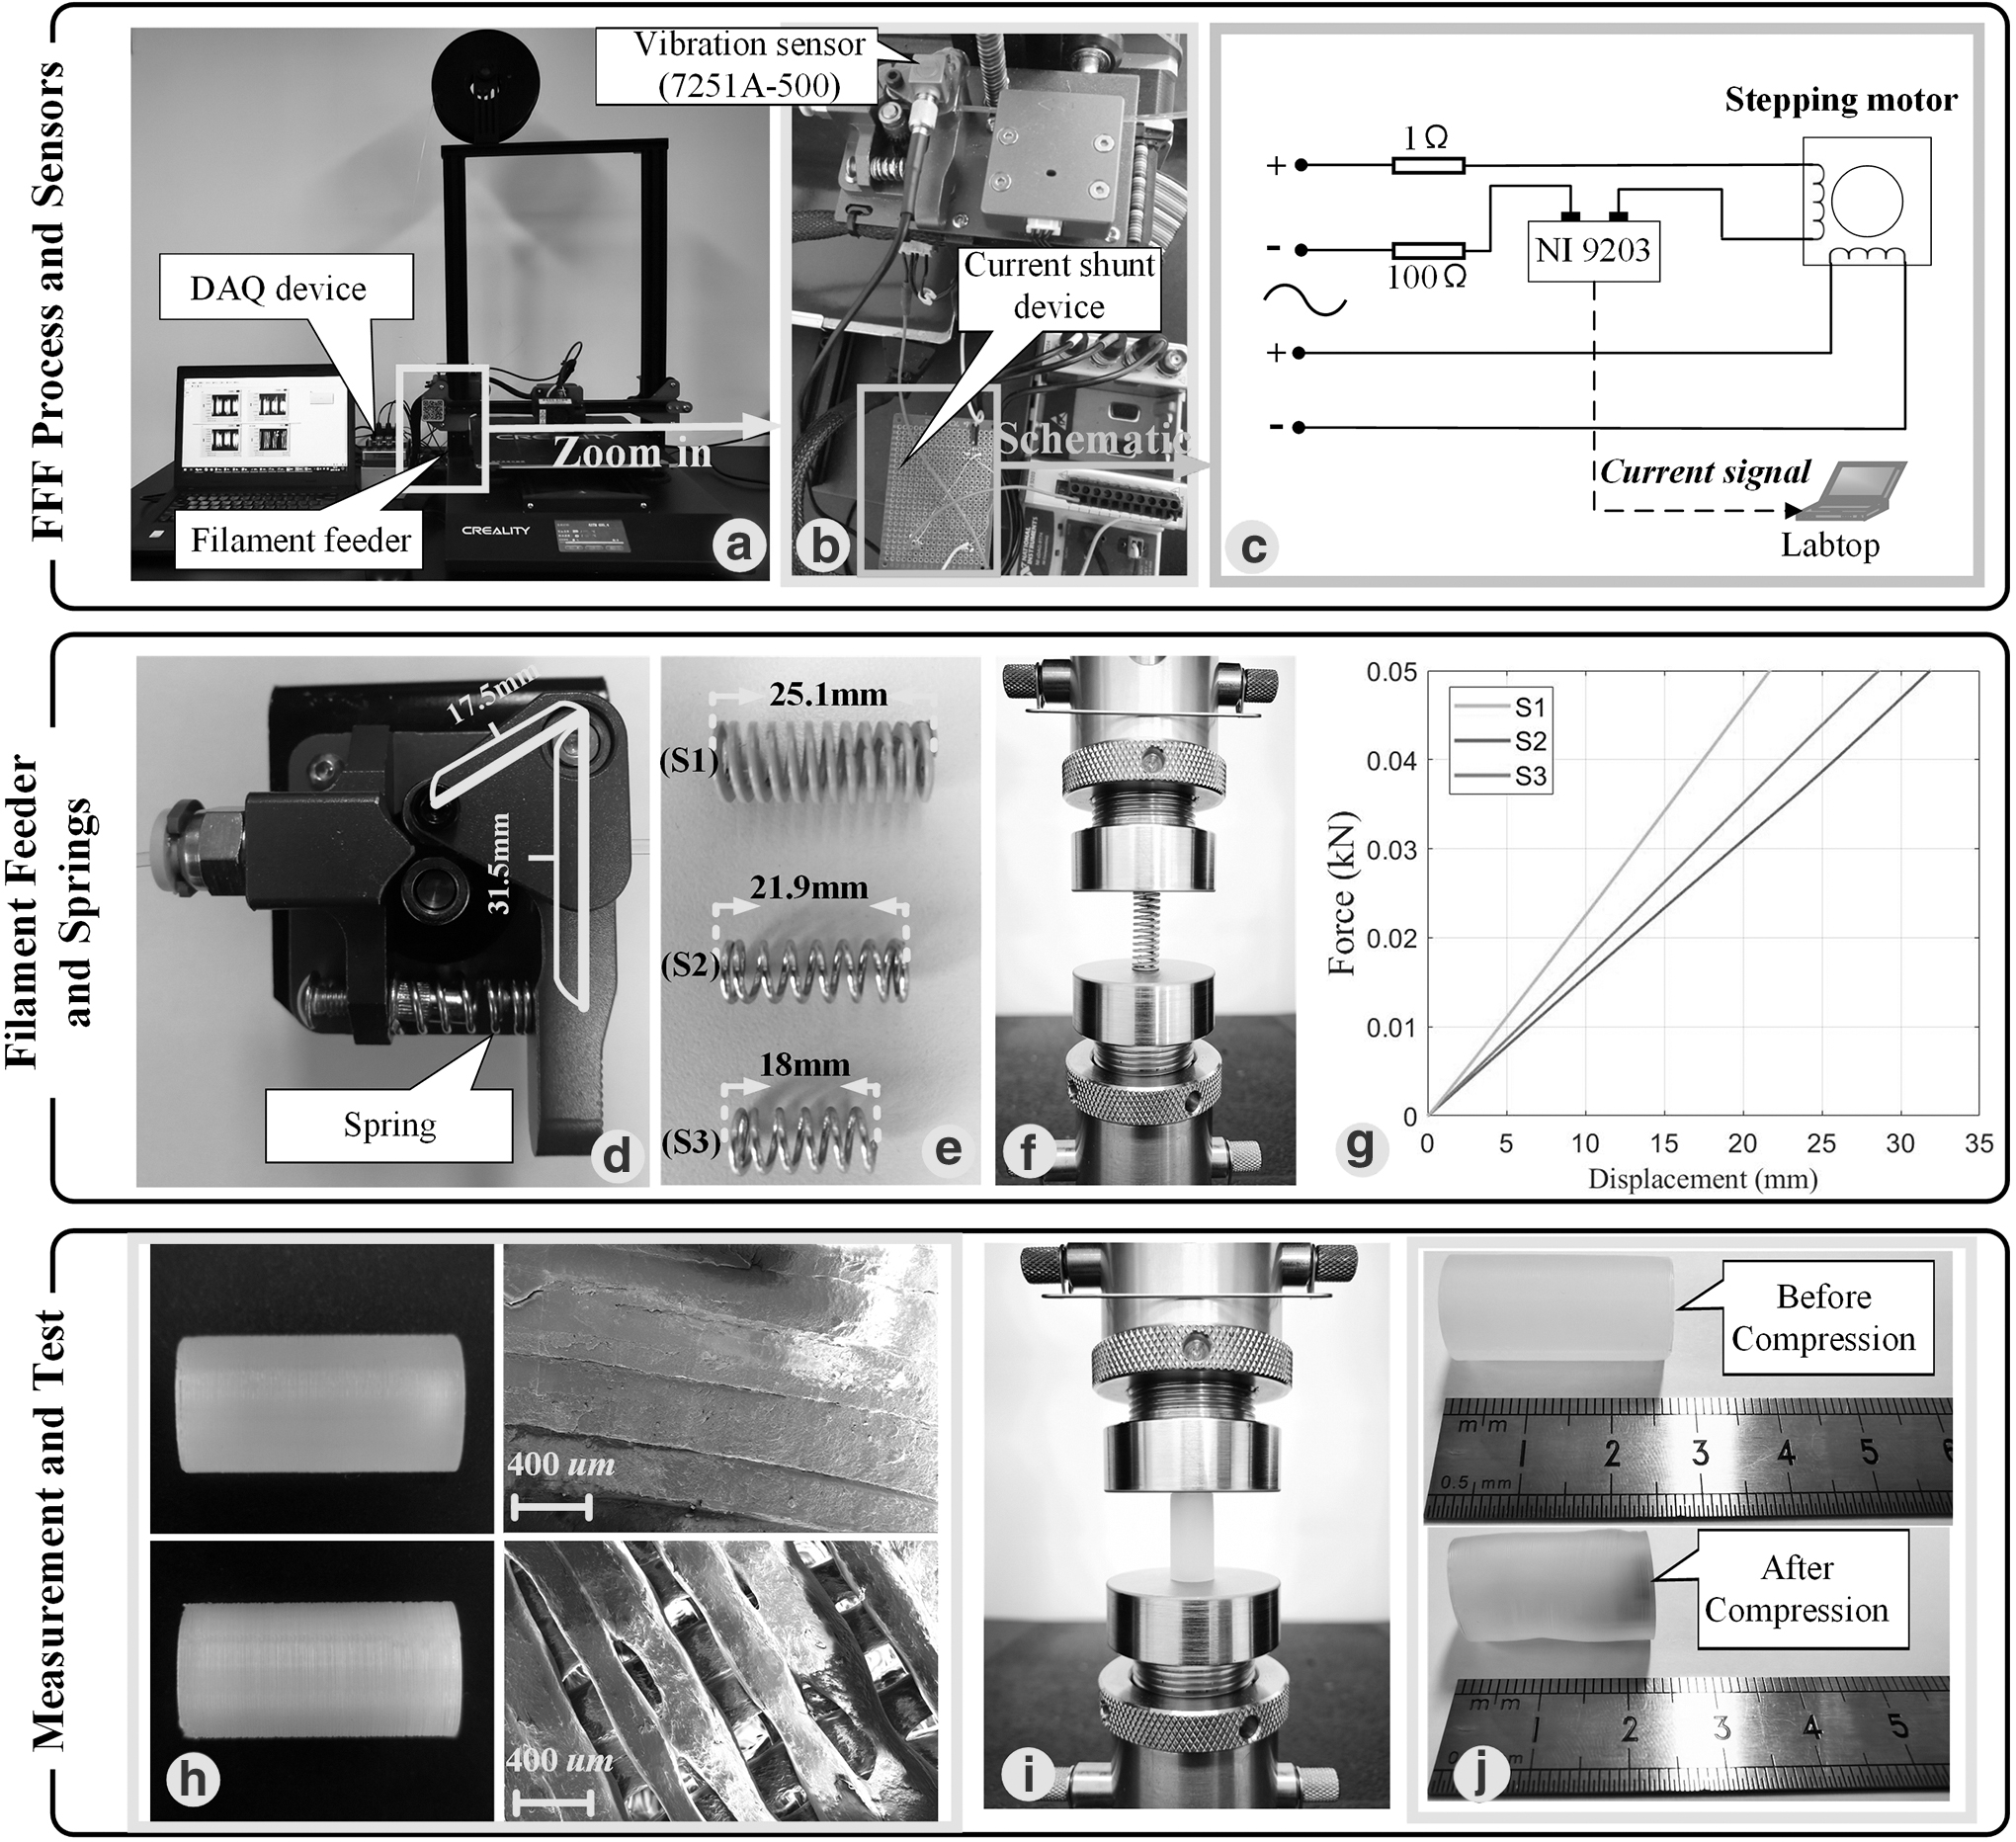
The FFF-type printing and compressive test process is shown in Figure 1a–e. The typical FFF machine is shown in Figure 1a and b. It consists of a spool for the material, filament, filament feeder, extruder (composed of a temperature control unit and nozzle), and building platform. The filament feeder sends a moderate amount of the filament to the extruder, which can directly affect the mechanical properties of the 3D-printed parts. The filament feeder consists of a pinch system and a stepper motor. The pinch system is composed in turn of a spring, a lever, and two wheels (a drive wheel and a driven wheel, see Fig. 1a). The force generated by the spring drives the wheel through the lever. As the drive wheel is driven by the stepper motor, friction is generated between the filament and the wheels, and drives the filament moving.

Diagram of the developed recognition and prediction model.
The printed samples in Figure 1c (ϕ12.7 × 25.4 mm) were accorded with the ASTM D695-10, 43 and the polylactic acid (PLA) filament (ϕ1.75 mm) was used as fabricating material. Figure 1d is the compressive test, and the CS and CM of the printed samples are obtained from the strain/stress curve (Fig. 1e). As the PLA is rigid material, the CS here is defined as the maximum value of the strain/stress curve, while the CM is the maximum slope value of the stain/stress curve. 43
The relationship between the filament feeder operating states and printed sample compressive property is shown in Figure 1f. The abnormal operating states of the filament feeder are one of the leading causes of FFF printing failure. 27 If the spring of the filament feeder is adjusted too loosely to provide enough pinch force, the phenomenon of slipping occurs between the filament and the wheels, leading to the amount of feeding filament less than expected. 27 If the spring is adjusted too tightly, there may be excessive friction, the filament blockage would occur, and the feeding rate of the filament is significantly influenced, which also makes the amount of feeding filament less than expected. 29
In both cases above, the filling rate of fabricated parts would be less than the set value, resulting in poor compressive properties. The compressive property of 3D-printed samples, fabricated under different operating states of filament feeder, was analyzed and the relationship model between operating states and the compressive property was established.
The state recognition and compressive property prediction model is illustrated in Figure 1g. The automated state monitoring system can recognize the condition of the filament feeder, and predict CS and CM by analyzing the sensor data. 44 Considering that the intensity of vibration and load on the motor varies with changes in the operating conditions of the filament feeder, it is reasonable to use vibration and current sensors to monitor the states of the FFF. The filament feeder operating states were recognized with the vibration and current sensor data and proposed the GA-BPNN model. Furthermore, on the premise of the relationship model between operating states and compressive property, the CS and CM were also predicted by the aid of sensor data and the GA-BPNN model.
Experimental setup
The experimental system (illustrated in Fig. 2a) consists of the FFF machine, vibration sensors, current shunt device, data acquisition (DAQ) system, and a laptop computer. A commercial desktop FFF printer (CR-10S Pro., China) is used to fabricate the specimens. Vibration signals are collected by a piezoelectric vibration sensor (65–10 with three channels; Endevco) mounted on the filament feeder, and captured by a DAQ card (NI 9234; National Instruments) (Fig. 2b). As the filament feeder is driven by a stepper motor, the current of the stepper motor is collected to characterize the operating state. A current shunt device is used to meet the measurement requirement of NI 9203 (Fig. 2b, c).
Experimental setup and compressive test.
Both the vibration signals and current signals are preprocessed and saved by a digital signal processing module (build-in LabVIEW 2014) on the laptop. All the data training and testing process is performed in a MATLAB environment (MATLAB 2016a; the MathWorks Inc.). The specifications of the FFF process are listed in Table 1. The extruder temperature is set as 200°C and the feed rate is set as 100 mm/s. The nozzle diameter is 0.4 mm and the value of layer thickness is 0.2 mm. The filling rate is set as 100%.
Specifications of the Fused Filament Fabrication Process
PLA, polylactic acid.
Three springs (marked as S1, S2, and S3) were used (Fig. 2d, e) to obtain the operating states of the filament feeder. The initial lengths of S1, S2, and S3 were 25.1, 21.9, and 18 mm, respectively. The compressive force–displacement curve is shown in Figure 2f by using an MTS landmark machine with a load cell of 5 kN. The elastic constant of S1, S2, and S3 was 9.2, 7.1, and 9.8 N/mm, respectively. The length ratio of the effort arm to the resistance arm of the lever of the filament feeder (Fig. 2d) was 1.8 (31.5/17.5). Its operating states under the influence of the different pinch forces (Table 2) were calculated by Equation (1):
Operating States of Filament Feeder Under Different Pinch Forces
where
The 3D-printed samples and their scanning electron microscope (SEM) images are shown in Figure 2h. The cross section of the upper sample printed under a control state shows a uniform and closely arrayed line. The line width of ∼400 μm was inherent from the diameter of the nozzle. As for the SEM images of printed specimens under an abnormal state, it can be observed the distance between the adjacent filaments and the next layers. The weak compression strength can be explained by the unfilled internal structure of specimens.
To ensure the accuracy and reliability of compressive testing, each state of the filament feeder was tested, and the average of five specimens with a 10 kN load cell was calculated. The experiments were conducted following the ASTM D695-1043 standard procedure. The recorded compressive testing values served as the ground truth for evaluating the predicted values. The tests were carried out at room temperature and the speed of the crosshead was fixed at 1 mm/min. As the PLA material is characterized by brittle failure during the compressive test,45,46 the maximum displacement was set at 2.54 mm, equivalent to 10% of the initial length. 47 The compressive testing is shown in Figure 2i, and the 3D-printed samples before and after compressive testing are shown in Figure 2j.
Feature extraction and selection
To obtain satisfactory results from the collected sensor signals, statistical features were extracted through time- and frequency-domain analyses. To distinguish among the operating states, the extracted features needed to be strictly related to the changes in the signal, highly sensitive to the operating conditions, and resistant to noise. 48 Based on these considerations, nine features (Table 3) were extracted to describe changes in the signal.
Features Extracted by Time- and Frequency-Domain Analyses

CF, crest factor; KC, kurtosis coefficient; PV, peak to valley; RMS, root mean square; RMSF, root-mean-square frequency; SC, skewness coefficient; SF, shape factor.
The time-domain had seven statistical features covering a wide range of well-known characteristics of signals: mean, root mean square (RMS), peak to valley (PV), crest factor (CF), shape factor (SF), skewness coefficient (SC), and kurtosis coefficient (KC).13,48 The mean, RMS, and PV indicate the amplitude and energy of the signal over time, while CF, SF, SC, and KC reflect its distribution. The root-mean-square frequency (RMSF) and root variance frequency (RVF) were extracted from the frequency domain by power spectrum density analysis.
48
They indicate the variation in the main frequency band and dispersion of the spectral energies of the signal. The statistical features are shown in Table 3, where
The selected features needed to be well correlated with the operating states of the filament feeder or the compressive property of the manufactured sample, to have a high degree of aggregation and to deliver robust performance. The feature reduction method used here was adapted from Ref.
48
and is as follows:
Assume that the number of features is M, the length of each feature is N, the number of states of the filament feeder is K, and the length of feature in each state of the filament feeder is NK. Then,
where
The metrics of aggregation (Agg), robustness (Rob), and correlation (Cor) can be written as follows:

where
A weighted linear combination of the metrics after normalization is defined as the feature selection criterion 48 :

where Z is the objective to be optimized,
Predictive model using GA-BPNN
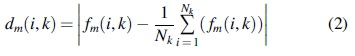
The BPNN 49 uses errors arising from the discrepancy between the predicted and the desired outputs, and gradient descent to modify the connection weights. Although a BPNN can converge, its application is hampered by relatively long training times and the need to obtain a locally optimal set of weights. To solve these problems, the BPNN has been improved by adding the genetic algorithm to it (GA) 50 in the GA-BPNN. 51 The GA is a powerful stochastic algorithm that uses principles inspired by natural genetic populations to optimize search mechanisms for natural selection. A flowchart of the GA-BPNN model is shown in Figure 3a.
Flowchart of the GA-BPNN and its application.
The core improvement of the GA-BPNN model is the optimization of the initial weights and thresholds of the BP model by a series of operations: selection, crossover, and mutation. The GA can help the BPNN model obtain a globally optimal solution and improve its learning rate.
The fact that a single hidden layer BPNN can approximate any measurable function arbitrarily has been proved in Hornik et al., 52 and the larger the number of hidden neurons, the higher the capability of the algorithm in approximating complex relationships. Although a larger number of hidden neurons lead to higher capability in approximating complex relationships, it causes such problems as overfitting and increased computational burden. 53 Therefore, a single hidden layer was used in the proposed BPNN model, and the k-CV was introduced to help the GA-BPNN determine the optimized number of hidden neurons and avoid overfitting to some extent.
The process of predicting the compressive property of the sample in the FFF process is shown in Figure 3b. In the offline process, the acquired data sets are used to train the GA-BPNN model. Features extracted from the training data sets and subjected to feature reduction are set as inputs to the model. The states of the filament feeder, CS, and CM are, respectively, set as outputs. In the online process, the trained GA-BPNN model is used to recognize the state of the filament feeder, and predict the CS and CM of the fabricated parts.
Results and Discussion
Analyzing the relationship between the operating states of filament feeder and compressive property of fabricated parts
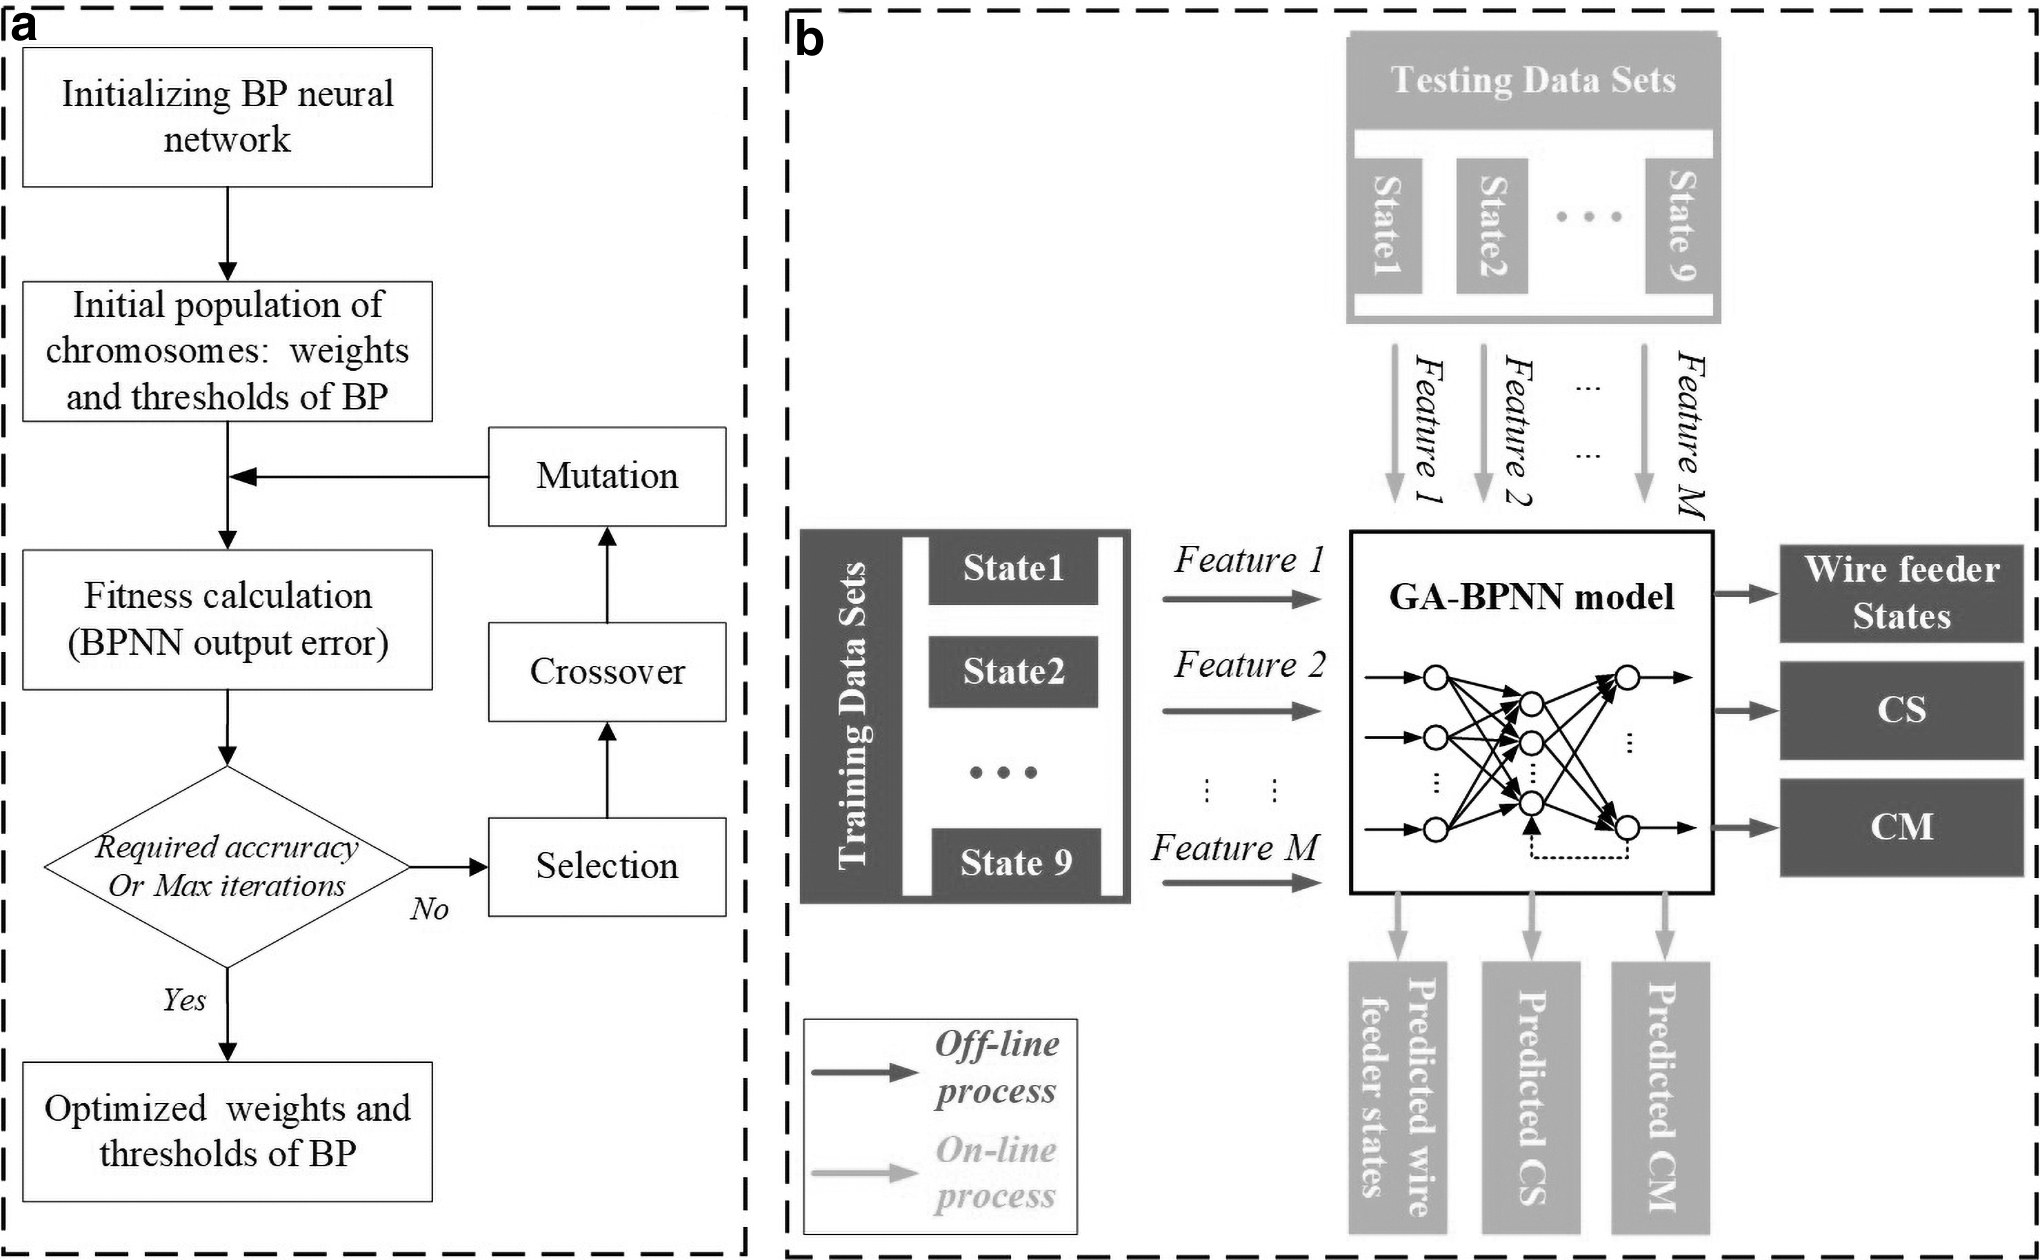
The recorded values of CM and CS are shown in Figure 4. A total of 45 specimens were fabricated in 9 operating states of the filament feeder (Table 2). The values of CM and CS were calculated from the compressive strain/stress curves of 3D-printed samples under operating States 1–9 of filament feeder, respectively, according to ASTM D695-10. 35
The relationship between the states of the filament feeder and the compressive properties of the fabricated samples.
The relationship between the states of the filament feeder and values of CS of the fabricated specimens is shown in Figure 4a and c. In State 1, the pinch force was 167.3 N (Table 2) and the mean CS was 21.5 MPa. As the pinch force decreased, the value of CS increased. When the pinch force was 62.6 N (State 7), the mean value of CS was 51.8 MPa, which was the maximum value of all nine states. Furthermore, the CS values in States 6 and 8 were high with mean values of 48.2 and 49.8 MPa, respectively.
In other words, specimens built in States 6, 7, and 8, with pinch forces between 49.8 and 75.4 N, had high CS values. Once the pinch forces decreased to 26.5 N, friction between the filament and the wheels in the filament feeder was not strong enough to send the required amount of filament, leading to a sharp decrease in the CS values of the fabricated specimens. The mean CS value of the test specimens in State 9 was 10.2 MPa, the lowest of all nine states.
The trends of variation in the CM and CS values with changing states of the filament feeder were similar (shown in Fig. 4b, d). In State 1, the mean CM value was 2.2 GPa. As the pinch force decreased, CM increased. When the pinch force was 62.6 N (State 7), the mean CM was 6.89 GPa, which was the maximum value of all nine states. Specimens fabricated in States 6 and 8 had higher CM values, with means of 5.60 and 5.83 GPa, respectively. Once the pinch forces deceased to 26.5 N, the mean CM value of the specimens in State 9 was 0.83 GPa, which was the lowest of all nine states.
According to the analysis and experiments, the operating states of the filament feeder significantly affected the compressive properties of the 3D-printed samples. In view of this, the compressive properties of the 3D-printed samples, the CS and CM, can be predicted by the sensor data characterizing the operating states of the filament feeder.
Signal preprocessing and feature selection
The accelerated speed signals of the filament feeder were collected using a vibration sensor mounted on it. The shunted currents (Fig. 2b, c) of the stepper motor driving the filament feeder were collected using NI 9203. To balance informational integrity with computational efficiency, a sampling rate of 2.5 kHz was used in the experiments. 13 The raw signals are shown in Supplementary Figure 5, and signals of the vibration (x, y, and z directions) and current are shown in Figure 5b. The data cell used for feature extraction operated under basic operating states, and even- and odd-layered printing (Fig. 5a) was used to maximally cover signal information. The data cell was set as a continuum data region, as shown in Figure 5b.
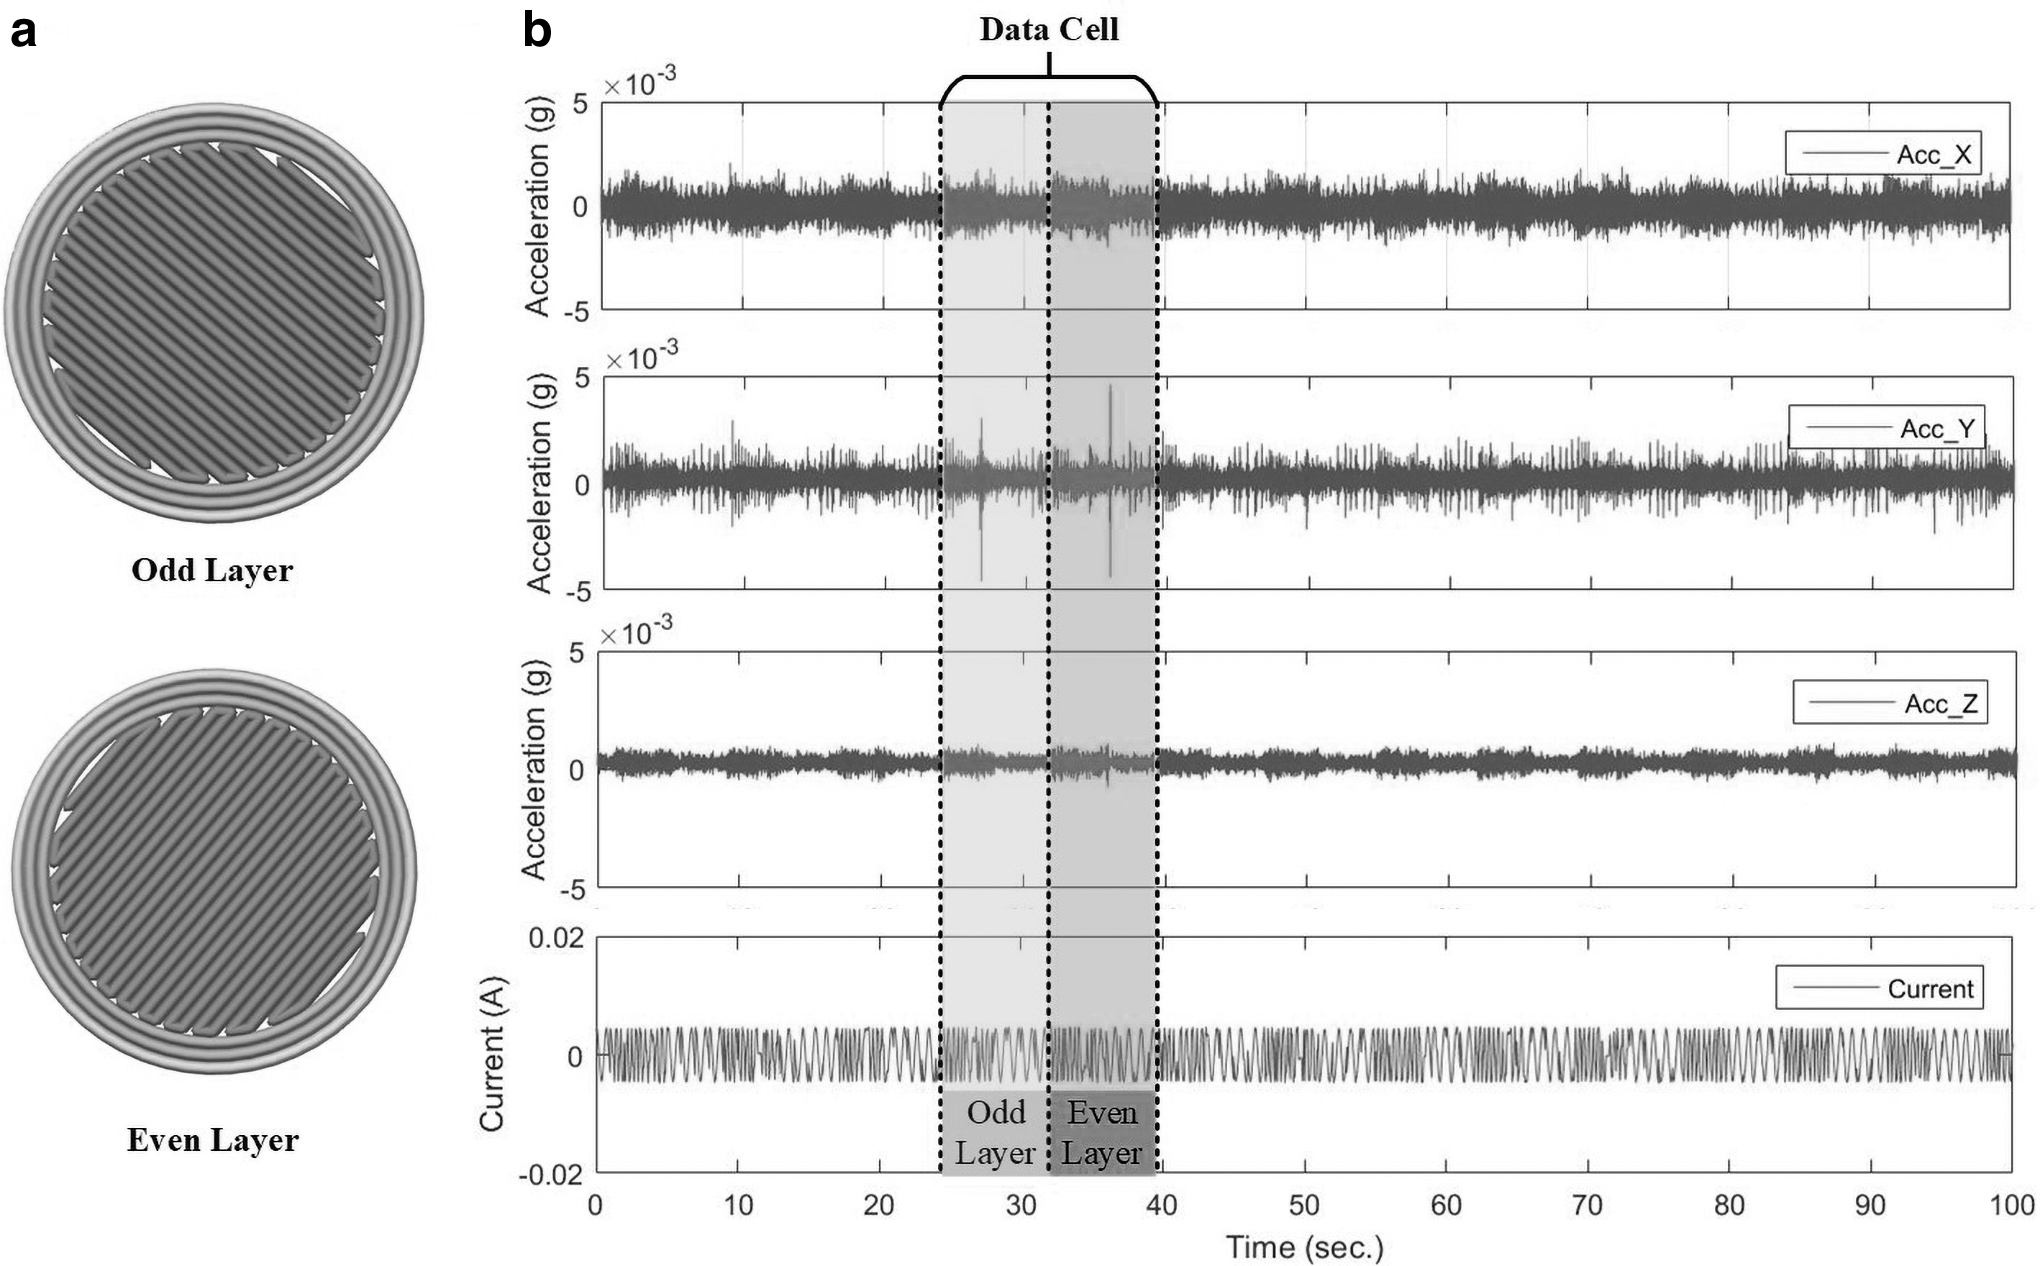
The basic operating states and length of the data cell.
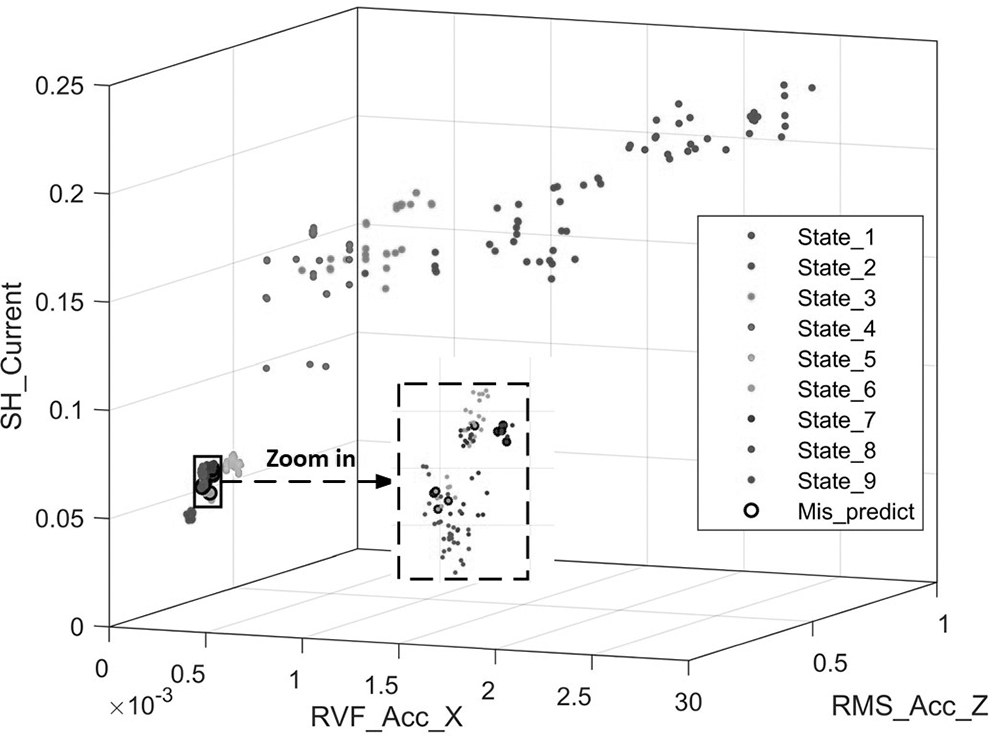
A total of 36 features were extracted. The first, second, and third sets of nine features (shown in Table 3) were extracted from the accelerated speed signals in the x, y, and z directions, respectively. The fourth set was extracted from the current signals. The z values of the features were calculated according to Equations (3) and (4), and are illustrated in Figure 6a. The nine highest z values marked in yellow were selected: the RMS was extracted from the acceleration signals in the x-direction (RMS_Acc_X for short, the same below), RVF_Acc_X, RMS_Acc_Y, RMSF_Acc_Y, RMS_Acc_Z, SH_Acc_Z, RMSF_Acc_Z, SH_Current, and RMSF_Current. Figure 6b illustrates three selected features, RVF_Acc_X, RMS_Acc_Z, and SH_Current, under nine operating states of the filament feeder.

Feature selection.
The points in States 6, 7, and 8 were in proximity (shown in the zoomed-in chart in Fig. 6b) and had a more compact distribution than other points.
Recognizing operating states of filament feeder in the FFF process
The GA-BPNN model was applied to recognize the operating states of the filament feeder. The nine selected features were set as input, the nine states of the filament feeder were set as output, and the number of hidden neurons is determined as 9 after 10-CV. The population size, the number of generations, crossover probability, and the mutation probability of GA are set as 20, 50, 0.2, and 0.1, respectively. The number of epochs, the learning rate, and the training error of the proposed GA-BPNN model are set as 500, 0.1, and 1 × 10⁻⁴.
The GA was used to optimize the initial weights and thresholds of the neural network. A total of 1080 data cells were used to train the neural network. To verify the accuracy of the trained model, 270 data cells were set as the testing group. The results of the testing group are shown in Figure 7. The points in States 6, 7, and 8 were very similar, as shown in the zoomed-in chart in Figure 7.
Results of testing group using the GA-BPNN model.
Ten data cells were incorrectly predicted in these three states, and the accuracy of recognition was 96.3% (10/270). In addition to the GA-BPNN model, the BPNN, SVM, and random forest (RF) models were used to recognize the states of the filament feeder for the sake of comparison, and the results are shown in Table 4. For the multiclassification task of the SVM, the LibSVM algorithm 54 was applied, and the radial basis function was used as a kernel function to adjust the nonlinearity of the experimental data.
Recognition Results Using the GA-BPNN, BPNN, LibSVM, and RF Models
GA-BPNN, back-propagation neural network with a genetic algorithm; RF, random forest; SVM, support vector machine.
The recognition rates obtained using the GA-BPNN, BPNN, LibSVM, and RF models were 96.3% (260/270), 93.3% (252/270), 92.6% (250/270), and 91.1% (246/270), respectively. This shows that the GA-BPNN optimized by k-CV was the most accurate of the three models. The accuracies of States 1 and 9 for all models were 100%, which illustrates that an excessively large or small pinch force was easy to recognize. The accuracies of States 6, 7, and 8 were lower than those of the others, which is consistent with the above discussion. Furthermore, the high recognition rates of all four models demonstrate the effectiveness of the proposed method for identifying the operating states of the filament feeder.
Predicting compressive properties in the FFF process
The values of the CS and CM of the fabricated samples were predicted using signals of accelerated speed and current. To evaluate the effect of the states of the filament feeder on the compressive properties of the 3D-printed samples, all process parameters were kept constant except the pinch force of the filament feeder. Given that the values of CS and CM had similar trends for a given operating state, the GA-BPNN model with the nine chosen features was applied to predict both. The number of hidden neurons was set to 8- after 10-fold cross-validations, and the GA was used to optimize the initial weights and thresholds of the neural network.
Two metrics, the root mean squares error (RMSE) and coefficient of determination (R 2 ), 55 were used to evaluate the performance of the proposed prediction models. The RMSE is used to assess the distance between the predicted results and the measured values, while R2 quantifies the extent of variation of the data around their mean values. 11 The performance of the GA-BPNN model was evaluated against three commonly used methods: the BPNN, support vector regression (SVR), and RF.
The predicted results of CS using the GA-BPNN model are shown in Figure 8a. As shown in the line chart of the CS cells, States 1 and 9 obtained accurate predictions because their features were significantly different from those of the other states. However, States 6, 7, and 8 obtained poor results because they had similar features. The results for the BPNN, SVR, and RF are illustrated in Figure 8b–d, respectively. The estimated values of the RMSE and R2 are shown in Table 5. The GA-BPNN had the smallest RMSE and the highest R2 (closest to one) in both trainings (RSME was 0.045 and R2 was 0.998) and testing (RSME was 0.115 and R2 was 0.992). By comparing the boxplots in Figure 8, it is clear that the predicted CS had a better degree of aggregation when the GA-BPNN model was used.

CS prediction models.
Estimated Values of the RMSE and R2 Using Different Prediction Models
RMSE, the root mean squares error; SVR, support vector regression.
Similarly, the values of the CM predicted by the GA-BPNN, BPNN, SVR, and RF models are shown in Figure 9a–d, respectively. States 6, 7, and 8 obtained poor results because of similar features. The calculated values of the RMSE and R2 are depicted in Table 6, from which it is clear that the GA-BPNN had the smallest RMSE and the highest R2 in both trainings (RSME was 0.136 and R2 was 0.994) and testing (RSME was 0.268 and R2 was 0.976). By comparing the boxplots in Figure 9, it is evident that the predicted CM had the highest degree of aggregation using the GA-BPNN model.

CM prediction models.
Estimated Values of the RMSE and R2 Using Different Prediction Models
RMSE, the root mean squares error.
The results illustrate that machine learning models that use the vibration and current signals during the FFF process can accurately predict the compressive properties of 3D-printed samples. The vibration and current sensing data collected from the filament feeder were used to accurately forecast the compressive properties of the fabricated samples during the FFF process, which indicates that the operating states of the filament feeder significantly affected the compressive properties of the fabricated samples. Besides, the GA-BPNN model optimized by k-CV outperformed the other three models in terms of predicting compressive properties. The cost of the sensors and the data acquisition equipment used here is about USD 5500, which means that the proposed method gets a satisfactory result with a relatively low cost.
In addition, the proposed methodology in this article could be also applied to other mechanical property predictions for FFF-type 3D printing, such as tensile property and bending performance. Other thermoplastics with excellent mechanical properties, such as polyether ether ketone (PEEK), are applied in this work. PEEK is considered one of the promising candidate 3D-printed materials for International Space Station. 17 For the desired quality of 3D-printed part and partial application on board, a large amount of work is needed to optimize the printing parameters and operating states. Other sensors, such as thermocouples, will be used for in situ monitoring of the 3D printing process and saving time for distinguishing the abnormal operation. Therefore, future work would focus on some other mechanical performance predictions and other thermoplastics with excellent mechanical property experiments.
Conclusions
The relationship between the operating states of the filament feeder and the mechanical properties of the fabricated parts during the FFF process was studied in this article, and we found that the former significantly affects the latter. To monitor the states of the filament feeder and predict the compressive properties of the 3D-printed samples, signals of the vibration and current of the filament feeder during the FFF process were used, a set of features in the time and frequency domains were extracted and selected from raw sensing data, and a machine learning method called the GA-BPNN model was proposed for recognizing filament feeder states and predicting CS and CM in the FFF process. The key findings of the experiments can be summarized as follows:
The operating states of the filament feeder significantly affected the compressive properties of the fabricated samples. When the pinch force of the filament feeder was between 49.8 and 75.4 N, the fabricated samples have relatively good CS and CM. Once the pinch force is insufficient or excessive, the amount of feeding filament would be less than expected, which leads to poor CS and CM. This can be used to guide the design of FFF machines.
Vibration and current data can be used to represent the states of the filament feeder. The features extracted and selected from the raw sensing data can significantly reduce the volume of data that need to be calculated.
In terms of the recognition operating states of the filament feeder, the GA-BPNN model achieved a higher recognition rate (96.3%) than the BPNN, SVM, and RF models, and outperformed them in predicting the compressive properties of the manufactured sample.
The relational model between the filament feeder states and the compressive property, the recognizing model for the filament feeder states, and the predicting model for 3D-printed compressive property had been formulated in this article, which could be used in industrial applications with a low cost and a high profit.
Footnotes
Author Disclosure Statement
No competing financial interests exist.
Funding Information
This project is supported by the National Natural Science Foundation of China (Grant No. 52005480), the Youth Innovation Promotion Association of Chinese Academy of Science (2020169), and the Strategic Priority Research Program, CAS, Grant No. XDA22010101.
References
Supplementary Material
Please find the following supplemental material available below.
For Open Access articles published under a Creative Commons License, all supplemental material carries the same license as the article it is associated with.
For non-Open Access articles published, all supplemental material carries a non-exclusive license, and permission requests for re-use of supplemental material or any part of supplemental material shall be sent directly to the copyright owner as specified in the copyright notice associated with the article.