
Abstract
Invar 36 exhibits extremely low thermal expansion coefficients at low temperatures but also low yield strength (YS), which greatly restricts its application as a structural material. In this study, a small fraction of pure titanium powder particles was added into Invar 36 by powder mixing and selective laser melting (SLM) with the aim of further improving tensile strengths of Invar 36. It was found that increased laser power led to increased grain size and to slight decrease in YS in Invar 36. During SLM, amorphous SiO2 nanoparticles were formed and homogeneously distributed in Invar 36. With the addition of 2 at% Ti powder particles, grains became larger and the crystallographic texture along <001> and <111> increased to some extent. Moreover, the bottom of solidified melt pools was segregated with Ti while the matrix was homogeneously decorated by a great number of nano-sized spherical Ti2O3 particles. These particles were found to have effectively impeded dislocation motion during plastic deformation, leading to significant improvement in 0.2% YS and ultimate tensile strength. The above precipitation led to consumption of a small amount of Ni from the matrix, which caused a minor compromise in thermal expansion properties. Nonetheless, the newly synthesized Invar 36-Ti alloy still exhibits low thermal expansion coefficients at low temperatures and remarkably enhanced tensile strengths.

Introduction
Owing to its extremely low coefficient of thermal expansion (CTE) below its Curie temperature (230°C),1–3 Invar 36 (Fe-36 wt% Ni) has demonstrated high thermal and dimensional stability at low temperatures and thus has been widely used in many high-precision components, including clock parts, liquefied natural gas storage tanks, gyroscopes, satellite remote sensing equipment, etc. However, its low hardness and strengths hinder its application as a key structural material. For example, conventionally manufactured (cast+wrought+annealed) Invar 36 usually demonstrates a 0.2% yield strength (YS) of only 230–350 MPa and ultimate tensile strength (UTS) of 400–500 MPa.4,5 Recently, additive manufacturing (AM) techniques have been used to process Invar 36. Qiu et al. 6 first investigated the defect and microstructural evolution of Invar 36 during selective laser melting (SLM) and found that at a high laser power (400 W), the porosity level increased steadily with increased laser scanning speed. They found that the as-fabricated samples were dominated by fan-like columnar grains and showed mechanical anisotropy.
Similar fan-like columnar grain structure was observed in Wegener et al.'s work on SLM-processed Invar 36. 7 Yakout et al. 8 further investigated the influence of energy density on porosity and mechanical properties of Invar 36 and found that the density of the as-fabricated samples increased with increased energy density first and reached the highest at 100 J/mm3. The density then decreased with further increased energy density. Similarly, the YS and UTS increased first with increased energy density and reached the highest at around 50 J/mm3, and then decreased with further increased energy density. Wei et al., 9 however, demonstrated that both YS and UTS increased continuously with increased energy density in the range of 23–200 J/mm3. Zhan et al. 10 and Li et al. 11 investigated the cell structures in laser-processed Invar 36 and found that each grain is composed of a cluster of cells oriented in the same direction. Pronounced mechanical property anisotropy was also observed in Li et al.'s work. 11 Despite mechanical anisotropy of the AM-processed Invar 36, they generally exhibit a YS of 330–400 MPa, which is 50–100 MPa higher than the conventionally manufactured counterpart, thanks to the development of a high density of nano-sized cell structures.
At the same time, the CTE of the AM-processed Invar 36 (1–2 × 10⁻⁶ K−1 below 200°C) was found to be comparable to the conventionally manufactured counterpart.6,12–15 Moreover, AM, due to its unique processing characteristics, provides additional benefits to manufacturing of Invar 36, that is, near-net-shape manufacturing of complex Invar 36 components becomes possible, which would definitely help expand its application. However, to be noted, the strengths of Invar 36 produced either by the conventional method or the AM route tend to be too low for a structural material. Conventionally, microalloying has been employed as a strategy to further improve the strengths of Invar 36. For example, a number of researchers added C, V, Mo, and Cr into Invar 36 through conventional melting, casting, and forging/rolling, which combined with proper heat treatments, have led to in-situ formation of carbides or carbonitrides, such as VC, TiC, V(C, N), and Ti(C, N) that remarkably enhanced YS and UTS.16–18
Other metallic elements such as Be, Ti, Al, and Sn were also added into Invar 36 to develop intermetallic compounds, such as Ni3Be and Ni3(Ti, Al), through the conventional manufacturing method and heat treatments to strengthen Invar 36.19–21 Nonetheless, the microalloying approach has caused more or less increase in the thermal expansion coefficient.16–19 Reports on microalloying for Invar 36 through AM are limited. Liu and colleagues 22 recently added TiAl alloy particles into Invar 36 through SLM to find that a high density of nano-sized γ-TiAl and Al2O3 have been formed and homogeneously distributed in the as-fabricated samples. These precipitates effectively impeded dislocation motion during deformation and thus considerably enhanced YS and UTS. At the same time, excellent ductility and low CTE were maintained. Nonetheless, segregation of Ti and Al was observed at the bottom of each melt pool, which even led to the formation of TiNi phase. Cracks were found to preferentially initiate at these chemically segregated bottom regions and resulted in a certain reduction in ductility.
In this study, we propose to add Ti into Invar 36 by SLM to comprehensively enhance strengths of Invar 36. Given that Ti has strong affinity to Ni and may react with Ni from Invar 36 to form Ni3Ti precipitates during solidification, which could potentially strengthen the material, 2 at% (or 1.68 wt%) micron-sized pure Ti powders will be mixed with Invar 36 powder particles, followed by SLM processing under different conditions. The influence of the addition and processing condition on microstructure, mechanical and thermal expansion properties, as well as the deformation and fracture mechanisms will be thoroughly investigated.
Materials and Methods
Argon-atomized Invar 36 and pure Ti powders both having a particle size range of 15–53 μm were used in the present study. Two at% Ti powders were mixed with 98 at% Invar 36 powders (referred to as Invar 36-Ti hereinafter) in an argon atmosphere using a 3D swing powder mixer at a rotation speed of 28 rpm for 6 h. The chemical composition of the Invar 36 powder is listed in Table 1. The powder particle morphology and distribution were investigated by using scanning electron microscopy (SEM). Both Invar 36 powder and the mixed Invar 36-Ti powders were then processed, respectively, under a modulated pulsed laser mode using a Renishaw AM 400 system which has an ytterbium fiber laser and a beam diameter of 70 μm. Samples with dimensions of 60 × 10 × 12 mm3 (Fig. 1a, b) were fabricated in argon atmosphere for microstructural characterization and tensile testing. A Meander scanning strategy was used for hatch scanning on each layer. 23 After each layer's building, the scanning direction was rotated by 67°. Samples were fabricated with different powder layer thicknesses and laser powers. The detailed processing parameters are listed in Table 2. The energy density (E) is defined as follows:

Chemical Composition of Gas-Atomized Invar 36 Alloy Powder (in wt%)
Selective Laser Melting Processing Conditions Used in the Current Study
where P refers to laser power, t refers to exposure time, dh refers to hatch distance, dp is the point distance, and l is the powder layer thickness. Assembly of several key processing parameters, such as laser power–exposure duration–powder layer thickness (P–t–l) will be used to represent a processing condition for short hereinafter.
Metallographic specimens were prepared and subjected to optical microscopy (OM) examination to investigate porosity. The area fractions of porosity (Af) in these samples were quantified using ImageJ software. Some of the as-polished samples were examined using electron backscattered diffraction (EBSD) to understand the texture development. The samples were then etched in a solution containing 35 mL distilled water, 25 mL HNO3, and 40 mL HCl for microstructural observations using OM and SEM. A Leica DM4000 OM machine and a Zeiss SUPRA55 SEM machine, which was fitted with an energy-dispersive X-ray spectroscopy (EDS) detector and an EBSD detector were used for the microstructural characterization. Some of the as-fabricated samples were also subjected to transmission electron microscopy (TEM) examination.
Disc specimens with 3 mm in diameter were machined and ground into a thickness of 80–120 μm using the 1200 grit silicon carbide paper and then electropolished to perforation using a twin-jet electropolisher (RL-1). A polishing solution containing 5% perchloric acid and 95% ethanol was used to electropolish the samples. The TEM experiments were conducted at an accelerating voltage of 200 kV using an FEI TecnaiG20 FEG TEM microscope, which was fitted with an Oxford EDS detector. TEM diffraction patterns obtained were then analyzed using Gatan Digital Micrograph software to obtain key crystallographic information to identify phases.
Tensile tests have been conducted to evaluate the mechanical properties of the as-fabricated samples. Before tensile testing, the horizontally built elongated samples were machined into cylindrical specimens with a gauge length of 23 mm and a reduced cross-section diameter of 4 mm (Fig. 1c). The tensile tests were conducted using a Zwick/Roell Z100 universal material testing machine at room temperature under strain rate control at 5 × 10⁻⁴ s−1 until failure. The fracture surfaces of the tested pieces were examined using SEM. TEM examination was also performed on some tensile-tested specimens to investigate their deformation mechanisms. Some of the as-built samples were machined into cylindrical specimens with a diameter of 8 mm and a length of 25 mm and then subjected to thermal expansion property measurement using a DIL-402SU thermal dilatometer. The testing temperature ranged from 25°C to 500°C with a heating rate of 5°C/s.
Results
Powder characterization and porosity development
Figure 2 shows the particle distribution of the as-received Invar 36 and Ti powders and their mixture. It is clear that the argon-atomized Invar 36 and Ti powder particles are all spherical or near spherical. The large particles are attached with some small satellite particles. The Ti powder particles seem to fall in a relatively larger size range as compared with the Invar 36 powder particles. After mixing, the particle distribution is quite homogeneous. EDS mapping analysis on the mixed powder particles indicates that the additive Ti particles have been homogeneously distributed among the Invar 36 alloy powder particles. This is crucial for development of both chemical and microstructural homogeneity in the SLM-processed samples.
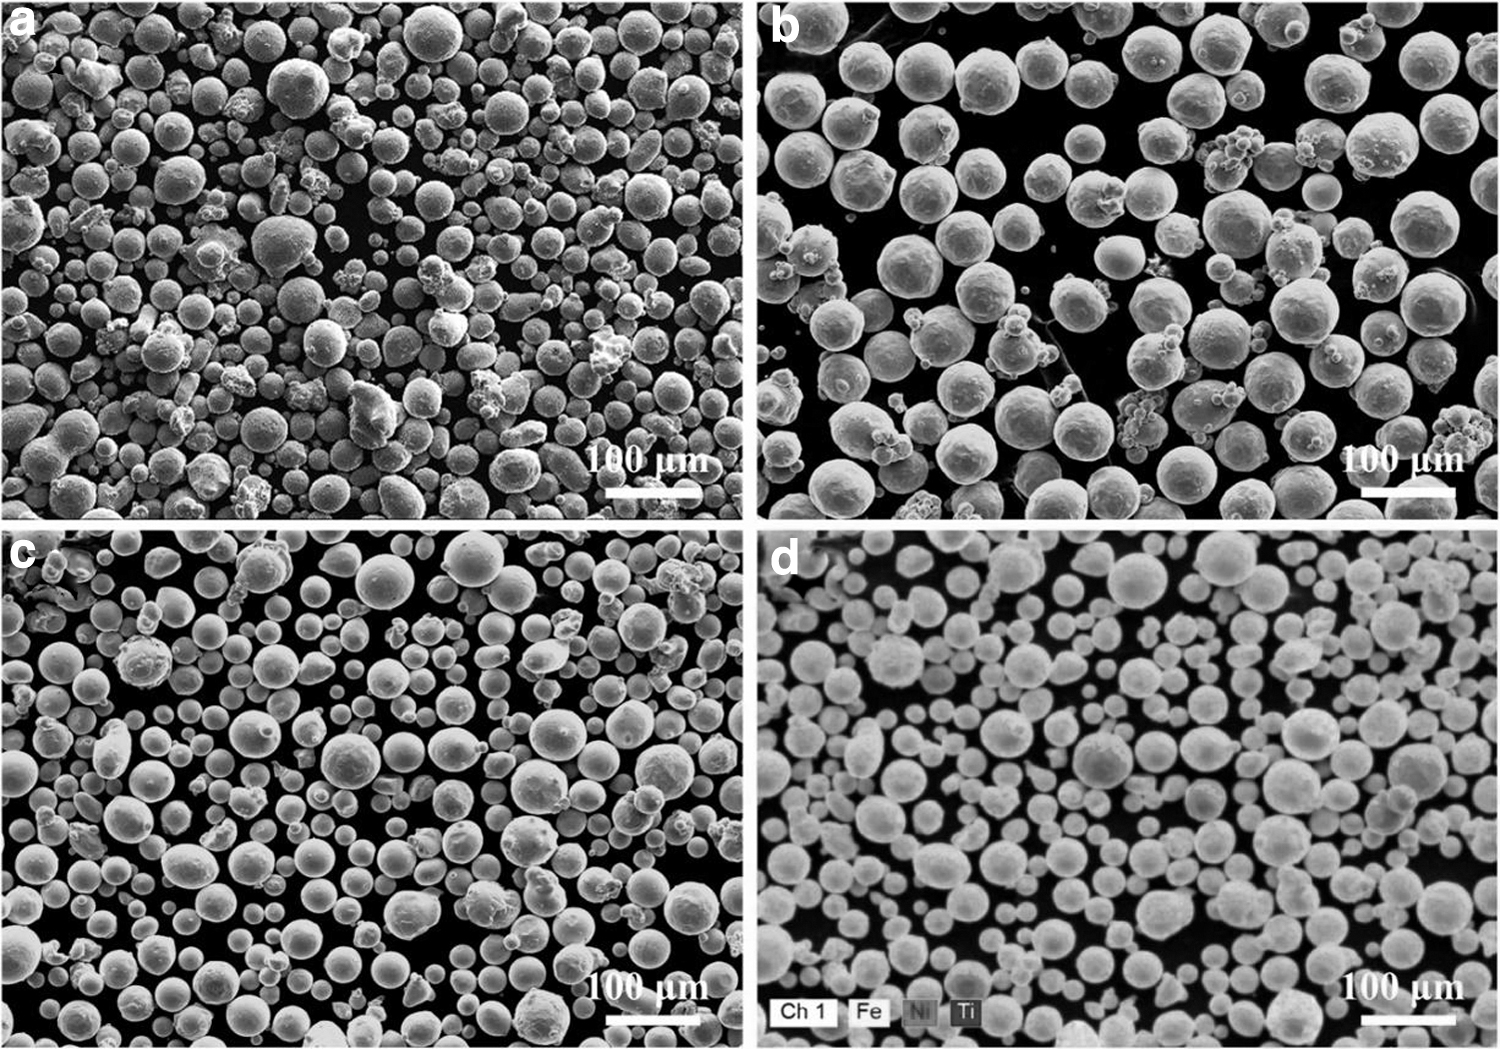
SEM micrographs of
According to previous studies,6,8 when porosity level in SLM-processed Invar 36 was beyond 0.7%, their tensile properties would be considerably compromised. As such, parametric studies have been conducted to control porosity level below 0.5% so that their influence on mechanical properties can be ignored. Figure 3 shows the porosity distribution of the SLM-processed Invar 36 and Invar 36-Ti samples, which were fabricated with different processing parameters. It can be seen that all the Invar 36 samples show a highly dense structure when laser power is between 250 and 400 W (Fig. 3a–c). Despite the fact that the sample made at 400 W shows the highest level of pores among the investigated Invar 36 samples, its porosity area fraction is only 0.5%, indicating good structural integrity in the SLM-processed Invar 36 samples. With the addition of Ti particles, the porosity level increased remarkably under the same processing conditions (Af > 1%), as shown in Figure 2d–f.

OM micrographs showing the porosity distribution within the SLM-processed
High magnification OM micrograph (Fig. 4) reveals that the samples contain a number of horizontal elongated pores, which usually correspond to lack-of-fusion pores, suggesting that the energy densities may not be sufficient for melting and consolidating the Invar 36-Ti powders. To decrease porosity, the powder layer thickness was reduced from 50 to 30 μm while the other processing parameters were maintained the same. This directly results in a significant reduction in porosity. Af for all the Invar 36-Ti samples made with 30 μm are below 0.1% (Fig. 3g–h). In these samples, only a small number of spherical pores can be observed (Figs. 3g, h and 4). With increased energy density, the porosity level shows a general decreasing trend as demonstrated in Figure 4.
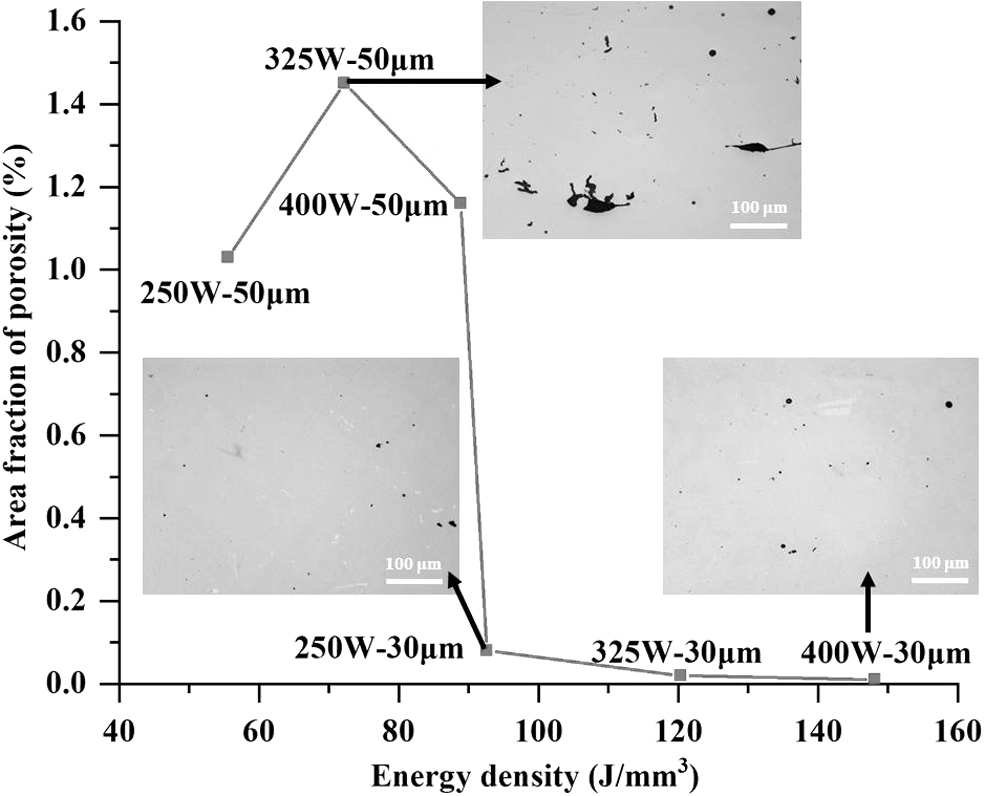
Dependence of porosity level in the as-printed Invar 36-Ti samples on input energy density.
Microstructural evolution
Based on the above investigation, several samples with low porosity were selected for detailed microstructural investigation. Figures 5 and 6 show the microstructural evolution in the as-fabricated Invar 36 and Invar 36-Ti samples made under different processing conditions. It is obvious that the Invar 36 samples are dominated by columnar grains, which grow epitaxially and extend through several deposited layers, changing from dispersive fine grains to large coarse ones with increased laser power, as shown in Figures 5a, b, and 6a. With the addition of Ti, however, the columnar grains disappear and transform into near-equiaxed grains (Figs. 5c, d, and 6b). The grains become relatively shorter but much chunkier (Fig. 6a, b). The grain sizes (equivalent diameters) remain almost the same with and without the Ti addition (Fig. 6e). The texture along the <001> and <111> directions was slightly intensified by the addition of Ti as evidenced by the increased maximum multiple of the uniform distribution values. This is underpinned by the observation that the Invar 36-Ti sample shows a higher fraction of grain boundaries with low misorientation angles as compared with the SLM-processed Invar 36 sample (Fig. 6f).

OM micrographs showing grain structures in the as-printed Invar 36 samples made at

EBSD IPF color maps and pole figures showing the grain structure and texture in
Decreased powder layer thickness does not seem to cause significant change in grain size and morphology in the Invar 36-Ti samples, as shown in Figure 5c and d. Based on the measurement of grain sizes, the average grain widths in the samples made with 250 W–60 μs–50 μm and 250 W–60 μs–30 μm are 26 and 24 μm, respectively, which are literally very close. Moreover, it is noted that there are a considerable number of dark arc-shaped regions located at the bottom of solidified melt pools in the Invar 36-Ti samples (Fig. 5c, d). These dark elongated features, which were found to be segregated with Ti (Fig. 7), seem to have effectively interrupted the epitaxial grain growth of the Invar 36-Ti samples (Fig. 5c, d).

SEM micrograph and EDS mapping results showing the detailed microstructural features and chemical distribution at the bottom region of a solidified melt pool in the Invar 36-Ti sample made at 250 W–60 μs–30 μm.
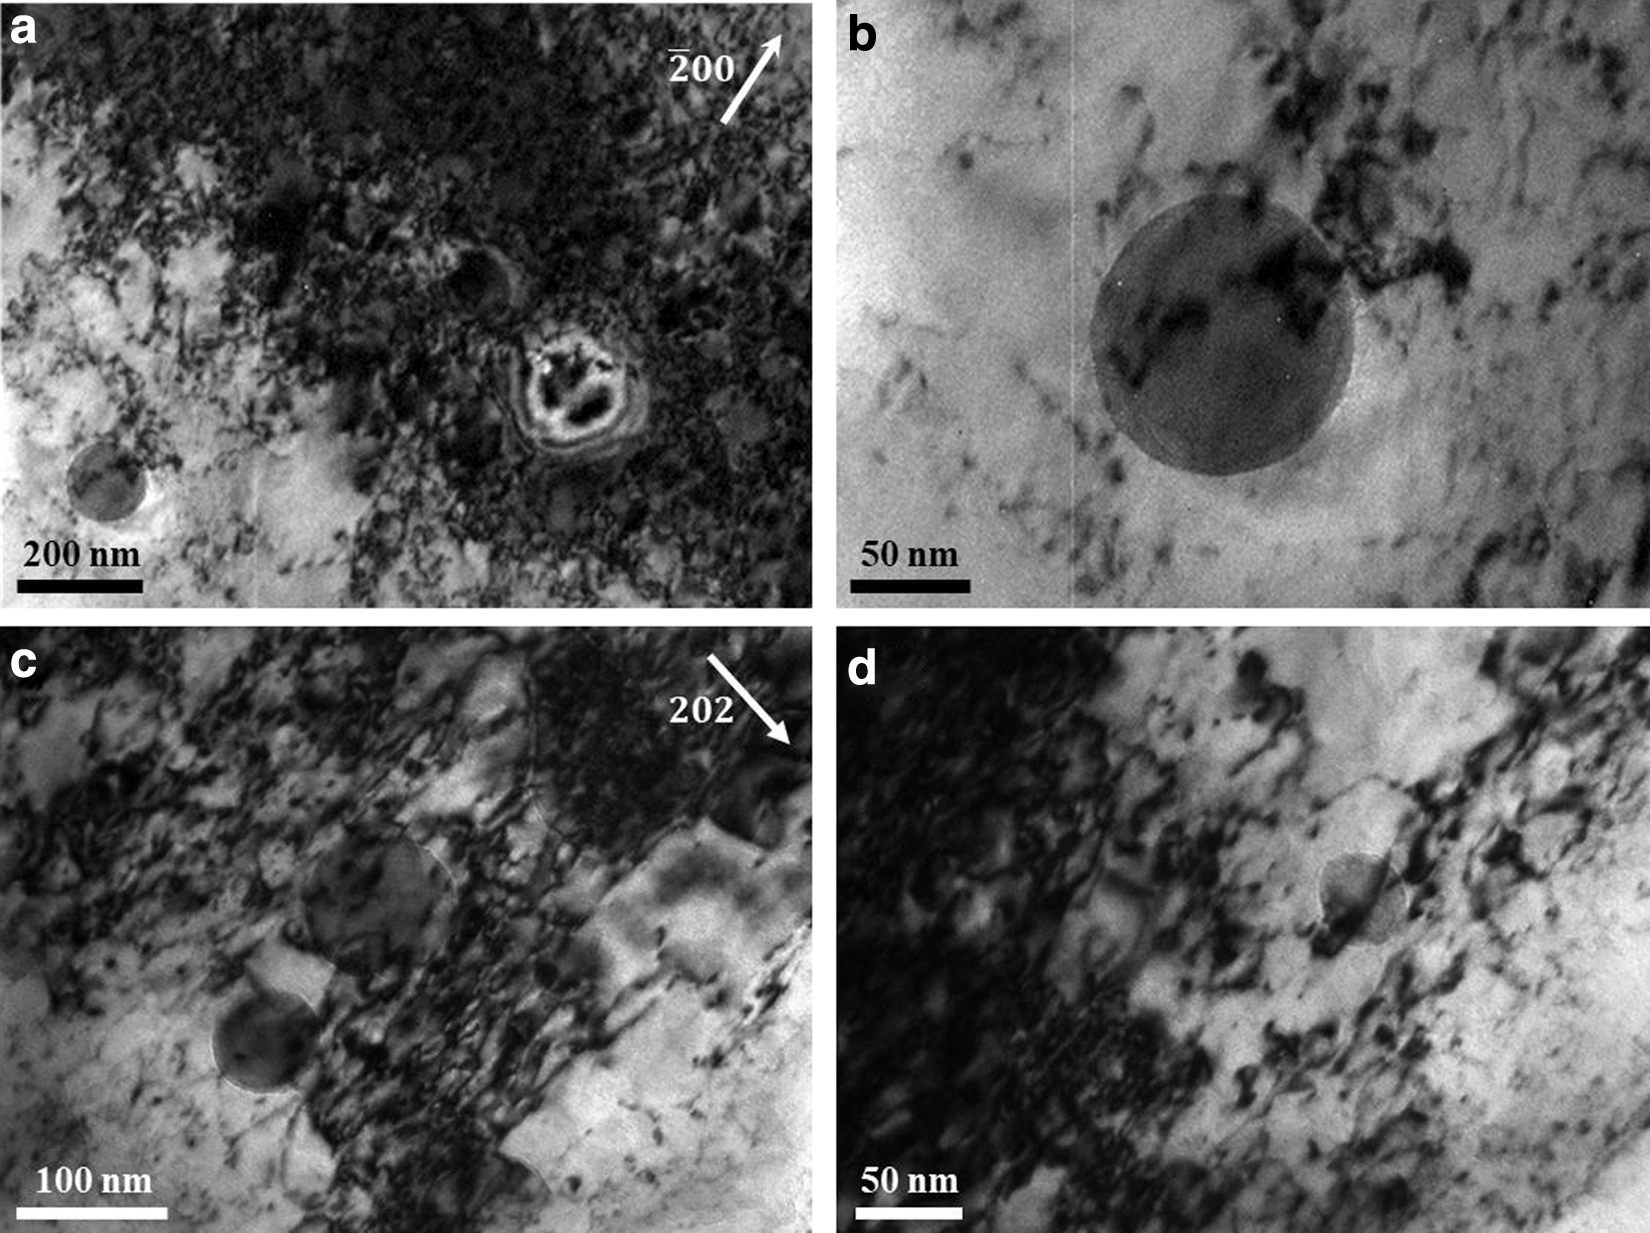
To further understand the microstructural development in the SLM-processed Invar 36 and Invar 36-Ti samples, TEM was further used to investigate the detailed microstructure. The results are shown in Figure 8. It is clear that the as-fabricated Invar 36 sample contains a number of spherical particles, which were found to be enriched in Si and O as evidenced by the TEM-EDS analysis result as shown in Table 3. Diffraction patterns from these particles show pronounced diffuse halo rings (Fig. 8b), which indicates that these particles are amorphous SiO2 phase. Similarly, the as-built Invar 36-Ti sample also shows numerous precipitates (Fig. 8c). Indexing on diffraction patterns from these particles indicates that they are tetragonal Ti2O3 particles (Fig. 8d). To be noted, with the addition of Ti, no SiO2 particles can be observed in the samples. It seems that Ti has been more competitive in attracting O in the alloy than Si during SLM processing. The Ti2O3 particles generally show relatively larger sizes and a higher area fraction in the matrix as compared with the SiO2 particles (Fig. 8a, c).
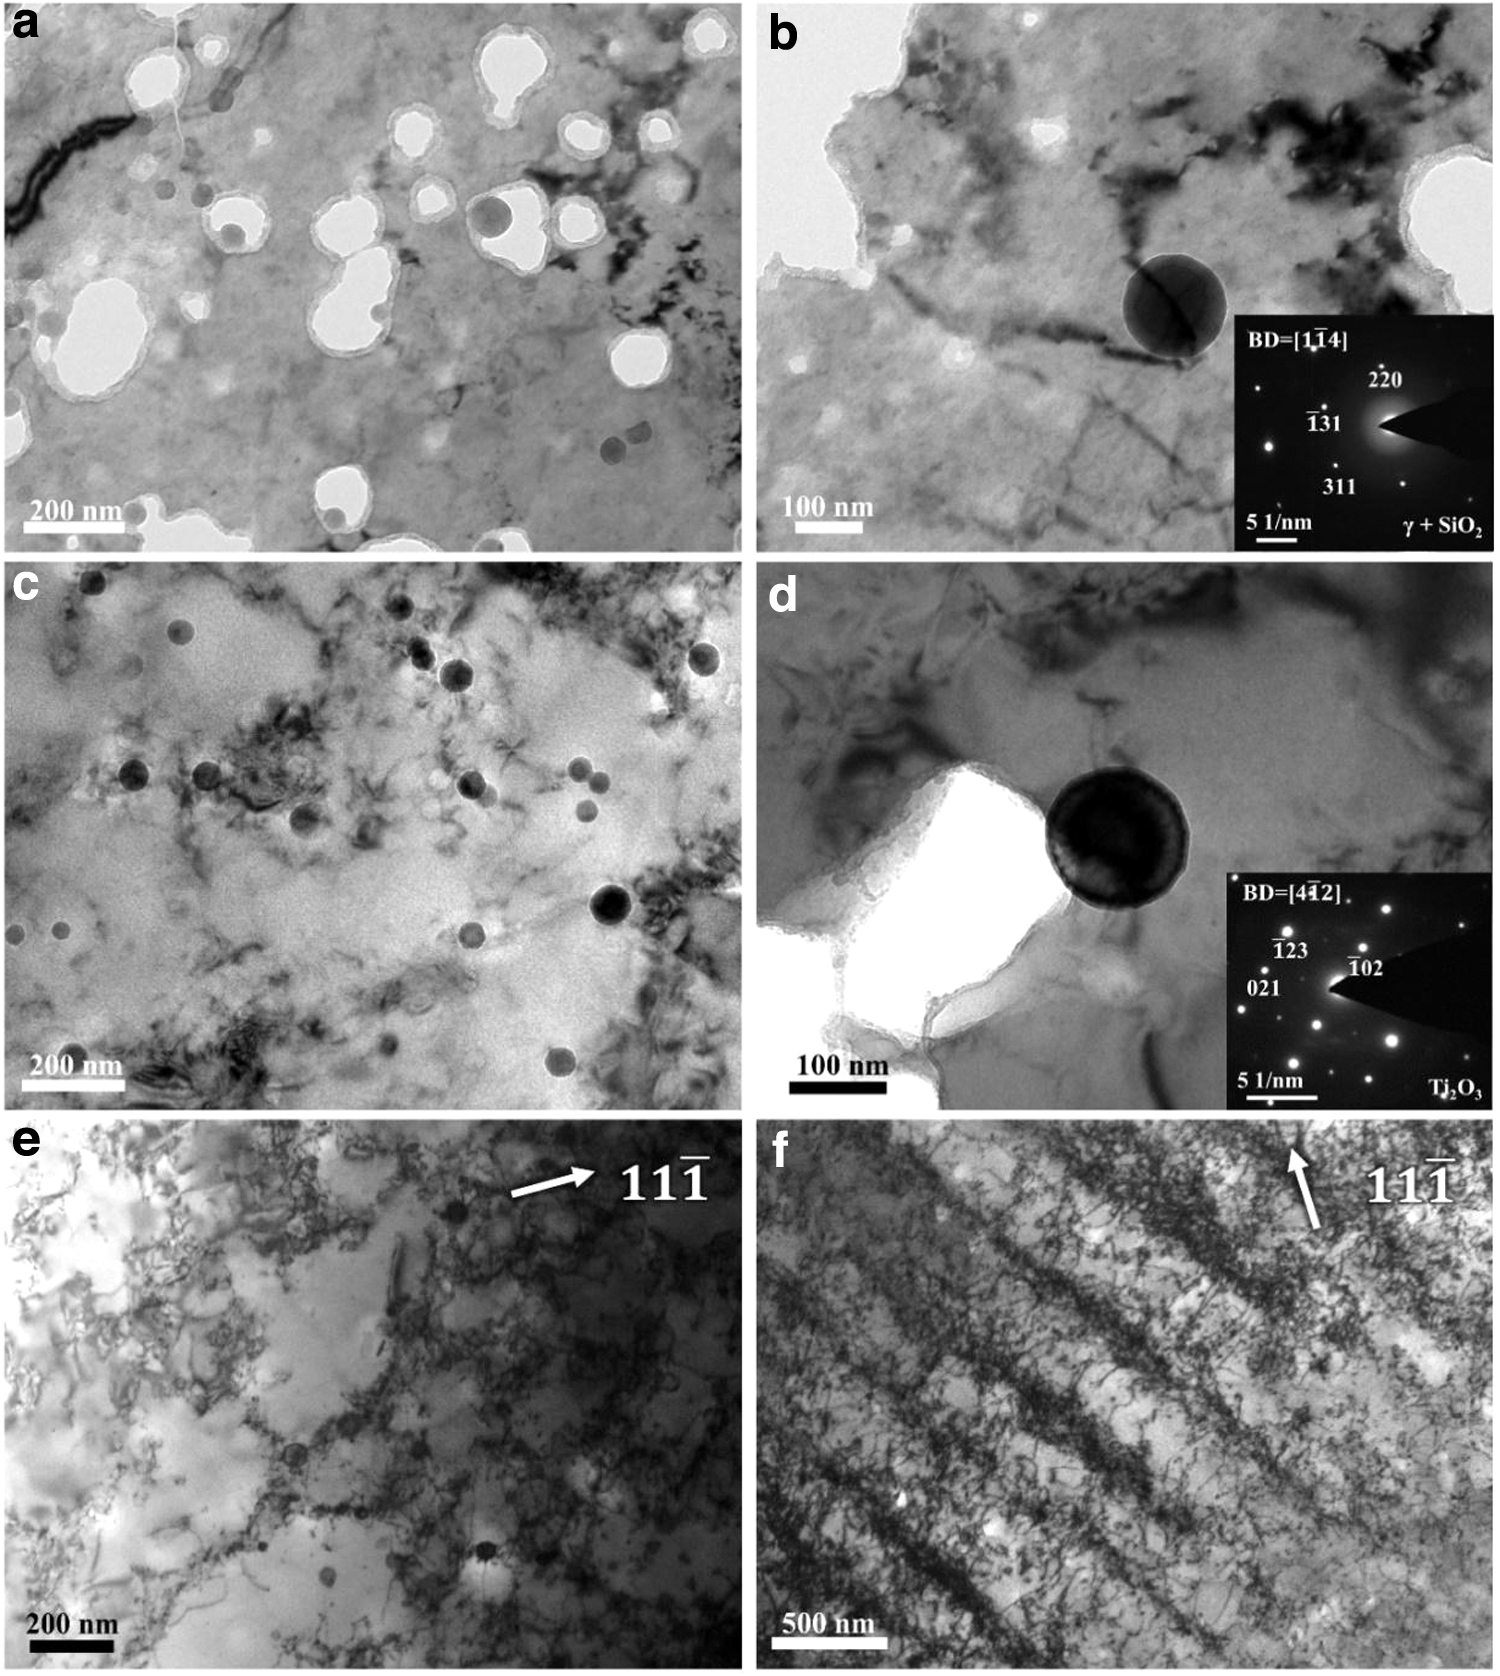
BF TEM micrographs showing distribution of spherical precipitates in
Transmission Electron Microscopy-EDS Analysis Results on the Precipitates and Matrix Areas in the Selective Laser Melting-Processed Invar 36 and Invar 36-Ti Samples (in wt%).
EDS, energy dispersive X-ray spectroscopy.
Quantitative measurement and statistics reveal that the former have a mean diameter of 48 nm while the latter have an average diameter of only 30 nm. The former account for around 3.4% in area fraction in the Invar 36-Ti sample while the latter only account for 1.3% in the Invar 36 sample. This could be due to the fact that Ti was added in a much higher content as compared with the inherent Si content in the Invar 36 powder (Table 1), so that it would supply sufficient Ti solute for nucleation and growth of Ti2O3 particles. TEM-EDS analysis on some of the Ti2O3 particles (Table 3) reveals that the precipitates are enriched in Ti and O but also contain small amount of Fe and Ni. Meanwhile, the γ matrix is shown to contain a certain content of Ti. The Ni content in the matrix, however, is reduced to 34.5 wt%, which is 0.5 wt% deviant from the composition of the matrix in Invar 36.
This is obviously due to the consumption of a certain Ni from the matrix by forming the Ti2O3 precipitates. This may cause a certain influence on thermal expansion properties given that CTE is highly sensitive to Ni content in the γ matrix.24,25 In addition to precipitates, cellular structures and a high density of dislocations can also be observed in the matrix of both SLM-processed Invar 36 and Invar 36-Ti samples (Fig. 8e, f).
Tensile behavior
Figure 9 displays the tensile engineering stress–strain curves of the SLM-processed Invar 36 and Invar 36-Ti samples, which were fabricated under different processing conditions. The former shows 0.2% YS of 357–383 MPa and UTS of 440–458 MPa and elongation (EL) of 28–38%. The YS is slightly better than the conventionally manufactured Invar 36, which usually has a YS of 230–350 MPa.4,5 Decreasing laser power from 400 to 250 W leads to an improvement of 30 MPa in YS, which could be mainly attributed to the decreased grain size. Addition of 2 at% Ti is shown to significantly enhance both YS and UTS. Improvement of 70–130 MPa in YS and around 100 MPa improvement in UTS have been achieved in the Invar 36-Ti samples in comparison with the Ti-free Invar 36 samples.
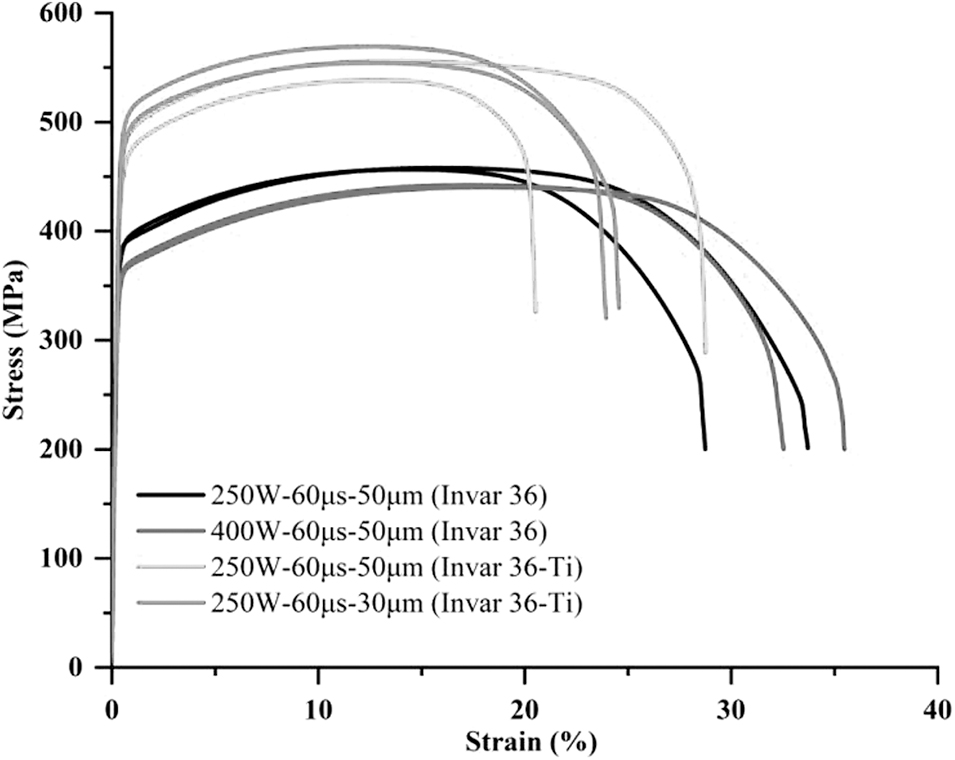
Tensile engineering stress–strain curves of Invar 36 and Invar 36-Ti samples made under different processing conditions.
Even though the EL was decreased to some extent by the addition of Ti, the Invar 36-Ti samples still retain an excellent ductility (EL >20%). To be noted, one of the Invar 36-Ti samples made at 250 W–60 μs–30 μm shows an EL of 20% while the other one shows an EL of 29%, indicating a scatter in EL in the samples made under this condition. Decreasing powder layer thickness from 50 to 30 μm witnesses a minor increase in YS and UTS but does not significantly change the strengths.
Figure 10 shows the tensile fracture surfaces of the investigated Invar 36 and Invar 36-Ti samples made under different processing conditions. The as-fabricated Invar 36 samples all show rough fracture surfaces with some near-spherical open pores (Fig. 10a–f). Among these pores, some are inherent pores of the samples while the rest were caused by pulling out of materials during fracturing. The matrix areas are characterized by numerous fine dimples (Fig. 10c, f), indicating these samples are fairly ductile, which is consistent with the tensile testing results.

SEM micrographs showing the fracture surfaces of the tensile-tested Invar 36 specimens fabricated at
Despite a reduction in EL with the addition of 2 at% Ti, all the as-built Invar 36-Ti samples failed in a fairly ductile mode as evidenced by the presence of numerous dimples on their fracture surfaces (Fig. 10g–l). For the Invar 36-Ti samples made at 250 W–60 μs–50 μm, which show a pronounced scatter in EL, fractography study reveals that the fracture surface of the sample with higher EL is dominated by ductile dimples, whereas the sample with lower EL shows several secondary cracks that are associated with lack-of-fusion pores as shown in Figure 11c and d. As such, it is obvious that lack-of-fusion pores are particularly harmful for EL, which is consistent with a number of previous studies.6,26

SEM micrographs showing the fracture surfaces of the Invar 36-Ti tensile-tested specimens made at 250 W–60 μs–50 μm with different ELs,
To understand the deformation mechanism of the current SLM-processed Invar 36 and Invar 36-Ti samples, TEM examination has been performed on the tensile-tested pieces. The results are shown in Figure 12. It is clear that the matrix of the two samples deformed mainly by dislocation slipping as evidenced by the presence of a high density of dislocations. Dislocations were found to have cut into the spherical oxide particles but not cut through. As a result, the precipitates (either SiO2 or Ti2O3 particles) have complex entanglement with dislocations. This suggests that the nano-sized oxide particles have acted as effective dislocation motion barriers, which could be beneficial for the strengths of the Invar alloy.
BF TEM micrographs showing interactions between precipitates and dislocations in
Thermal expansion properties
Figure 13a shows the thermal expansion behavior of the SLM-processed Invar 36 and Invar 36-Ti samples in the temperature range of 25–500°C. It can be seen that all the samples exhibit fairly low displacements below 200°C, but the thermal displacement increases dramatically when the temperature is above 200°C. The Invar 36-Ti samples tend to show slightly higher thermal displacement than the Invar 36 but they literally have displacement levels of the same order of magnitude below 150°C. Moreover, below 150°C, the sample displacement constitutes nearly a linear relationship with temperature. As such, by fitting the displacement curves between 100°C and 150°C, the CTE of these samples in this temperature range, which are equal to the slopes, can be obtained. According to Figure 13b, the current SLM-processed Invar 36 samples show a CTE of 1.0–1.2 × 10⁻⁶ K−1, which is consistent with previous reports on the CTE of SLM-processed Invar 366,12–15 and comparable to that of the conventionally manufactured Invar 36 (Table 4). 27
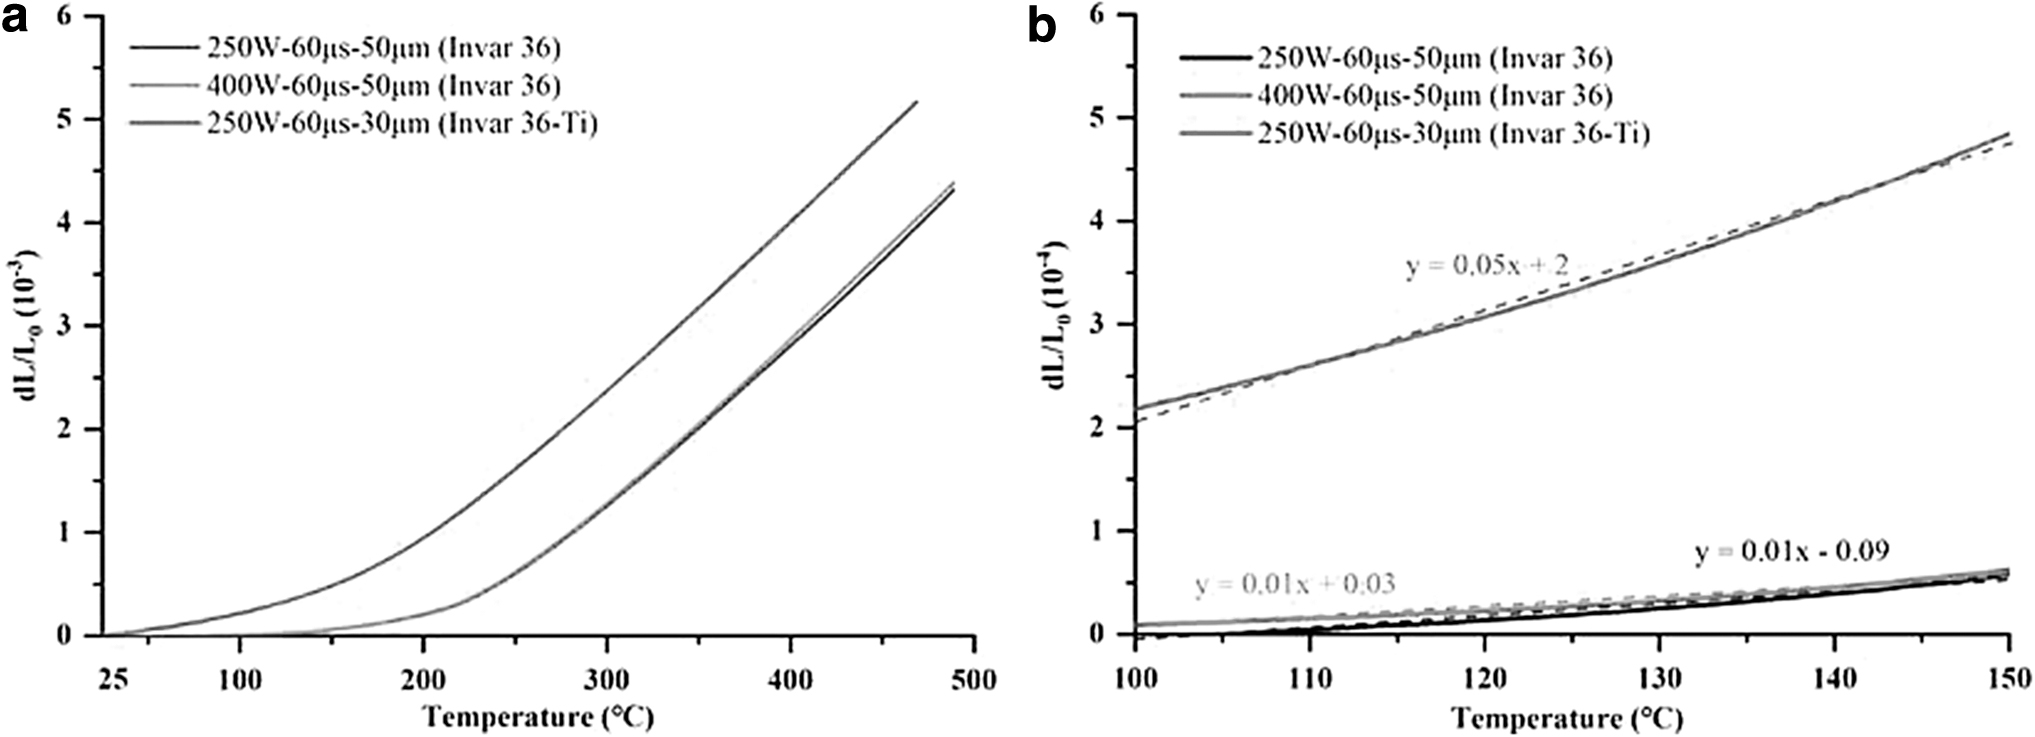
Thermal expansion measurement results of the as-printed Invar 36 and Invar 36-Ti samples made under different conditions.
Mean Coefficient of Thermal Expansion of the Current Selective Laser Melting-Processed Invar 36 and Invar 36-1.5TiAl Samples in Comparison with Those of Other Materials in the Temperature Range of 20–200°C
CM stands for the conventional manufacturing method, which usually involves casting, thermomechanical processing, and annealing.
CTE, coefficient of thermal expansion; SLM, selective laser melting.
By contrast, the Invar 36-Ti samples show a CTE of 5.0 × 10⁻⁶ K−1, that is, the addition of Ti has caused a certain increase in CTE but kept the same order of magnitude as the sample without the addition. Despite a certain increase in CTE, the current Invar 36-Ti samples still show a much lower CTE than many other structural materials (Table 4).4,15,27 This indicates that a new Invar alloy with significantly enhanced strengths and low CTE has been developed. According to the figure, increasing laser power from 250 to 400 W makes no great difference in either thermal displacement or CTE, suggesting that grain structure does not affect the thermal expansion properties greatly.
Discussion
Influence of Ti addition on the microstructural development in SLM-processed Invar 36 alloy
The current experimental results demonstrate that a high density of SiO2 nanoparticles have been formed in the SLM-processed Invar 36 samples. This could be due to the fact that the gas-atomized powder particles contain more or less O, which could easily interact with strong oxide-forming elements in small melt pools during SLM to form oxide particles in the subsequent solidification. Si, which has the strongest affinity to oxygen among the alloying elements in the Invar 36 powder particles, would have priority to form SiO2 particles. Given the high melting point of SiO2 (1723°C), which is remarkably higher than that of Invar 36 (1430°C), the formation of SiO2 particles should have occurred at a very early stage of solidification. There was also a decent undercooling range (0–293°C) for SiO2 to form from the liquid. With the addition of Ti into Invar 36 through SLM, the formation of SiO2 particles seems to have been significantly suppressed given the fact that no SiO2 nanoparticle was observed in the Invar 36-Ti sample any more. Instead, a significant population of Ti2O3 nanoparticles were formed in the sample.
Ti, which has a higher negative formation energy with O than Si (Ti2O3 and SiO2 have enthalpies of formation of −3.14 and −3.06 eV/atom, respectively 28 ), thus has even higher affinity to O than Si, which may have been favorable for the development of Ti-O atomic clusters and thus Ti2O3 particles during solidification. Moreover, the even higher melting point of Ti2O3 (2130°C) would also allow Ti2O3 to form before SiO2 particles.
Either the SiO2 particles in the Invar 36 samples or the Ti2O3 particles in the Invar 36-Ti samples were found to be present as ultrafine particles and have homogeneously distributed in the matrix, suggesting that they should have formed highly locally. It is highly likely that the rapid cooling and solidification process after SLM has prevented these particles from coalescing or coarsening. Similar phenomena were also observed in previous studies on SLM-processed 316L, where nano-sized oxide particles were also highly dispersedly distributed.29–31 It is highly possible that with rapid cooling and solidification after SLM, atoms with strong affinity could have only been able to diffuse and accumulate within small local domains in each melt pool. Long-range atomic diffusion and chemical redistribution may have been suppressed so that the coarsening and coalescing of small particles have been suppressed.
The present results also demonstrate that the addition of Ti tended to lead to segregation of Ti at the bottom regions of many solidified melt pools (Figs. 5c, d, and 7). This is believed to be associated with the inhomogeneous thermal distribution and melt flow behavior within melt pools during SLM. According to previous studies,32–36 melt pools generated by SLM usually show higher temperatures in the upper regions (probably because of direct exposure to the laser beam) than in the lower regions. The higher temperatures in the upper regions of the melt pools would definitely promote atomic diffusion and chemical homogenization. In contrast, the lower regions of the melt pools, which have relatively lower temperatures, would have more sluggish atomic diffusion that would retard chemical homogenization and thus cause chemical segregation at the bottom of melt pools.
The relatively lower melt flow speeds in the bottom regions of melt pools32,33 would make the situation even worse. Although during SLM processing partial remelting of previous solidified layer may happen, this usually happens in the upper regions of a previous solidified layer. As such, the segregated Ti regions, which were located at the bottom of solidified melt pools, would continue to remain.
With the development of arc-shaped Ti segregation regions at the bottom of melt pools or the interlayer boundaries, the epitaxial grain growth seems to have been effectively suppressed/interrupted and as a result a near-equiaxed grain structure has been developed (Figs. 5c, d, and 6). After SLM, the Ti-enriched bottom regions of melt pools would have solidified first given that they were in direct contact with a previous solidified layer. These newly solidified bottom regions with a unique composition may have acted as new heterogeneous nucleation sites for the formation of equiaxed grains from remnant melts in the pools instead of allowing grains to grow epitaxially from a previous layer. Also, the bottom regions of melt pools were the starting solidification fronts for a new layer. Segregation of Ti in these regions may have enhanced constitutional undercooling in the liquid ahead of the solid/liquid interfaces and thus promoted nucleation and growth of new equiaxed grains.
Influence of Ti addition on the mechanical and thermal expansion properties of SLM-processed Invar 36 alloy
The above experimental results demonstrate that the SLM-processed Invar 36 has already exhibited higher YS than the conventionally manufactured counterpart,4,5 which should be attributed to the numerous nanoscale cell structures, dislocation networks, and homogeneously distributed nanoscale SiO2 particles. Decreased grain size induced by decreasing laser power (from 400 to 250 W) was found to lead to only a marginal increase in YS, indicating that the room for improving tensile strengths by simply changing laser processing conditions is highly limited.
With the addition of Ti, numerous cell structures and high-density dislocations still remain. As such, the considerable improvement in YS in Invar 36 caused by the addition should not be mainly due to the presence of cell structures and pre-existing dislocation structures but instead should be due to development of other new microstructural characteristics such as the Ti2O3 nanoparticles. The Ti2O3 precipitates, which were found to have acted as effective dislocation motion barriers (Fig. 12) should have contributed significantly to the enhanced YS in the current SLM-processed Invar 36-Ti samples. The Ti2O3 particles were found to show relatively larger diameters and a higher volume fraction than the SiO2 in the Invar 36 samples. This may make Ti2O3 particles more effective in strengthening the Invar 36-Ti samples.
Moreover, the partial dissolution of Ti in the γ matrix, as demonstrated by TEM-EDS analysis (Table 3), should have given rise to solid solution strengthening. Given that grain sizes did not decrease with the addition of Ti, there should not be pronounced strengthening contribution from grain size change. As such, the contribution to YS with the addition of Ti should have mainly originated from the following strengthening mechanisms, which can be evaluated using the following equation:
where
where M is Taylor factor, which is 3.06 for face-centered cubic (FCC) materials
38
; G is shear modulus, which is 51.23 GPa for Invar alloys
39
; c is the concentration of solutes in the alloy matrix and equal to 1.8 at% as shown in Table 3; and ɛs is interaction parameter which is defined by
which combines the effects of elastic mismatch ɛG and atomic size mismatch ɛa and
where a is the lattice constant of the γ matrix of Invar alloy, which is 3.591 Å. The modulus change ɛG is usually negligible as compared with ɛa.
40
The parameter ɛa can be obtained from XRD patterns (not shown here), which give rise to a new lattice parameter of 3.577 Å for the γ matrix after the addition of Ti. This results in a
Based on the above experimental observation, dislocations were found not to cut through the observed SiO2 or Ti2O3 particles but tend to loop around them. Thus, Orowan dislocation–looping mechanism is taken as the dominant precipitate strengthening mechanism and its contribution to strength can be expressed as
41
:
where b is the magnitude of Burges vector, which is usually equal to 0.255 for the γ phase in Invar alloys; v is Poisson ratio, which is 0.22 for the γ matrix; λ is the edge-to-edge interparticle spacing
42
;
The above calculation thus gives rise to a ΔσYS of 70 MPa, which is in good agreement with the tensile testing results that show a ΔσYS of 70–130 MPa. After yielding, as plastic deformation proceeded, more dislocations would be impeded by the precipitates and entangled with them, which would be definitely beneficial for strain hardening and tensile strength.
While the addition of Ti was beneficial for strengths due to formation of a higher volume fraction of TiO2 nanoparticles, it also caused a certain degradation in both ductility and thermal expansion properties. The reduction in EL could be due to preferential crack initiation along the Ti-segregated bottom regions of solidified melt pools, which caused earlier failure. In Liu and colleagues' work, 22 Ti- and Al-segregated bottom regions of the solidified melt pools in SLM-processed Invar 36 were found to have acted as preferential crack initiation sites and led to reduction in ductility. The presence of a high density of nano-sized TiO2 particles, which effectively impeded dislocation motion, may have also contributed to the reduction of ductility. The CTE was increased by several times with the addition, although the Invar 36-Ti samples still retain a CTE of the same order of magnitude as the SLM-processed Invar 36 below 150°C (Fig. 13). The laser power, which greatly affects the grain structure in Invar 36 alloy, seems to have almost no influence on the CTE. These indicate that the CTE of Invar alloys are insensitive to microstructure such as grain size and precipitates, which is in good agreement with previous studies.16–21
Minor change in texture level due to the addition of Ti is unlikely to cause pronounced change in CTE, either. What really matters probably is the chemical composition in the matrix. Any remarkable deviation of composition of the matrix from Fe-36 wt% Ni, which is the ideal composition for acquisition of the lowest CTE could be harmful for CTE.24,25 The decrease in Ni level by 0.5 wt% in the γ matrix due to the formation of oxides (Table 3) could have been responsible for the increase in CTE in the present study. The scientific reason behind this is the so-called spontaneous volume magnetostriction effect. 43 When temperature is below the Curie temperature, the spontaneous volume magnetostriction would decrease with increased temperature, causing Invar materials to shrink, 44 which counteracts part of the expansion effect induced by increased temperatures.
The spontaneous volume magnetostriction is generally the largest when the Ni atomic fraction is around 36 wt% in the Fe-Ni alloy system. This would drop dramatically with the change of Ni content.44,45 The deviation of Ni content in the matrix of the present Invar 36-Ti alloy from 36 wt% would inevitably weaken the spontaneous volume magnetostriction effect and cause increase in CTE. Future work will focus on the simultaneous addition of Ti and Ni particles to Invar 36 to enhance tensile strengths while keeping minimum CTE.
Conclusions
Addition of 2 at% pure Ti powder particles into Invar 36 through SLM led to the formation of considerable nano-sized Ti2O3 particles and arc-shaped Ti-segregated regions at the bottom of solidified melt pools.
The high-density Ti2O3 particles, which have acted as effective dislocation motion barriers during deformation, together with solid solution of Ti in the matrix, have led to significant improvement in YS and UTS.
The formation of the oxide particles consumed a certain Ni from the matrix, leading to slight increase in CTE.
The present SLM-processed Invar 36-Ti samples show remarkably enhanced strengths, good ductility, and low CTE at low temperatures, and thus has a promising prospect for structural material application.
Footnotes
Data Availability
The data that support the findings of this study are available from the corresponding author upon request.
Author Disclosure Statement
No competing financial interests exist.
Funding Information
This work was supported by the National Key Research and Development Program of China from the Ministry of Science and Technology of the People's Republic of China (Grant No. 2018YFB0703400, 2018).