
Abstract
Due to their amorphous structure, metallic glasses exhibit remarkable properties such as high strength, hardness, and elastic strain limit. Conversely, they also exhibit high susceptibility to brittle fracture, making them less qualified for the use as monolithic structural components. Therefore, they may be preferably used as the reinforcing phase in hybrid materials combined with ductile matrix materials. Especially metal matrix composites with interpenetrating structures are suitable. This requires an open-porous structure of the metallic glass. In the study at hand, an open-porous lattice structure was manufactured from metallic glass powder (Ni60Nb20Ta20) by laser powder bed fusion. A parameter study was carried out with various scanning strategies to manufacture a mechanically stable lattice structure while maintaining the amorphous structure of the metallic glass. Thus, X-ray diffraction measurements were conducted to validate the parameter study. A stable lattice structure with a largely amorphous structure was successfully achieved with a scanning strategy of single scanned lines and a rotation of 90° for each layer. However, nanocrystallization of 7% occurred in the heat-affected zones formed between the individual printed layers during reheating. Conducting compression tests, a compressive modulus of 18 GPa and a maximum strength of 90 MPa in 0°-direction were achieved. In 90°-direction, no compressive modulus could be determined but compressive strength resulted in 15 MPa. Performing nanoindentation with a Young's modulus of 195.1 GPa and Vickers hardness of HVIT = 956.1 was achieved for the printed bulk metallic glass alloy. The resulting lattice structure was further characterized by differential scanning calorimetry for thermal behavior.
Introduction
Metallic glasses exhibit remarkable properties such as high strength, hardness, and elastic strain limit as well as good wear and excellent corrosion resistance due to their amorphous structure.1–3 Conversely, they feature low ductility and thus are prone to brittle fracture, making them less suitable for use as monolithic structural components. 4 They can rather be used as a reinforcing phase in a hybrid material in combination with a ductile matrix to compensate for brittleness. For this purpose, metal matrix composites (MMC) with interpenetrating structures are particularly suitable.
This requires that the metallic glasses are provided in an open-porous foam structure.5,6 Since the forming of an amorphous structure depends on the glass-forming ability of the alloy and cooling rate, metallic glasses are often produced as ribbons by melt spinning or powder by gas atomization to reach the critical casting thickness.3,7 For further processing, the process temperature must be lower than crystallization temperature to avoid crystallization. To obtain an open-porous metallic glass foam, temporary fillers are used.
In Suo et al, 8 metallic glass powder was mixed with NaCl and CoCl2 and subsequently sintered by hot pressing. The salt was washed out after sintering, and a metallic glass foam with 70% porosity was created. With this method, process temperature must be perfectly adjusted above material specific glass transition temperature and below crystallization temperature. In addition, the complexity of geometry and a control of required pore size as well as porosity are limited.
Additive manufacturing, a common processing technology and recently applied to metallic glasses, in particular laser powder bed fusion (LPBF), can help to overcome these problems. 9 The LPBF has great potential for the production of glassy components with complex geometry and has proven to be an effective method to overcome thickness limitations, which enables manufacturing of large-scale bulk metallic glasses (BMGs) components.9,10 The LPBF is based on a layer-by-layer selective melting of metallic powders on a powder bed by means of a scanning laser beam, whereby a component with a complex three-dimensional geometry can be manufactured based on a CAD model submitted to the printing system.9,11
The advantage is that only small amounts of powder are melted by the laser beam for each scan and therefore, depending on the processing parameters, local heating, and cooling rates of 103–108K/s can be achieved.11,12 These are above the critical cooling rates for glass formation in most BMG alloys (102–104K/s), which enables the formation of an amorphous structure.13,14 Investigations revealed that partial crystallization, also called nanocrystallization, is a common effect that occurs during laser-based processing of metallic glass powder in the so-called heat affected zone (HAZ).10,15–17
HAZ is the area around the melt pool where previously solidified material is reheated but not remelted. Yang et al 16 prepared Zr-based BMG components with different geometries using LPBF to investigate the effect of geometry on microstructure and nanocrystallization. It reveals that the phase fraction of nanocrystallization in BMGs with cubic geometry is significantly higher than in hollow and lattice structures due to the higher fraction of HAZs. In addition, Yang et al and Lu et al. were able to confirm that crystallization in HAZs in an LPBF-process is mainly induced during the reheating of previously solidified material.15,16
So far, Fe-based,9,18 Ti-based, 19 Al-based, 20 Pd-based, 21 and Zr-based10,16,17 metallic glasses have been processed by additive manufacturing, mainly in simple geometries as solid BMGs. Contributions on additively manufactured Ni-Nb-Ta-based metallic glasses have not yet been published, even though they exhibit the highest level of glass transition and crystallization temperatures and therefore high thermal stability among the Ni-based metallic glasses reported so far. 22
In this work, an Ni-based metallic glass powder (Ni60Nb20Ta20) was used to manufacture a lattice structure by LPBF while maintaining the amorphous structure. A cubic primitive lattice was chosen as the lattice geometry to use the printed structure as a reinforcing phase in an interpenetrating MMC in further research. This requires that the lattice has an open-porous structure that can be infiltrated without the risk of gas inclusions. Due to the simple structure, it is also expected that less areas are susceptible for crystallization.
First, a parameter study was carried out with different approaches regarding scanning strategy and various settings of scanning parameters for producing an open-porous lattice structure. X-ray diffraction (XRD) measurements were performed to analyze the amorphous structure of the metallic glass regarding crystallization. With the finally determined optimized parameters, samples were printed and characterized using differential scanning calorimetry (DSC) for thermal behavior and nanoindentation as well as compression tests for mechanical behavior.
Materials and Experimental Methods
Materials
An alloy with a nominal composition of Ni60Nb20Ta20 (TaNi39.1Nb20.7 wt.-%) was produced by induction melting of Nickel, Niobium, and Tantalum with a purity of 99.5% under argon atmosphere by Fraunhofer Institute IFAM (Dresden, Germany). It was further processed into powder in a crucible-free gas atomization process by Nanoval GmbH & Co. KG (Berlin, Germany). 23 Rapid cooling to room temperature solidifies the alloy amorphously, resulting in a metallic glass powder with a particle size of d50 = 44 μm (d10 = 28 μm, d90 = 69 μm).
Microstructure analysis via XRD and scanning electron microscopy
To confirm the amorphous structure, XRD measurements were carried out with a Seifert 3003 TT diffractometer (Solid State Chemistry, Institute of Physics, Augsburg University). The XRD pattern was collected at room temperature in Bragg-Brentano geometry with Cu-Kα radiation. All XRD measurements performed in this work were carried out with the same parameters (40 kV, 40 mA, scan rage 10°–80°, increment 0.02°, 40 scans per data point, 160 s integration time per degree) and equipment. Printed samples were manually processed into powder by means of a mortar. Figure 1a shows the pattern of the Ni60Nb20Ta20-powder. The broad maximum around 42.5° without any sharp diffraction peaks confirms an amorphous structure.

Ni60Nb20Ta20 powder analyzed by
Scanning electron microscopy (SEM) images were taken using a Prisma ESEM by ThermoFisher Scientific. All image acquisitions were carried out with the same parameters (Everhart-Thornley detector, 1.1 nA, 15 kV, 8–13 mm working distance). Magnification and scales are included in the images. Figure 1b shows the particle morphology of the Ni60Nb20Ta20 powder, which has a mostly spherical surface.
Additive manufacturing via LPBF
An ORLAS Creator RM by O.R. Lasertechnologie GmbH was used to manufacture the lattice structure. The machine has an Ytterbium fiber laser (YLM-150) with a maximum power of 250 W, a wavelength of 1070 nm, and an adjustable spot size in the range of 40–160 μm. The lattice structures were manufactured without preheating in an argon environment with a residual oxygen content of <0.2%. A cylindrical stainless-steel plate (SS316L) with a diameter of 110 mm was used as substrate.
Two studies were conducted to develop a manufacturing strategy for an amorphous lattice structure, and they are presented as follows. For each combination of process parameters, three cubes were built and placed at different locations on the substrate plate. After manufacturing, all samples were depowdered and visually inspected.
Study 1
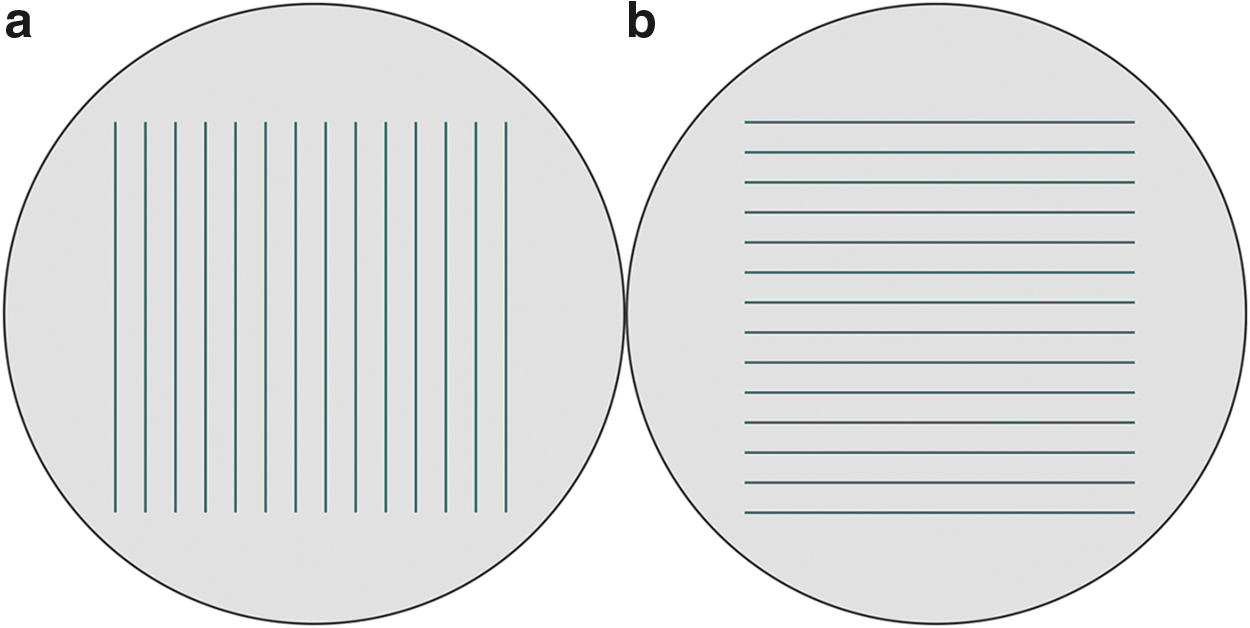
Cubic primitive lattices with 8x8x8 cell units in x-, y-, and z-direction were manufactured. The struts have a nominal width of 0.25 mm and the distance between each strut is 0.5 mm, resulting in an overall dimension of 6.2 × 6.25 × 6.25 mm3. Two different approaches were used to build up the lattices. In the first approach (Fig. 2a), the lattices were placed with one side directly onto the substrate plate and built without any supports.

Lattice orientations and scanning strategies used in study 1.
A concentric scanning strategy with varying line distances and a laser spot diameter of 40 μm was used. For the second approach (Fig. 2b), the lattices were rotated and built along their room diagonal. To achieve a better thermal equilibrium and to prevent the parts from distortion, supports for the outer surfaces of the struts were used in this approach. The supports were designed as cylinders that get slightly thinner in the upper part toward the struts. As shown by Yang et al, 24 crystallization in laser-based additive manufacturing of metallic glasses occurs mainly in HAZs around the melt pool, where previously solidified material is reheated but not remelted. When the lattices are scanned with a single concentric line as in the second approach, HAZs only occur between two layers. Therefore, this strategy is expected to be less susceptible to crystallization.
Study 2
Cubic parts with a size of 5 × 5 × 5 mm3 were built in normal orientation. The cubes were scanned with a bidirectional hatching without a perimeter scan (Fig. 3) and a laser spot diameter of 40 μm. The rotation angle of the hatching vectors between two following layers was set to 90° with a layer thickness of 100 μm, whereas hatching distance was set to 400, 700, and 1000 μm. The high hatching distances were chosen to prevent an overlapping of two adjacent melt-tracks to realize an open-porous and amorphous lattice structure. With this strategy, only the cross-over points of the single scanned lines are reheated after a 90°-rotation in the building process. Therefore, smaller HAZs and reduced crystallization are expected compared with study 1.
A scanning strategy with a bidirectional hatching with
Density and porosity measurements
To determine the density of the Ni60Nb20Ta20 alloy, gas pycnometer measurements were performed on the printed samples using a AccuPyc II 1340 from Micromertics and helium as a process gas. Based on the measured density, the mass and volume of six different printed samples, the porosity and thus density of the open-porous lattice structure could be calculated. The samples were weighed with an Explorer EX225D by Ohaus, and volume was measured with a micrometer screw gauge.
Thermal analysis via DSC
Thermal stability associated with glass transition temperature, crystallization, and supercooled liquid region were examined by DSC using a STA 449 F3 Jupiter by NETZSCH. The unprocessed amorphous powder and the additive manufactured sample, manually re-milled to powder, were investigated. The samples were heated up from room temperature to 930°C with a heating rate of 10K/min under argon atmosphere. Thermal experiments were carried out and evaluated according to DIN 51007. 25
Elastic modulus and hardness via nanoindentation
Nanoindentation was considered to determine the Young's modulus and Vickers hardness of the Ni60Nb20Ta20 alloy. The measurements require a smooth surface, 26 which was realized by grinding with SiC abrasive paper P2500. For the experiments, a nanoindenter UNAT from former ASMEC GmbH (now Zwick/Roell) was used, provided by Materials Engineering, Institute of Materials Resource Management, Augsburg University. All measurements were performed and evaluated according to DIN EN ISO 1457726 using a modified Berkovich indenter tip. The testing procedure was force controlled and carried out in the cross-sectional center of the struts.
The Young's modulus was determined by the standardized method of Oliver and Pharr. 27 Since the Poisson's ratio for the metallic glass Ni60Nb20Ta20 is not known, a value of 0.361 of a metallic glass with a similar composition Ni60(Nb60Ta40)34Sn6 was considered. 28 The Vickers hardness (HVIT) could be calculated via indentation hardness (HIT) using the equation HVIT = 92.62∙HIT. Indentation hardness is given by HIT = Fmax/Ap, with Fmax as applied force and Ap as projected contact area between sample and indenter.
Mechanical properties via compression tests
Compression tests were performed at room temperature on a Zwick universal testing machine ZMART.PRO (Z1464) from Zwick/Roell on samples with a cubic geometry (5 × 5 × 5 mm3) and plane-parallel surfaces. Crosshead velocity was constantly set to 0.12 mm/min (ɛ = 4 × 10⁻⁴ s−1) according to DIN 50106 29 , and a preload of 20 N was applied. The deformation was measured on the sample surface by DIC at a frame rate of 1 Hz using a 12M ARAMIS (2D) system from GOM GmbH and evaluated with a virtual extensometer in the associated software. The Young's modulus was determined in a strain range of 0.05% to 0.2% using the least-squares method according to ASTM E111. 30
Results and Discussion
In the next section, the results of the parameter study of additive manufacturing by LPBF and the characterization of the resulting metallic glass lattice are presented and further discussed.
Parameter study LPBF
Study 1
Various combinations of scanning parameters were adopted to optimize the manufacturing process of the lattices, which are shown in Table 1. Via visual inspection, the manufacturing results were classified into three categories named “acceptable,” “cracked,” and “broken” (Fig. 4).
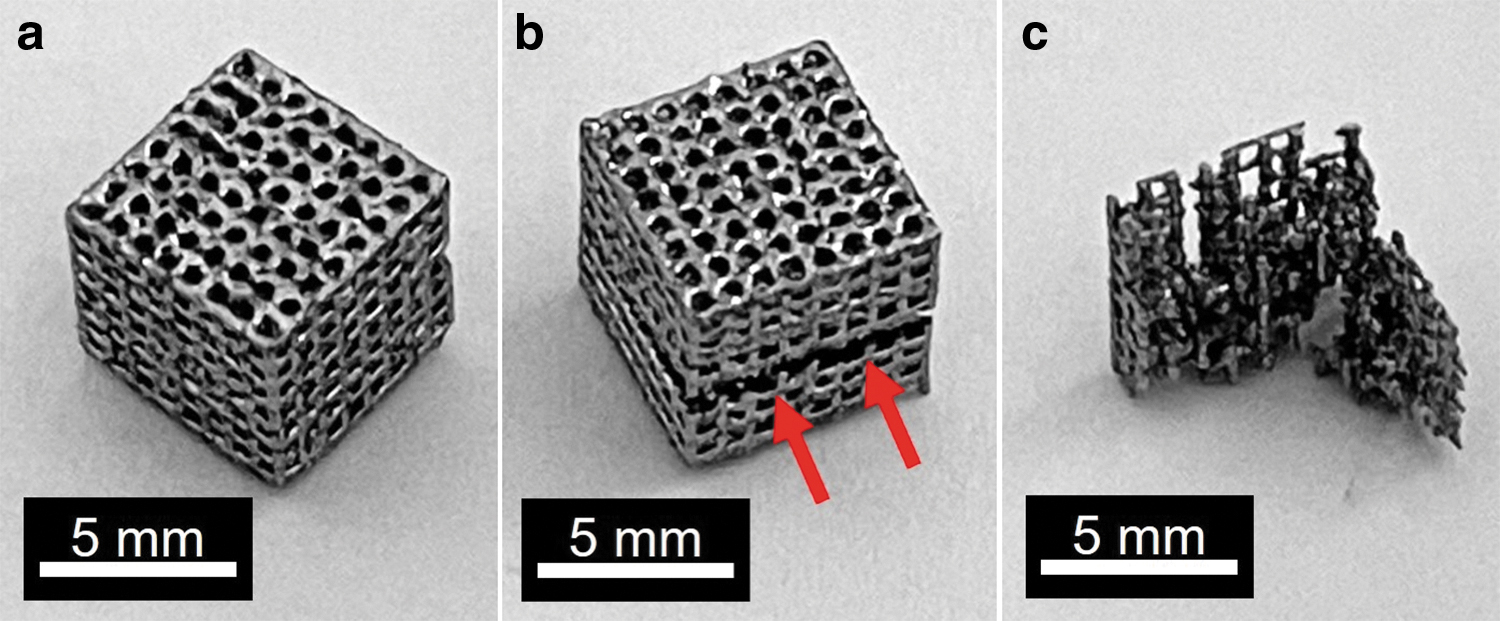
Results of manufacturing cubic primitive lattices divided into three categories:
Scanning Parameters to Build Cubic-Primitive Lattices (Study 1)
At high scanning speeds combined with a low laser power, stable consolidation of the powder to previously scanned layers could not be achieved. This resulted in extremely fragile lattices, which broke during the removal of the substrate plate, or no lattices being built at all due to poor adhesion to the substrate plate (category “broken”). At lower scanning speeds in combination with a higher laser power, more stable lattice structures could be built. However, some of them were distorted or showed cracked struts (category “cracked”). In addition, the single line strategy in the diagonal sample 1.10 and 1.11 led to a weak bonding and therefore to extremely fragile lattices.
To verify whether the lattices have an amorphous structure, XRD measurements were performed. All XRD patterns (Fig. 5) exhibit sharp crystallization peaks, especially superimposed on the diffuse maximum around 42.5°, indicating that the metallic glass lost partly its amorphous structure due to the heat impact during scanning process. However, there is a difference between the patterns regarding intensity of the crystalline peaks. Comparing samples 1.3, 1.6, and 1.7 (Fig. 5a) with 1.10, 1.11 (Fig. 5b), it is noticeable that crystallization intensities have decreased. To quantify the crystalline and amorphous phase, a multi-parameter fit procedure was applied to the XRD patterns.
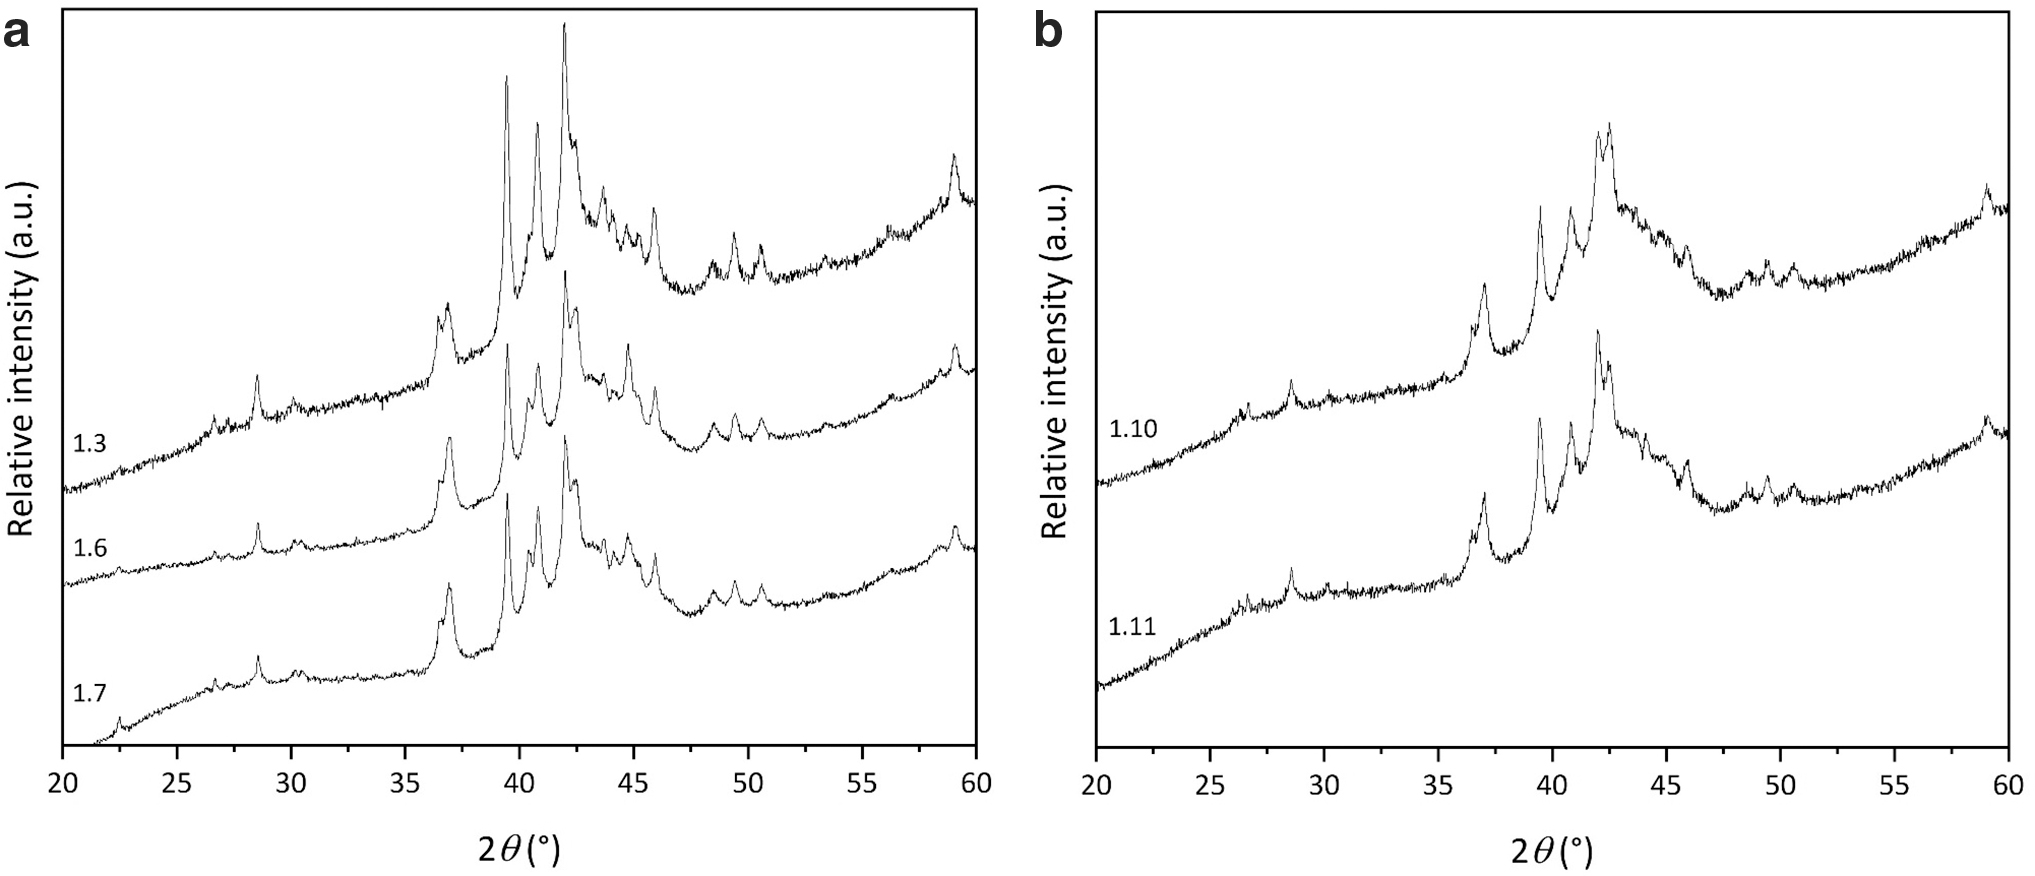
XRD pattern of samples manufactured with varying scanning parameters in study 1.
The results confirm a decreasing crystallization fraction. Samples 1.3, 1.6, and 1.7 exhibit a crystalline fraction of 51%, 46%, and 35%. For samples 1.10 and 1.11, the crystalline fraction is further decreased to 32% and 28%. Hence, the scanning strategies influence crystallization, whereas a clear correlation with single scanning parameters could not be found. Scanning multiple adjacent lines in samples 1.3, 1.6, and 1.7 results in larger HAZs where crystallization can occur compared with the single line strategy in diagonal samples 1.10 and 1.11.
The variation of scanning parameters is also visible in the composition of the lattice structure, as shown in SEM images of samples 1.3, 1.5, 1.6, and 1.7 in Figure 6. All images were taken transversely to build direction so that layer thickness can also be examined. The SEM image of sample 1.3 (Fig. 6a) shows residues of unmelted powder particles sintered to the struts. It can also be seen that a bond between the struts and the single scanned lines is not existent everywhere. The scanning speed was chosen too high and laser power too low to melt the powder particles completely together, leading to a broken sample after removal of the substrate plate.
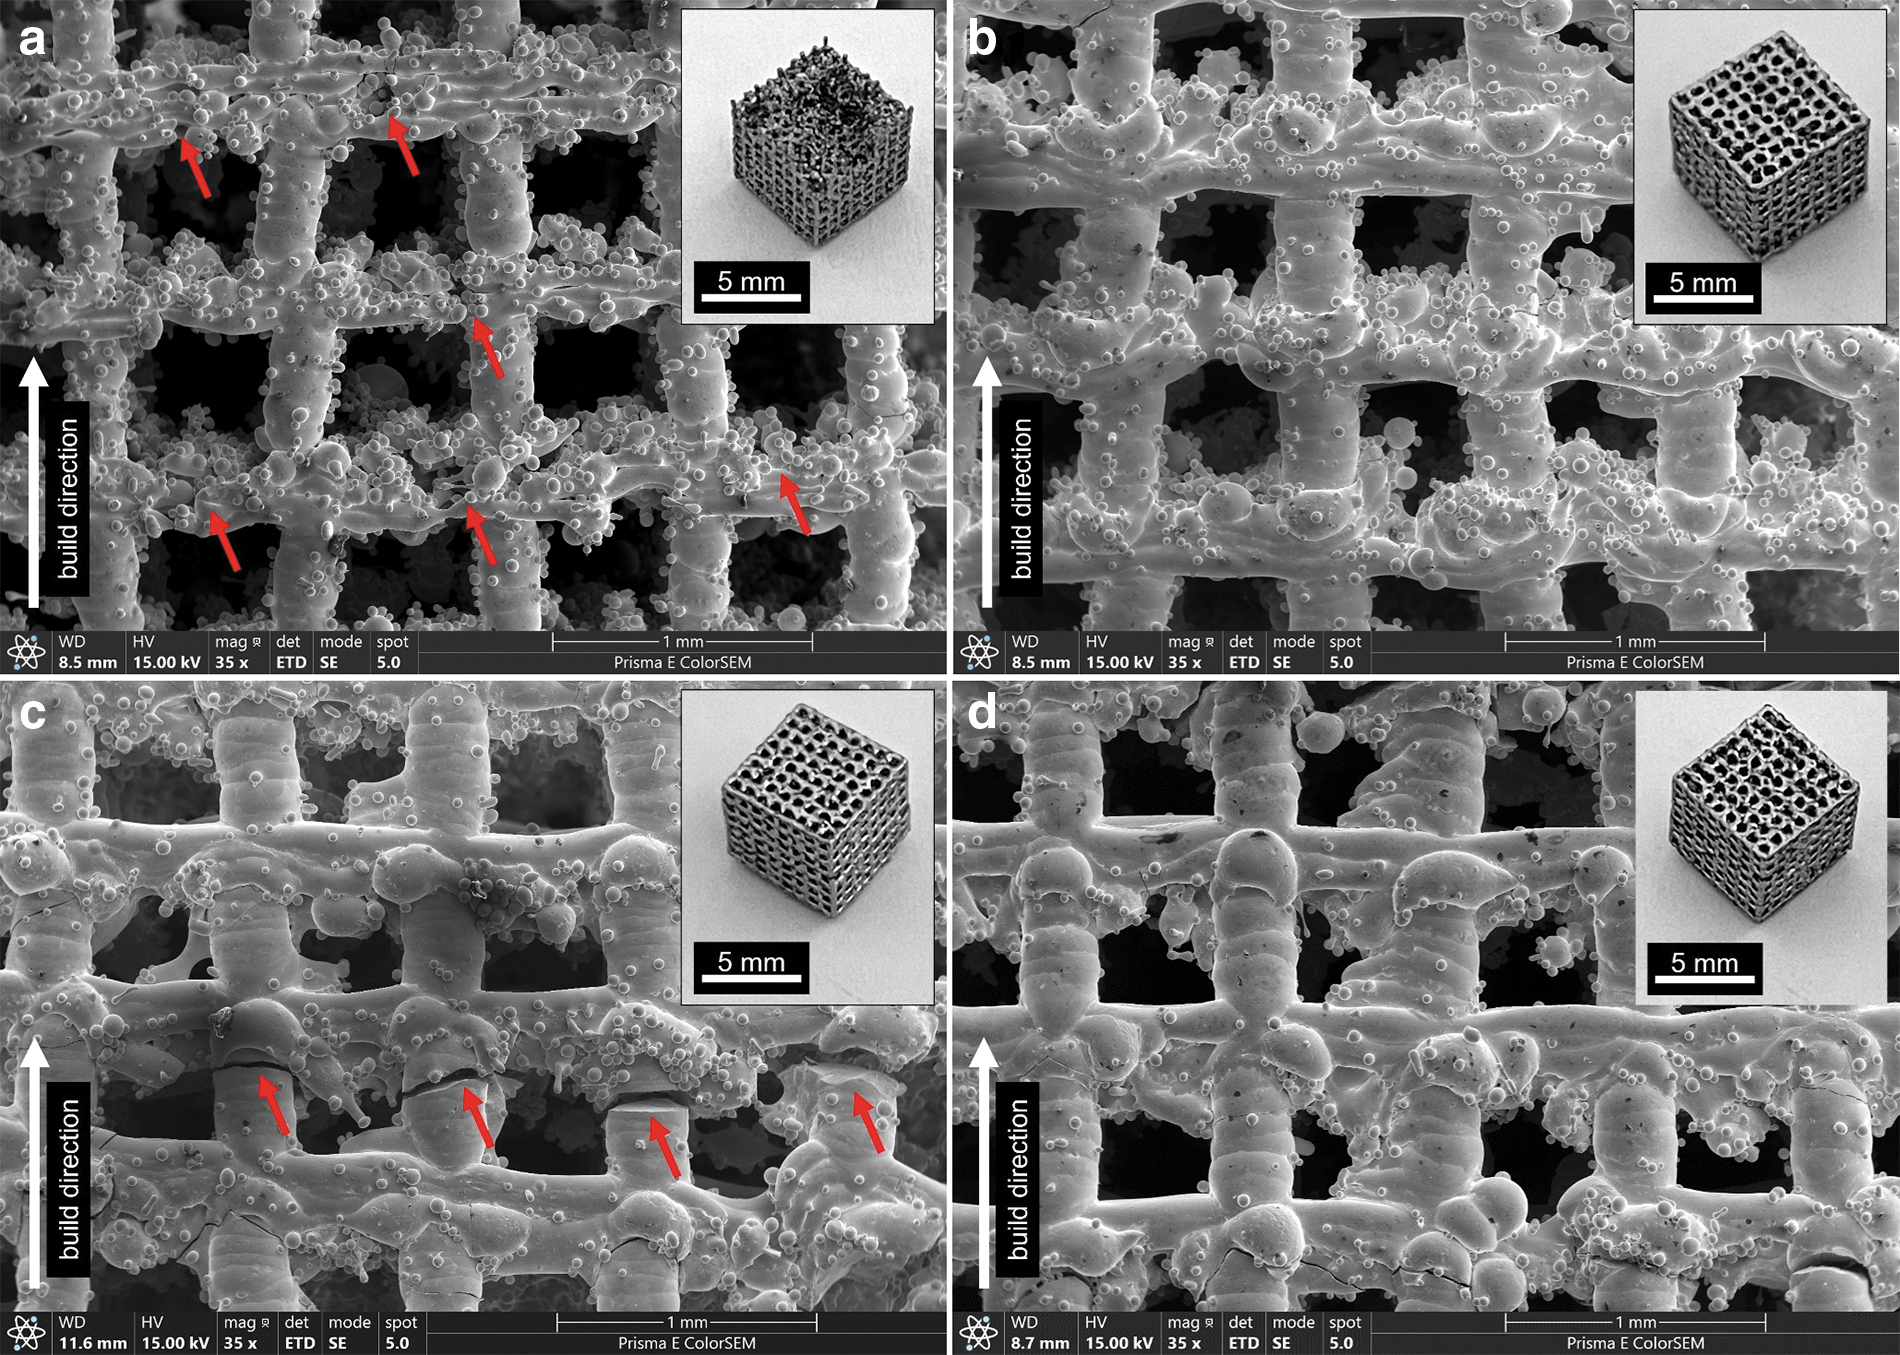
SEM images of printed samples from study 1 taken transversely to the build direction with
A better bond between the struts and the scanned lines is shown in the SEM images of samples 1.5, 1.6, and 1.7 in Figure 6b–d. Due to low scanning speed and high laser power, a stable meltpool with interlayer fusion could be accomplished. Sample 1.6 shows a clear crack through the lattice struts and is categorized as “cracked.” However, samples 1.5 and 1.7 are categorized as “acceptable” because they are largely crack-free. This means that the amount and length of cracks is vanishingly small in relation to the total size of the samples.
Study 2
The cubes were manufactured with the scanning parameters shown in Table 2. For most of the considered processing parameter-sets, no stable lattice structure could be realized. Especially for hatch distances of 700 and 1000 μm, no structures could be built up at all. Or the structures were so fragile that they broke easily during removal of the substrate plate. However, some stable structures could be achieved with sample 2.3 with a hatch distance of 400 μm combined with a laser power of 200 W and a scanning speed of 1000 mm/s.
Scanning Parameters Used to Build Cubic Parts (Study 2)
To verify whether this structure has retained its amorphous atomic structure, XRD measurements were performed. The pattern of sample 2.3 is shown in Figure 7a and compared with the pattern of Ni60Nb20Ta20-powder. Sample 2.3 exhibits crystallization peaks with a low intensity superimposed on the typical broad maximum at 42.5°, indicating that partial nanocrystallization occurred during the printing process. A multi-parameter fit procedure results in a crystalline fraction of only 7%, a significant improvement compared with the results of study 1.
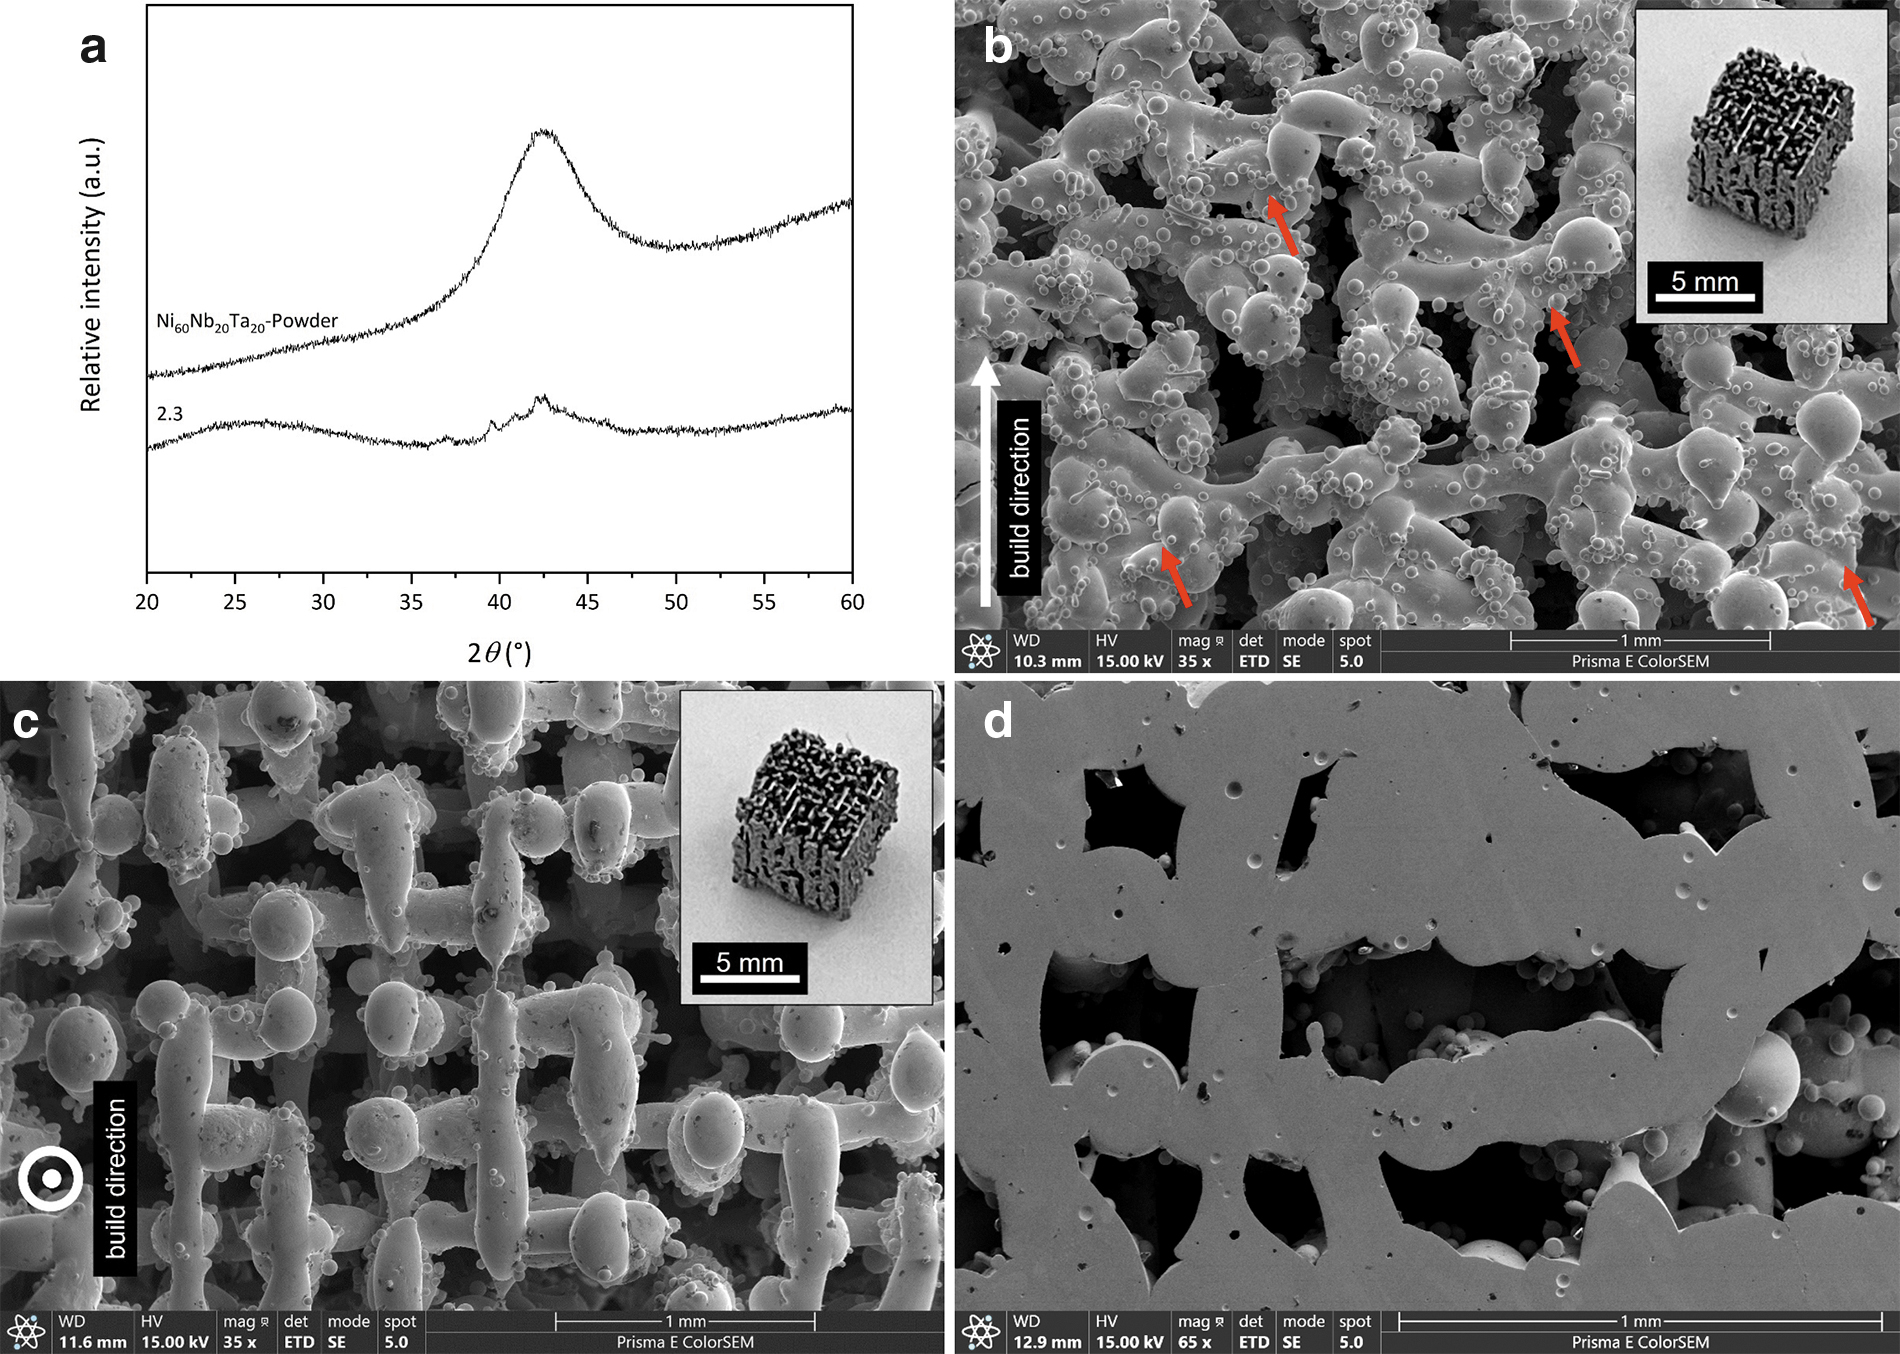
Sample 2.3 analyzed.
In addition, sample 2.3 shows a second broad maximum around 20°–30° compared with Ni60Nb20Ta20-powder. Both broad maxima are typical for Ni-Nb-Ta-based metallic glasses.22,31 The second amorphous phase occurs through a thermally activated diffusion process below crystallization temperature, which results in decomposition of the atoms and relaxation. This is possible due the high free volume that is enclosed in metallic glasses and thus has a significant influence on the atomic diffusion.32–34
Nanocrystallization probably develops in HAZs in the nodes of single scanned lines. However, the combination of high laser power and medium scanning speed, in addition to high layer thickness and line distance, leads to a nearly completely amorphous structure. Due to the fact, that the laser power and scanning speed resulted in crystallization within study 1, the main impact comes from detached scan vector printing strategy used in study 2.
To analyze the microstructure of sample 2.3, SEM images transversely to build direction and in build direction were made. The image transversely to build direction (Fig. 7b) shows again residues of unmelted powder particles sintered to the lattice struts like sample 1.3. In addition, some of the single printed layers have melted together, so no clear lattice has been formed as in samples 1.3, 1.6, and 1.7. The SEM image in build direction (Fig. 7c), shows an almost continuous lattice structure, indicating that the lattice in and transversely to build direction exhibits an inhomogeneous structure.
In addition, an SEM image of the cross-section was taken to examine the microstructure (Fig. 7d). It shows enclosed gas pores inside the struts caused by the scanning process. However, all images show that the samples are crack-free, and an interlayer fusion could be accomplished.
Thus, the aim of study 2 to print an amorphous, open-porous lattice structure could be achieved with sample 2.3. For the following characterization, samples with a size of 30 × 30 × 15 mm3 were manufactured according to the printing parameters used for sample 2.3. Therefore, all samples in the following are named Ni60Nb20Ta20-2.3.
Density and porosity
Measurements by means of a gas pycnometer resulted in the printed metallic glass Ni60Nb20Ta20 alloy in an average density of ρNi60Nb20Ta20 = 10.72 ± 0.05 g/cm3. Density determinations on the Ni60Nb20Ta20 alloy have already been made by Lichtenberg et al 35 using the Archimedes' principle. The metallic glass, produced by melt-spinning, resulted in a density of 10.41 g/cm3, which corresponds well with the density determined in this report. Based on this, a density of the printed lattice structure of 4.04 ± 0.07 g/cm3 with an open porosity of 62.28% ± 1.0% could be determined.
Differential scanning calorimetry
The DSC measurements were performed, and the resulting graphs of sample Ni60Nb20Ta20-2.3 and the unprocessed Ni60Nb20Ta20-powder are shown in Figure 8a. For a statistical value, five measurements were performed for each case. The DSC signal of the powder exhibits an endothermic reaction as onset of glass transition at Tg,powder = 664.7°C ± 0.6°C. The exothermic reaction describes the crystallization of the amorphous phase and has its onset at Tx,powder = 696.9°C ± 0.2°C, resulting in a supercooled liquid region of ΔTX,powder = 32.2°C ± 0.6°C.

Resulting curves of characterization.
The exothermic reaction exhibits two exothermic peaks in a direct succession, suggesting that the crystallization of the alloy takes place in a multi-stage process, which is not unusual for metallic glasses. 36 The more distinct peak is at Tpeak,powder = 710.6°C ± 0.1°C, and the exothermic heat of crystallization is 64.8 ± 0.5 J/g. These results correspond to the results (Tx = 721°C, Tpeak = 735°C) of the same alloy studied by Lee et al 22 Considering that the heating rate was set to 40K/min in Lee et al while a heating rate of 10K/min was chosen in this investigation, and increasing the heating rate increases the glass transition and crystallization temperature. 37
The printed sample Ni60Nb20Ta20-2.3 does not show a clear onset for glass transition, which is why no exact value can be given here. Onset of crystallization temperature is Tx,2.3 = 694.26°C ± 0.2°C, and crystallization peak at Tpeak,2.3 = 712.5°C ± 0.1°C and therefore in the same temperature range as the unprocessed powder. In contrast, the exothermic crystallization heat of 41.1 ± 1.9 J/g is significantly lower and only 64% of the exothermic heat of the powder.
One reason could be the nanocrystallization taking place in the process. 10 However, since XRD results confirmed that a crystallization of only 7% developed, another reason could be the decomposition into two amorphous phases and related structural relaxation and change in free volume. 38
Nanoindentation
To determine the Young's modulus and hardness of the Ni60Nb20Ta20 alloy, nanoindentation measurements were carried out on the struts of the printed sample. The load-displacement curve in Figure 8b shows the representative result of the measurements, including the fit function of the unloading curve to determine the unloading stiffness. The average maximum load is 25.156 ± 0.036 mN at an average maximum displacement of hmax = 0.284 ± 0.003 μm. With these results and an assumed Poisson's ratio of 0.361, 28 a Young's modulus of 195.1 ± 0.39 GPa could be determined for the printed Ni60Nb20Ta20 alloy.
The average indentation hardness is HIT = 10.32 ± 0.39 GPa and results in an average Vickers hardness of HVIT = 956.1 ± 36.2. Despite the conversion factor of 92.62 given in DIN EN ISO 14577, 26 the Vickers hardness determined by nanoindentation may differ from the traditionally measured Vickers hardness. Results of the research of Lichtenberg, 39 which evaluated tensile and Vickers hardness tests on Ni60Nb20Ta20 metallic glass produced by melt spinning, showed a Young's modulus of 161.2 ± 9.1 GPa and HV0.05 = 1051 ± 35, which are similar results considering the different testing and manufacturing methods.
Compression tests
Due to the inhomogeneous structure of the manufactured samples in and transversely to build direction, compression tests were carried out in both directions. Samples tested in the build direction named Ni60Nb20Ta20-2.3-0° and transversely to build direction Ni60Nb20Ta20-2.3-90°. Figure 8c shows all resulting stress-strain curves, whereas Figure 8d provides a closer look at the results of Ni60Nb20Ta20-2.3-90°. All results are listed in Table 3.
Results of Compression Tests of Ni60Nb20Ta20-2.3-0° and Ni60Nb20Ta20-2.3-90°
Samples in 0°-direction reach a compressive strength of 90.33 ± 7.28 MPa. Although the total strains of the samples with higher maximum stresses are in a similar range of 0.73% and 0.84%, the third sample reaches 0.43%, just half the strain of the others. The compressive modulus determined in the linear elastic range of each stress-strain curve resulted in 18.81 ± 0.67 GPa. Samples in 90°-direction exhibit a compressive strength of 15.48 ± 3.15 MPa, which are significantly lower than the results of 0°-direction.
Nevertheless, the total strain (0.55% ± 0.11%) is in a similar range. Samples in 90°-direction do not have a linear range of elastic strain, which is why a determination of the compressive modulus was not possible. The significant difference between maximum strength in 0°- and 90°-direction is due to the different structure and therefore different volume fraction in and transversely to build direction (Fig. 7) caused by the manufacturing process, as metallic glasses have isotropic properties due their amorphous atomic structure.
Lee et al 22 determined a compressive failure strength of 3.35 GPa at a compressive strain of 1.5% on the metallic glass Ni60Nb30Ta10, whereas Choi-Yim et al 28 investigated a Young's modulus of 165.6 GPa and a yield strength of 3.58 GPa on the metallic glass Ni60(Nb60Ta40)34Sn6. Both results are significantly higher than the values determined here. However, it must be noted that those are BMGs whereas the metallic glass studied here exhibits an open-porous lattice structure. Hence, the Young's modulus measured at the struts and therefore at the BMG (Ni60Nb20Ta20) by means of nanoindentation is 195 GPa and thus significantly higher than the compressive modulus.
Other influences on the compression properties can be the nanocrystallization that occurred during the manufacturing process and the decomposition in two amorphous phases and thus change in the free volume. Various investigations have shown that this can lead to an increase in brittleness.40–42
Conclusion
In this work, an amorphous lattice structure was successfully manufactured using a Ni-Nb-Ta-based metallic glass powder by LPBF. Suitable scanning parameters with a laser power of 200 W, a scanning speed of 1000 mm/s, a layer thickness of 100 μm, and a hatching distance of 400 μm could be evaluated in the parameter study. With a scanning strategy of single scanned lines and 90°-rotation of each layer, 93% of the amorphous structure was retained. Areas with HAZs, where mainly nanocrystallization occurs, were successfully reduced. Conducted compression tests confirm that a mechanically stable open-porous lattice structure could be achieved.
Footnotes
Acknowledgments
The authors are thankful to Fraunhofer Institute IFAM (Dresden, Germany) and Nanoval GmbH & Co. KG (Berlin, Germany) for producing the metallic glass alloy and powder. Further, the authors are grateful to the Chair of Solid State Chemistry (Institute of Physics, Augsburg University, Germany) for providing their XRD equipment and especially to M. Schäfer and A. Kalytta-Mewes for their support during XRD measurements. The authors are also thankful to the Chair of Materials Engineering (Institute of Materials Resource Management, Augsburg University) for providing their nanoindentation equipment and especially to M. Schulz for his support. Also, special thanks are due to S. Schmitt for technical support, as well as to S. Pöppel and L. Baier for their experimental support. The financial support of the German Research Foundation (DFG) within the project WE 4273/19-1 is gratefully acknowledged.
Authors' Contributions
All authors have seen and approved the final version of the article. The article is the author's original work, has not received prior publication, and is not under consideration for publication elsewhere.
K.D.: Conceptualization, Investigation, Writing—Original draft, and Verification.
S.C.: Investigation, Resources, and Writing—Original draft.
S.D.: Writing—Review and editing, Supervision.
A.T.: Writing—Review and editing, Supervision.
K.A.W.: Supervision, Writing—Review and editing, and Funding acquisition.
Author Disclosure Statement
No competing financial interests exist.
Funding Information
No funding was received for this article.