
Abstract
Moisture absorption into hygroscopic/hydrophilic materials used in fused deposition modeling (FDM) can diminish desired mechanical properties. Sensitivity to moisture is dependent on material properties and environmental factors and needs characterization. In this article, moisture sensitivity of four grades of polylactic acid (PLA) filaments and four different ratios of PLA/polybutylene succinate (PBS) blended filaments were characterized through FDM printed American society for testing and materials (ASTM-D638) test samples after conditioning the filaments at different relative humidity levels. The tensile testing and scanning electron microscopy (SEM) of the samples' fracture surfaces revealed that PLA 4043D was the most moisture-sensitive among the chosen grades of PLA filaments. Through filament tension test and melt flow index (MFI) testing it was observed that moisture had a significant detrimental effect (20% reduction in tensile strength and 50% increase in MFI) on PLA 4043D filaments. Samples from moisture-conditioned PLA/PBS 75/25 blended filaments displayed a significant reduction (10%) in tensile strength. Moreover, the MFI of 75/25 filaments was increased with subsequent increases in moisture level. Investigation of tensile properties of ASTM samples made from four grades of PLA filaments exposed to room temperature and humidity conditions for 3 months showed an even more significant decrease in strength (ranging from 24% to 36%).
Introduction
Among the available additive manufacturing (AM) processes, fused deposition modeling (FDM) is the most popular method owing to its simplicity and associated advantages. The FDM printers and materials are relatively less expensive, and the process requires minimum monitoring after the initial process setting. It provides the flexibility of manufacturing geometrically complex parts with higher precision. The produced parts are lightweight, cost- and time-efficient, and generate low process waste. 1 Several thermoplastics are commonly used in FDM among which the popular materials are polylactic acid (PLA) and acrylonitrile butadiene styrene (ABS). Apart from PLA and ABS, polycarbonate, nylon, polyamide, thermoplastic polyurethane, polyetherimide, and polyether ether ketone are some of the other materials used in FDM. 2
In FDM, process parameters can influence the mechanical properties of parts made with same material composition. Among the parameters, the relationship of infill pattern, infill density, printing angle, part orientation, layer thickness, in-plane raster orientation, number of outlines, extrusion multipliers, and the gap between rasters with mechanical properties are well documented.3–8 Even in other AM processes such as selective laser sintering, the printing parameters were found to have an effect on the fracture properties.9,10 Besides the processing parameters, the processing environment as well as the material storage conditions can also affect the mechanical properties. As new composite/blended filaments are being developed for FDM, investigations into the storage guidelines for the new filaments are important.
Recently, lots of efforts are undertaken to produce new filaments by combining two or more materials or reinforcing one material with fibers and/or additives. Of these newer combined materials, PLA and polybutylene succinate (PBS) combination has gained a lot of attention owing to their superior mechanical properties. PLA is strong, stiff, and brittle; it has mechanical properties in the range of polystyrene and polyethylene terephthalate. 11 It possesses great printability characteristics, good strength, and biodegradability.12–14
But one of the limitations of PLA that curbs its widespread use is its brittleness. If the toughness of PLA can be improved by mixing with flexible polymers, its prospective applications can be increased.15,16 PBS has more ductility, flexibility, toughness, and properties similar to polypropylene but lacks rigidity.17–19 The combination of these two materials could lead to high-performance low-cost biodegradable composite filament. Unfortunately, PLA and PBS both are extremely moisture-sensitive materials.
Generally, hygroscopic and hydrophilic polymers tend to absorb moisture from the environment. This absorbed moisture causes defects during the FDM process such as plasticization, degradation, bubble formation, microcracking, and hydrolysis resulting in increased porosity. Hence prolonged exposure to moisture causes detrimental effects on the mechanical properties of the final products.20–25 To prevent this, drying the material before FDM is recommended. Even though the manufacturers of commercial filaments provide drying temperatures and durations they do not specify the frequency of drying or the favorable storage condition for filaments.
As drying is an energy-intensive and thus expensive process, it is imperative to find out the acceptable amount of moisture in filaments without significantly reducing the mechanical properties of processed parts and the ideal storage condition to minimize drying frequency. Also, for any new composite materials, the characterization of moisture sensitivity and its respective effect on different properties is required before commercial applications. In this study, the moisture sensitivity of four PLA filaments and four PLA/PBS blend filaments is analyzed by characterizing the effect of moisture on mechanical, morphological, physical, and thermal properties.
Experimental Methods
Materials
Three different grades of Ingeo™ PLA filaments (4043D, 3D850, and 3D870) and PLA 2500HP pellets were obtained from NatureWorks, LLC. BioPBS FZ71 (PTT MCC Biochem CO. Ltd.) was procured from GC Innovation America.
Blend preparation and filament processing
Before processing, drying was done in a convection oven to remove any moisture from PLA and PBS pellets. Drying was performed at 50°C for 9 h for PLA 2500HP and at 80°C for a minimum of 5 h for PBS. A co-rotating Leistritz twin-screw extruder was used to process FDM filaments from 100% PLA 2500HP and four different PLA/PBS blends (90/10, 75/25, 60/40, and 25/75). Filament diameter was maintained in the 1.75 ± 0.15 mm range to minimize the effect of under and overextrusion during the FDM process.
Differential scanning calorimetry
TA Instruments Q2000 was used to perform differential scanning calorimetry (DSC) on samples from each blend weighing between 6 and 12 mg. The heat/cool/heat method was used to obtain the thermograms. Two heating cycles were performed with the temperature starting from 25°C with a ramp-up rate of 10°C/min up to 250°C under nitrogen gas with a cooldown rate of 10°C/min to 25°C in between. TA Universal Analysis software was used to analyze the thermograms. The % crystallinity (Xc) of the PLA and PBS were calculated by using Equation (1) and the values from the second heating curves
26
:
where
Filament cutting and drying
Fourteen feet sections of filaments were cut from four different PLA grades and four PLA/PBS filaments. Before each stage of moisture exposure, the filaments were dried at recommended temperature and duration (Table 1). Although the technical data sheet of 4043D recommended drying at 80°C, filament deformation occurred while drying at that temperature. Through subsequent experimentation, it was determined that the optimum temperature was 50°C. The weights of the filaments after each drying were recorded to compare with the weights after moisture absorption.
Drying Parameters for Different Filament Types
PBS, polybutylene succinate; PLA, polylactic acid.
Moisture conditioning
One set of filaments from each type of material was placed in a Binder KBF 115-UL humidity test chamber for 1 week at a specific temperature and relative humidity (RH) for moisture absorption. The temperature was set to 25°C and RH was maintained at 50%, 65%, and 80% for a week for each level of humidity. To simulate 100% RH, the filaments were conditioned by submerging in a distilled water-filled container for 1 week. The weights of the filaments were recorded again post-moisture conditioning and percentage weight gain was calculated.
Fused deposition modeling
Samples were printed in the XY orientation with MakerBot Z18 desktop printer and MakerBot Print was used to set up the parameters. The layer height, infill density, and infill pattern were set at 0.20 mm, 100%, and diamond, respectively. To ensure high-quality output, a few parameters were changed from material to material (Table 2).
Major Fused Deposition Modeling Parameters for Polylactic Acid and different Polylactic Acid/Polybutylene Succinate Blends
Mechanical testing
Instron 5567 universal testing machine was used for tensile testing of ASTM-D638 Type IV specimens. A 30 kN load frame was used and the crosshead speed was set at 5 mm/min. MTS Model 632.11B-20 extensometer was used to measure the strain deformation. Sample size n = 3 was used for all experiments.
Scanning electron microscopy
Fracture surface morphology was observed using a JEOL JSM-6490LV scanning electron microscope after sputter-coating with carbon. 15 kV of acceleration voltage and several magnifications were used to capture the fracture surface of tested tensile samples.
Scanning electron microscopy image processing
To estimate the porosity percentages in the fracture surface-scanning electron microscopy (SEM) images, an algorithm was developed and programmed using python™. SEM image was first converted into the grayscale format. Then a Gaussian filter was applied to blur the pixels in the image. After that, each pixel is checked against a threshold value to compare whether the pixel value is less than the threshold value. This threshold value is defined as the ceiling function of the average of randomly selected four light gap pixels and four dark solid pixels. If a pixel is found below this value, the surrounding pixels were also compared. In case three surrounding pixels were also found to be below this threshold, the corresponding area was defined as a pore. Finally, the percentage of porosity was calculated by dividing the total number of pixels in such pores by the total number of pixels in the SEM image.
Surface roughness measurement
Surfcom surface texture measuring instrument was used to measure the average surface roughness (Ra) of the top surfaces of the ASTM samples. Vertical magnification and cutoff were set at × 2K and 0.80 mm, respectively, whereas the measurements were recorded in microns (μm).
Tensile testing of filaments
To study the effect of moisture on the tensile property of the individual filaments, separate tensile testing was performed on Instron 5567 for PLA 4043D and PLA/PBS 75/25 filaments. The filaments were tested with specially designed tensile testing grips and a 2 kN load frame. 50 mm/min crosshead speed and 150 mm gauge length were used (Chad Ulven, personal communication). Sample size n = 3 was used for all experiments.
Melt flow index of filaments
Melt flow index (MFI) of PLA 4043D and PLA/PBS 75/25 filaments was measured after moisture conditioning at different RH levels. After moisture conditioning, the filaments were pelletized and MFI testing was performed using MFI2-156 (Custom Scientific Instruments) following ASTM-D1238 guidelines (210°C/10 kg).
Statistical analysis
Two-way analysis of variance (ANOVA) was performed on the maximum tensile stress and percent elongation values using Minitab 18. Tukey post hoc analysis was also performed to find out the effect of each humidity level on the tensile stress and percent elongation of each particular filament type (α = 0.05, two-sided).
Prolonged moisture exposure
For observing the long-term effect of moisture on the tensile properties of FDM parts, four PLA grade filaments were placed in room condition for 3 months. The filaments were prepared following the same procedure used during 1-week moisture exposure. After 3 months, the filaments were weighed again, ASTM-D638 samples were printed, and tensile tested using the Instron load frame. Sample size n = 3 was used for all experiments.
Results and Discussion
Thermal properties
Analysis of thermograms from the DSC (Fig. 1) revealed that increasing PBS content in PLA/PBS blends decreased glass transition temperature (Tg) of PLA (Table 3). Tg of PLA dropped from 62.01°C for neat PLA to 58.03°C in PLA/PBS 25/75 blend. The melting point (Tm) of neat PLA was also reduced from 175.56°C to 174.65°C in PLA/PBS 25/75 blend.26,28 Only PLA/PBS 25/75 blend exhibited double melting peaks in the thermogram. This phenomenon can be attributed to the melting, recrystallization, and remelting of two kinds of crystal formation during the cooling phase. The first melting peak was due to the melting of imperfect crystals and the second one was when the more organized crystals melted at higher temperatures.26,29,30
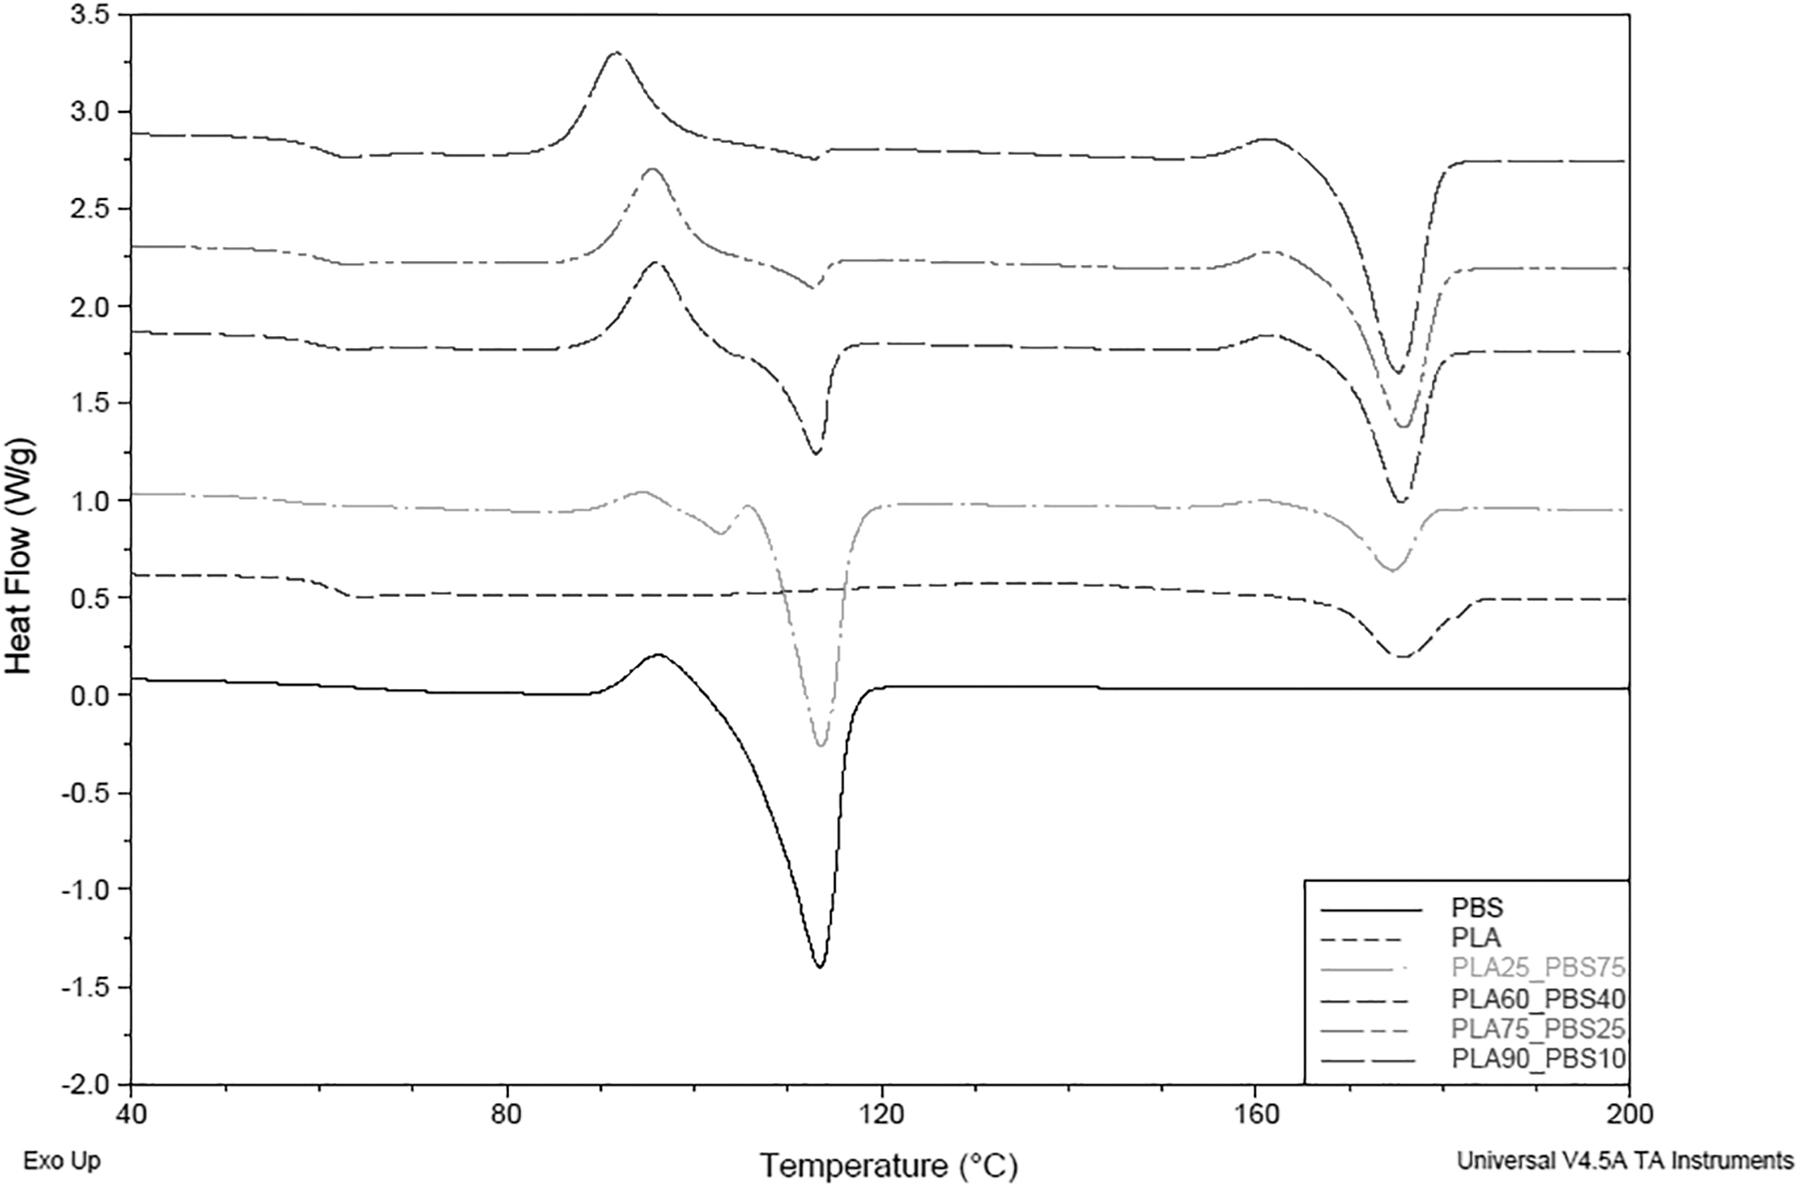
DSC curves of PLA 2500HP, PBS, and different PLA/PBS blends (color figure is available online). DSC, differential scanning calorimetry; PBS, polybutylene succinate; PLA, polylactic acid.
Glass Transition, Melting Temperature, Melting Enthalpy, and Percent Crystallinity of Polylactic Acid/Polybutylene Succinate Blends
Weight gain of filaments
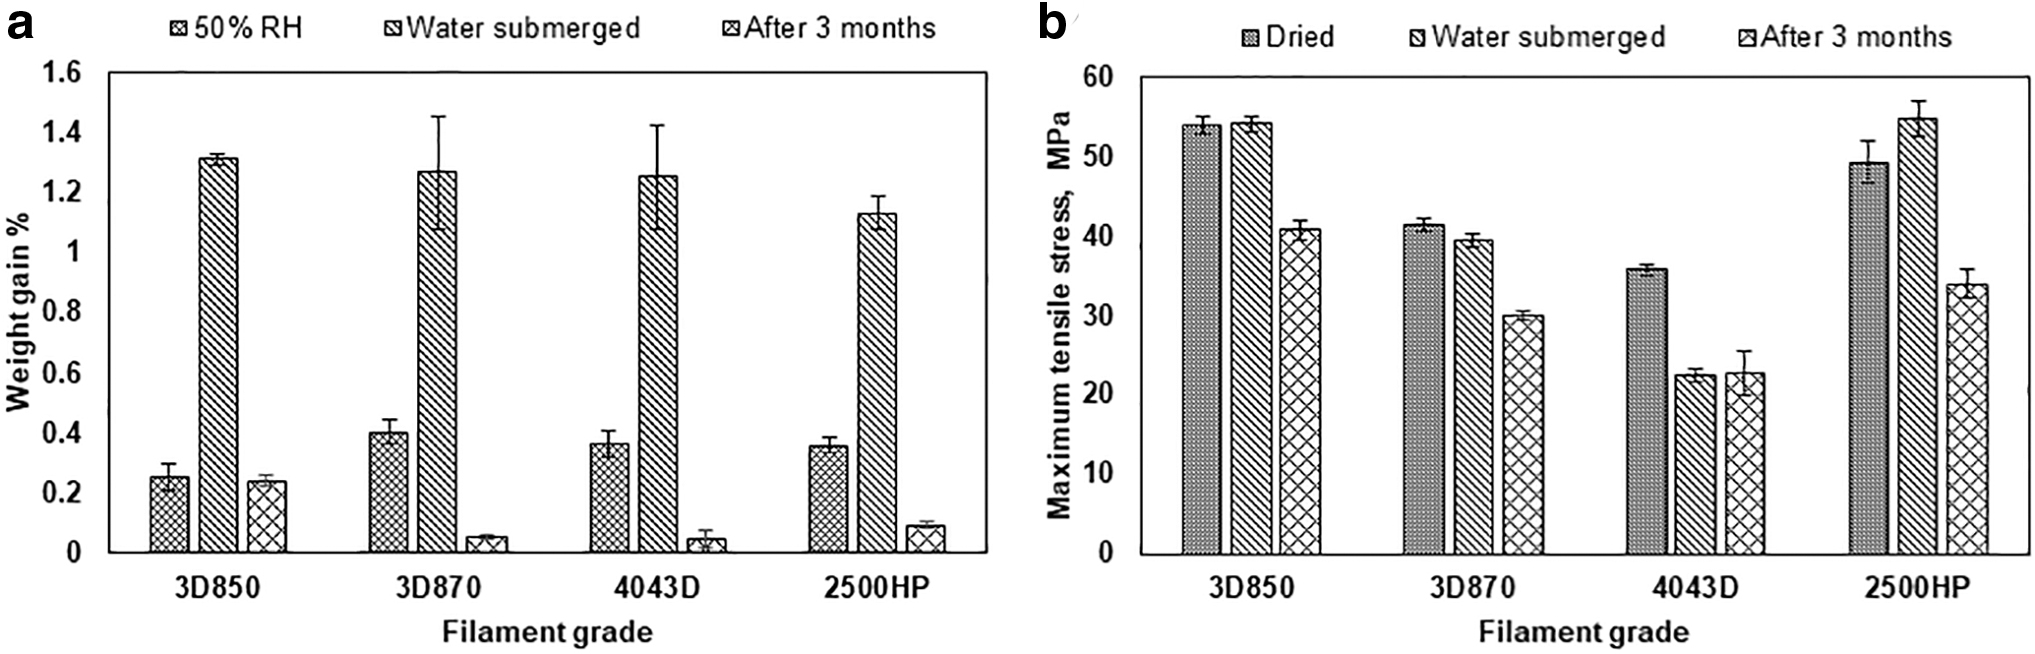
The percentage weight gain of the PLA and PLA/PBS blended filaments after moisture conditioning for 1 week was recorded (Fig. 2a, d). At 50% and 65% RH, 3D870 had the highest weight gain of 0.40% and 0.45%, respectively. 4043D had the highest weight gain of 0.73% at 80% RH and 3D850 gained the most weight in water-submerged conditions. For the PLA/PBS blends, 75/25 filaments gained the most weight in water-submerged conditions.

Tensile properties
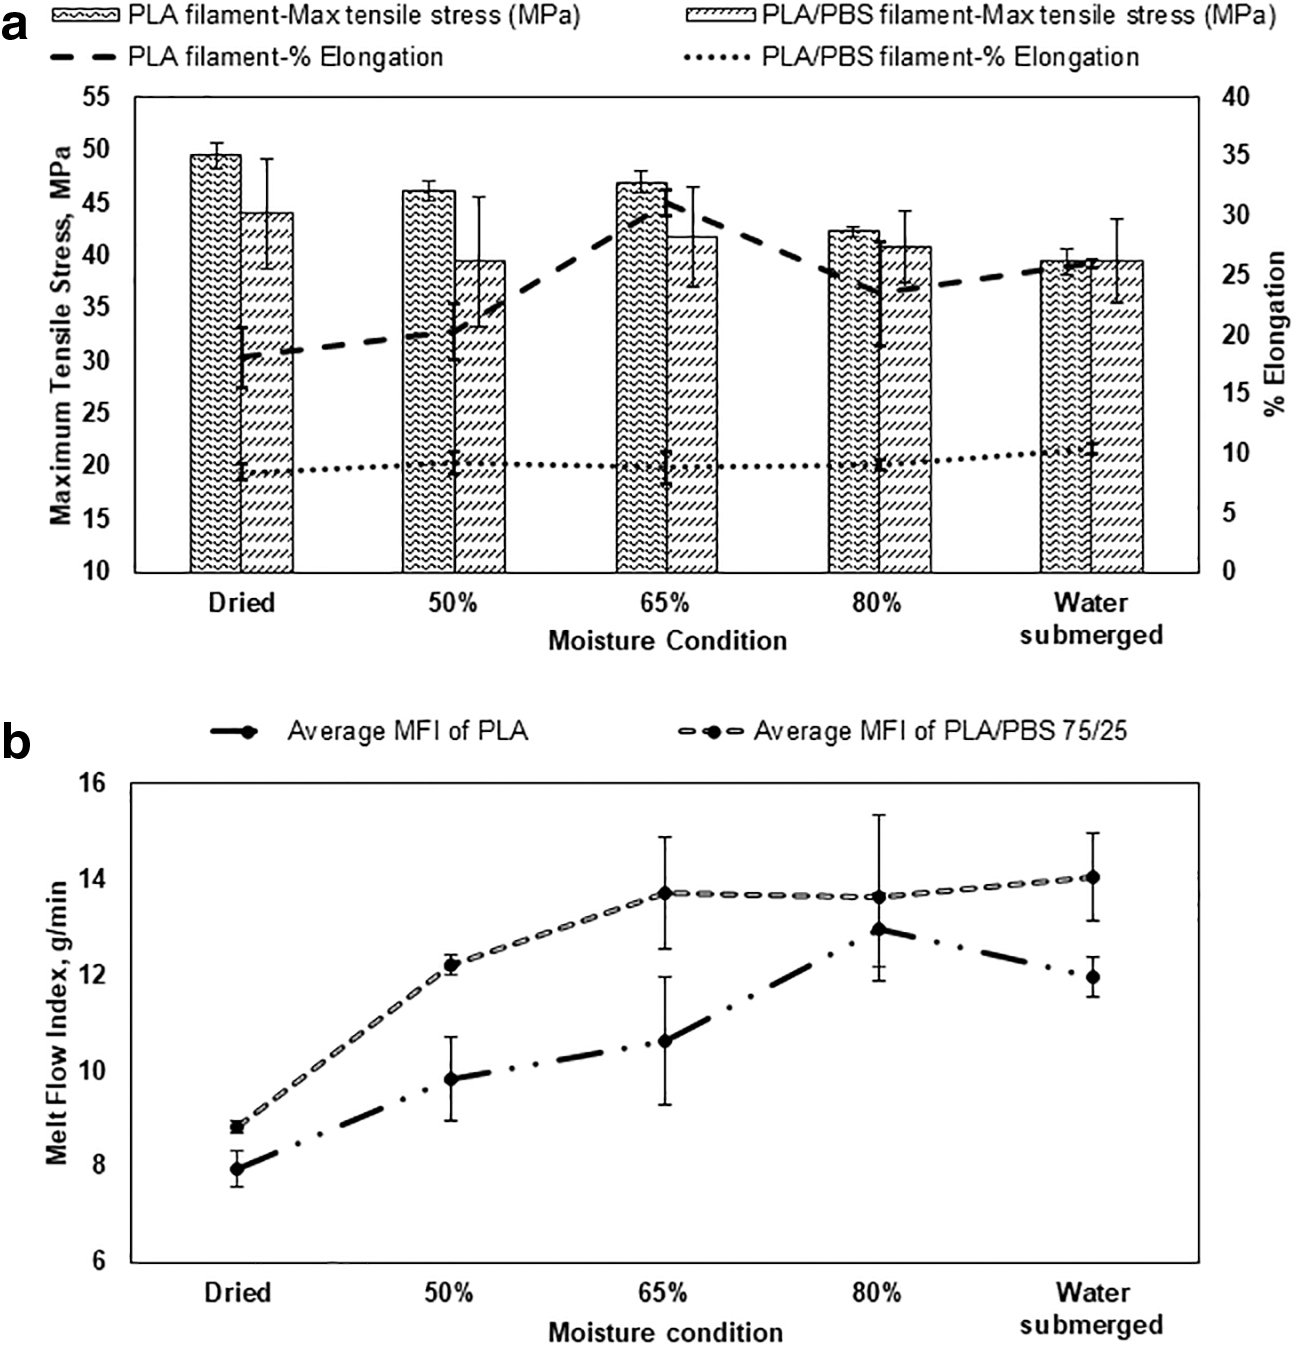
Two-way ANOVA analysis of tensile testing results for PLA samples showed that filament grade, humidity level, and their interaction had a significant effect on both the maximum tensile stress and percent elongation of PLA samples. One-way ANOVA and Tukey post hoc analysis indicated that the maximum tensile stress and percent elongation of only PLA 4043D was significantly affected by humidity level (Fig. 2b, c). Among the four PLA grades, 4043D had the lowest tensile stress and percent elongation values. The average tensile properties of the 4 grades of PLA samples are provided in the Supplementary Table S1. The maximum tensile stress of 4043D samples for dried, 50%, and 65% RH are within a maximum range of 3.73% of one another.
But with 80% RH and water-submerged samples, it reduced drastically. This can also be observed from the stress–strain curve of 4043D (Fig. 3). In 1 week of observation, 4043D was the most resilient against moisture of up to 65% RH. Higher %
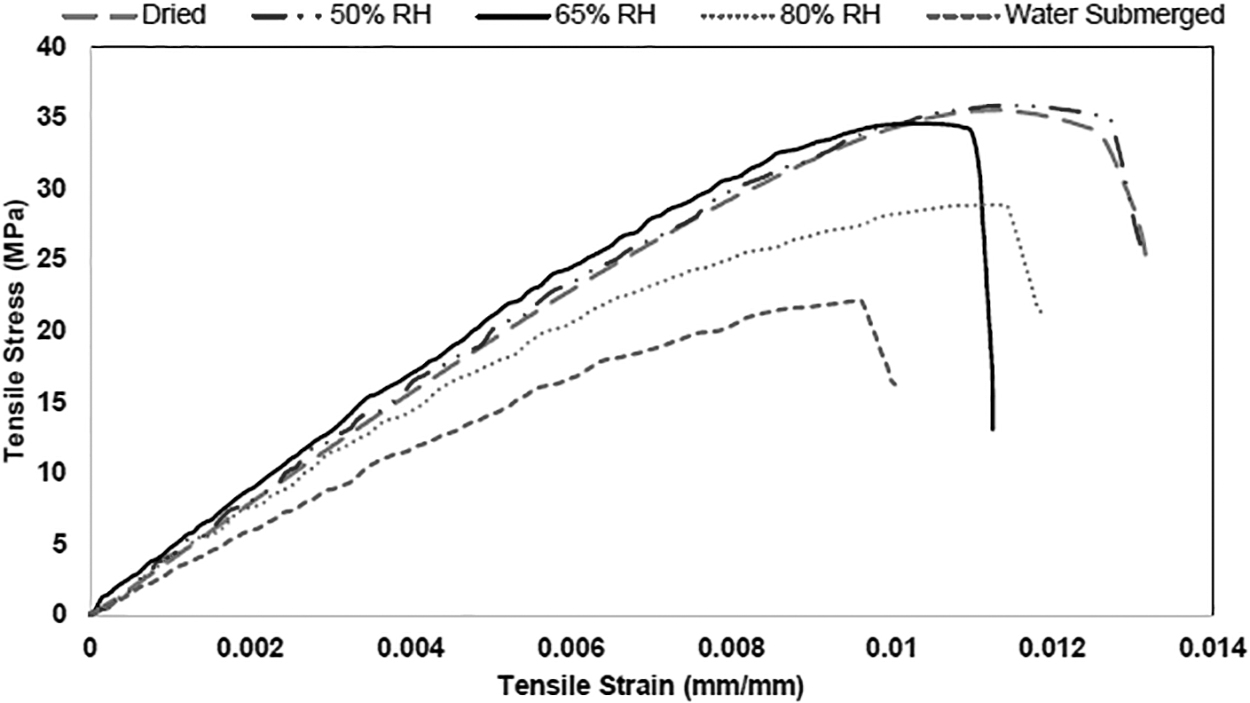
Stress–strain curves of PLA 4043D from different moisture conditions (color figure is available online).
We assume that high %
For PLA/PBS filaments, two-way ANOVA analysis showed that both the material composition, humidity level, and their interaction have a significant effect on maximum tensile stress, but only the material composition has a significant effect on percent elongation. Tukey post hoc analysis showed that the maximum tensile stresses of both PLA/PBS 75/25 and 25/75 specimens were significantly affected by the humidity levels (Fig. 2e). Percent elongation was not significantly affected by humidity levels (Fig. 2f). With the increase of PBS content in PLA/PBS blends, the tensile stress lowered. This reduction in the tensile stress can be explained by the immiscibility and phase separation between PLA and PBS. The stress-strain curves of samples printed from 4 PLA/PBS blend filaments are provided as Supplementary Figures S4–S7.
Several researchers have reported that PLA/PBS blends are not miscible and phase separation happens when PBS content exceeds a certain percentage. Bhatia et al. used modulated DSC to confirm that these two materials are immiscible, but their rheological results displayed compatibility while there was <20% PBS in the blend. 33 Jompang et al. reported that PLA is miscible with PBS when it was added up to 10% with PLA. 34 Deng and Thomas observed co-continuous phase separation in blends having >8.4 wt% PBS and stated that PLA and PBS are thermodynamically incompatible. 35 In our study, we processed PLA/PBS blend filaments containing up to 40% PBS without any visible phase separation issues. But during the FDM of PLA/PBS 25/75 filaments, extreme warpage was observed (Supplementary Fig. S8).
We hypothesize that the phase separation between PLA and PBS is dependent on the material grades being used and could be the reason behind the differences in percent PBS content responsible for phase separation cited in literature. PBS is a ductile material and the increase of PBS content in PLA/PBS samples increased the percent elongation proportionately. Ou-Yang et al. observed a similar trend in percent elongation of PLA/PBS blends. 36 PLA/PBS 25/75 blend filaments exhibited high warpage during 3D printing even after reducing the print speed and cooling rate to a greater extent. This warpage was the result of thermal stress buildup due to shrinkage of volume during cooling. 36 It could be the reason for the high standard deviation and inconsistent trends in mechanical properties of the PLA/PBS 25/75 blend. The average tensile properties of 4 blends of PLA/PBS samples are provided in the Supplementary Table S2.
Fracture surface morphology
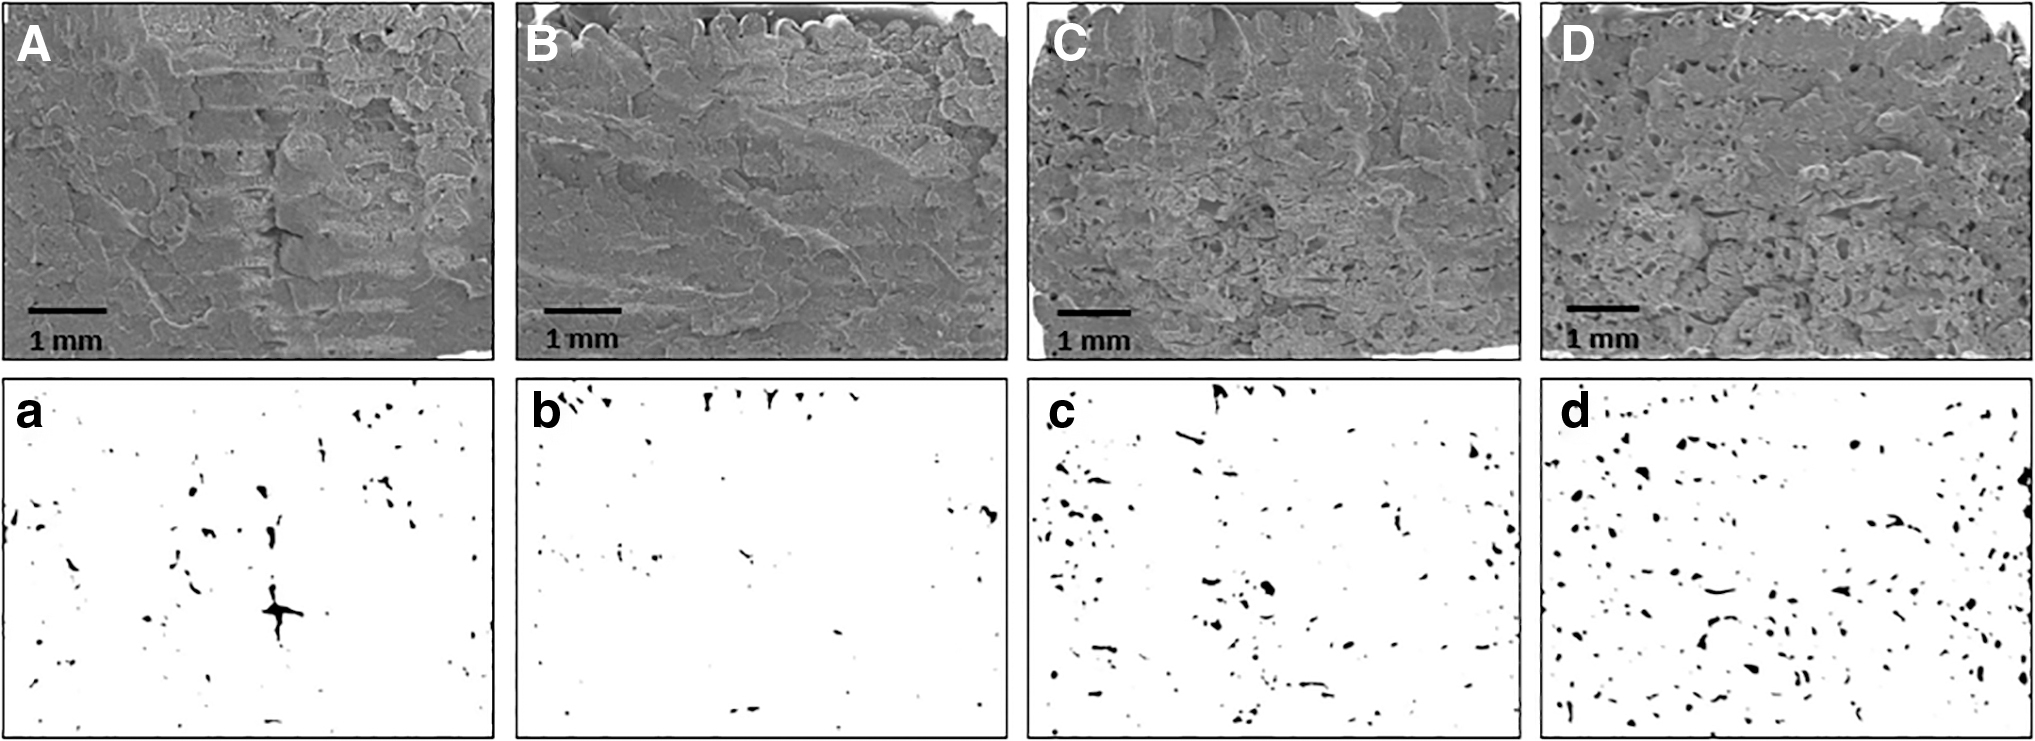
As the tensile properties of PLA 4043D were significantly affected by moisture conditioning, the fracture surfaces of 4043D from four different RH levels were examined through SEM. With the increase of RH, the level of porosity increased in the samples (Fig. 4). Specifically, in 80% RH and water-submerged samples, the porosity content was very high. Moreover, the individual layers were unidentifiable in samples conditioned at an RH of 50% and higher but could be distinctly noticed in dried samples. Zaldivar et al. studied the effect of initial filament moisture on parts printed from ULTEM® filaments and reported increased porosity in the cross section of parts printed from high moisture content (0.40% and 0.80%) filaments.

SEM images of the fracture surfaces of PLA 4043D ASTM samples printed from
Also, they observed a decrease in the viscosity of the material with the addition of just 0.1% water in the filaments and noticed a more compacted cross section. This explains the layer overlapping phenomenon that we observed in our study. 37 Increased porosity resulting from the increase in RH significantly lowered the maximum tensile stress and percent elongation for 4043D. No discernible relationship was observed between RH level and porosity through analysis of the SEM images of the fracture surfaces of PLA/PBS samples (Supplementary Fig. S9).
Porosity measurement in fracture surface
The porosity from the fracture surface images of PLA 4043D subjected to different RH levels was estimated as percent porosity by processing the images using the described algorithm (Fig. 5). The proposed algorithm is susceptible to color gradients across the image. The threshold value for identifying the pores was set by using a trial-and-error procedure till the most accurate approach was finalized. For example, in the processed image of the dried sample, a relatively large area was captured as porosity, but in actuality that might be due to the nature of the fracture in the visualized plane.
Percent porosity estimation through SEM image processing of PLA 4043D fracture surfaces;
While capturing a 3D surface as a two-dimensional image, the height differences of the planes in the fracture surface may create a false positive visualization of a porosity-like defect. Leveling the fracture surfaces through polishing before image processing could be an approach to identify the pores more accurately. The algorithm could be further improved by using machine learning on a large data set and training the program to detect pores more efficiently and accurately.
Print surface characterization
Tukey post hoc analysis of surface roughness values from PLA samples showed that only the surface roughness of 4043D was significantly affected by different moisture conditions (Fig. 6a). It can be noticed that the roughness of the 50% and 65% RH samples is much lower than all the other samples. This could be attributed to the MFI of the filaments during FDM. With the increase of RH to 50% and 65%, the MFI of the molten polymer increased, which is explained in the following section. The higher MFI might have caused the deposited material to flatten a little more than the original elliptical shape during deposition and produced lower roughness values. 38 The exposure to the high RH of 80% and water-submerged conditions have increased the MFI further (Fig. 7b) and caused the material to flow quicker. As a result, the polymer might have been deposited erratically creating uneven surfaces, which yielded higher surface roughness values.
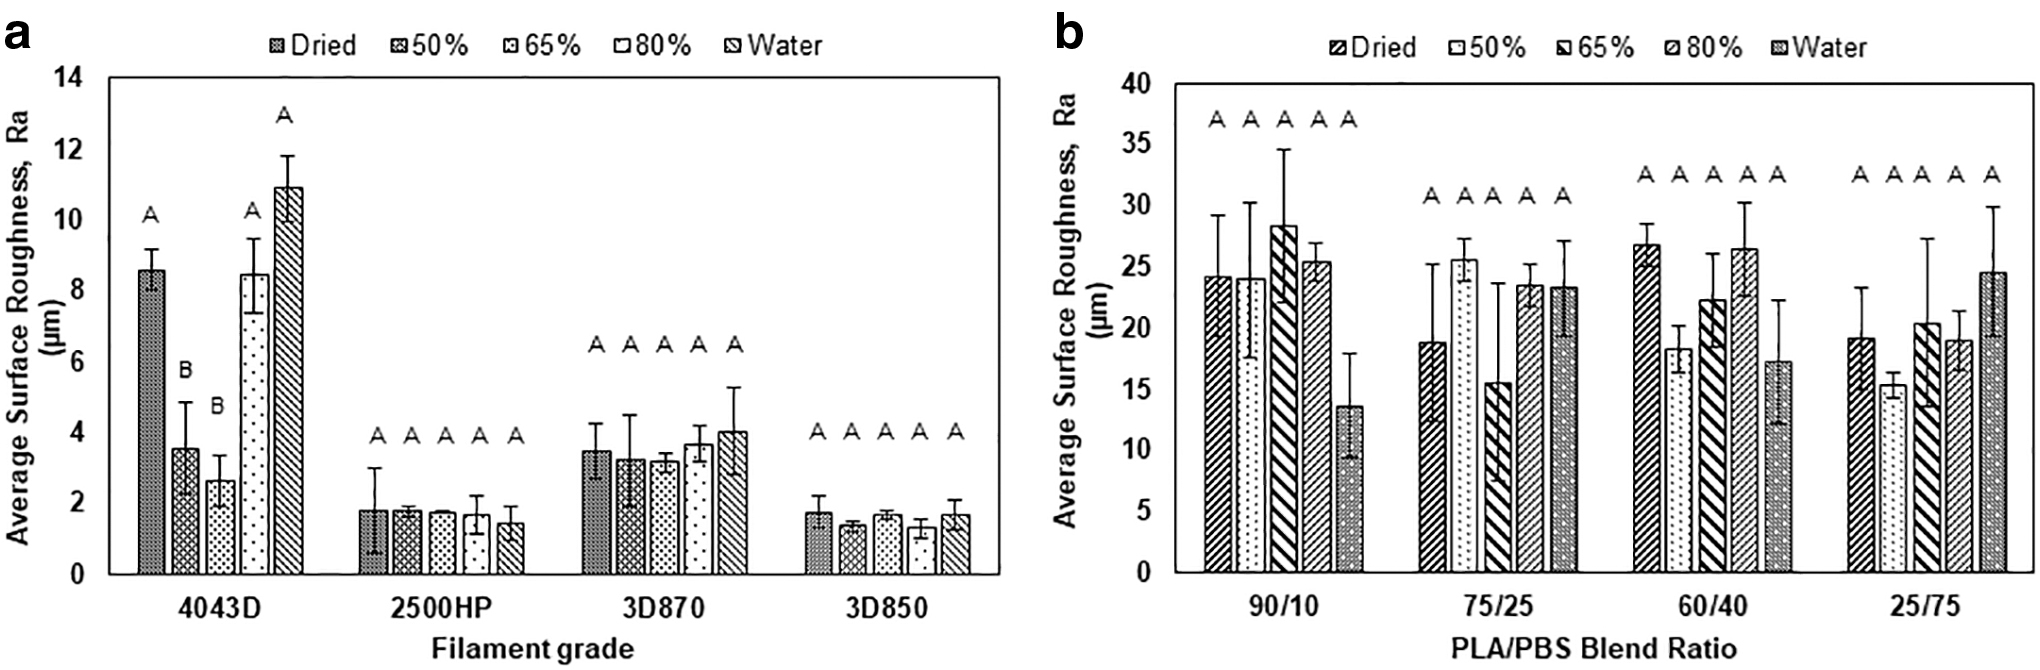
Average surface roughness of
Tukey post hoc analysis of the surface roughness from PLA/PBS blend samples showed that they were not significantly affected by the different humidity levels (Fig. 6b). Also, the surface roughness of PLA/PBS samples is much higher than PLA samples. As PLA and PBS are both semicrystalline and thermodynamically immiscible at higher %PBS in blends, the higher surface roughness observed in the blends may be due to the difference in crystallinity after phase separation during cooling.
Filament tensile test and melt flow indexing
The maximum tensile stress of 4043D moisture-conditioned filaments reduced with increased moisture condition and the percent elongation increased (Fig. 7a). There were no major differences in the strength of the PLA/PBS 75/25 moisture-conditioned filaments. This could be because of the diameter variation of laboratory-made PLA/PBS filaments. But the percent elongation increased with the increase in moisture.
The effect of moisture on the melt flow behavior of the polymers was determined through MFI testing. The MFI of both of the materials increased with an increase in RH (Fig. 7b). Similar observations were recorded by Zaldivar et al. where the MFI of ULTEM 9085 was increased by 1 g/10 min from control specimen to 0.20% moisture content specimen. 37 In general, the MFI of 4043D increased with moisture with an exception of water-submerged samples. But this value was within the standard deviations of the 80% RH MFI and can be attributed to the machine's inaccuracy. PLA/PBS 75/25 filaments had higher MFI than PLA and an upward trend was observed. Through the observed MFI results, the surface roughness discrepancy of 4043D explained through our hypothesis regarding the role of MFI on the roughness values is proved.
Effect of prolonged moisture exposure
The weight gain percent of the filaments after 3 months in room condition is minimal, but its effect on the tensile stress was very significant (Fig. 8). Apart from 4043D, the maximum tensile stress of the other grades decreased to a larger extent. This shows that storing filaments in room condition for a long period reduces the tensile stress of the printed parts drastically even if the absorbed moisture content is insignificant. We hypothesize that over this longer duration of exposure to environmental moisture, the core structures of the polymer chains hydrolyzed, weakening the capability to deliver maximum part strength in FDM. In addition to that, it also shows that placing filaments in high RH for 1 week would result in high weight gain. But the high weight gain might not affect the tensile property of samples in the same way for all grades of filaments.
Comparison of
Drying and storage
From the results presented earlier, it is evident that up to 65% RH, the tensile stress variation was minimal in the moisture-conditioned ASTM samples. For PLA 4043D, at or >80% RH, the impact of moisture on maximum tensile stress was extreme. For the PLA/PBS 75/25 blends, the moisture conditioning >50% RH lowered the strength to a higher extent. The percent elongation of filaments, as well as MFI after moisture conditioning, displayed an upward trend with increased moisture for both 4043D and 75/25 blends. Based on these observations, it is our recommendation to store the filament spools at room condition (25°C/50% RH) to ensure standard quality in printed parts. The filaments could be stored in room condition for up to 7 days before drying is needed again.
As for drying, we completed a reverse drying experiment where a set of 4043D filaments were first dried completely and then conditioned at various RH levels. The weight before and after conditioning was recorded. The conditioned filaments were then dried again (Table 1) and checked for weight loss after specific times have passed. It was found that >90% of the gained weight was lost after the drying took place for the prescribed duration. Hence, the manufacturer-recommended drying temperature and duration were applicable for the grades tested except PLA 4043D. The deformation of 4043D filaments at the recommended temperature forced us to lower the drying temperature from 80°C to 50°C and the reverse drying test proved that our method was effective.
Conclusion
Moisture sensitivity of four PLA filaments and four PLA/PBS blend filaments were studied after conditioning at different RH and testing for tensile, physical, thermal, and flow properties. Tensile testing of PLA samples revealed that PLA 4043D is more sensitive to moisture than other filaments. A high level of porosity was observed in the fracture surfaces of 4043D samples printed from 80% and 100% RH filaments. Surface roughness of 4043D samples exhibited a high degree of variation in response to changes in RH. Among the four PLA/PBS blends, the maximum tensile stress of 75/25 and 25/75 samples were significantly affected by moisture.
The 25/75 blend showed extreme warpage during FDM and proved that PLA and PBS are not thermodynamically compatible with each other at high PBS content. Filament tension testing and melt flow indexing showed that 4043D and PLA/PBS 75/25 were most impacted by moisture. The percent elongation of the filaments displayed an upward trend, whereas maximum tensile stress showed a downward trend with the increase in moisture. The MFI of both materials increased with increase in moisture. Tensile strength of samples printed from 3-month room-conditioned filaments decreased to a higher extent compared with 1-week conditioned samples.
Our study provides researchers, filament manufacturers, and general FDM users with a step-by-step guideline on carrying out moisture sensitivity analysis of materials and the associated experiments to characterize the effect of moisture. In future, mathematical modeling of moisture diffusion behavior could be carried out to predict the diffusion into the filaments. The stereochemistry of polymers after being exposed to moisture for an extended period and the respective effect on various mechanical characteristics could also be investigated.
Footnotes
Acknowledgments
We would like to thank Mr. Leo Klinstein from Dukane Ultrasonics, Mr. Jed Randall from NatureWorks, LLC, and Mr. Bill Reed from Branson/Emerson Ultrasonics for providing guidance and resources to conduct this study.
Authors' Contributions
Methodology, investigation, visualization, and writing—original draft preparation by R.Q. Data curation and software by E.D. Conceptualization and funding acquisition by D.G. Methodology by J.R. Conceptualization, funding acquisition, methodology, investigation, validation, and writing—review and editing by L.K.N.
Author Disclosure Statement
No competing financial interests exist.
Funding Information
This study was supported by a grant from the NSF-IUCRC Center—Center for Bioplastics and Biocomposites (CB2)—CB2/NSF (Award No. 2113804).
References
Supplementary Material
Please find the following supplemental material available below.
For Open Access articles published under a Creative Commons License, all supplemental material carries the same license as the article it is associated with.
For non-Open Access articles published, all supplemental material carries a non-exclusive license, and permission requests for re-use of supplemental material or any part of supplemental material shall be sent directly to the copyright owner as specified in the copyright notice associated with the article.