
Abstract
Selective laser sintering (SLS) is a powder bed fusion additive manufacturing process that uses polymer powders to produce functional parts directly from digital 3D models. SLS supports small- to medium-batch fabrication of customized products for various end-use applications. These parts can be used as tooling to support conventional manufacturing and inspection where mechanical and tribological behaviors are important. This article evaluates the friction behavior of parts fabricated by SLS polyamide (PA12) and glass bead-filled polyamide (PA-GF) materials. Pin-on-Disk tribometer was used to characterize the behavior in dry sliding conditions with part build orientation, load, and speed as factors. Taguchi's approach and analysis of variance are used to quantify the influence of these factors on the friction coefficient. Both materials show reduction in friction coefficient with the increase in load; on the other hand, an increase in speed affects adversely. However, the influence of part orientation is comparatively lesser than the other two factors considered in this study. The debris, pin, and disk wear surfaces were examined to learn wear mechanisms. It is observed that surface porosity resulting from the fabrication process plays a significant role in friction behavior. The glass beads in PA-GF material function as reinforcement against load and influences the friction behavior. Low friction and wear characteristics make both materials as a prospective contender for tooling application.
Introduction
Additive manufacturing (AM)
Selective laser sintering (SLS) is one of the powder bed fusion AM processes, where parts are fabricated by selectively sintering the powder with a CO2 laser based on the 3D model data. As the unmelted polymer powder supports the sintered parts, the fabrication of complex parts with integrated functionalities becomes more viable. 10 Furthermore, the advantages of digital manufacturing, design freedom, and reliable mechanical properties can support the small- to medium-scale production of functional parts. These parts could be subjected to various environments that demand strength, stability, and resistance to wear.
The parts produced from the SLS process exhibit varied surface topography due to stairstep effects, orientation, layer-by-layer manufacturing process, etc.11,12 The part orientation of the AM part was focused to characterize the tribological properties and reported anisotropy.12–15 PA12 exhibits low wear on the face parallel to the build plane, whereas at 45° orientation, the wear rate varies with the change in raster direction to the movement of the disk. 12 Although polished PA12 parts demonstrate anisotropic friction behavior, the wear rate was equal for all orientations in the sandpaper abrasion test. 15
Reducing the surface roughness of PA12 parts from 15 μm Ra to 0.89 μm by the magnetic field-assisted finishing reduces the coefficient of friction (COF) and wear rate. However, the surface roughness of 2.85 μm Ra achieved through precision grinding results in higher COF and wear. 16 The change in surface roughness of the counter surface from 0.5 to 3 μm Rz changes the adhesive wear to abrasive wear, 12 and the COF increases with an increase in the sliding speed. 14 COF was reduced from 0.3 to 0.1 by adding molybdenum disulfide (1% wt.) to PA12; also, it increased the time to achieve the maximum COF. 17 PA-GF also exhibits anisotropic wear behavior. A 45° orientation shows the maximum wear, while 90° shows the lowest wear. 18 The temperature generated at the contact area is also known to impact the tribological behavior of PA12 and PA-GF.12,13,18
The applications of polymers have grown significantly in recent years, owing to a focus on weight and cost reduction. Many authors focused on characterizing and optimizing mechanical properties,19–21 dimensional tolerance, 22 and surface quality11,23 of parts fabricated through AM. Still, an in-depth understanding of tribological properties is essential for the widespread adoption in applications involving metal–polymer interactions such as tooling, inspection fixtures, work holding devices, etc.
Hence, this study focuses on characterizing the friction coefficient of PA12 and PA-GF materials with the statistical design of experiments. The friction coefficient has been assessed using the Pin-on-Disk tribometer under dry sliding conditions. Based on the literature, part build orientation, load, and counter surface speed were chosen as factors. Taguchi's methodology was used to achieve meaningful results with few experiments. Analysis of variance (ANOVA) was used to estimate the most important parameters influencing the friction coefficient. Then wear surface was inspected with a microscope to explore the interaction between contact pairs and the principal mechanism involved.
Fabrication
A cylindrical pin test specimen with a diameter of Ø8 mm was designed with Autodesk Fusion 360 and converted as an STL file with the following parameter: refinement medium and its corresponding options are surface deviation = 0.008125 mm; normal deviation = 15; maximum edge length = 51.26402 mm; aspect ratio = 21.500. The cylindrical pin test specimens for the wear test were fabricated by SLS technique (P396 from EOS GmbH) using PA2200 (polyamide, PA12) and PA3200GF (glass bead-filled polyamide PA-GF). During the data processing stage, the specimens were orientated at 0°, 45°, and 90° to the build plane, as shown in Figure 1. The up-skin, down-skin, hatch, and contour areas in a typical specimen cross-section resulting from orientation are indicated in Figure1. Refreshing the recycled powder with fresh powder is necessary for consistent part quality in the SLS process. 24 The refreshment ratio of 30:70 and 70:30 was used in this study for PA and PA-GF, respectively.
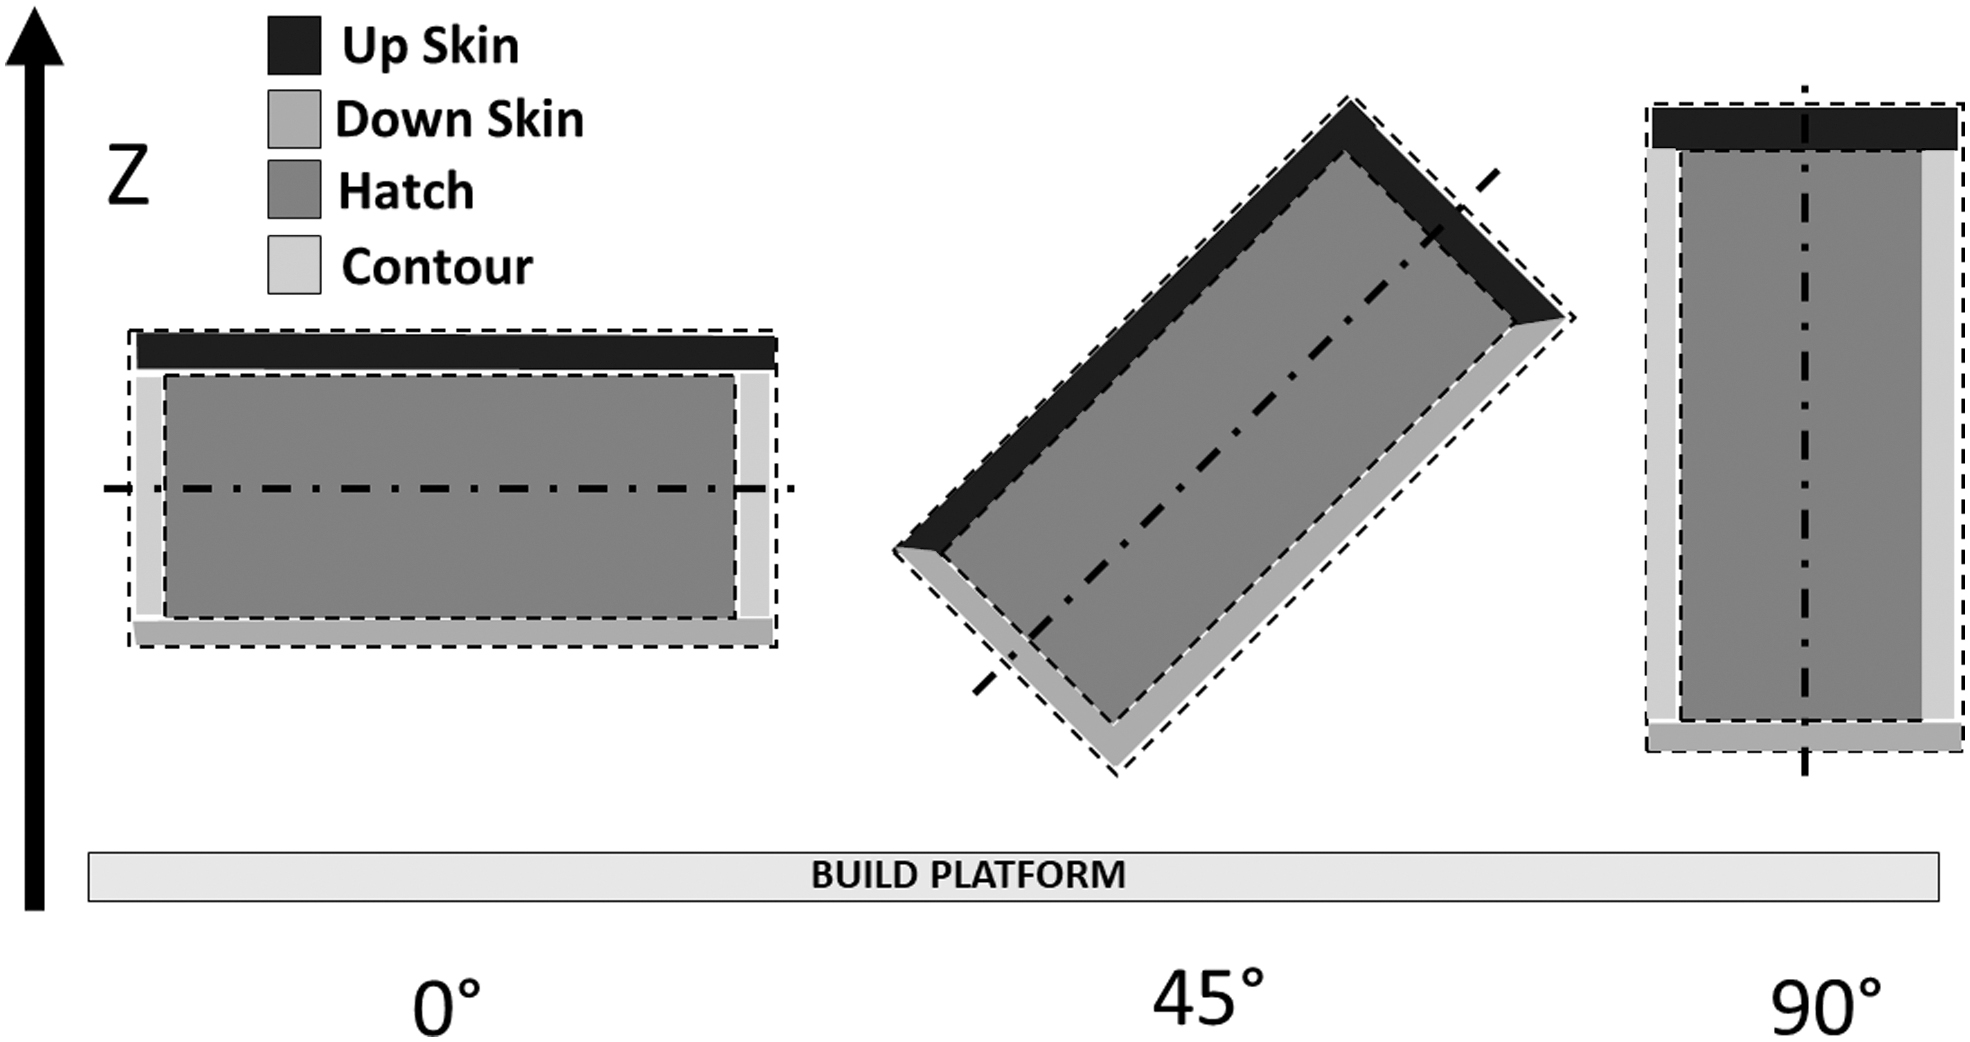
Schematic view representing the exposure strategy regions resulting from orientation.
The process chamber temperature was 171°C and 172°C for PA and PA-GF, respectively, which arrived through the standard procedure. The parts are built with default parameters for both materials with a layer thickness of 120 μm. Postprocessing steps such as unpacking and shot blasting were followed to remove loose powders adhering to the fabricated parts. As the orientation could result in varied surface topology, 11 which could directly affect tribological behavior, secondary postprocessing operations that alter the fabricated pin surfaces were avoided.
A contact-type surface profilometer (SE3500 from Kosaka Laboratory) is used to measure the surface roughness of the fabricated specimens as per ISO 4287 standard. The most commonly used surface roughness parameter, arithmetic average Ra, is followed in this study.
Tribotest
The Pin-on-Disk tribometer (manufactured by wear and friction equipment) 25 is used to assess the friction properties of the fabricated specimens. The Pin-on-Disk tribometer setup is shown in Figure 2. The contact occurs at discrete spots when two flat surfaces are brought into contact. As these surfaces move against each other, a frictional force is generated resisting the motion. 26 The frictional force generated was measured with a load cell, and the friction coefficient was calculated based on the ratio of frictional force to the applied normal load (Eq. 1).
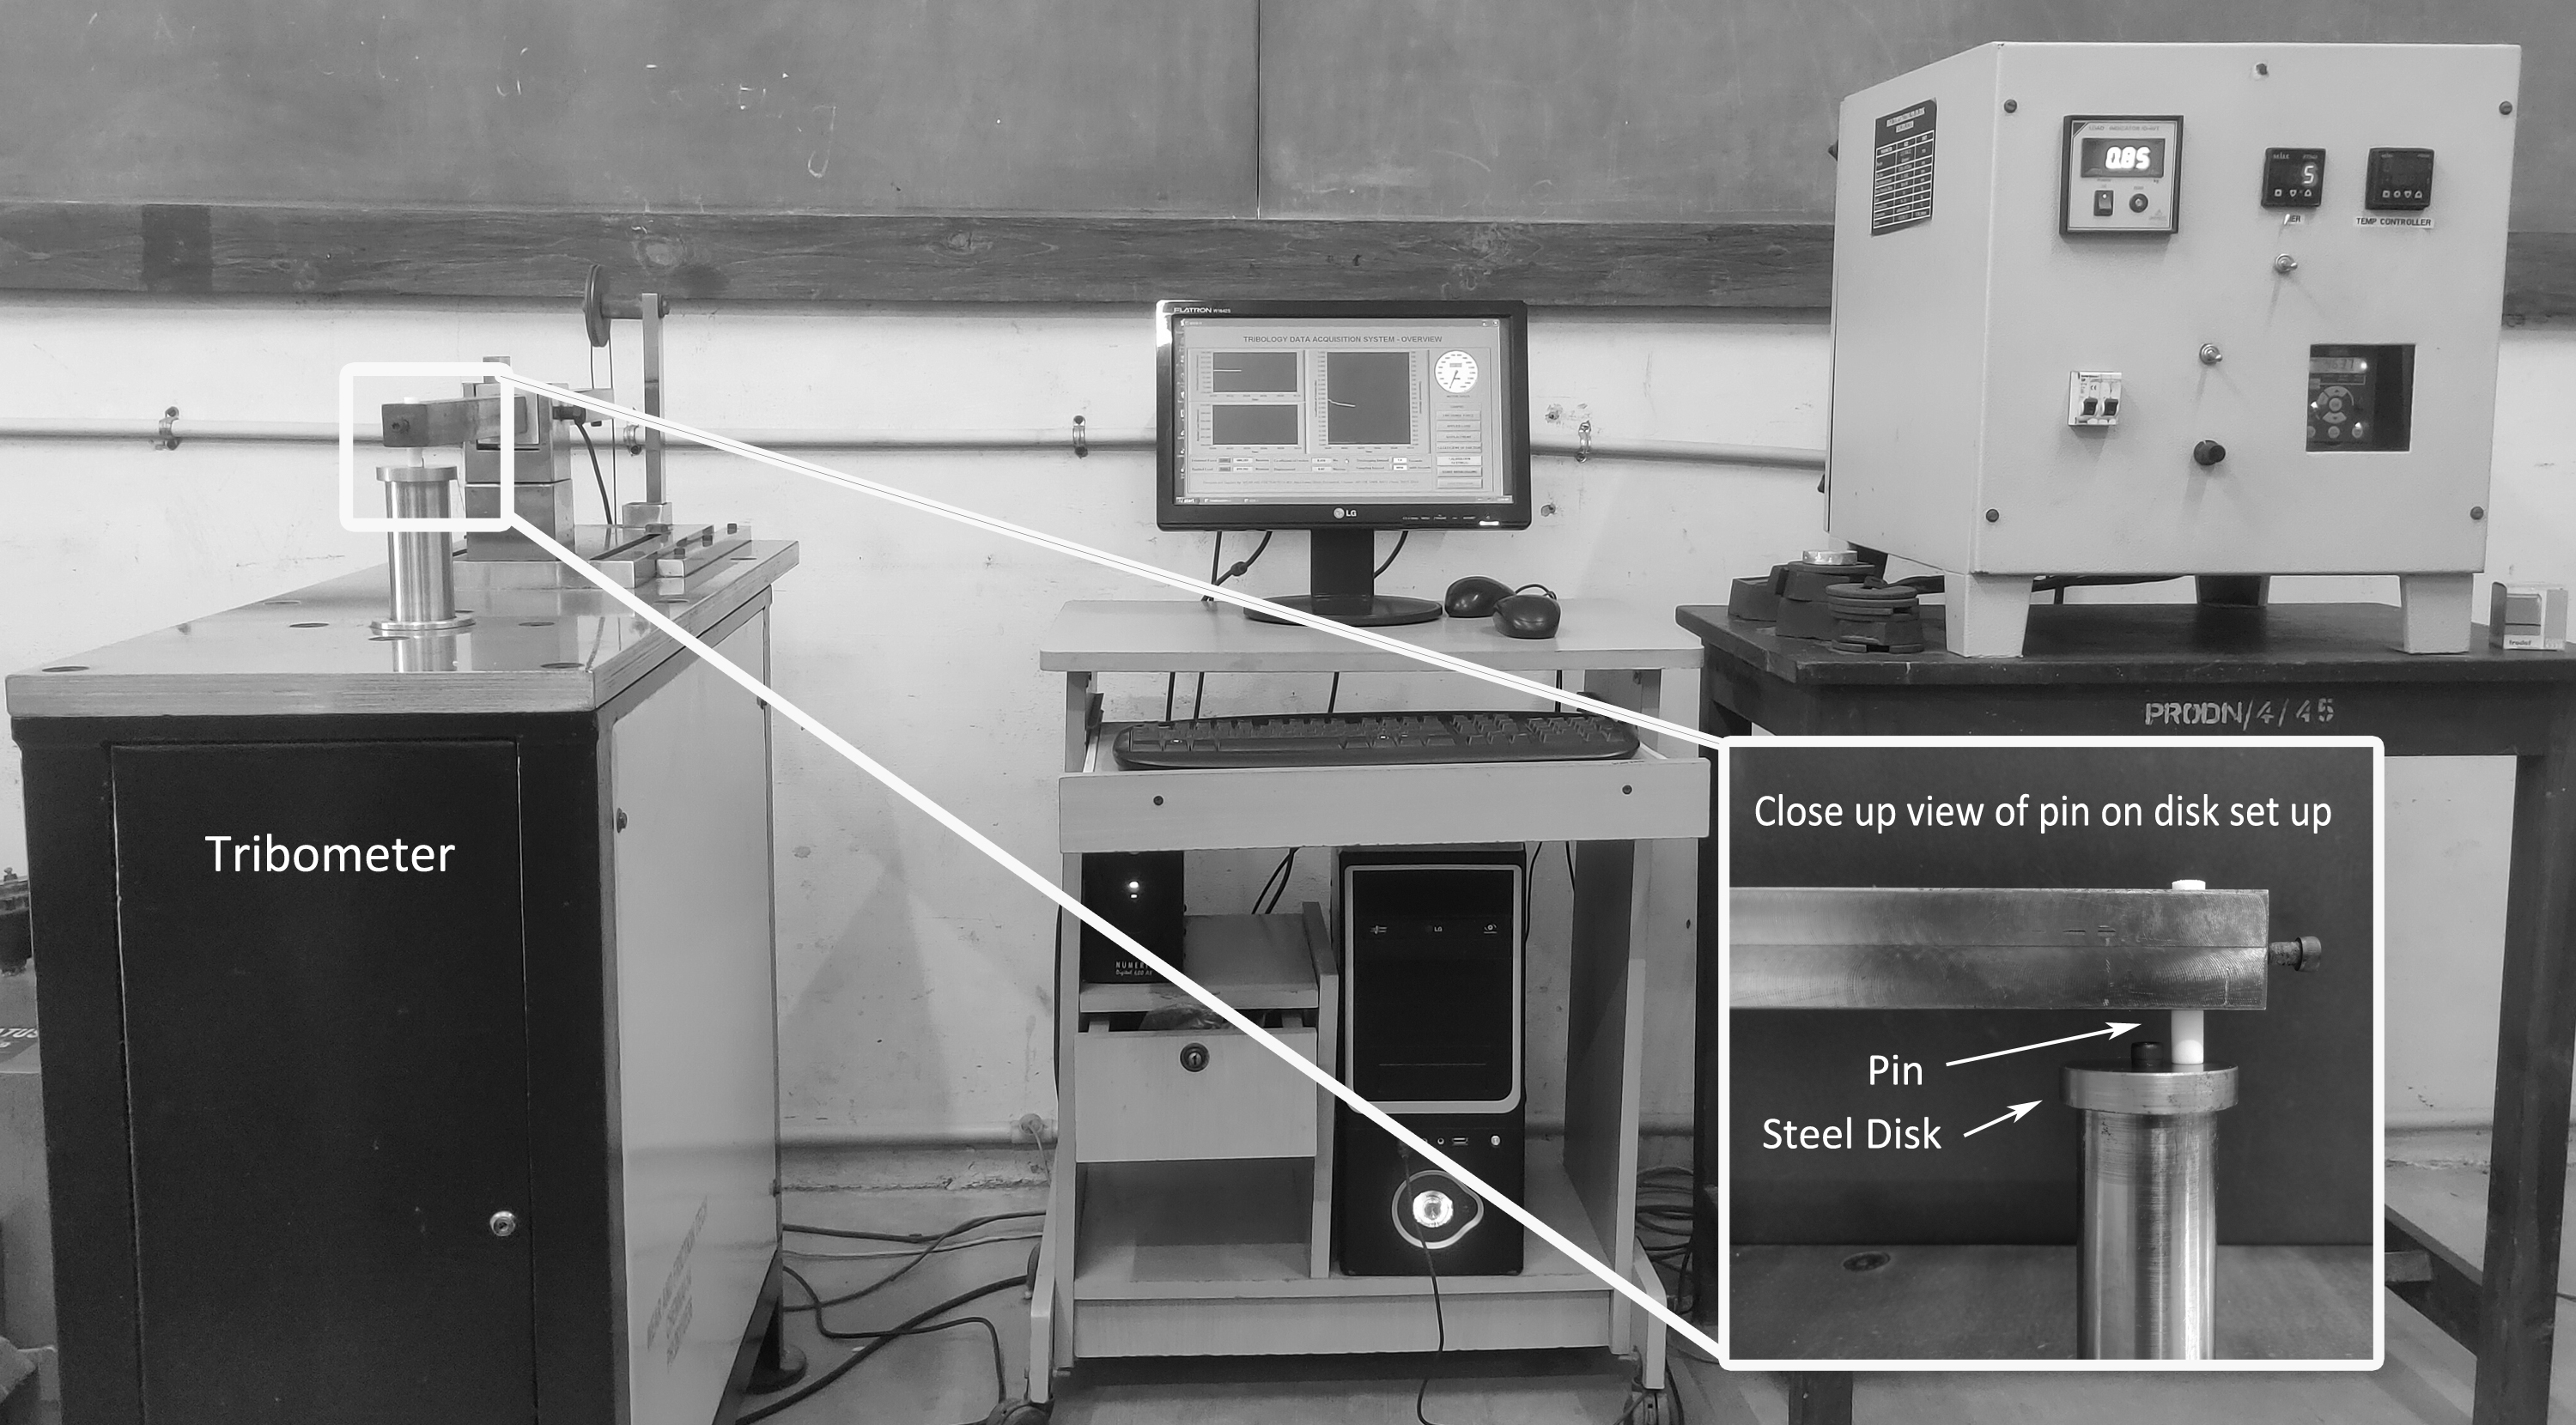
Pin-on-Disk setup.
Where f = coefficient of friction, Fr = frictional force, Fn = normal force
The flat end face of cylindrical test specimens was held against the EN31 hardened steel disk of surface roughness Ra 0.6 μm. A run-in distance of 500 m was given to ensure proper contact between the contact pair, and then the friction coefficient was evaluated for 2.5 km. The experiment was conducted at room temperature, and the temperature of the disk near the contact area was measured at regular intervals using a handheld, noncontact infrared thermometer. The disk and the pin surface were cleaned by flushing with isopropyl alcohol and then dried in a clean environment to remove oil, dirt, and other contaminants before testing.
Results
Surface roughness
Surface roughness was measured at both flat faces of the cylindrical pin specimens. While the difference at both ends of the 0° specimen was negligible, the specimens fabricated with 45° and 90° orientation show considerable difference in surface roughness (Ra) as presented in Figure 3. The 45° orientation exhibit a higher surface roughness, whereas the 90° specimen shows a lesser Ra value for both materials and this result agrees with the previous studies. 27
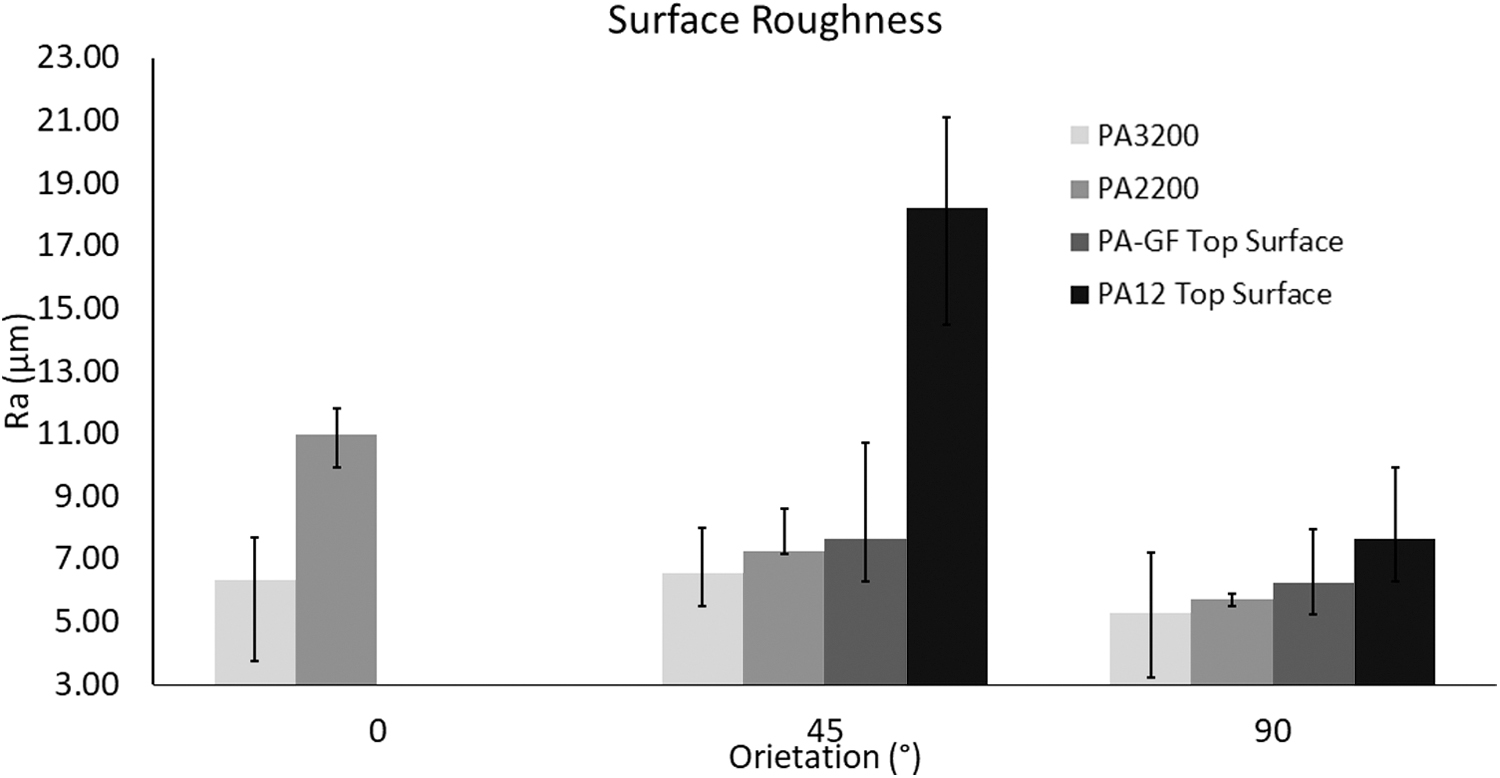
Surface roughness with respect to orientation.
The coefficient of friction
The friction coefficient and the maximum temperature recorded by the infrared thermometer during each experimental run are shown in Table 1 for both materials. The most influential factors in Taguchi's method are determined by a signal-to-noise ratio (S/N), where the term “signal” represents the desired target and “noise” represent the undesirable value. Based on the statistical analysis, each factor was ranked, and the S/N ratio mean was plotted individually for each material (Fig. 4) with “smaller-the-better” characteristics. For PA12 material, the influence of load is more significant, followed by speed and orientation on friction coefficient (Table 2). Whereas for PA-GF material, the effect of speed is higher followed by load and then the orientation.

Signal-to-noise ratio means for coefficient of friction of
Friction Coefficient and Interface Temperature Observed for PA12 and PA-GF Materials
COF, coefficient of friction.
Response Table for Signal-to-Noise Ratio of PA12
From the S/N ratio mean plot (Fig. 4), both materials exhibit a reduction in friction coefficient with the increase in load and an increase in friction coefficient with speed. In comparison, the effect of orientation was ranked three and behaved differently for both materials (Tables 2 and 3). ANOVA for polyamide (Table 4) indicates that load accounts for the 75% friction coefficient, followed by the speed, which is only 18.75%. In comparison, speed is the major contributing factor that accounts for nearly 87% for glass-filled polyamide (Table 5).
Response Table for Signal-to-Noise Ratio of PA-GF
Analysis of Variance of Friction Coefficient for PA12
DF, degrees of freedom in the source; MS, the sum of squares due to the source; SS, the mean sum of squares due to the source.
Analysis of Variance of Friction Coefficient for PA-GF
Discussion
In general, adhesion, abrasion, and fatigue were prominent modes of wear mechanism in the polymer material. 28 Geometric shapes like micro dimples, pores, and grooves on the AM parts' surface result in the low actual contact area, debris storage space, and lubricants for sustained lubrication. 29 The SLS process inherently results in a powdery texture that contains micro dimples and pores on its surface. In addition to the low friction coefficient property of the polyamide material, rheological property such as stress relaxation also depends on build orientation,11,30 which could influence the COF.
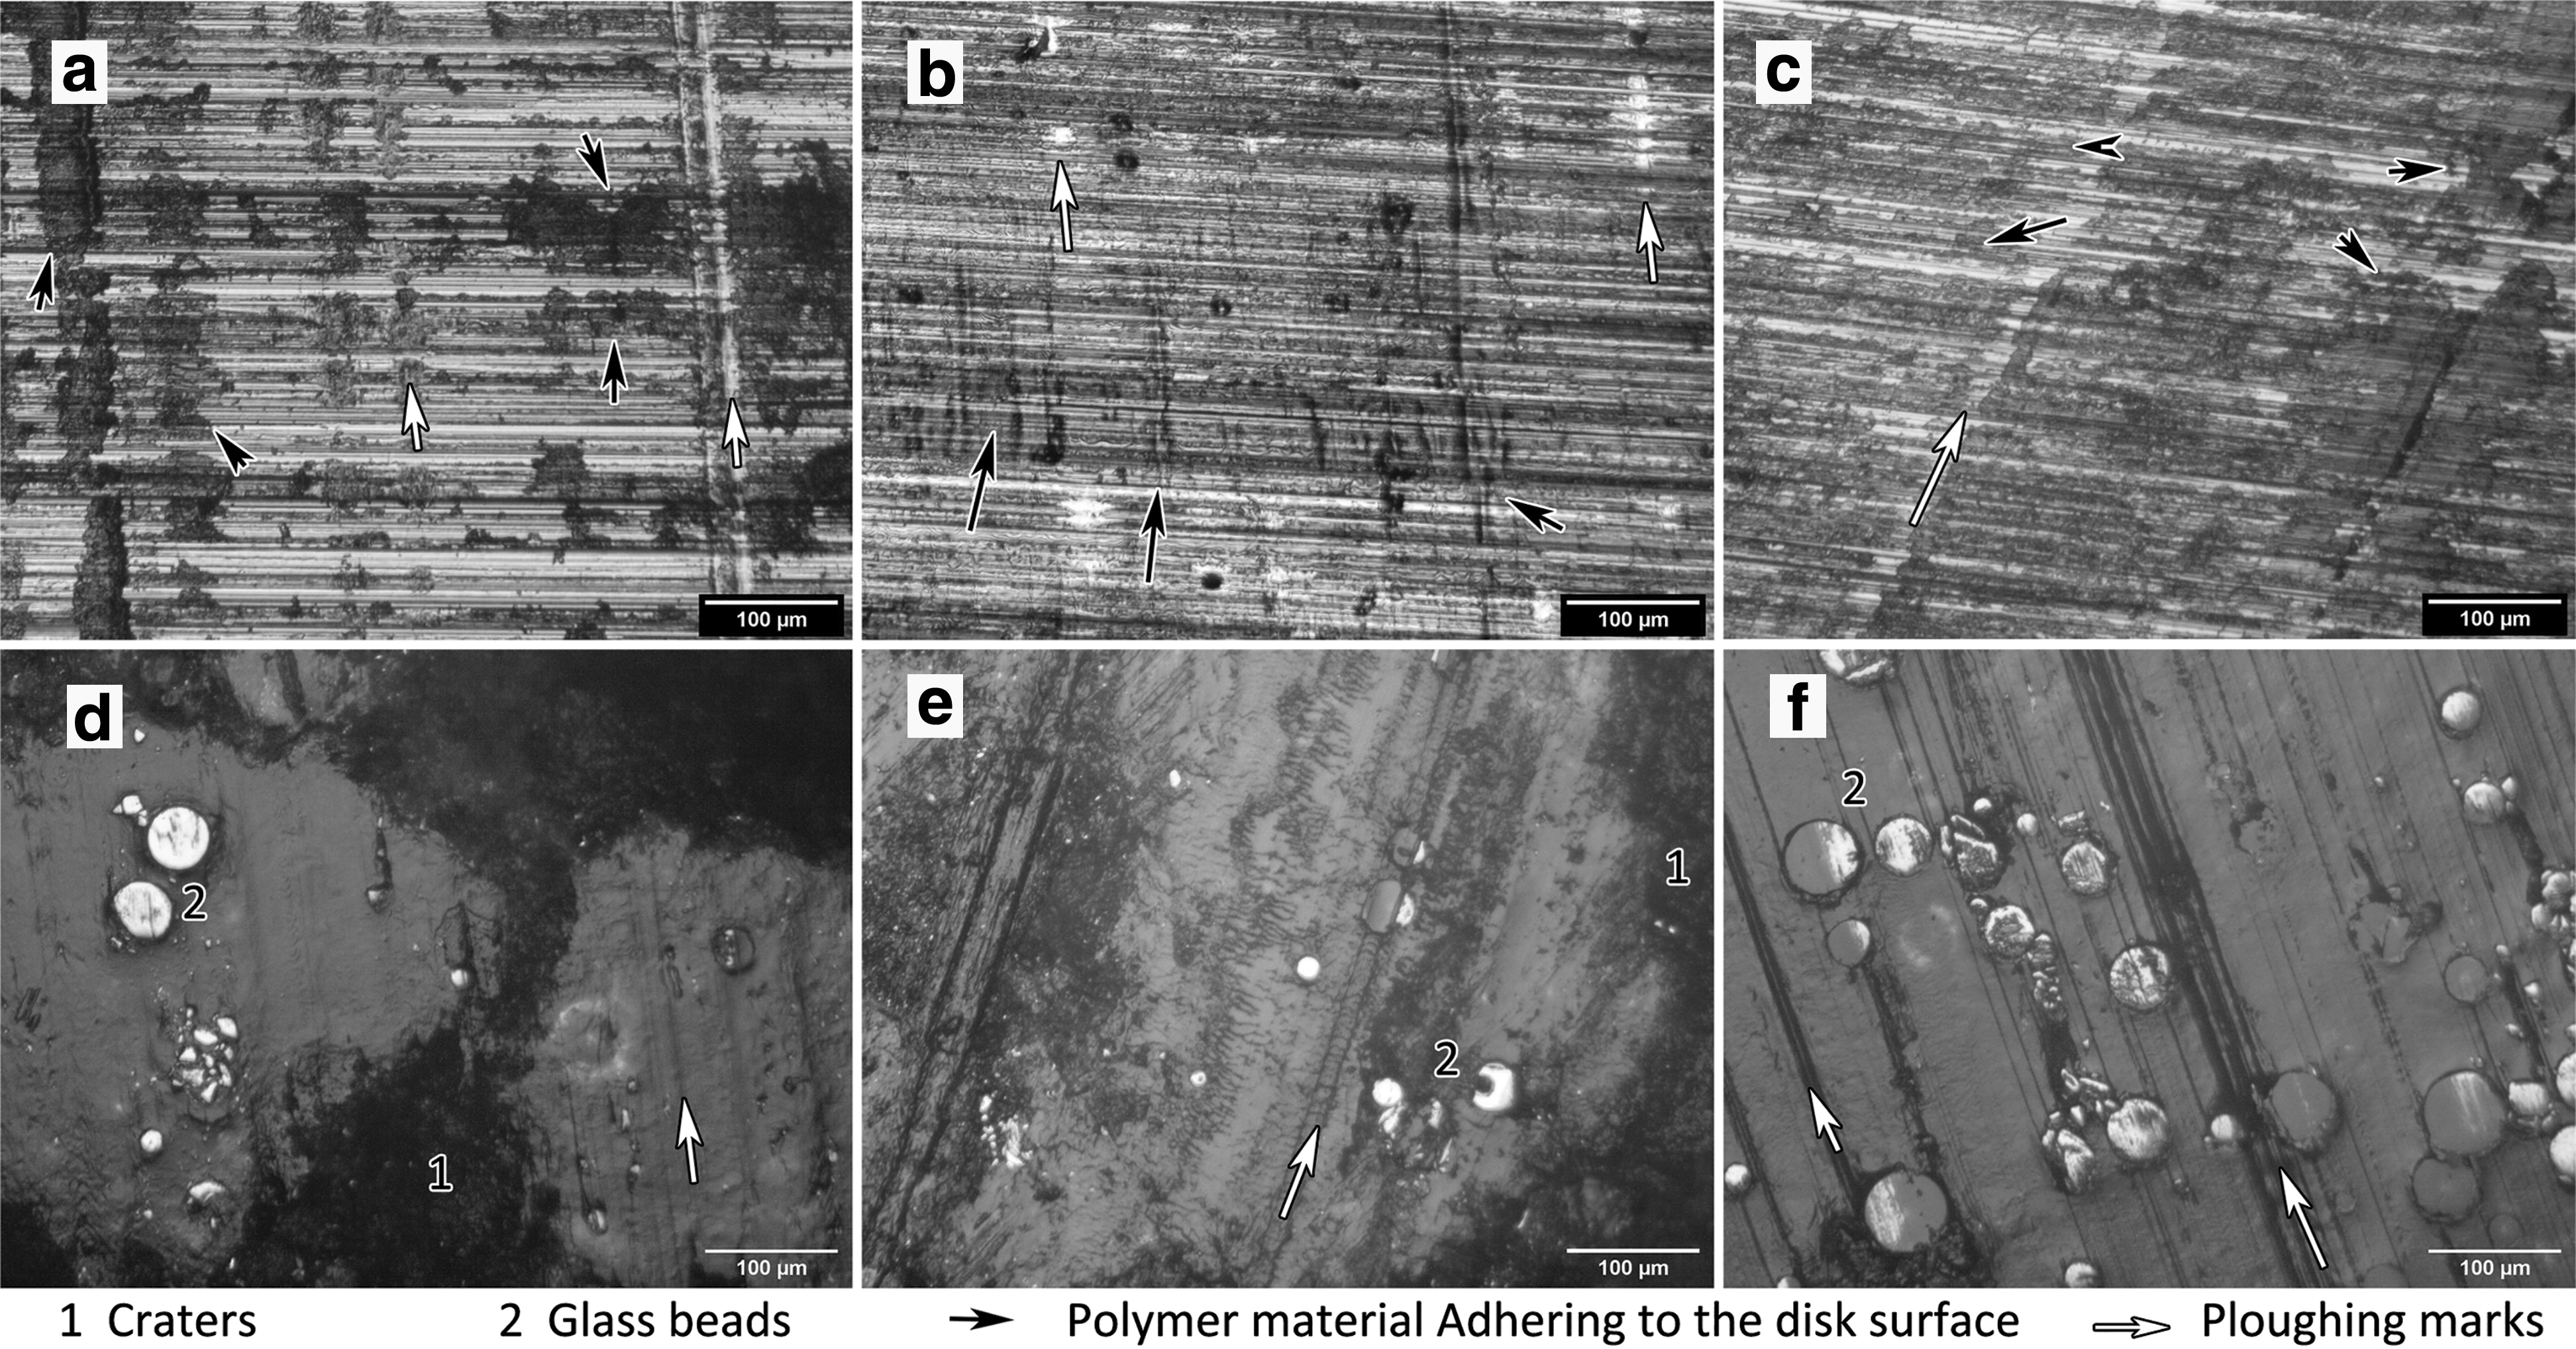
Hence to further understand the effect of each factor, the changes occurring at the interaction surfaces, both pin and wear tracks, were observed with an inverted, upright microscope (Chennai Metco, Metscope 1). The micrographs of the worn-out PA12 and PA-GF pin and corresponding wear track are presented in Figure 5. Where Figure 5a, b and 5c, d represents PA12 and PA-GF pin wear surface, respectively, Figure 5a, c and 5b, d represent 10 N and 40 N load, respectively. Surface craters, plough marks, glass beads, and metal wear debris accumulated at the leading edge of glass beads can be observed on the micrographs (Fig. 5).
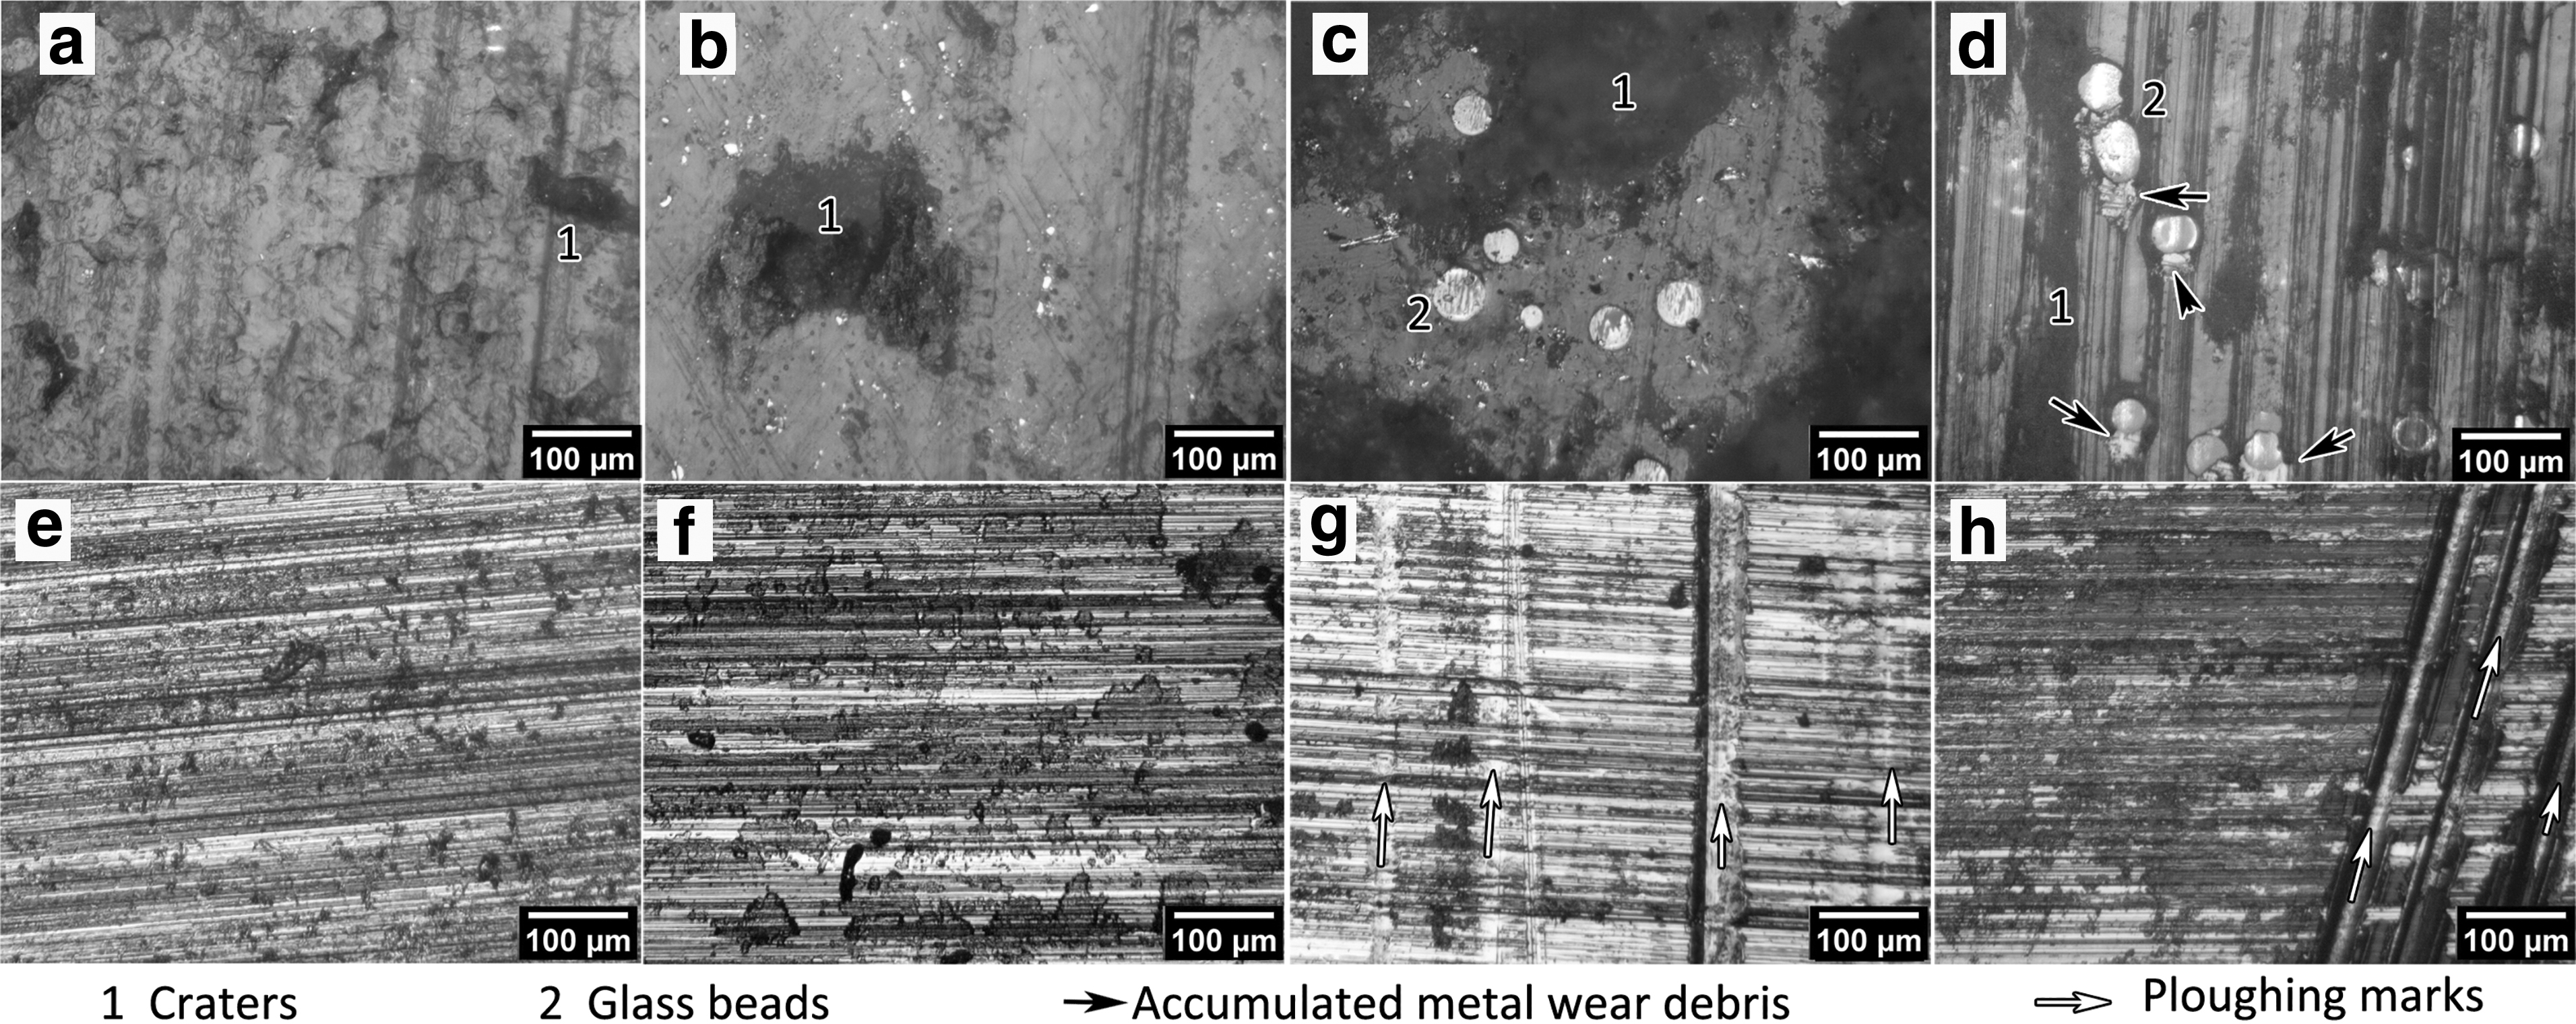
Micrograph of
Effect of load
In a polymer–metal contact, the polymer being a softer material, the actual contact area depends on the applied load. An increase in load causes the material to deform and brings a more significant number of asperities to contact; hence wear increases. 26 In PA12, at 10 N wear on the pin is low such that even partially melted particles remain adhered to the pin (Fig. 5a), as identified by the distinct circular shapes on the worn pin micrographs. As the load increases to 40 N, the depth of craters on the surface gets reduced as the peak points on the surface wear off (Fig. 5b). Similar phenomena were observed in PA-GF, and the number of glass beads exposed to the surface increased with load (Fig. 5c, d). The glass bead function as a microcutting edge and ploughs into the metal surface, producing scouring marks (Fig. 5g, h), which are transferred to the pin surface (Fig. 5d). The metal debris build-up on the leading edges of the glass bead was seen on the pin surface (Fig. 5d) with an increase in normal load.
A comparison of wear track images at 10 N and 40 N shows that increasing the load promotes the formation of the transfer layer. The transfer layer creates a smooth surface, which reduces abrasion and friction load. Even though the glass beads result in ploughing, the polyamide transfer film acts as an intermediate layer reducing the friction coefficient at 40 N load.
Effect of speed
The COF exhibits almost a linear relation with speed, the increase in speed increases COF for both materials (Fig. 4). The surface asperities on the pin surface abrade at a faster rate with an increase in the relative velocity between the contact pairs, resulting in an increase in the real contact area. This increases the interface temperature (Table 1) and abraded particle availability, promoting the formation of the transfer layer. However, a consistent transfer layer at a higher interface temperature aggravates adhesion increasing the COF, which is harmonious with the previous studies. 31
Micrographs of the PA-GF wear track and the corresponding pin wear surface are shown in Figure 6, where adhesion of polymer material to the disk surface was evident. An increase in speed accelerates the wear and exposes more glass beads to interact with the counter surface in PA-GF. The glass beads being hard material prevents the polyamide matrix's wear and results in localized temperature zones. It is evident from the wear track micrographs (Fig. 6a) that an inconsistent transfer layer is formed at 0.5 m/s speed. At 1 m/s (Fig. 6b) combination of the localized elevated temperature regions near the glass beads and the availability of wear particles led to the formation of a molten viscous transfer layer. Whereas at 1.5 m/s (Fig. 6c), further increase in temperature leads to the formation of a consistent transfer layer that intensifies the adhesion. The surface craters were reduced, and the number of glass beads exposed to the interaction increased with an increase in speed (Fig. 6d–f).
Micrograph worn surface of PA-GF pin under
The exposed glass beads plough more profoundly into the disk surface, as evident from the metal debris indicated by red arrows (Fig. 6f) and plough marks (Fig. 6c), resulting in increased friction load.
Effect of build orientation
Although anisotropic tribological behavior was observed with the build orientation, load and speed were significant factors contributing to variations in COF of both materials in the experiment. The inherent characteristics of the SLS process result in varied surface topology due to partially melted powder particles and stairstep effects, which gave rise to craters or porosity on the surface. The upward-facing surfaces exhibit raised edges while the downfacing surface has rounded edges irrespective of the material.12,32 While this effect is most prominently observed in 90° specimens, a similar result can also be observed in all other build orientations. At 45°, due to orientation, the raised edges of every layer increase peak and valley heights on up-skin areas (top surface). Whereas in down-skin areas (bottom surfaces), rounded edges of each layer lead to lower surface roughness values overcoming the stairstep effect as shown in Figure 7.
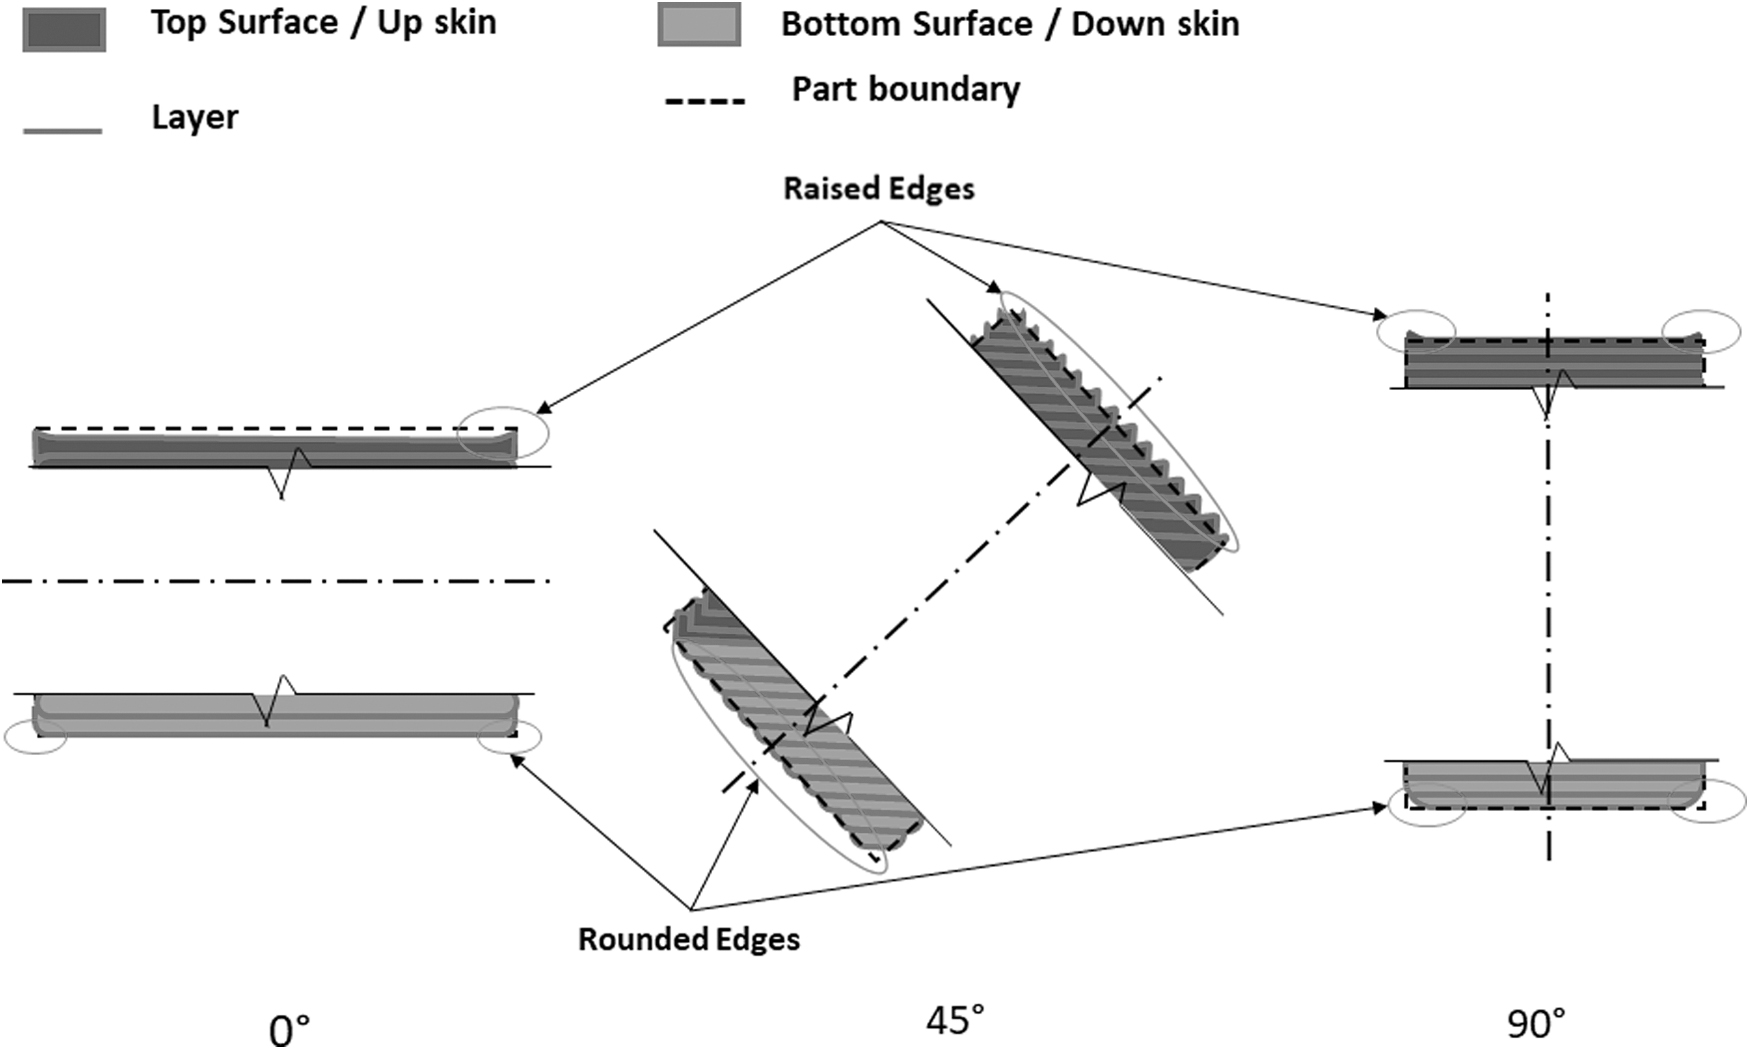
Schematic representation of typical surface topology as a result of orientation.
Thus, part build orientation predominantly controls the real contact area and surface cavities serve as a transitory location for wear debris to accumulate and then dislodge as wear depth increases (Figs. 5 and 6). In general, 0°and 45° build orientation produces discrete and isolated edges for contact that hamper the ability to form a transfer layer by trapping generated wear particles in the craters. Hence, abrasion takes precedence with the specimens exhibiting higher surface roughness. In contrast, 90° build orientation results in random discrete asperities of larger size that promote the transfer layer's formation, reducing COF. Stress relaxation behavior of PA12 is also affected by build orientation, layer thickness, and energy density.11,30 Where 3.5% to 4% of stress reduction happens within 200 s of load application for 0° and 90°, respectively, at 100 μm layer thickness it increases with an increase in layer thickness. 30
Thus, low COF at 90° orientation could be attributed to the stress relaxation arising out of build orientation. The higher refreshment ratio of PA-GF reduced surface roughness in all orientations compared with PA12, as the flowability of the molten polymer plays a vital role in the resulting surface topology24,33 and resulted in lowering the COF.
Debris analysis
The surface of the pin and wear debris of each experimental run were also evaluated under the microscope. The micrographs (Fig. 8) show the presence of particles in the shape of a needle, fiber, chunky, near-spherical, and spherical at different magnifications. The needle-shaped wear debris (Fig. 8a) deposited on the PA12 pin craters represents that they are formed by the rolling action between the contact surfaces. Spherical particles (Fig. 8b) in the range of 10 to 30 microns can be identified in the micrographs of the debris collected from the pin wear surface, confirming the presence of unmelted particles in PA12. In contrast, such particles are hardly observed in PA-GF (Fig. 8f). Figure 8c represents typical fiber-shaped and near-spherical debris formed by rubbing and rolling action between the sliding surfaces. The length of fiber debris ranges from 100 to 900 microns with a sectional length of 5 to 50 microns. The chunky debris formed by the collation of several individual wear particles is presented in Figure 8d.

Wear debris of
In the case of PA-GF material, wear debris is smaller (Fig. 8f) than PA12, and a typical orange powder is observed at the surface cavities (Fig. 8e). Although needle and fiber-shaped debris are less common, they occur with a much shorter length than PA12. The remains of the shattered glass beads assume angular shapes with sharp edges (Fig. 8g), supporting the claim that they function as hard abrasive particles creating ploughing and scratch marks on the wear track resulting in metal debris (Fig. 8h).
The orange-colored wear particles exhibit less coalescence behavior and appear as individual particles. The reduced coalescence behavior of translucent orange particles indicates they are formed due to high temperature and oxidization. 24 It can also be observed in debris, translucent white particles that appear along with the orange wear debris that confirms the localization of these elevated temperature spots. The glass beads act as reinforcement against the wear that gradually exposes the polyamide matrix to asperities on the disk surface, thus reducing the size of wear debris formed from PA-GF. A reduction in the size of wear particles with the increase in the reinforcement was also observed in injection molded glass fiber-reinforced PA12. 31
Wear mechanism
Initially, as the PA12 pin and the disk were brought into contact, the ridges on the disk surface plough into the pin, causing microcutting, abrasion, and the shearing of the asperities. Due to the Van der Wall's attraction, abraded particles adhere to the disk surface and with the increase in sliding distance, accumulation of the wear particles and rubbing action results in adhesion of the polymer debris to the disk surface, resulting in a transfer layer. This transfer layer covers the asperities identified with a white arrow in Figure 9a and prevents abrasion during the subsequent cycle. Later, these transfer layer peels off and rolls between the wear surfaces resulting in the needle (Fig. 8a), fiber (Fig. 8c) and spheroidal-shaped wear debris (Fig. 9a). This debris acts as rolling elements between the surface, reducing the friction coefficient further. At higher speeds, the adhesion between the transfer layer and pin becomes predominant, leading to an increase in the friction force.
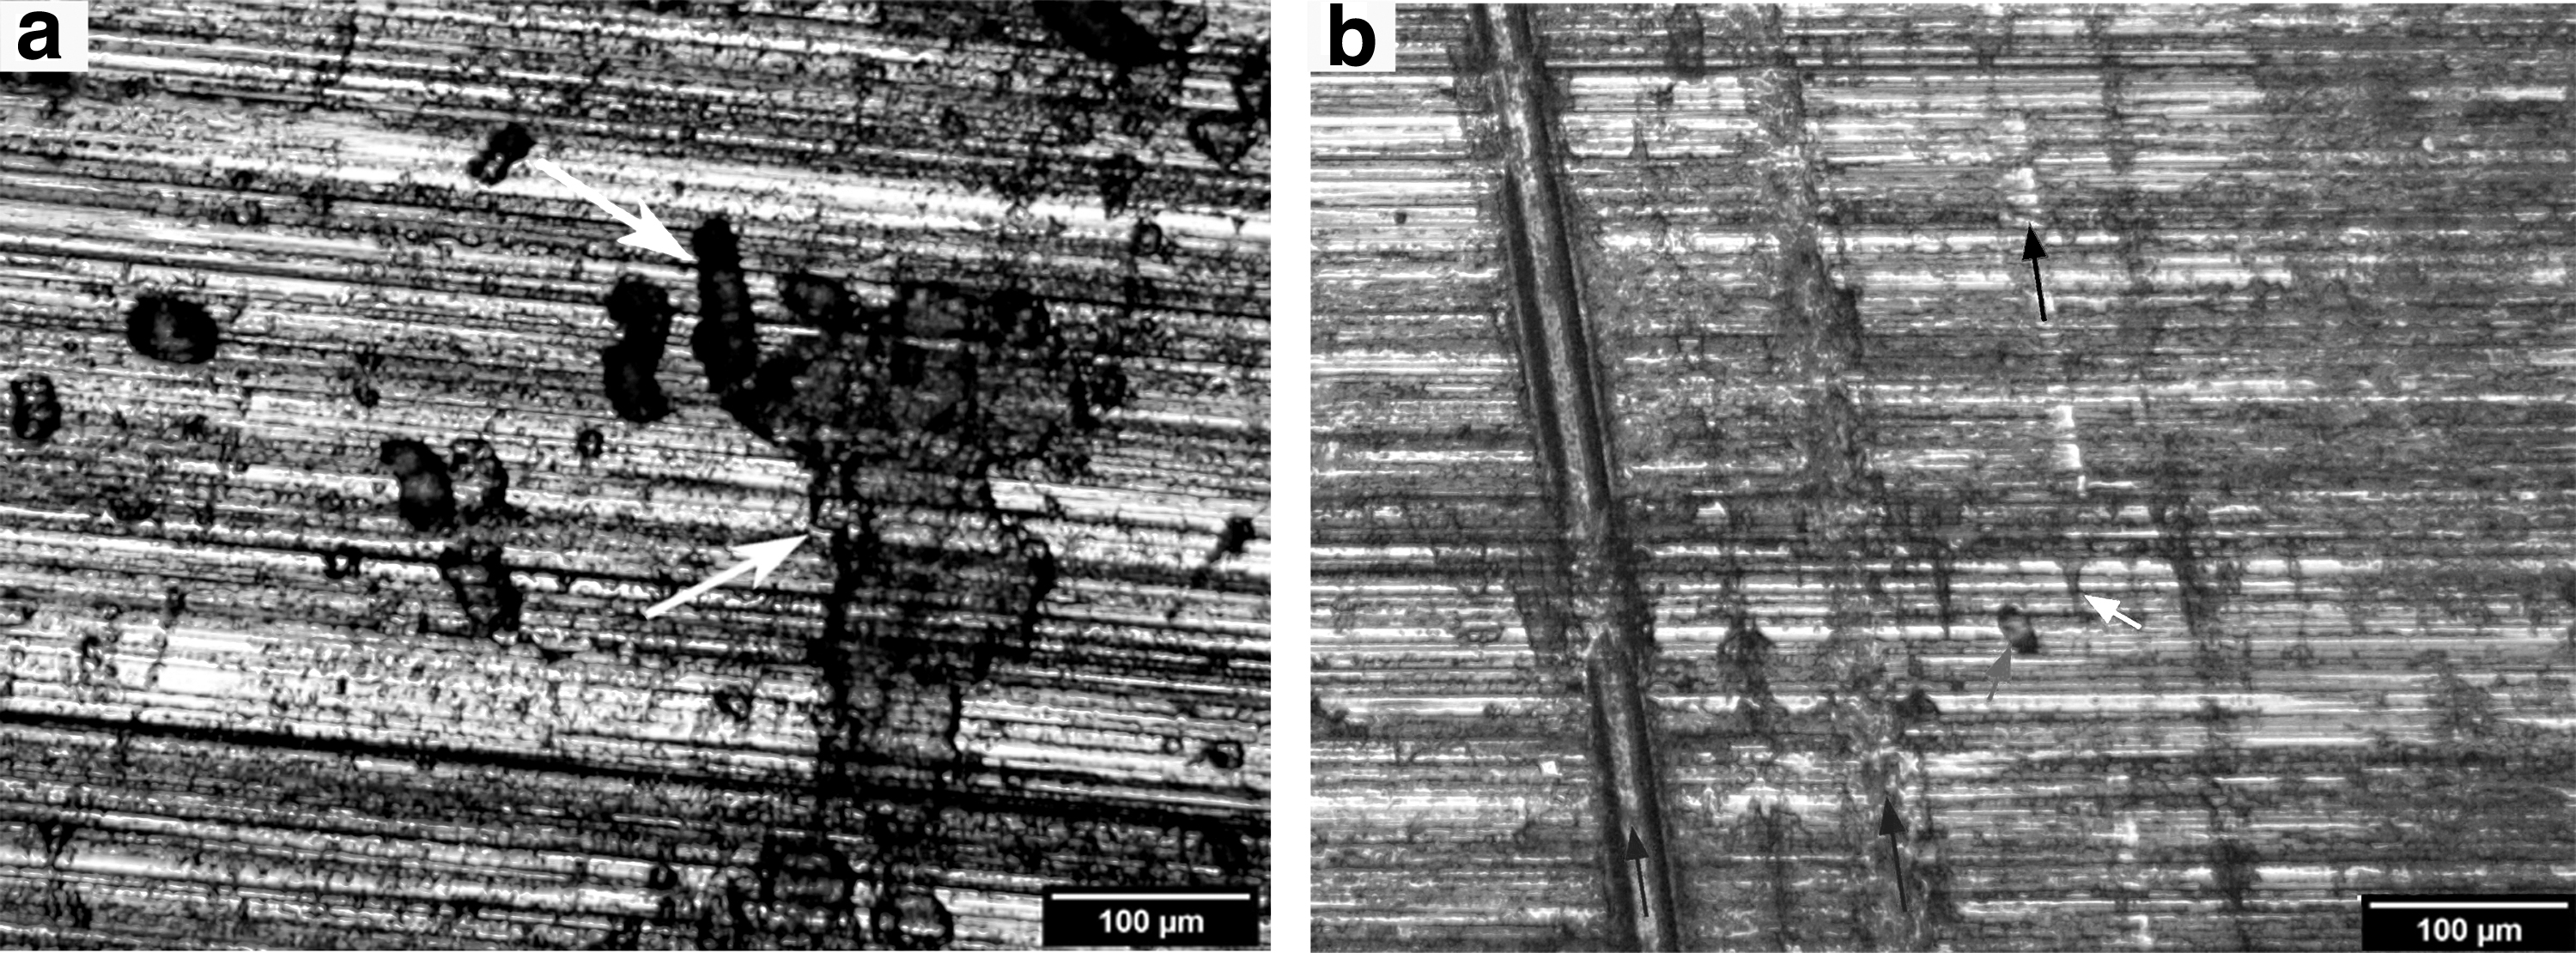
In PA-GF, the presence of glass beads results in glass beads–metal contact in addition to polymer–metal contact. The polymer–metal contact behaves much like PA12 and results in the formation of a transfer layer. In contrast, the glass bead involves microcutting and ploughing, as evident by scratch marks on the wear track (Fig. 9b). This interaction also wears out the glass beads leaving a flat face (Fig. 6d–f) and sometimes shattering the glass beads (Figs. 6d and 8e), which also get embedded in the polyamide matrix, which further engages in ploughing and tears transfer layer reducing debris size.
On the other hand, the temperature caused by friction at glass bead–metal interaction stays localized, promoting the adhesion of wear particles to the wear surface and forming a more consistent transfer layer (Fig. 9b). The Figure 9b show deep ploughing marks resulting from glass beads, partially covered ploughing marks, and wear debris. Although the glass beads initially result in abrasion, with the formation of a consistent transfer layer, the glass bead–metal interaction is reduced, instigating a reduction in friction with an increase in load. However, the wear rate was low, and the metal debris embedded in the pin made it hard to observe changes in mass or dimension.
Conclusion
The friction behavior of specimens fabricated using SLS with PA12 and PA-GF materials was evaluated against hardened EN31 steel disks under dry sliding condition. The effect of build orientation, load, and speed was investigated to understand the variation in the COF.
The wear surfaces and debris were analyzed to understand the wear mechanism and effect of glass beads. The findings are summarized below.
The overall friction coefficient of both materials ranges between 0.13 and 0.18 throughout the evaluation distance of 2.5 km.
Temperature near the sliding interface increased to a maximum of 44°C and 48°C for PA12 and PA-GF material, respectively, at higher load and speed. In an analogy, an increase in temperature leads to an increase in friction coefficient.
Load is a significant factor affecting the friction coefficient for PA12 and while speed was a significant factor influencing the friction coefficient of the PA-GF.
In comparison, the load increase resulted in the transfer layer's formation and reduced COF. An increase in speed leads to an increase in COF due to adhesion.
Even though glass beads resulted in scratches on the disk surface, the formed transfer layer restricts the increase in COF of PA-GF material.
Although build orientation affects the surface roughness, surface porosity, and formation of the transfer layer, orientation is a minor factor affecting COF in comparison to load and speed.
Abrasion and adhesion are effective mechanisms contributing to frictional load in both materials, while the presence of glass beads shifts toward abrasion wear. The transfer layer formation is possible only when bearing surfaces are in continuous contact. Thus, abrasion wear will be predominant in rapid tooling applications as new surfaces are brought into contact each time. Although both materials evaluated in this study exhibit potential for rapid tooling applications, the designer should be aware that PA12-GF material could produce scratches on the product at a higher load and speed. Low friction, wear resistance, self-lubrication, and the ability to fabricate in any complex shapes promote SLS for demanding tooling applications.
Footnotes
Acknowledgments
The authors would like to express their gratitude to the UGC-UPE, Anna University for their support in this research activity through the establishment of the rapid manufacturing facility at the Department of Manufacturing Engineering, CEG, Anna University.
Authors' Contributions
Prithvirajan R.: Conceptualization, methodology, investigation, validation, formal analysis, writing—original draft preparation, and writing—reviewing and editing. Arumaikkannu G.: Supervision, conceptualization, methodology, validation, writing—reviewing and editing, and funding acquisition.
Author Disclosure Statement
No competing financial interests exist.
Funding Information
I, Prithvirajan R. express my sincere gratitude to the Council of Scientific and Industrial Research (CSIR), HRDG, India, for financial support through the CSIR-SRF direct fellowship (File No.: 09/468/0538/2019 EMR –I).