
Abstract
Since its first appearance almost a couple of decades ago, microfluidic fuel cells (MFFCs) have gained considerable research momentum due to their potential applications in portable devices. The main focus has been on the effective fabrication of microfluidic channels with different materials, where the manufacturing limitations proved to be the main stumbling blocks. Paper-based MFFCs have been reported with some success, where the porosity of the flow channel medium drives the reactants, greatly reducing the need for elaborate external devices and complex manufacturing obstacles, although the longevity of these cells remains questionable. The current article addresses this issue by replacing the paper-based flow channels with 3D-printed substrates of different structural forms to serve as pathways for controlled flow and mixing responses of the reactant liquids without the use of other devices, such as micro pumps and valves. The line-by-line material consolidation mechanics of fused filament fabrication and the porous mesostructural responses of a commercial polymer filament are combined to build the microfluidic fuel channels of varying configurations. Numerical and experimental characterizations proved the cells to perform better than the current paper-based counterparts, apart from better longevity and possible new opportunities for future improvements based on more complex micro-, meso-, and macrostructural advances.
Introduction
Microfluidic fuel cells (MFFCs) work on the principle of the colaminar flow of two incoming liquids in a medium, where all the reacting components, electrodes, and channels are confined. 1 Being miniaturized, they offer several benefits, such as quick start-up, portability, and high-power densities. Major applications are in portable and lab-on-a-chip-type diagnostic devices. Unlike fuel cells, MFFCs do not require cooling, and water discharge systems, which eventually reduces the price. 2 The fuels are generally aqueous solutions of glucose, methanol, formic acid, or dissolved hydrogen. The oxidant solutions contain dissolved oxygen, hydrogen peroxide, or permanganate. Additionally, an electrolyte (such as sulfuric acid and potassium hydroxide containing highly mobile ions) is added, allowing easy movement of ions across streams, making it membraneless. MFFCs are categorized based on the shape of the flow channels used for the reactants, where T and Y-shaped channels are the most common. 3
Conventionally, photolithography, soft lithography, and replication techniques are used to fabricate the intricate microchannels of MFFCs, which are highly time-consuming, cumbersome, and costly. 2 The microchannel design and configurations significantly control the performance and power losses of MFFCs. Also, assembling components that are fabricated separately often results in high contact resistance. A more versatile and agile manufacturing system is essential that can expedite the fabrication of integrated components of intricate geometries. Given the freedom to fabricate freeform shapes direct from digital data, additive manufacturing (AM) is playing a significant role recently in applications requiring the fabrication of intricate shapes.
Considerable interest was shown in applying AM for fuel cells in general in recent years. Philamore et al 4 presented two novel methods, 3D printing and casting to develop ion exchange membranes (IEM) and demonstrated both methods to be cheaper, easier to use, and better in performance due to larger surface areas for better ion migration compared with the conventionally produced IEMs. Jayakumar et al 5 used selective laser sintering to produce the gas diffusion layers based on polyamide and titanium powder blends. However, the performance was lower compared with conventionally made counterparts.
Guo et al 6 designed and developed bioinspired leaf vein flow plates based on selective laser sintering using graphite composite material and observed a 20–25% better power density. Numerical simulations were also done to analyze mass, velocity, and pressure distribution through different channels and flow plates. Breitwieser et al 7 employed Ink-jet printing to fabricate composite membranes composed of dispersed Nafion ionomer in the pore spaces of nanofiber mats. The power density produced by this novel membrane is 1.7 times higher than the conventional Nafion membrane.
Comparatively, the application of AM in MFFCs is limited so far. O'Neil et al 8 three-dimensionally printed a scalable, membraneless prototype electrolyzer for hydrogen production by water splitting. This electrolyzer operates in an acidic and alkaline solution with an efficiency of 61.9% and 72.5%, respectively. Ambrosi and Pumera employed the multimaterial consolidation benefits of AM to fabricate functional electrodes and electrolyzer cell components. 9
In another investigation, inexpensive electrolyzer devices were fabricated using freeform fabrication methods and a series of filaments and the printed electrolyzer cells were further evaluated to establish the compatability as catalyst-coated membranes. 10 The freedom to print highly intricate geometry with AM also helped in developing a model electrochemical flow cell, which was further successfully employed in hydrodynamic scanning in electrochemical microscopy experiments. 11 Bonyár et al 12 used 3D printing to make a mold for the microchannels of MFFCs, comparatively evaluating the quality and resolution of three mold-making methods, 3D printing, casting, and epoxy resin-based solutions.
Guima et al 13 used fused filament fabrication (FFF) to fabricate microchannels and casings for MFFCs fed by glycerol, displaying a power density of 175 mW cm−2 at 0.9 and 1.8 V open-circuit voltages. Guima et al 14 also developed reusable 3D-printed photo-MFFCs (μPFC) that harness pollutant power under solar energy. The platform and casing system with a stable colaminar flow could be prototyped quickly and cheaply. This μPFC produces 0.48 mW cm−2 and 4.09 mA cm−2 as maximum power and current densities, respectively. Van den et al 15 used microstereolithography, a high-resolution 3D printing technique, to print microfluidic chip holders with reliable fluidic and electric connections.
Evidently, AM has proven to be a potential solution to resolve fabrication issues specific to components of general and MFFCs. The applications are still in the early stages, and progress is yet to be made on many fronts. In the context of MFFCs, some of the major aspects may be resolved with the use of AM, that is, (1) the power densities generated are still low, (2) wastage of materials arising out of uncontrolled mixing of electrolytes, (3) auxiliary equipment such as microvalves, micropumps, fuel storage, and flow control systems cause extra cost and complexities and reduce overall power density.
Paper-based MFFCs (PMFFCs) is conceptualized as a potential new candidate to overcome most of the above limitations. The paper raising the liquid due to its inherent capillary nature alleviates the need for microvalve and pump systems and allows to maintain colaminar flow. 16 Furthermore, PMFFCs can directly harness oxygen in the atmosphere, circumventing the need for an oxidant on the cathode side. 17 Most importantly, they are easy to fabricate and can be scaled up easily for higher power generation. Galvan et al 18 investigated paper-based fuel cells utilizing formic acid and hydrogen peroxide as fuel and oxidant, respectively, and produced a maximum power density of 2.53 mW/cm2 at an electrode surface area of 0.3 cm2. Esquivel et al 19 utilized methanol and potassium hydroxide as fuel and electrolytes for PMFFCs and obtained a maximum power density of 5 mW/cm2. Yan et al 20 developed single inlet PMFFCs where hydrogen peroxide was used as fuel and oxidant, using a silver nanowire electrode and produced a peak power density of 0.88 mW cm−2.
Tata Rao et al 21 used graphite electrode-based PMFFCs utilizing formic acid and sulfuric acid as fuel and electrolyte, respectively, and obtained a maximum open-circuit voltage (OCV) of 370 mV, a maximum current density of 748.72 μA/cm2, and a maximum power density of 69.12 μW/cm2.
PMFFCs are feasible and capable of numerous benefits, but these cells are fragile and prone to damage easily, and scalability is not established yet. Paper-based membraneless MFFCs also have a single-line interface through which diffusion and electron transfer occur. To enhance power density, multiple interfaces need to be created in arrangements such as multiple unit cells accommodated in a single plane like an array to produce adequate voltages. More intriguingly, PMFFCs have uncontrolled diffusion of incoming reagents, which reduces efficiency and causes material wastage. Despite the simplicity and the promising prospects, PMFFCs suffer from all these drawbacks, which may render them practically unfeasible.
AM may come in as a possible solution here, as: (1) the paper option can be replaced by thin-layer polymer as substrates or flow channels constructed by 3D printing, (2) a variety of materials can be evaluated as options for the substrates, (3) functionally graded and controlled porosity can be targeted in the substrate structures for closely controlling the fluid flow, (4) more importantly, microchannels can be designed and developed by suitably altering the raster paths of the construction of layers in the 3D printing process, thereby controlling the flow paths of the constituent reagents, and (5) another major feature is the possibility to build multichannel and intricate shape alterations for the substrate forms, targeting better power densities and voltages.
While all these aspects are of great interest in exploring the possibilities with these new types of MFFCs, there has been no evidence of any research conducted in this direction yet, and hence forms the basis of the research gaps to be addressed in this current research. The line-by-line material consolidation mechanics typical of AM by FFF is explored to build MFFCs with controlled stranded structures in accordance with the predictions based on numerical simulations of the flow patterns. The actual fluid flow and the cell performance responses are characterized by experimental means. The results are positive as a maximum potential of 687 mV, power density of 387.17 μW/cm2, and current density of 1.235 mA/cm2 could be observed. The method also allows for more complex geometrical forms and better control over the fluid flow and mixing qualities for future developments.
Materials and Methods
Materials
Formic acid (HCO2H) 98% and sulfuric acid 99% (H2SO4) sourced from Sigma-Aldrich, New Zealand are used as fuel and electrolyte, respectively. Deionized water is used to bring the concentrations of fuel and electrolytes down to 1 M. Three different methods are experimented with to develop the electrode functionalities on the printed samples. Bare Conductive Electric Paint, purchased from RS Components (Auckland, New Zealand), is used as the electrode as against graphite that was reported earlier with the PMFFCs investigated by Rao et al. 22 In contrast to the graphite-based electrode, it is easy to paint on the flow channel. Platinum (Pt) wire (99.99% pure, diameter 0.2 mm) purchased from AliExpress China, weaved in the flow channel is another attempt at integrating the electrode functionality in the printed MFFCs. In the later stages, the sputter coating system, Hitachi E1045 Ion Sputter, at the Auckland University of Technology (AUT) materials testing laboratory coats a thin film of Pt on a flow channel to serve as the electrode. Picolog 1216 datalogger is a general-purpose voltage data-logging device and is procured from RS Components.
The substrate structure for the MFFCs should have a certain level of porosity to serve as the effective medium for the fluids to flow through the channels. Custom-made materials would certainly help in achieving better performance, especially if the flow channel is developed using selective laser sintering, as controlled porosities can be generated in the consolidated polymer substrates, possibly closer to the homogeneous and isotropic textures of the paper-based electrodes. Polylactic acid filaments with other ingredients were first attempted for developing porous polymer susbtrates based on fused deposition modeling, but the resulting structures could not compete with Layform 60 in terms of the wicking behavior as ascertained by the die-flow tests. A series of other polymer material options, polyamide, polyethylene, and polyether-ether-ketone in powder form were attempted to build porous substrates based on selective laser sintering, but all of them failed in offering the necessary capillary/wicking property to the flow channels to drive the fluids in the dye-flow tests. After all these unsuccessful trials, the Lay-Fomm material was converged on for building the flow channels.
Oberoi et al 23 utilized Lay-Fomm material for drug delivery and its impact on oral cells. Various other application of Lay-Fomm includes Tissue engineering 24 of biocompatible polymer materials 25 and low-cost, customized-shape sorbent. 26 Based on these observations from the literature, Lay-Fomm 60 filament (1.75 mm), a foamy polymer filament, was used to print the flow channel structure that develops the porosity once the printed sample is soaked in water for 48 h or more. The filament materials are procured from Matterhackers, are composed of rubber-elastomeric polymer, and polyvinyl alcohol (PVA). Postprinting, soaking and rinsing in water will allow the PVA to dissolve and leave the structure porous.
Computer-aided design modeling, design, and fabrication of polymer-based flow channels
The flow channel structure is the most critical attribute of MFFCs, as the design of which decides the throughput and efficiency of MFFCs. The uncontrolled mixing of reactants in the flow channels is one of the biggest bottlenecks in developing MFFCs. The interface of the anolyte and catholyte must be confined to a narrow zone to ensure efficient fuel utilization and recovery. Conventional Y or T-shaped flow channels have uncontrolled diffusion in the flow channel. The manufacturing method should allow for better control as necessary. The approach here is to use design freedom based on the close control of the material consolidation in AM to build a novel design.
The flow channels will have the characteristic corrugated or ribbed architectures resulting from the combination of a single-line filament printed by means of controlled raster path schemes. As a result, the incoming reactants follow the line paths of the printed stands forming the channel instead of bleeding through the capillary structures of a plane area. This is expected to constrain the reactants to merge in a narrow-controlled zone. In other words, the raster paths of the printed microchannel dictate the flow and mixing of responses.
The controlled raster path schemes based on the FFF method to fabricate the cell structures are used to design two structural variants for the flow paths. These are the simple corrugated and the corrugated-planar structures, the significant variations of which will be elaborated more later while discussing the numerical simulations and dye-based tests.
SolidWorks (2020) is used as the design platform to build computer-aided design (CAD) models of flow channels with different controlled raster structures. For these initial investigations, the overall form of the MFFC is limited to the standard Y-shape, with the internal flow channel structures varying as planar, corrugated, and corrugated-planar, as depicted in Figure 1a. Before printing, the Lay-Fomm 60 filament is heated to 50–70°C for 10 min to soften the material and enhance the flowability. Otherwise, it was noted that the filament breaks in the filament feeding mechanism of the print head. A makeshift FFF test setup available at the AUT AM Research Center is used for all printing tasks. Initially, G and M codes were attempted to generate controlled raster flow paths and integration of the same with the polymer dispensing fused deposition system to achieve the printed flow channels.

Planar, corrugated, and corrugated-planar structural forms designed for the flow channels of MFFCs investigate:
However, with the Lay-Fomm material that was used to achieve the porous flow structures in the current work, it became very difficult to control the flow of the heated filament with varying feed rates from the nozzle as required to achieve the controlled deposition of the strands at different zones of the flow channel, such as the straight pathways, the endpoints where stopping and turning over is necessary, and at points where reversal of the print head needs to be implemented at various other angles as necessary based on the geometry of the flow channels and the raster patterns implemented. With a staple material such as acrylonitrile butadine styrene polymer in filament form, this can be achieved relatively easily, but it became increasingly difficult to control the material responses based on Lay-Fomm for the controlled raster sequences based on G- and M-code implementation on the fused deposition modelling hardware. Considering these practical difficulties and time constraints, the default rasterization schemes within the solid slicing software have been used to build the raster paths in the current work.
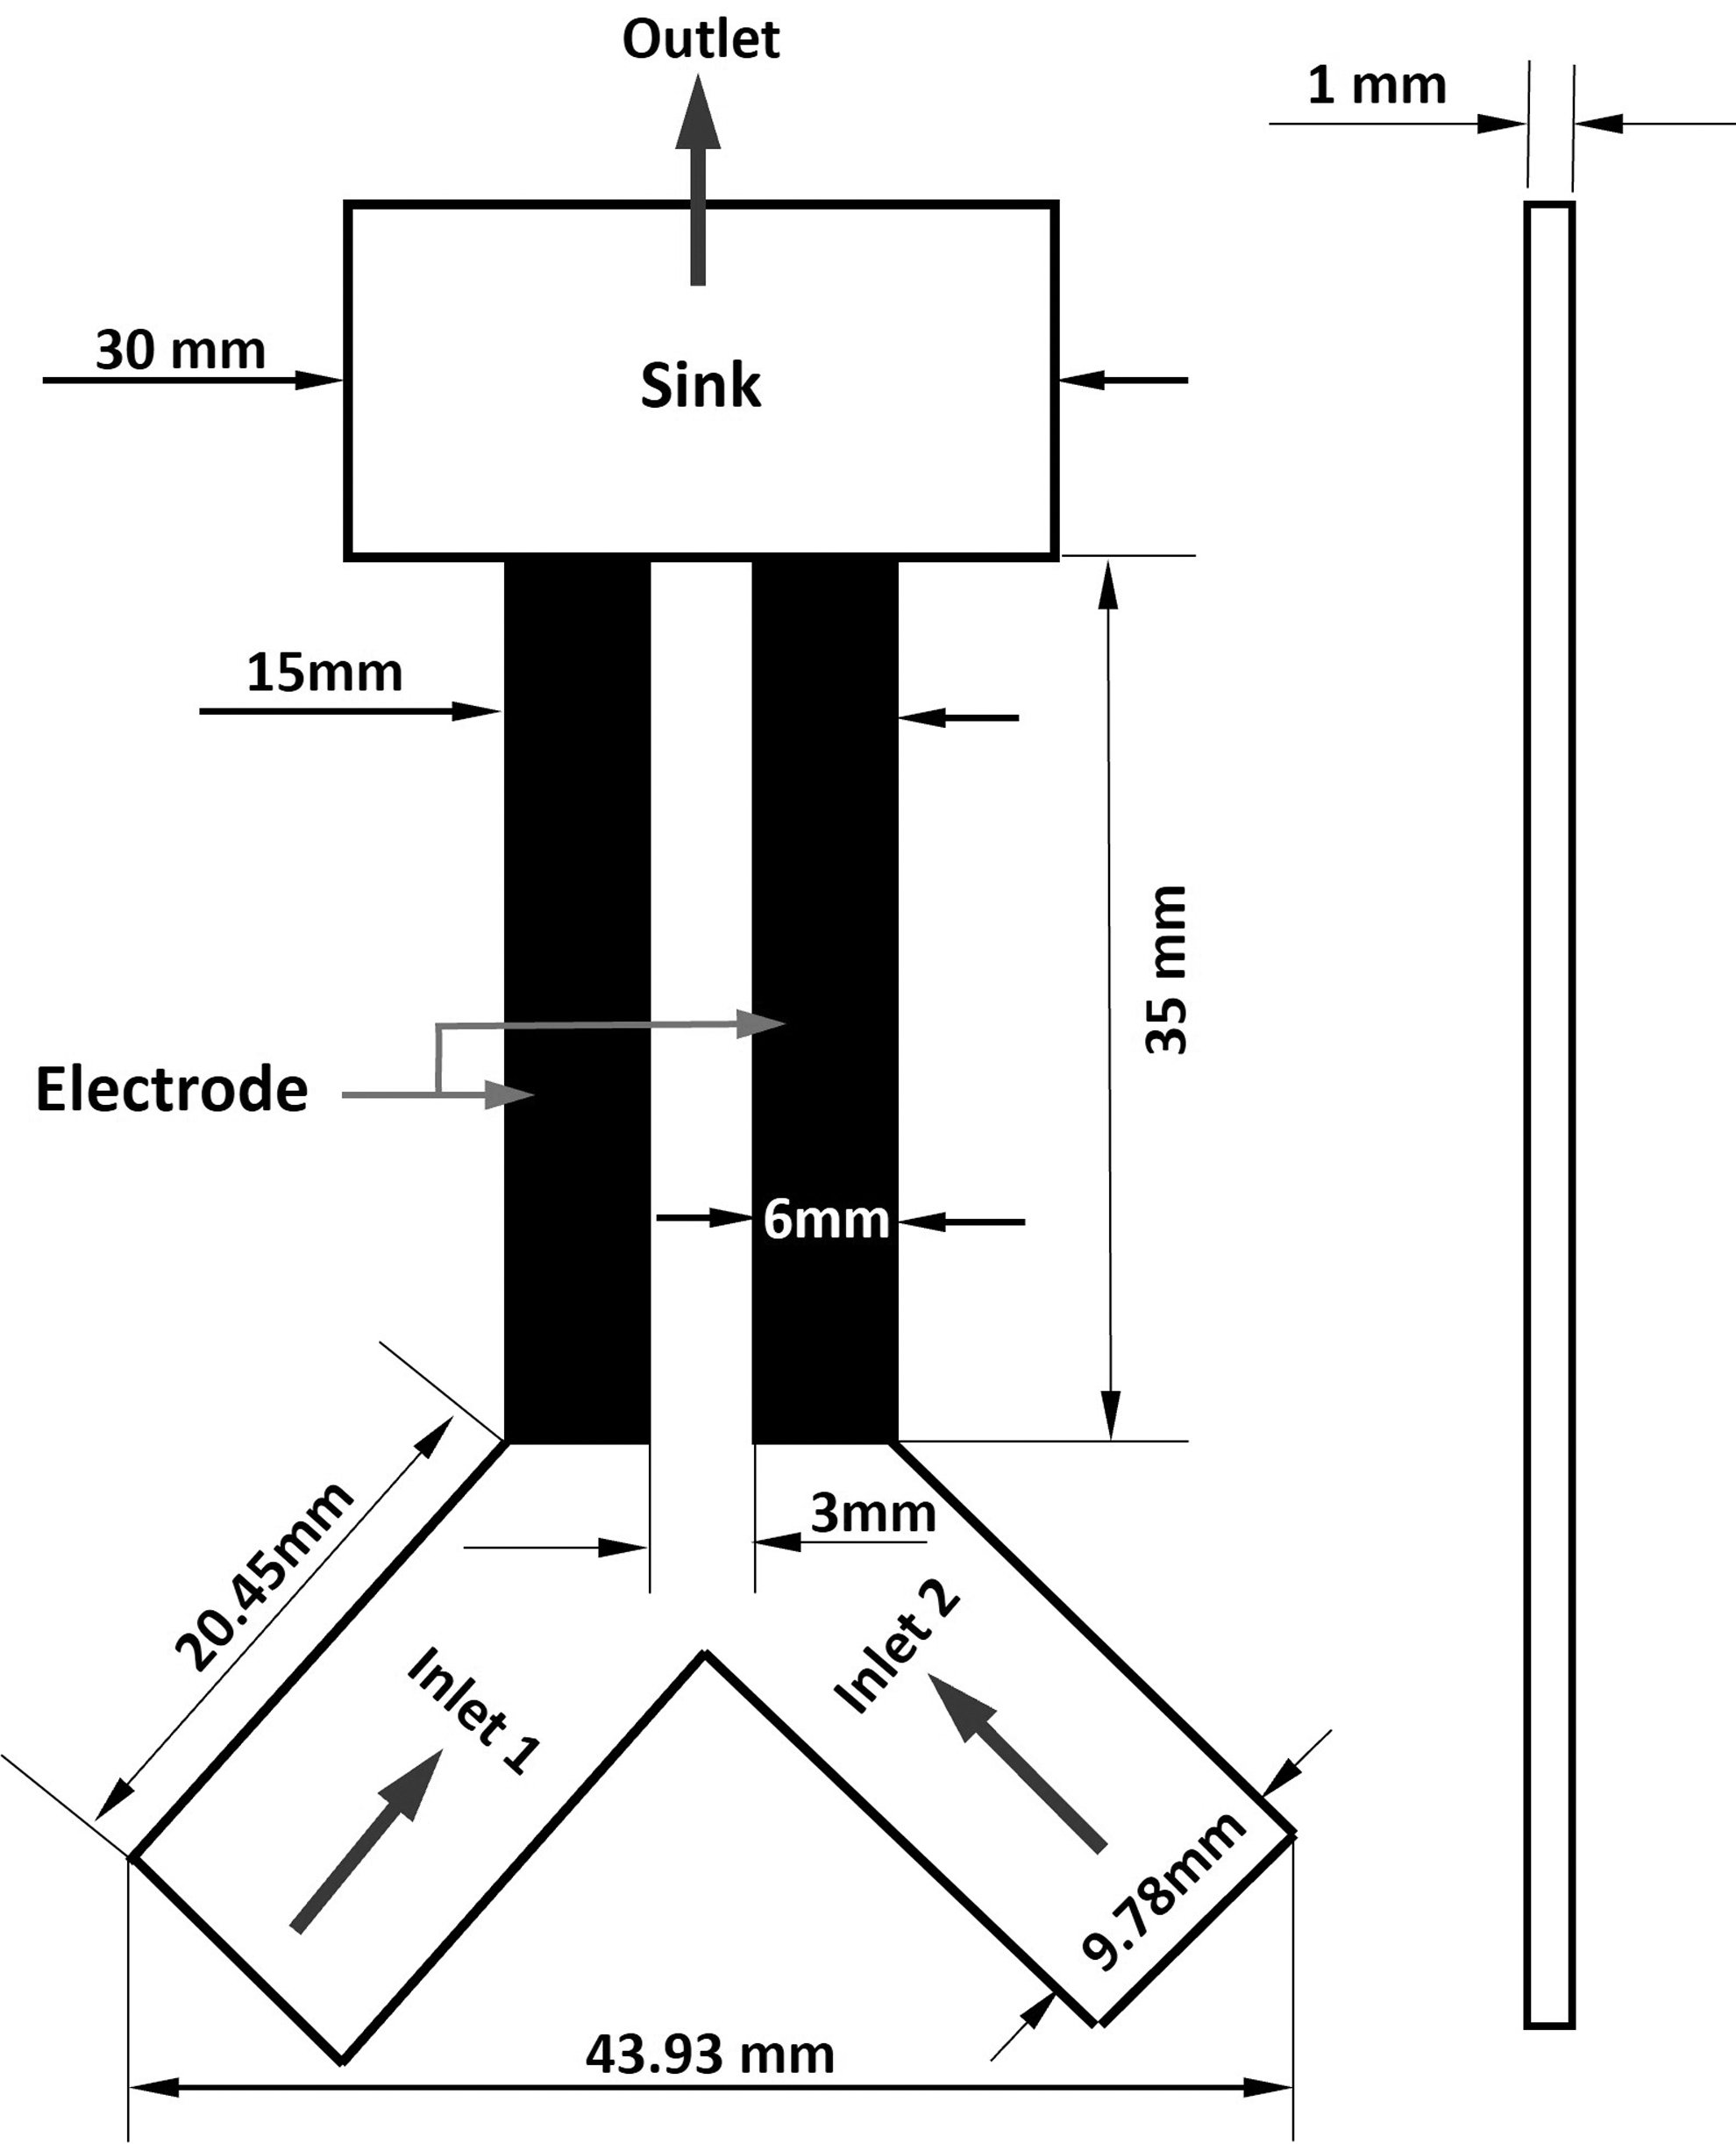
Several initial trials were conducted with Lay-Fomm 60 filament, varying the critical process parameters, print speed, nozzle temperature, infill pattern, and many other conditions and finally converged on the optimum settings as listed in Table 1. Images of the printed models of the base structures of the MFFCs with the three flow channel configurations are presented in Figure 1b. The actual dimension and thickness of the flow channels are represented in Figure 2.
Printing Parameters for Lay-Fomm Material
Numerical simulation setup of the fluid flow patterns
Numerical simulation is greatly helpful in visualizing and predicting the flow behavior and interface patterns of liquids, which eventually decide the efficiency and performance of the fuel cells. There has been considerable progress in using mathematical and computational modeling methods to analyze the flow behavior inside MFFCs. Bazylak et al 27 did a numerical analysis of T-shaped MFFCs to visualize the transport behavior of incoming reagents. The ultimate aim was to minimize mixing and maximize fuel utilization by altering channel geometries and electrode configurations. The analysis was done using computational fluid dynamics with the coupled flow, species transport, and reaction kinetics models. Patari and Mahapatra 28 did experimental and numerical simulations to evaluate the capillary rise of water through a strip of paper. The Brooks and Corey model was adopted for the numerical analysis, which was compared with Lucas−Washburn (L−W), as well as the evaporation models. Perez-Cruz et al 29 used Richard's equation, which is generally used in soil mechanics, to model the imbibition into paper-based networks.
Masoodi et al 30 utilized polymer wicks to see the liquid front rising due to capillary action. The model combines Darcy's law with the continuity equation and utilizes the numerical simulation package PORE-FLOW© based on the finite element/control volume method. Furthermore, computational analysis of reagents interaction and wicking behavior are conducted on paper-based31,32 and on a cotton yarn-based microfluidic channel. 33 So, to analyze the flow behavior in porous medium (paper or polymer), different computational or mathematical models were developed.
However, none of the research work reported appears to have considered the flow behavior of multiple liquids entering with multiple inlets, especially with the wicking phenomenon of flow channels made of paper or polymers. The numerical analysis would be a vital tool to visualize the flow behavior of multifluids having a multientry. Additionally, leveraging the benefit of CAD design for flow channels, and deploying for numerical simulation, could be a major leap in controlling fluid path as well as efficiency and throughput. Different CAD models could be designed for flow channels and numerically simulated, considering flow channel property equivalent to paper. However, in the real world, making customized flow channels using paper material is highly complicated, and attempts made were almost nil. Three-dimensional printing could be a suitable option, which can utilize materials whose property resembles paper.
Despite that, the printed flow channel property highly depends on the raster path and printing parameters, unlike paper, whose property is homogeneous and isotropic; numerical simulation considering a customized flow channel and the available property of paper would help reduce the complexity of the simulation. Considering the exact property of the printed flow channel (having different combinations of different raster paths in each layer) and incorporating it in numerical simulation is highly complicated and not within the scope of the present research.
Nevertheless, attempts are made to consider the property of paper, which pave the path for future research. Additionally, few real-world experiment results (Dye-flow test) match with numerical simulation, as discussed in a later section. The present work utilizes computational fluid dynamics to analyze the capillary rise of the liquid due to the wicking phenomenon into different configurations of the porous Y-shaped flow channels. Wicking is the instantaneous flow of a liquid through a porous medium due to capillary suction taking place at liquid−gas interfaces in a porous medium. Moreover, the wick is supposed to be isotropic, and liquid transport is affected by gravity and viscosity. Evaporation of liquid at the wicked top, which is exposed to air, is responsible for slow upward movement.
This research evaluates the transient multiphase capillary rise of liquid due to wicking in the porous flow channel. When a dry porous medium is dipped into the liquid, it will rise until capillary forces balance the gravitational force. Here, two phases, which are, air and water−ethanol (ethyl alcohol), are considered since ethanol and water are completely miscible. The air is already present in the porous medium, which is displaced by water and ethanol, respectively, entering from two inlets. Additionally, the Whatman grade 4 paper is considered as the porous medium for numerical simulation, as permeability and pore size data are available in the literature and meet the requirements of the homogeneous and isotropic medium. The Lay-Fomm-based printed flow channel could not be modeled in the numerical simulation for reasons discussed earlier and elaborated in a later section. The Brooks and Corey model for capillary pressure and relative permeabilities is used for the time-dependent simulation.
The boundary condition at the inlets of the flow channel is atmospheric pressure, whereas the outlet boundary condition is hydrostatic atmospheric pressure minus the capillary pressure. Porous medium is modeled by adding a momentum source term to the fluid flow equation. The source term comprises two parts: viscous loss and inertial loss. Neglecting the inertial loss in the case of laminar flow, the final equation is reduced for homogeneous porous medium, that is,
Where ▽ p is the pressure drop, α is the permeability of the medium, μ is the fluid viscosity, and v the velocity.
Eq. (1) represents pressure drop to be proportional to the velocity. The continuity equation is represented by Eq. (2),
Where Φ is the porosity of the medium, ρ is the density, and Q is the mass source term.
Eqs. (1 and 2) represent the momentum and continuity equation based on Darcy's law model. 34 The volumetric evaporation rate (Q) is significant when the temperature difference between the atmosphere and porous medium is high. Considering the evaporation occurring at room temperature, Q is assumed to be zero. 35 For the multiphase simulation of flow-through porous medium, the Eulerian−Eulerian multiphase model is employed that can solve all the transport equations using the ANSYS finite element software.
Species transport is considered for modeling two separate flows, water and ethanol. Water and ethanol are one phase but two species or volumetric species. The pressure-based solver is used here for incompressible flow. The Eulerian multiphase model limits the number of secondary phases by memory requirement and convergence behavior. Additionally, the Multi-Fluid volume of fluid (VOF) model is enabled, which provides a framework to couple VOF and eulerian multiphase models. For volume fraction, ANSYS supports explicit and implicit formulations. The implicit formulation is iterative and used with either a steady or transient solver. For transient flow, implicit formulation allows a much larger time step giving a stable solution.
The relative permeability of a phase denotes its ability to transmit through a medium when another phase is already available. In Fluent, the Corey power-law model is available to account for the relative permeability of the two-phase flow-through porous medium. 36 For the two-phase (w, nw), the relative permeabilities can be obtained from
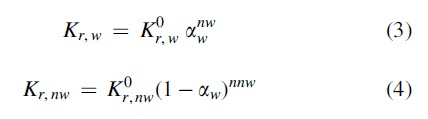
Where w denotes the wetting phase (generally water), and nw denotes the nonwetting phase (generally air).
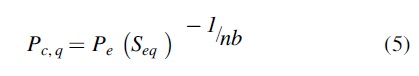
When using the Eulerian multiphase model, a submodel for capillary pressure can be specified; The Brooks and Corey model is one such. The Brooks−Corey model proposed the relationship for capillary pressure, where the porous medium is initially saturated with the primary phase (air) and is displaced by the secondary phase (water). The capillary pressure for the wetting phase is Eq. (5).
where
Here,
The value of
Here, surface tension
For solving Eq. (5), two parameters, entry capillary pressure (1.6 × 10⁵ Pa) and pore size distribution index (2), are needed. 28 ANSYS Fluent module is used to implement the numerical schemes to solve these equations and simulate the fluid flow responses with varying boundary conditions.
Experimental dye-flow test
The dye-flow experiment is essential to visualize the mixing pattern of fuel and electrolytes in the different configurations of the flow channels. As mentioned, each configuration has its significance that is evaluated based on dye tests and numerical analysis. A setup has been made by utilizing A4 paper, where a Y-shaped flow channel has been drawn, cut out, and placed in the arrangement shown in the result and discussion section. Initial dye-flow tests are performed on A4 paper substrates considering homogeneous and isotropic structures as Whatman grade 4 paper is thin and cannot be stable when clamping with a clip. This test setup, thus established, is then used for dye-flow tests on different printed flow channels. Two dye liquids of different colors (red and green) are filled in a small glass container, and the colored liquids are allowed to flow in the flow channel to visualize the flow behavior and mixing patterns. The dyes are food colors (purchased from the local supermarket), which are diluted with tap water before experimenting.
Electrode setup and electrical characterization
Once the flow channels are printed and soaked in water to make them porous and then dried, the next step is to develop the electrode areas on the flow channel. The application of conductive paint was used as the first method to build the electrode areas on the printed MFFCs. However, it was observed that being water soluble, the conductive paints quickly dissolve, contaminate the working acids, and disperse into the printed sample. As a result, painting conductive materials to develop the electrode regions did not work effectively. A thorough investigation was done to find electrode options inert to acids and showing good conductivity. The use of a Pt wire was found to be an option as the next step. A Pt wire of diameter 0.2 mm and length of 10 cm was weaved on each side of the printed substrate to serve as the electrode components. However, Pt wire weaving was not precise and easy, especially when dealing with a functional architecture-based flow channel, where precise placement of electrodes controls the final output. After a few trials, it was understood that a better method of forming the electrode zones was necessary.
Finally, the ion beam sputtering process was tried and found to be a better option for creating the electrode regions on the printed substrates. The dimensions of the electrode coating and flow channels are represented in Figure 2 for the planar flow channel, which is similar to the corrugated and corrugated-planar flow channels (with a variation of 2 mm to incorporate the minor changes in the electrode architecture). The electrode gap for the corrugated flow channel is kept at 2 mm to draw the charged ions at the electrode (unlike planar or corrugated-planar with a gap of 3 mm). A Pt target material was used to build the coating regions that serve as electrodes on the printed samples. The coating was done for 5 min at a rate of 10 nm/minute, depositing a coating of thickness 50 nm at the end, approximately. The substrate portions, where the sputter coating is not required are masked with paper tapes (with slight variation in dimension due to masking, as shown in Fig. 2b).
The conductivity responses of the coated electrode regions are established by simple multimeter measurements between alligator clips placed 1 cm apart. The observed resistance values are generally below 50 Ω.cm, which is good to proceed. The shapes of the electrode zones are similar to the ones used in PMFFCs by Rao et al. 22
The fuel (Formic acid) and electrolyte (Sulphuric acid), both of concentration 1 M, are filled into small glass containers, and the two inlets of the Pt-coated flow channel structure are dipped into the corresponding acid baths. Here, the formic acid side flow channel acts as the anode and the sulfuric acid side as the cathode. Subsequently, the cathode utilizes oxygen from the air as an oxidant. On the anode side, oxidation of the formic acid happens, which dissociates as carbon dioxide, protons, and electrons after the reaction. The generated electrons are transferred to the cathode side through the external circuit. On the other hand, protons are transferred to the cathode side with the help of highly mobile sulfuric acid. On the cathode side, oxygen reduction occurs through electrons, and water is formed. Overall, the cell reactions are given in Eqs. (8–10) below.
22
The printed flow channel structure is firmly clamped with a clip attached to a support system for stability, as shown in Figure 3a. The sputtering-based Pt-coated sample is connected to an alligator clip with a multimeter.

Experimental setup for the electrical characterization of the fuel cell
The digital multimeter Fluke 179 TRMS is parallelly connected to the datalogger to measure the OCV as shown in Figure 3a. The schematic representation of the MFFCs is shown in Figure 3b. A resistance box (R1), Heathkit Model IN-3117 Decade Resistance, is used to vary the resistances as 1, 100, 250, and 1000 kΩ. The momentary switch (S1) allows the closing of the circuit whenever measurements are taken. The data logger Picolog1216 is connected parallel to the multimeter and then to a laptop, as shown in Figure 3b and based on the software interface, the data transferred is used to plot the OCV versus time graph. Once the voltage stabilizes, an electric setup establishes the current using a variable resistance circuitry, as depicted in Figure 4. The multimeter readings of voltages with varying resistances are then recorded. Voltage reading and the corresponding resistance value are used to obtain the current value.
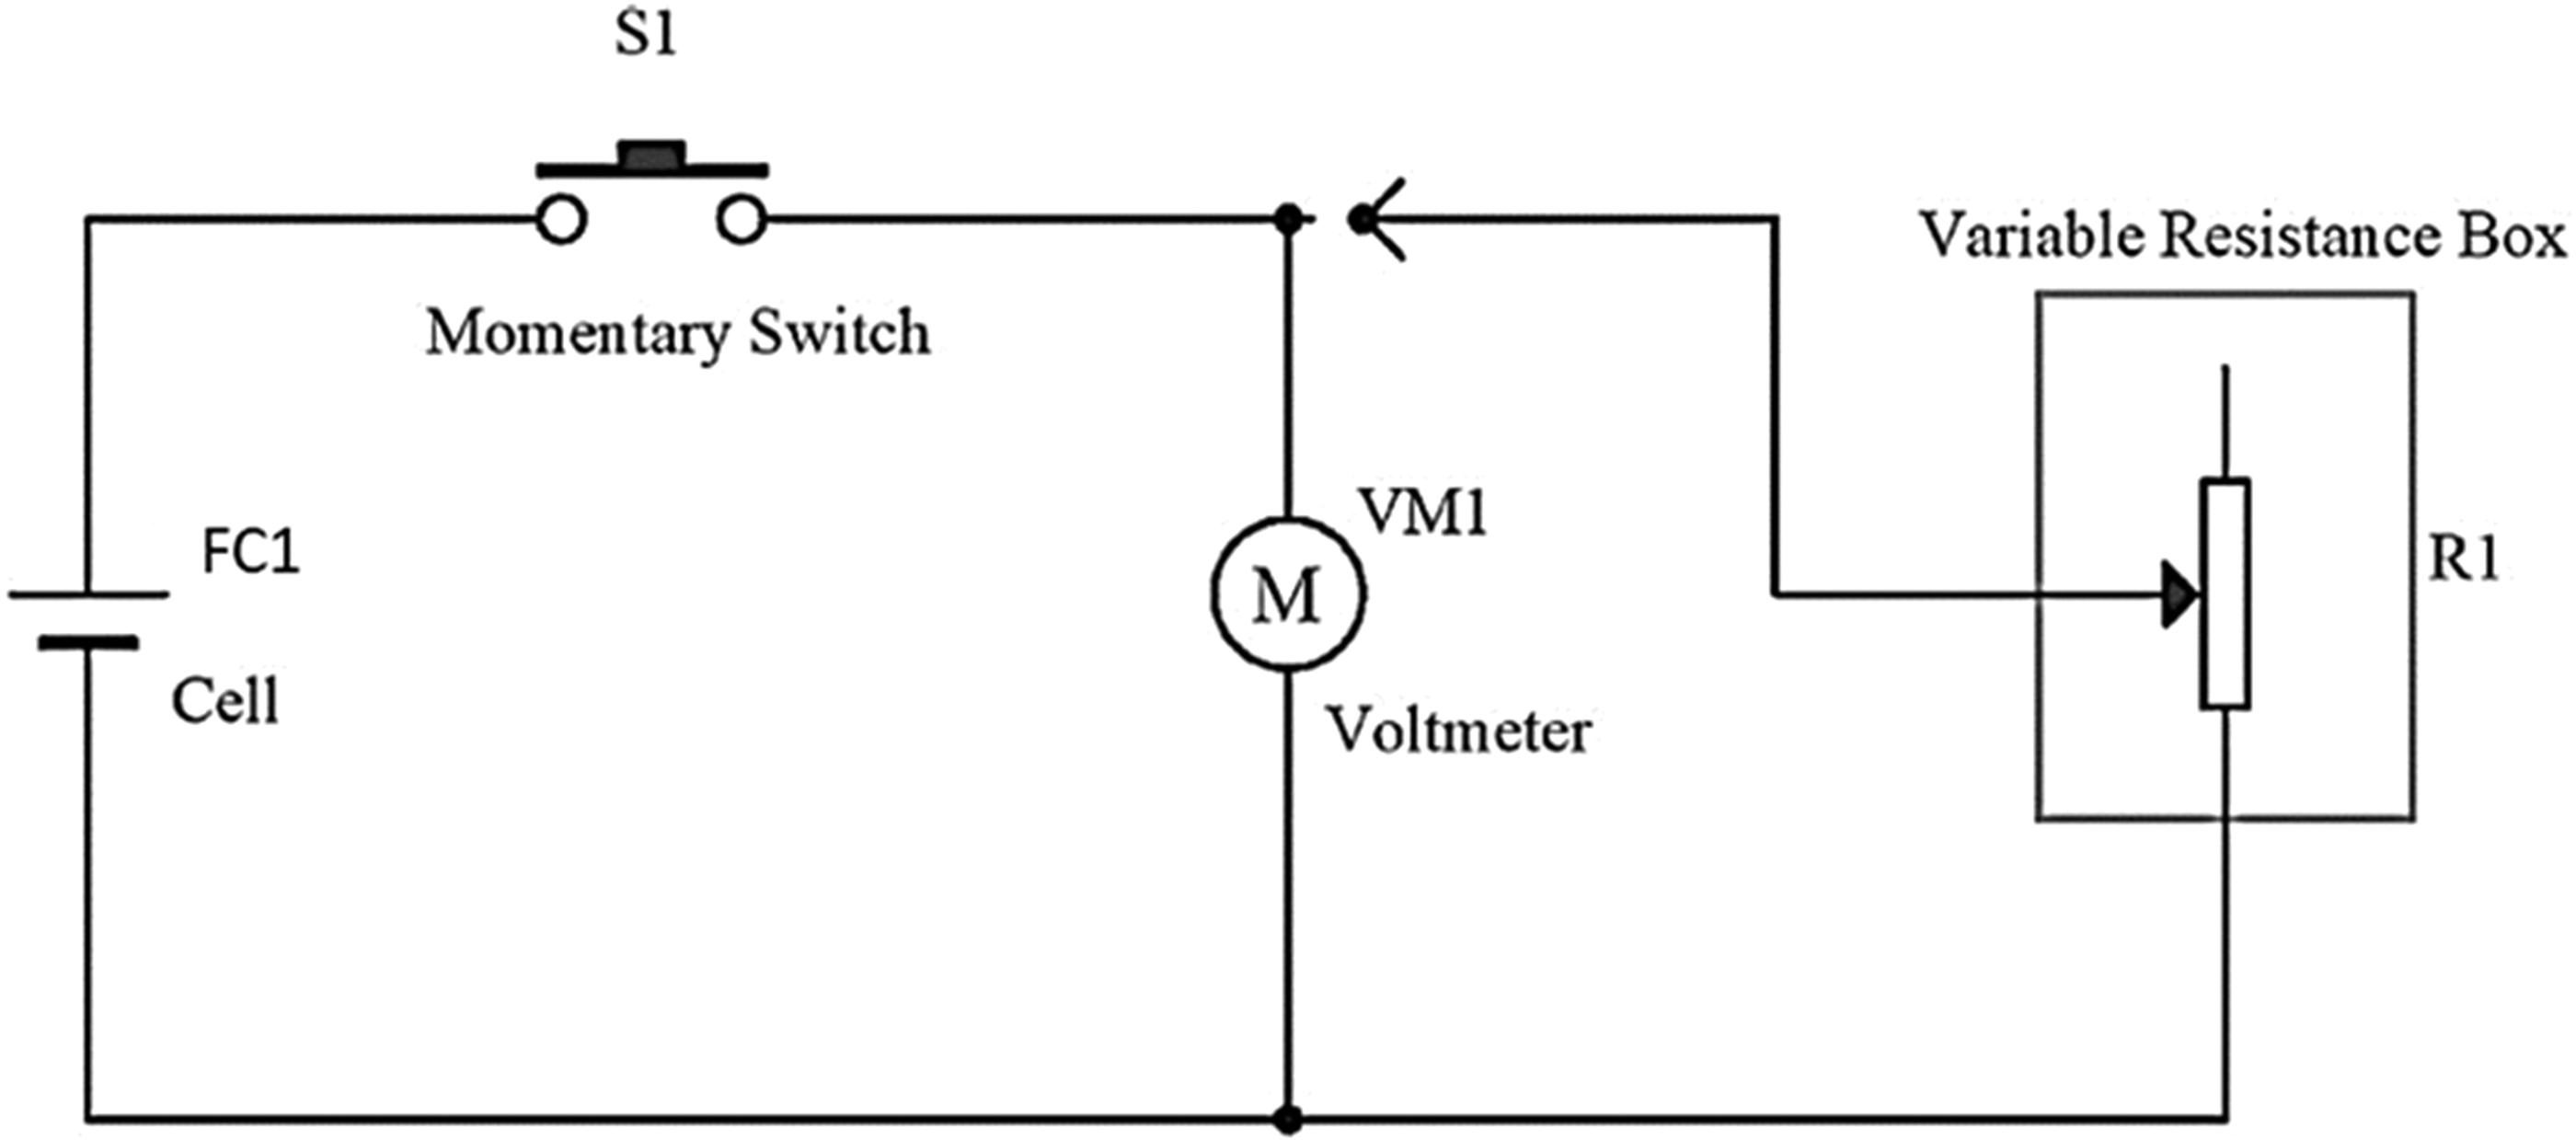
The circuit for the electrical characterizing the fuel cell.
The deposited electrode area is 4.2 cm2 for all the flow channel (approximately). The obtained current is divided by the electrode area to obtain the current density (normalized current), which is further used to plot the cell load and polarization graphs. The experiment is performed on three samples for each architecture to establish the experimental error and the relative standard deviation in OCV measurements.
Results and Discussion
Numerical simulation for fluid flow pattern
Numerical simulation has been done considering the Whatman grade 4 paper-based flow channel, as the required properties of Whatman paper are available in the literature. Initial simulations are performed using a single liquid at both inlets to observe the mixing patterns. For that, water is allowed to rise through both inlets, replacing air that is present in the medium. Since the same water is entering from both inlets, the preferential flow pattern is the same on both sides. As the water columns move upward in the two parallel flow regions, the interface region of the cross-stream diverges from a narrow to a wider area, as seen clearly in Figure 5. The area of diffusion mixing depends on the diffusivity of the two streams. Considering a binary mixture, the diffusion coefficient is constant, which is 5 × 10⁻¹⁰ m2 s−1. Since water is allowed to flow through both the inlets, a symmetric distribution is expected and is also seen about the centerline in Figure 5. Furthermore, the mixing zone can be seen to extend wider as the liquid stream moves upward.
Numerical simulation results of water replacing air-filled flow channel due to capillary action. Water enters at the bottom from the two legs of the Y-shaped channel and moves upward symmetrically about the center line.
The degree of mixing is defined by the peclet number (Pe) = UH/D, where, U is the mean velocity, H is the height of the channel, and D is the diffusion coefficient of the liquid. 37 The higher the Pe, the wider the mixing zone, which is the reason for the gradual widening of the mixing zone region in Figure 5. A wider mixing zone is one of the main concerns in MFFCs, which causes fuel and oxidant crossover and reduces efficiency. Bazylak et al 27 proposed the concept of a tapered electrode architecture that matches the mixing zone area, thus effectively utilizing the unused fluid.
To simulate the mixing patterns of two different liquids, water is replaced by ethanol at one of the inlets, which allows observing the flow characteristics of two dissimilar but miscible liquids. Surface tension and viscosity are the two critical properties that decide the flow behavior in porous medium. The viscosity of air, water, and ethanol are 1.76 × 10⁻⁵ Pa-s, 0.001 Pa-s, and 0.0011 Pa-s, respectively, whereas, the surface tension of water/air is 0.0723 N/m and ethanol/air is 0.023 N/m. 38 Here, the viscosity of water and ethanol are almost equal, so they have equal resistance to flow. However, the surface tension is caused by intermolecular force at the interference, nature of liquids, and temperature. Because intermolecular forces between water molecules are due to hydrogen bonds, which are higher in energy, the surface tension for water is larger compared with ethanol. The mass–fraction contour plots of Figure 6a and b for ethanol and water show that water has more spreadability than ethanol due to the relatively higher surface tension.

Numerical simulation results of two dissimilar fluids, water and ethanol, flowing through the channel, showing contour plots of the mass fraction of
The fact that the mixing of liquids is not occurring at the centerline, although the medium is homogeneous and isotropic, will greatly affect the efficiency and power output of the cell. The charge transfer occurs at the interface of the two reactants in the actual MFFCs. Consequently, designing the electrode to capture the charge in such an asymmetric flow zone is highly complicated, especially in the case where the properties of the incoming fluids are much different. To allow the reactants to diffuse into a narrow zone, a raster-controlled path profile is needed for the flow channel, which can dictate the flow of liquids at predefined paths. This brings the focus to the novel corrugated design proposed here, which allows the fluids to flow along controlled paths. Fluent has the limitation that only one species or fluid can be depicted for the mass fraction in a single frame. Consequently, two different images, Figure 6a and b are created to show the mass fractions of ethanol and water, respectively, in the flow channel earlier. The expression manager tool (from Ansys fluent) is deployed here to represent all phases in one frame, as represented by:
VolumeFraction (phase = “water-ethanol”) × MassFraction (species = “H2O<l>”, phase = “water-ethanol”) × 1 + VolumeFraction (phase = “water-ethanol”) × MassFraction (species = “C2O5OH<l>”, phase = “water-ethanol”) × 2.
The expression is to multiply the volume fraction of water-ethanol by the mass fractions of each species. If the volume fraction is 0 (i.e., the air is present), the contour plot will show a value of 0, represented in blue. If the volume fraction is 1 (i.e., water–ethanol is present), and the mass fraction of water is 1, represented in green, the contour will show a value of 1. If the volume fraction is 1 (i.e., water–ethanol is present), and the mass fraction of ethanol is 1, the contour will show a value of 2, represented in red.
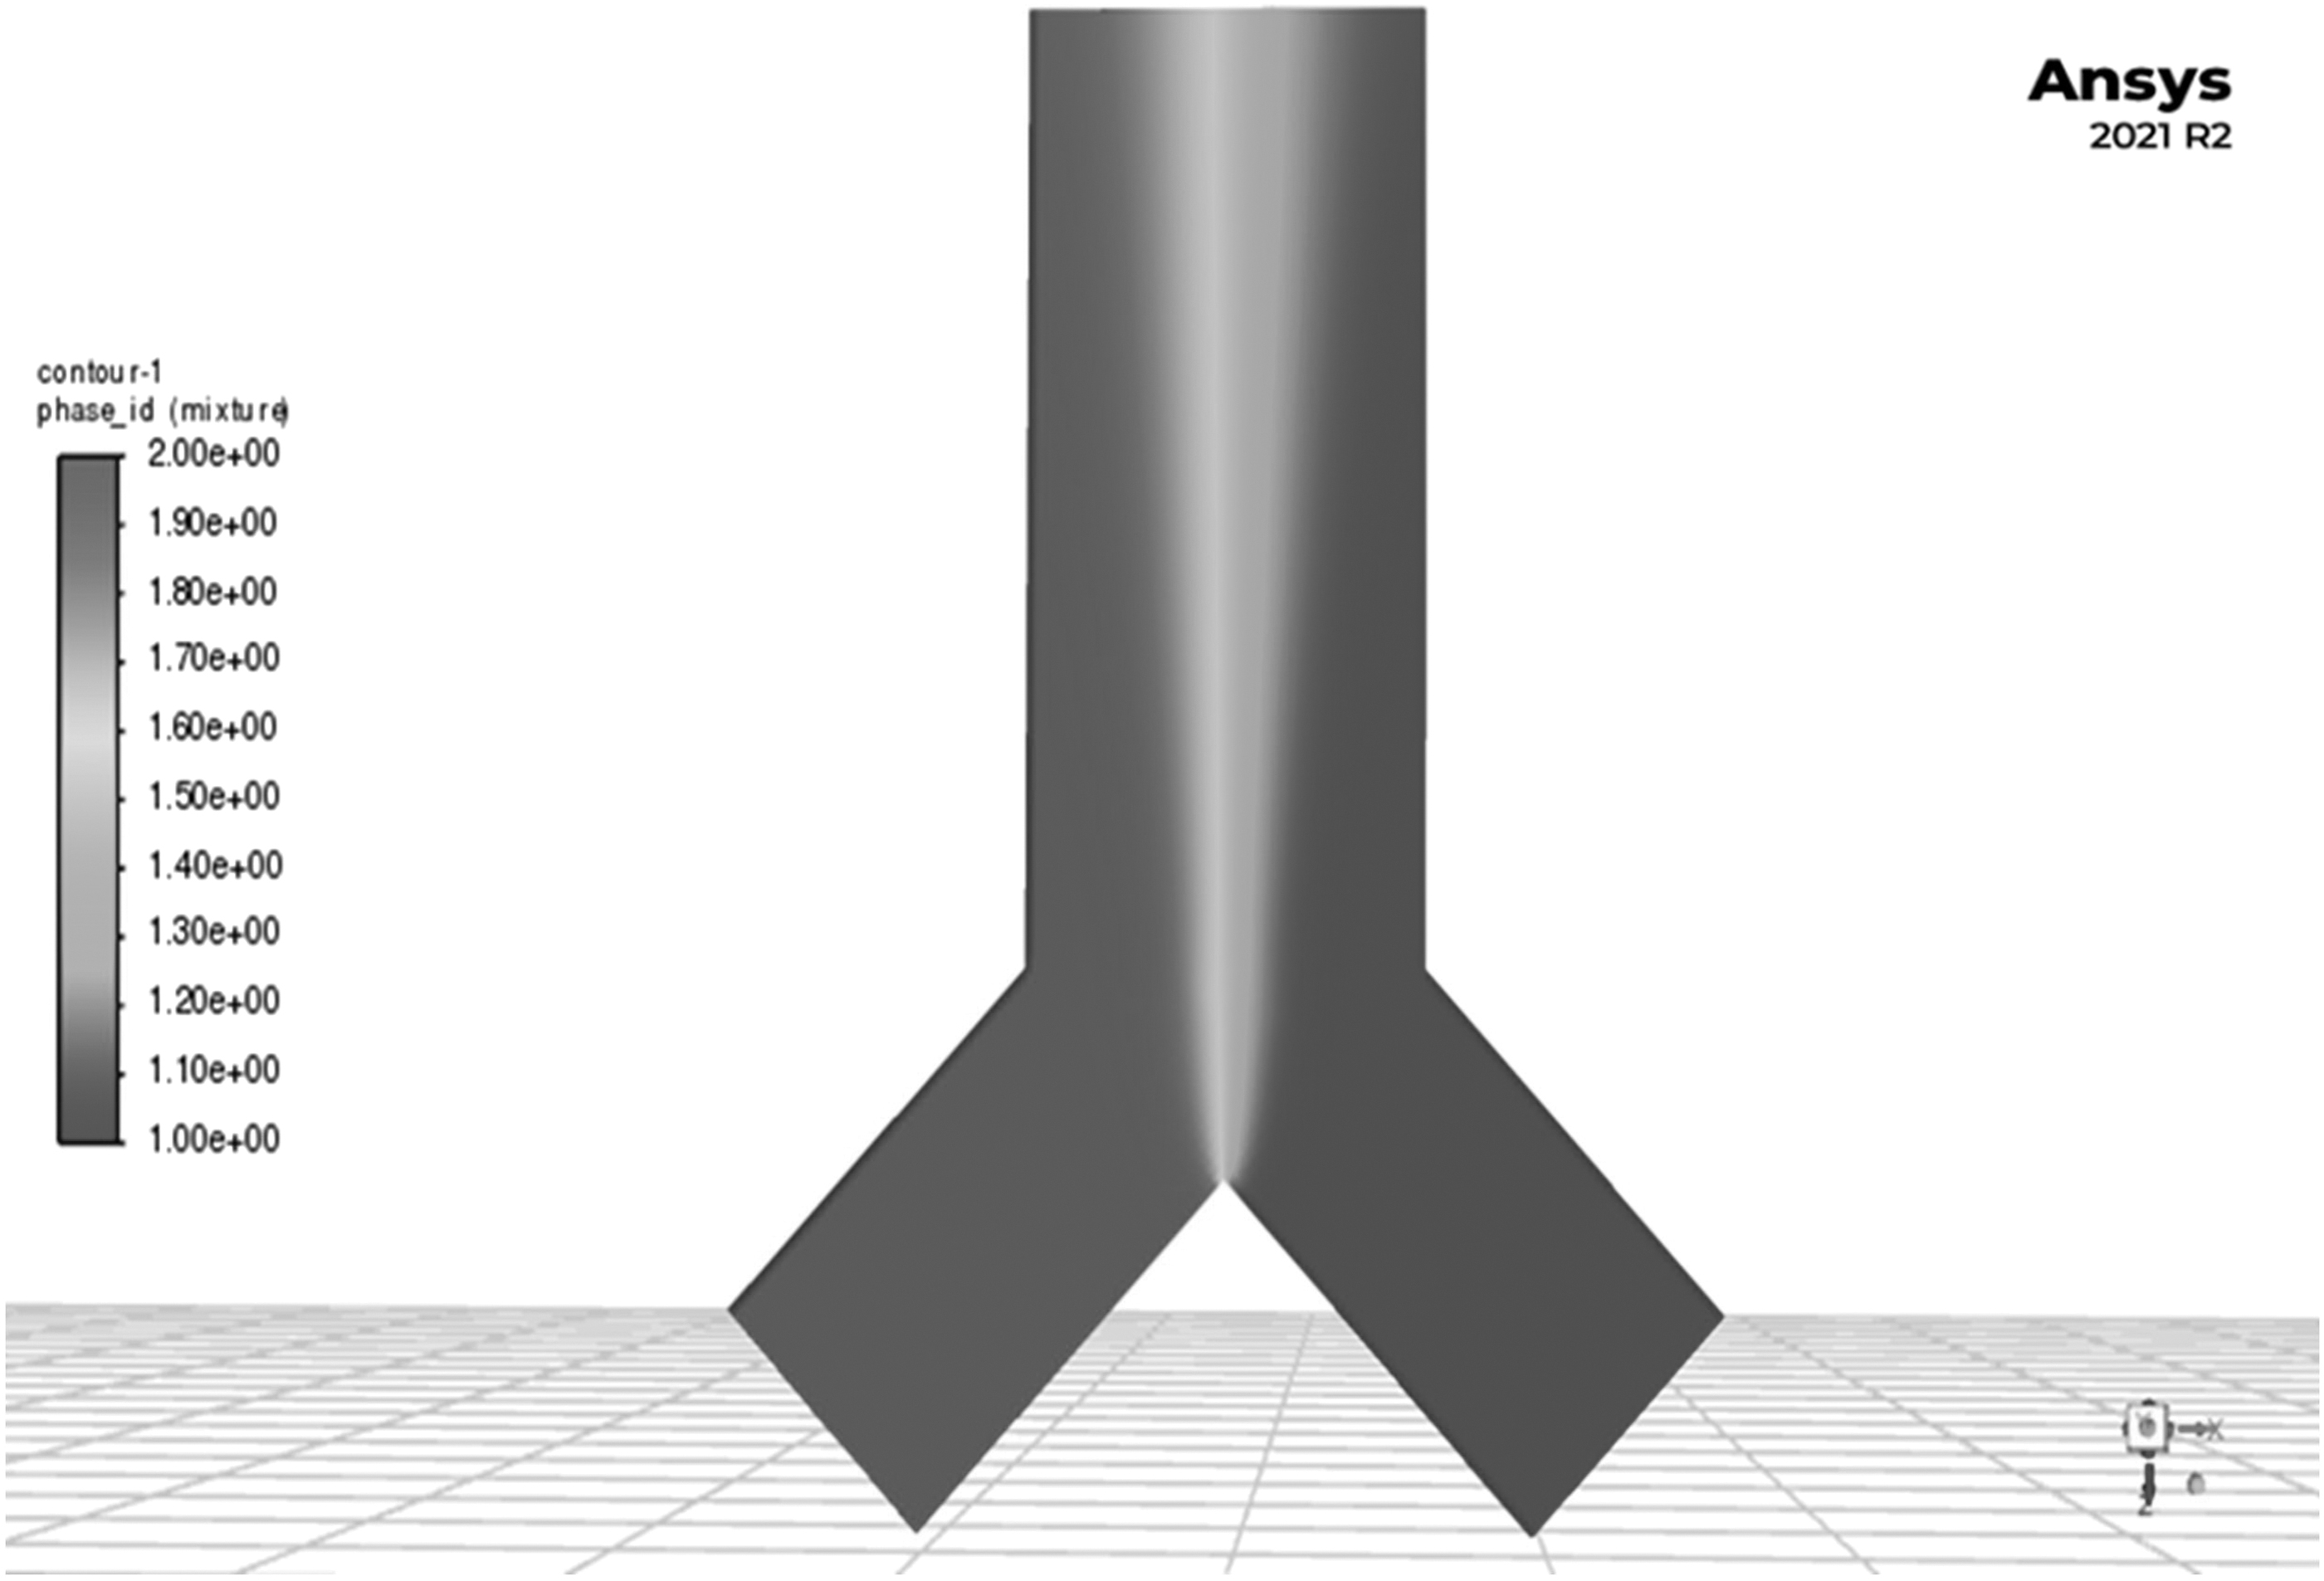
Using the “phase_id” expression, the water/ethanol flow pattern results of the numerical simulation of the dual fluid flow through the corrugated channel design are obtained, as presented in Figure 7. While the flow pattern is strictly controlled irrespective of the fluid flowing through these corrugated channels, the mixing zone is restricted to line contact. From these results, it can be concluded that a corrugated design-based flow channel can dictate the flow of the fluid in the predefined path. However, this functional design leads to a very narrow mixing zone of the fluids at the interface, which might hamper the performance of the actual MFFCs. This raises the need for further advancing the corrugated design of the flow channel.

Numerical simulation results of the two fluids flow through the corrugated channel design with water on the left and ethanol on the right side of the center line.
This brings the design enhancement toward the corrugated-planar flow channel that combines planar and corrugated design properties into one controlled flow and mixing solution for the flow channel. The flow channels are essentially made of corrugated structures on either side, while the central mixing zone is made planar with varying raster fill options to allow for the mixing of the fluids. The outer corrugated zones allow the drawing of the liquid from the two reservoirs while also influencing the flow patterns and mixing in the central planar regions. Numerical simulation results of the fluid flow and mixing patterns based on this model are presented in Figure 8.
Numerical simulation result of the fluid flow and mixing responses in the case of the flow channel with the corrugated-planar structure displaying improved contact area for ion exchange in the central planar regions.
Again, the simulation is done in 3D space, and the expression manager tool “phase_id” is used to represent all the phases in the same way as the results of Figure 7. Based on the fluid flow and mixing profiles obtained, as shown in Figure 8, it is evident that the flow channels with the corrugated-planar structure provide better contact surfaces for ion exchange of the reactants as there is a relatively wider and more controlled area of mixing in the central planar regions. This is envisioned to result in better fuel utilization and power output when this structure is implemented in the actual MFFCs.
The corrugated-planar structure thus appeared to have resolved the constraint of controlling the central mixing zone for the reactants numerically, despite the fact that no colaminar interface is observed. However, in later experimental trials, as discussed in the next section, this observation fails in physical reality. The finite element simulation assumes an isotropic porous material structure for the flow zone. The discrepancy between the numerical and experimental responses arises due to the fact that the printed samples are anisotropic, as will be elaborated on further in the next sections. The anisotropic structures in the central planar regions may lead to no mixing or interface of the two fluids, thereby rendering the cell inactive. To overcome this shortcoming, an amended corrugated–planar structure is developed in which the planar regions extend all the way to the inlets of the two legs of the flow channel from the central mixing zones. While this will allow the fluids climbing the corrugated flow channels to begin the cross-flow beginning from the inlet areas, the relatively wider central mixing zone provides a better opportunity for ion exchange.
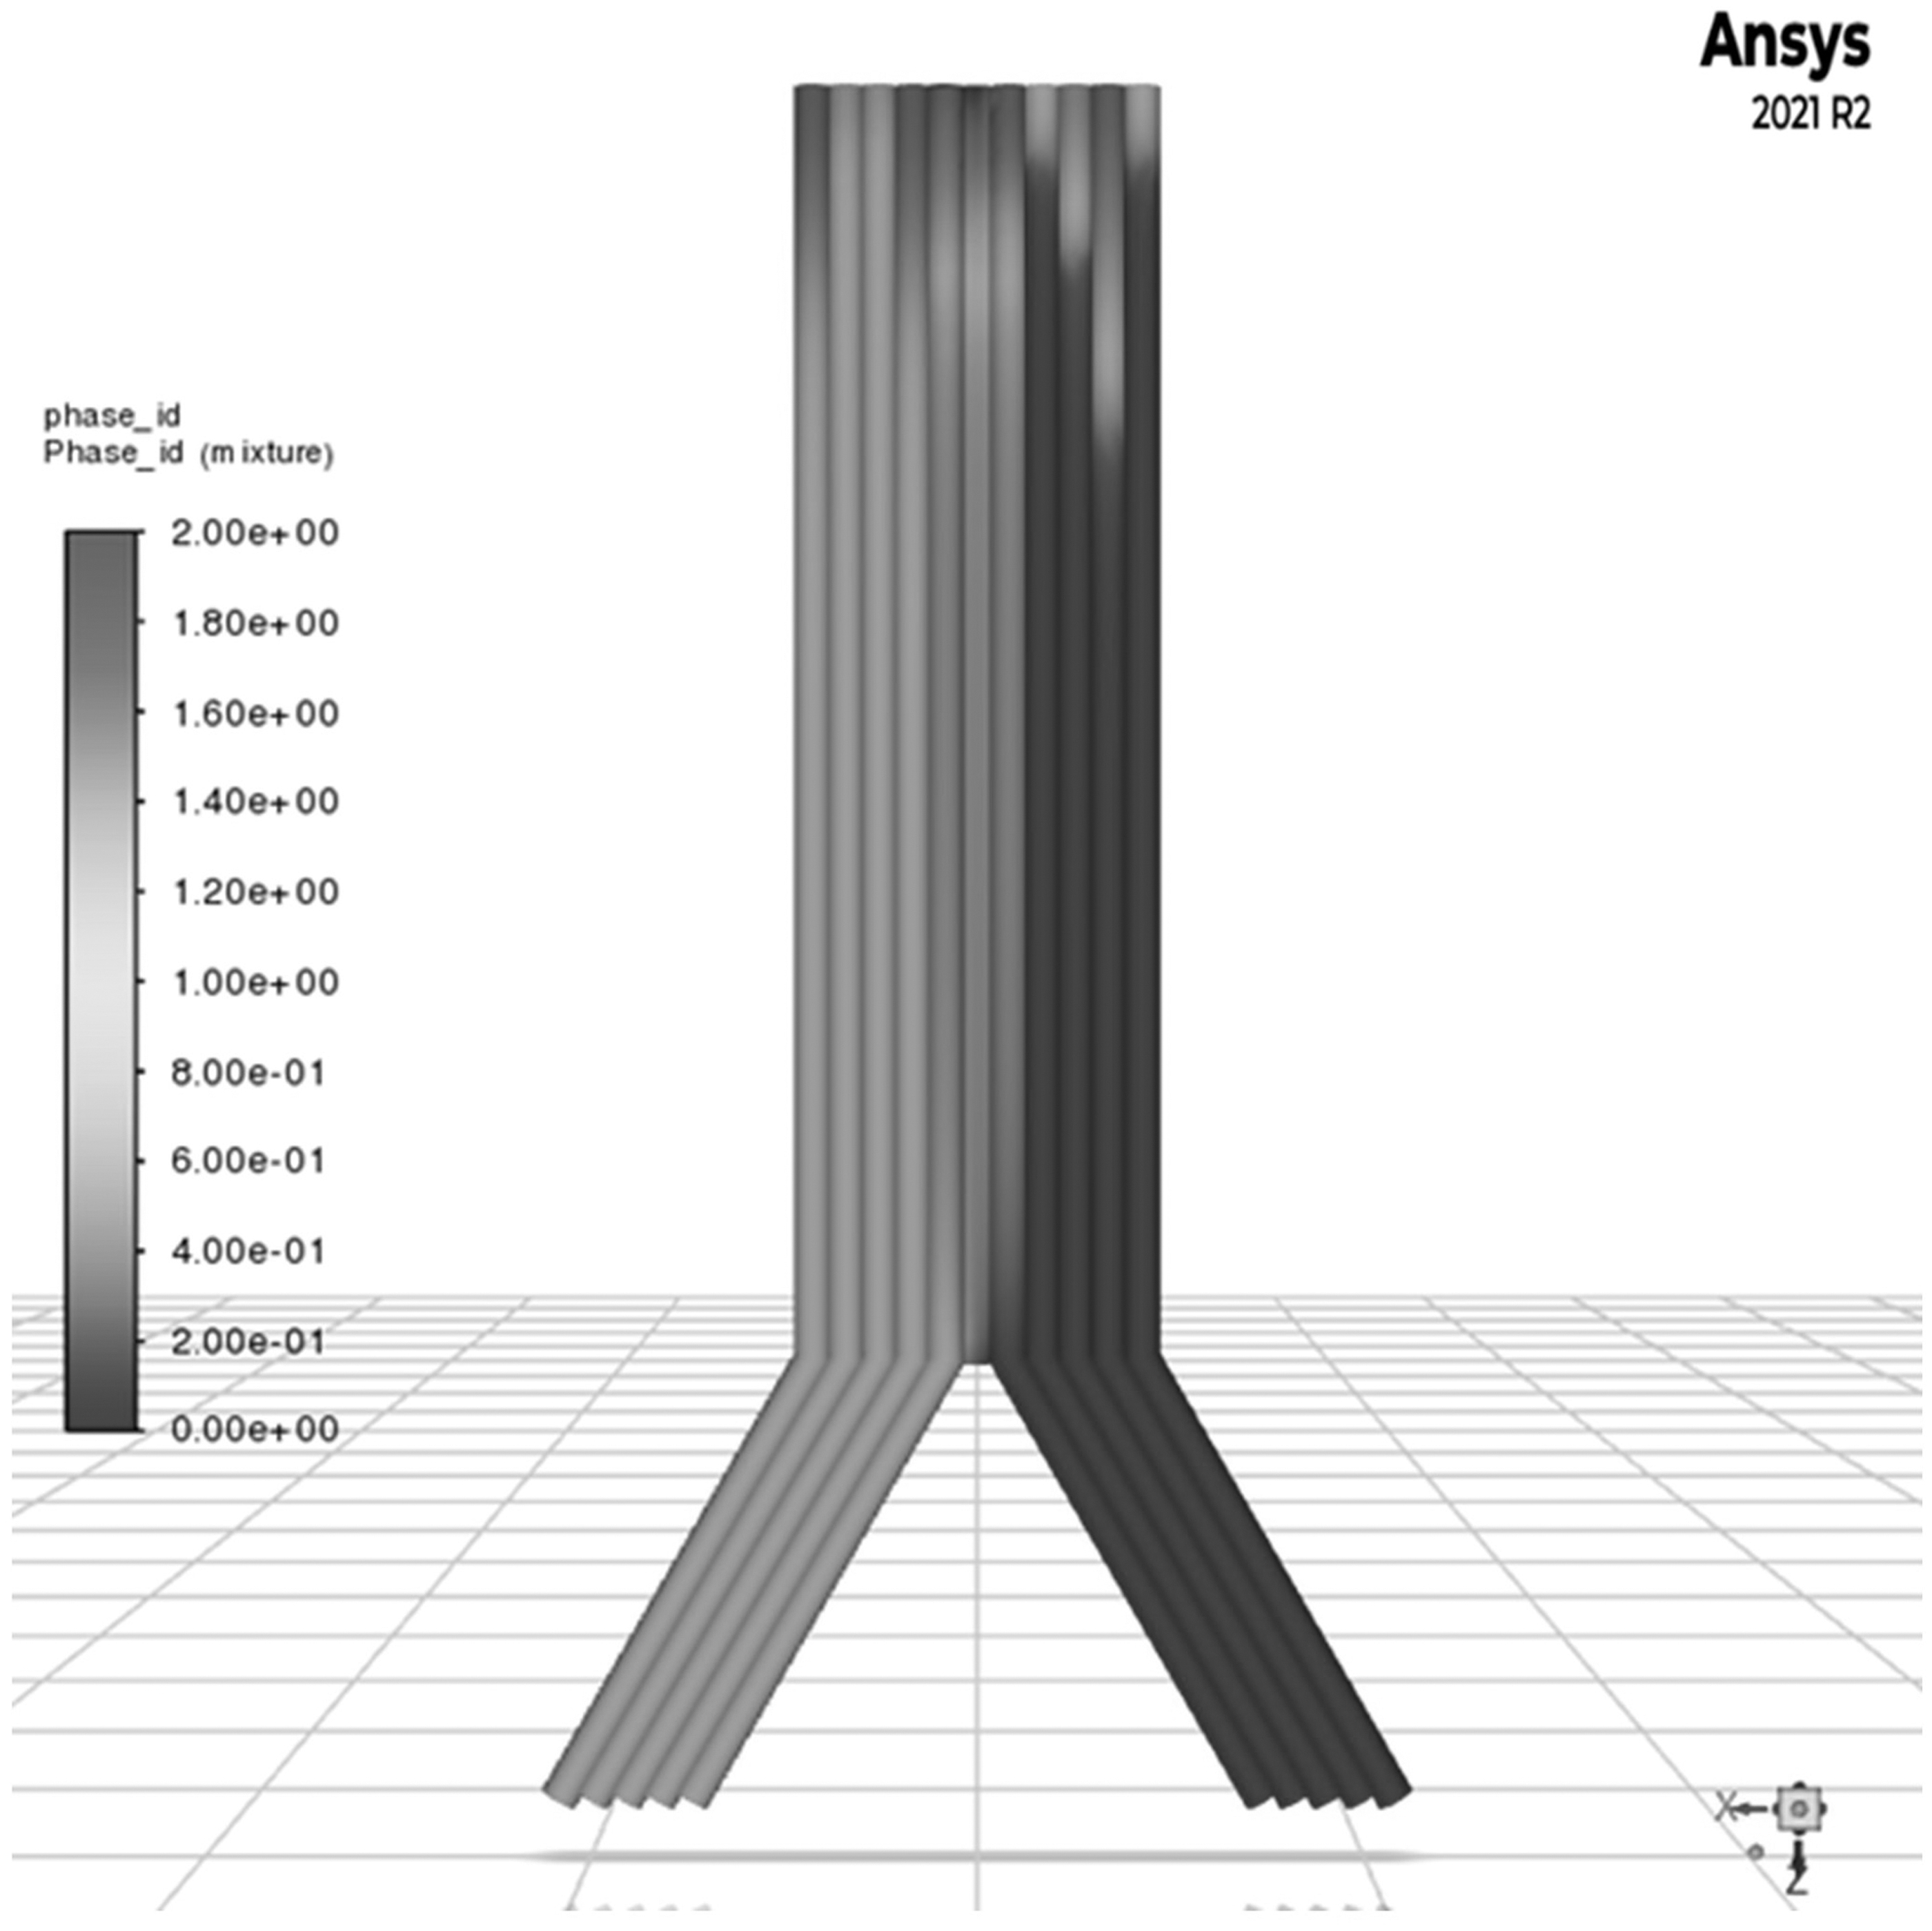
The numerical simulation results of the fluid flow and the mixing responses based on the corrugated-extended planar flow channel structure are presented in Figure 9. Evidently, a colaminar zone is observed at the entry side of the channel. Despite the mixing zone growing as liquids move up, it is restricted to a narrow plane zone. This controlled mixing zone is expected to perform better in actual MFFCs.

Numerical simulation result of the fluid flow and mixing responses in the case of the flow channel with the corrugated-extended-planar structure displaying colaminar flow at entry and controlled mixing of the fluids in the central planar regions.
Experimental dye-flow tests
The experimental setup for the dye-flow tests is discussed in the earlier section. Figure 10 shows the actual test results on the fluid flow and mixing behavior in the paper-based flow channel. The dyed liquids of two different colors from the two inlets gradually climb up the channel and meet at a sharp interface, while the interface area gets wider to varying degrees with the height, as predicted by the numerical simulation results discussed earlier in Numerical Simulation for Fluid Flow Pattern section; however, the divergence of the mixing zone in this case is not as wider and clearly defined as in the finite element simulation due to practical constraints. Bazylak et al 27 did the numerical simulation of a T-shaped flow channel and observed a similar phenomenon when sulfuric and formic acids are allowed to flow. Unlike the conventional flow channels in which the reactants are forced to flow with the help of a micropump, in this case, the two liquids are drawn upward due to capillary action alone. Consequently, the flow behavior depends on surface tension, viscosity, relative permeability, and porosity.

Dye-flow test results are based on colored water climbing through the Y-shaped flow channel made of A4 paper and showing symmetric flow patterns.
The flow patterns obtained in Figure 10 are based on the flow of liquids with two different colors but are essentially composed of the same liquid, which is water. Consequently, the preferences for the porous medium are the same, and the flow pattern is symmetric.
While the flow patterns in the case of the A4 paper are primarily dependent on the homogeneous and isotropic porosity of the substrate and the ensuing capillary action, the 3D-printed flow channels behave differently. The printed and experimentally tested samples for the dye flow tests and those used for numerical simulations are different. This is mainly due to the incompatibility of the CAD models created for physical printing and numerical simulation. The Simplify 3D models generated use a certain rasterization scheme based on the slicing algorithm, which leads to a different mesostructure within the physically printed part.
The FE simulation of the original CAD file is based on the ideal stranded structure. The raster path patterns and the infill parameters will directly influence the effective flow characteristics. The differences in the flow patterns obtained with different raster and infill structures of the printed flow channels are presented in Figures 11–13. Three different raster patterns were used to print the flow channels: parallel raster paths at either +45° or −45° in alternative layers (Fig. 11a), grid-type criss-cross infill patterns at ±45° in each layer (Fig. 11b), and parallel raster paths at 0° in all the layers (Fig. 11c).

Capillary rise of dyed liquid in the printed flow channels with
Capillary rise of dyed liquid in corrugated flow channels with varying thickness and width.

Capillary rise of dyed liquid in
Considering the flow patterns obtained in Figure 11a, the 45° alternating parallel raster paths have created a preferential flow pattern for the liquid on the left leg, which resulted in an unbalanced flow of the two fluids. Also, the alternating directions for the raster lines in different layers caused obstructions for the upward movement, resulting in the loss of fluid flow beyond a certain height. The criss-cross pattern also resulted in an unbalanced flow pattern between the two liquids, although one of the liquids with better access to the porous grid made it to a wider spread compared with the other liquid, as seen in Figure 11b. The 0° case in Figure 11c exhibited a balanced flow of both the liquids upward along the two legs, but considering the horizontal strands allowing for the profuse mixing of the two liquids, there was an uncontrolled mixing all along the length of the flow channel.
Based on these observations, it is evident that the raster path directions have direct control over the flow patterns in the channels. This led to the corrugated design, and the samples were printed with different thicknesses and widths and the results of the dye-flow tests based on these samples are presented in Figure 12. It may be observed from all these three cases that the flow patterns are more streamlined as the colored liquids climb smoothly along the predefined parallel strands uniformly on either side of the central line. While this design was successful in driving the fluids along the preferential directions, the strand structure has resulted in very narrow mixing zones due to the line of the contact interface. An area contact of an interface is vital for the flow of the ions and the efficient charge transfer across the cell. This has led to the next design, where a central plain zone is envisioned to force the cross-flow in a corrugated flow channel. This central plain zone allows area contact/interface of incoming liquids.
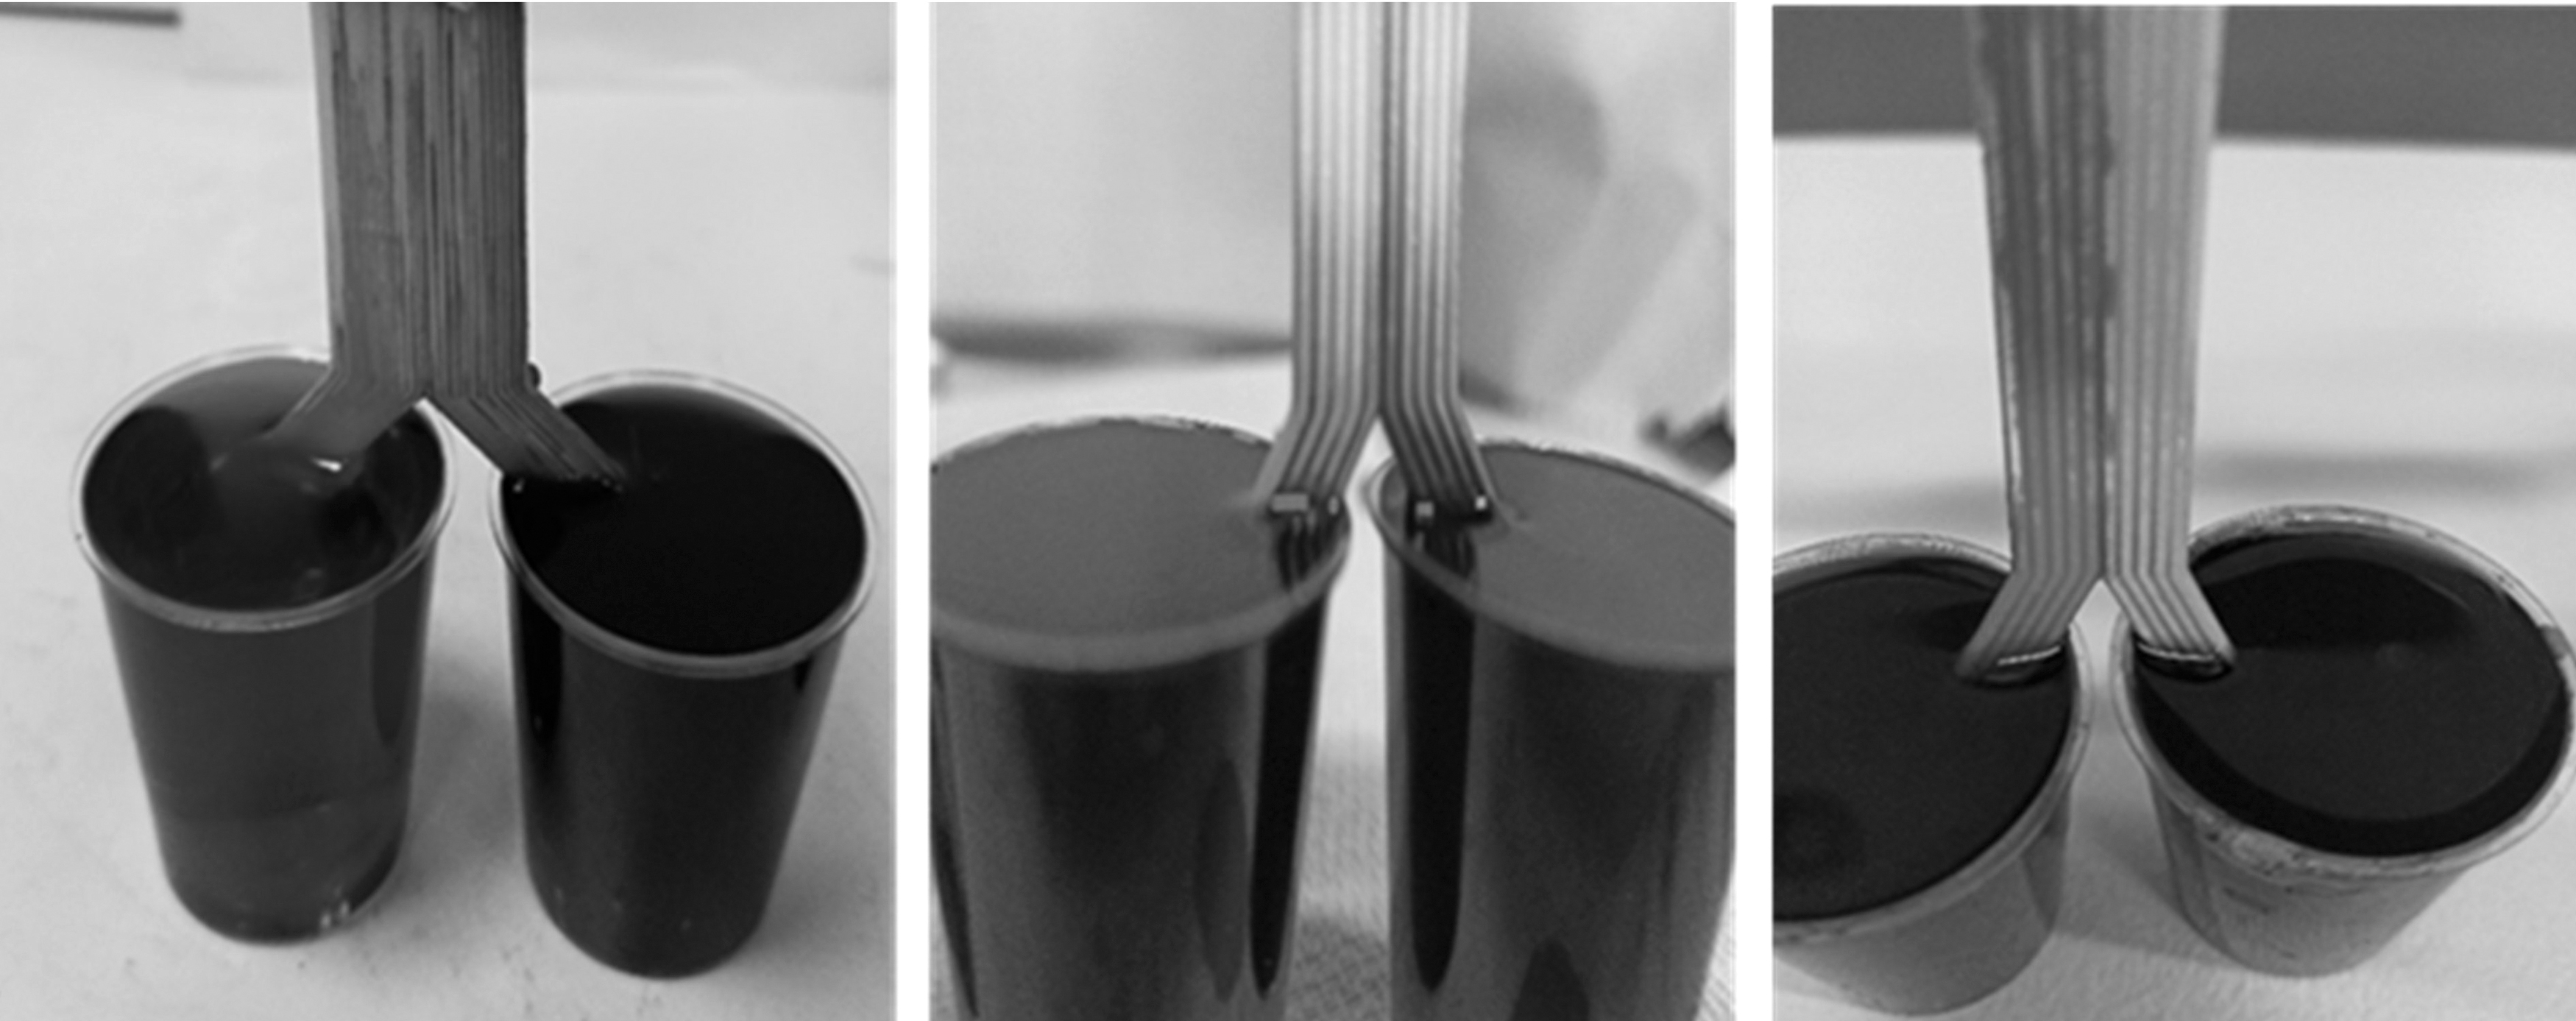
The corrugated-planar design, as shown in Figure 13a, is developed expecting a sharp interface/mixing of the liquids from the corrugated flow streams on either end. However, this design failed, as evident from Figure 13a, where there is no trace of any interface/mixing of the two colored liquids in the central plain zone. The numerical simulation results based on this design showed a better possibility for mixing the fluids. It is the mesostructure resulting from the raster filling of the central zone that is causing this failure in the printed sample, while the ANSYS Fluent simulation assumes a homogeneous isotropic medium in between. Possible improvements through the use of a narrow planar channel in the center are attempted, but the results are still disappointing as there is no trace of any interface, even in this case, as evident in Figure 13b.
The corrugated-planar structure is then amended with the planar regions extending toward the inlets along the two legs (corrugated-extended-planar), as discussed earlier in the Numerical Simulation for Fluid Flow Pattern section. Two variations in the raster orientations are attempted to fill in the central planar regions: ±45° and 0°. While the parallel stranded structure is effective in both cases in driving the two liquids upward without any cross flow, the ±45° infill for the central zone did not allow the liquids to mix properly and climb upward, as evident from Figure 13c, for the same reasons as explained earlier in the case of the dye-flow test. It is already observed that the 0° raster orientation for the mixing zone drives the fluids across effectively and allows for mixing. This has served to achieve mixing in the central zones in the amended corrugated-extended-planar flow channels with the 0° raster path printing of the regions connecting the two-stranded flow channels on either side, as observed in Figure 13d. This cell configuration is expected to perform better in the electrical characterization test results discussed next.
Planar with 0° infill Figure 11c, corrugated Figure 12b, and corrugated-extended-wide-planar with 0° infill Figure 13d will be considered and named as planar, corrugated, and corrugated-planar, respectively, unless explicitly mentioned for the characterization of the performance of the MFFCs, as discussed next.
Numerical simulation is done considering two miscible liquids, water and ethanol, whereas dye-flow test is done in two different color-dyed water only. However, performing dye-test utilizing water and ethanol, was a bit complex, as both of them were transparent, so cannot visually inspect the flow behavior and mixing pattern. Nevertheless, dye-flow tests and numerical simulation helped to visualize the flow behavior and mixing pattern to a great extent for various functional flow channels. Furthermore, simulation is done keeping in mind that the flow channel is based on a porous paper structure. Corrugated flow channels have an advantage that irrespective of the property of reactants, always follow the predefined paths. Additionally, for corrugated-planar flow channels, interference is not completely dictated in the planar zone; still, it is highly restricted in the narrow planar zone, as shown in the simulation and dye-based tests.
MFFC performance characterization
The electrical performance characterization of MFFCs is done by evaluating the stabilized OCV (mV), maximum current density (mA/cm2), and power density (μW/cm2) as the responses based on varying channel architectures as discussed above. Once the cell is set up as depicted in the Materials and Methods section, with the two legs of the Y-shaped cell immersed in the two reservoirs, the electrolyte and the fuel liquids of 1 M concentration, each begin to rise through the flow channel due to the capillary action within the porous substrate structure. The data necessary for plotting the OCV versus time graphs are first generated using the data logger, as explained earlier with the three samples: planar with 0° infill, corrugated, and corrugated-planar with 0° infill and wider planar zone, with three replications in each case. The resulting OCV versus time graphs are presented in Figure 14, where the curves depict the variation of the mean values of the OCVs, while the error bars indicate the experimental deviations at different time intervals based on the three replications.

The OCV versus time graphs for planar, corrugated, and corrugated-planar flow channels.
It may be observed from Figure 14 that in all three cases, the OCV gradually rises initially, reaches a maximum, and then either remains the same almost or decreases slightly and remains constant with the increase in time. The initial rise is due to the fluids picking up momentum, flowing upward, and then initiating the central interface/mixing, whereby the ion exchange gradually increases within the cell and builds up the charge. In the case of the planar structure, the OCV gradually increased with time, reached a maximum of 203 mV, then decreased slightly to around 100 mV, and remained constant at that level for the remainder of the experimental time period.
While the initial rise is as explained, due to the initial colaminar behavior, the intermediate fall in the OCV is due to the excessive mixing/loss of colaminar behavior and a loss of the potential difference, as evidenced in the dye-flow test result presented for Y-shaped planar with parallel raster paths at 0° in all the layers. Additionally, the flow of one of the reactants across to the other side (cross-flow) is observed to happen with time, lowering the potentials. Furthermore, with the passage of time, the charge is stabilized due to the homogenization of the reactants in the mixing region.
With the corrugated flow channel, the OCV raised to a maximum potential of 324 mV and remained mostly stable at that level with time, as seen in Figure 14. In this case, the flow of the reactants has been streamlined from the start, with a very sharp line interference at the central mixing zone, as evident in the dye-flow patterns of all the cases presented for corrugated flow channels. As a result, the cell potential increases as the reactants flow along the channel, and the diffusion of the reacting species accelerates. Once the channel is filled with the reactants, the potential gets stabilized. The OCV versus time responses of the corrugated-extended-planar flow channel with a wider planar region at 0° infill is very similar, but the maximum potential reached a value of 687 mV, as seen in Figure 14 and remains stable at that level for the remainder of the total experimental time period (90 min).
Compared with the simple corrugated structure with the mixing zone is a line contact and restricted, the mixing and diffusion zone in the corrugated-extended-plane with a wider plane (0° Infill) has area contact, so better ion transfer, as discussed earlier in the Experimental Dye-Flow Tests section and evident from the flow patterns presented in the Dye-flow test. This controlled zone with a wider area of contact allows for far better migration of the reacting species and the flow of ions across the electrodes. Additionally, the cross-flow is prevented by the corrugated structures and restricts the interface to a narrow planar zone only. Furthermore, the approximate location of reactants mixing and interference is known beforehand, based on dye-flow test and numerical simulation. So, depositing the electrode at a preknown location is advantageous to capture the ions easily. To verify this, the experiment with one of the corrugated-planar flow channels is conducted for an extended period of over 15 h and the data generated based on the datalogger are plotted as shown in Figure 15.

OCV versus time responses of a corrugated-extended-planar with a wider planar channel, with 0° infill, cell demonstrating stability over an extended period of over 15 h.
The result of Figure 15 clearly evidences that the cell maintains a stable OCV at around a mean potential of 683 mV, with no load condition, demonstrating the possibility for long-term usage. An extra external sink was attached to the sample, which helped to draw the reactants continuously and keep the OCV stable for the duration of the test, which was 15 h.
Dye flow test is done on the flow channel without a sink. The flow time is dependent on the flow channel architecture. For the 0° infill, it is taking longer time than 90° infill, which means a corrugated flow channel, always takes less time to reach the liquids to the top. The average time for the flow channel varies between ∼25–50 min based on the architecture. This duration is somehow matching with the time required for the cell to achieve the stable potential.
The cell potentials remain stable once the fuel and electrolyte start mixing and stabilizing, as evident from the OCV versus time plots discussed above. Once this constant potential is reached, the electrical connections are changed to the configuration as shown in the cell load test setup, and the load and polarization curves are obtained by varying the circuit resistance using the resistance box as 1, 100, 250, and 1000 kΩ, and recording the corresponding voltage readings from the digital multimeter. The average values of the voltages for any given resistance are used to calculate the current and power densities and plot the load and polarization curves, as shown in Figure 16. Comparatively, the corrugated and extended planar flow channel configuration scored the best with the maximum current and power densities at 1.235 mA/cm2 and 387.17 μW/cm2, respectively. The simple corrugated structure achieved an intermediate level, with the maximum current and power densities at 0.876 mA/cm2 and 122.83 μW/cm2, respectively, whereas the planar flow channel with 0° infill had the lowest of the same values at 0.6413 mA/cm2 and 55.386 μW/cm2.

Load (black) and polarization (red) curves for different flow channel structures.
Drawing inferences from the literature, the PMFFCs evaluated by Rao et al [18] were reported to achieve maximum OCV, current, and power densities of 370 mV, 0.748 mA/cm2, and 69.12 μW/cm2, respectively. Comparatively, the maximum responses of the corrugated extended planar printed cells evaluated in the current research are OCV 687 mV, current density 1.235 mA/cm2, and power density 387.15 μW/cm2. In comparison, all these critical cell responses are at much higher levels compared with PMFFCs.
In conclusion, planar flow channel-based MFFCs witnessed uncontrolled mixing with no interference behavior, which leads to worse performance. In the case of the pure corrugated structure, despite the fact that there is a sharp boundary between the two fluids that are going through colaminar flow conditions, the area of interaction for the ion exchange is quite narrow due to the heavily restricted line contact between two parallel cylindrical strands. The corrugated planar structure resolved this problem by creating a small area of the flattened zone between the two corrugated flow channels. The presence of an exchange area led to some losses of the sharp boundary between the two flowing electrolytes, but still, the cell performed better considering the fact that there is a wider cross-sectional area for the ion exchange. Furthermore, it may be noted that the mixing zone is mainly due to the spreading of the fluids on the surface and not across the whole cross-section of the entire length of the flat interaction zone for ion exchange.
Three-dimensionally printed polymeric flow channels provide a much longer service life for fuel cells. Furthermore, the additional freedom to closely control the inter- and intrastrand micro and mesostructures of the rasterized flow channels by properly exploiting the point-by-point material consolidation mechanics of AM will allow for further enhancements in the cell performance. The same attributes of AM used at a macro level will also offer a plethora of new possibilities in terms of the overall form of the flow channels, such as multibranch and interdigitated options for better control over the diffusion zones and responses.
Conclusion
MFFCs based on 3D-printed polymer flow channels with controlled raster structures are evaluated in this research by numerical and experimental means. Numerical simulations based on finite element modeling of the multiphase fluid flow in porous medium allowed to capture of the flow and mixing responses of reactants in flow channels for different architectures. Flow channels of varying physical configurations 3D printed using the Lay-Fomm 60 polymer filaments followed by the experimental dye-flow tests led to the verification of the numerical results and the final convergence on the corrugated extended planar flow channels as the most optimum for the best performance of the printed cells.
Electrical characterization of the final printed MFFCs validated this as the cells based on the corrugated and extended planar structures demonstrated double the OCV and much higher current and power densities compared with the PMFFCs reported in the literature. Overall, the MFFCs based on the three forms of flow channels investigated, planar, corrugated, and corrugated-planar, resulted in the maximum OCV at 203, 324, and 687 mV; power densities at 55.386, 122.836, and 387.17 μW/cm2; and current densities at 0.6413, 0.876, and 1.235 mA/cm2, respectively.
Uncontrolled mixing and absence of colaminar flow in the planar flow channel attributed to low performance. The better performance of corrugated flow channels is attributed to highly colaminar flow; however, ion exchange is limited due to the heavily restricted line contact between two parallel cylindrical strands. Finally, corrugated-planar flow channel-based MFFCs performed the best among the three. The reason attributed to the wider area contact region for ion exchange and mixing is restricted to a small planar zone, even though the colaminar flow is not observed.
Footnotes
Acknowledgments
The authors wish to acknowledge the support from Dr. Yifan Lv and the technical team at AUT for helping with the experimental work, where necessary.
Authors' Contributions
V.K. is the scholar and the main contributor to the conceptualization, methodology, software, verification, investigation, writing original draft and review and editing tasks. M.P.B. is currently a postdoctoral fellow at the AUT and played a central role in facilitating the experimental setups and the printing solutions and contributed to the methodology, investigation, and resourcing of the research. S.S. is a professor in Mechanical Engineering at the AUT and the primary supervisor of the research undertaken. His contributions are in conceptualization, methodology, resources, writing original draft, review and editing, supervision, project administration, and funding acquisition tasks.
Author Disclosure Statement
No competing financial interests exist.
Funding Information
The authors wish to acknowledge a part of the support received from Marsden grant no. MFP AUT1901 in carrying out some of the research reported in this article.