
Abstract
This study describes an intelligent method for modeling and optimization of piezoelectric ejection system design for additive manufacturing. It is a combination of neural network (NN) techniques and finite element simulation (FES) that allows designing each parameter of a piezoelectric ejection system faster and more reliably than conventional methods. Using experimental and literature data, a FE model of the droplet ejection process was developed and validated to predict two indexes of droplet ejection behavior (DEB): jetting velocity and droplet diameter. Two artificial neural network (ANN) models based on feed-forward back propagation were developed and optimized by genetic algorithm (GA). A database was established by FE calculations, and the models were trained to establish the relationship between the piezoelectric ejection system design input parameters and each DEB indicator. The results show that both NN models can independently predict the droplet jetting velocity and droplet diameter values from the training and testing data with high accuracy to determine the optimal piezoelectric ejection system design. Finally, the accuracy of the prediction results of the FES and ANN-GA models was verified experimentally. It was found that the errors between the predicted and experimental results were 4.48% and 3.18% for the jetting velocity and droplet diameter, respectively, verifying that the optimization method is reliable and robust for piezoelectric ejection system design optimization.
Introduction
The ability of additive manufacturing to design parts that cannot be easily manufactured with conventional manufacturing techniques offers great opportunities for a wide range of applications, including aerospace, automotive, defense, and biomedical industries. 1 Additive manufacturing is also called three-dimensional (3D) printing. In recent years, material-jetting printing has attracted increasing attention as one of the core technologies in the development of 3D printing with features such as noncontact, high resolution, low cost, and scalability for large-area manufacturing. 2
Material-jetting printing is the process of spraying liquid material onto the surface of a substrate in a certain way to form the final product. Based on the principles of droplet formation and jetting, jet printing is currently divided into Drop-On-Demand (DoD) and Continuous Jetting methods. 3 The DoD method is a method based on the microdroplet ejection principle and fluid droplet generation technology (also known as droplet generation technology), which uses the pressure generated by a periodic external drive to propel the liquid material in the form of microliquid that is periodically ejected from the end of the nozzle of the microjet cavity in layers to form a 3D entity. 4
The DoD method has the ability to produce less waste and higher resolution printing because the individual droplets are produced by rapid changes in cavity volume compared with the continuous jetting method. In the field of jet printing, the jet-on-demand (DoD) method is more widely used. 5
The noncontact piezoelectric ejection process is a process suitable for droplet generation in the DoD mode. Piezoelectric ejection has the characteristics of fast response, the volume and diameter of droplets can be changed in real time by adjusting the frequency during piezoelectric ejection, and the speed of droplets during ejection can be controlled. 6
Despite its many advantages, there is an urgent need to optimize the quality and accuracy of piezoelectric ejection. Problems such as high overspray or discontinuities may occur due to various factors such as material properties, substrate characteristics, and jetting process parameters.7–9 The number of jet printing applications involved in the manufacturing process is also increasing, requiring higher accuracy of droplet ejection along with smaller volume requirements. Therefore, achieving microvolume, high precision, and uniformity in piezoelectric jetting is of great importance for the study of jet printing.
However, among the many factors affecting the quality of jet printing, process parameters (droplet spacing, jet height, nozzle size, etc.) are preferred for the optimization of noncontact piezoelectric ejection processes because process parameters have a significant impact on the droplet ejection behavior (DEB), especially for nozzles and needle in jet printing.10–12 Therefore, it is very important to design appropriate nozzle and needle in piezoelectric ejection systems to control the DEB.
Several scholars have conducted experiments on the relationship between design parameters and results of piezoelectric injection systems through hydrodynamic modeling.13,14 Since accurately determining the causal relationship between process parameters and ejection behavior of piezoelectric ejection systems remains a challenge, many researchers use empirical operational methods to manually optimize the piezoelectric ejection process. However, the results are inaccurate and inefficient due to inadequate design space exploration and lack of quantitative modeling. Scholars have attempted many works to investigate the control mechanisms of droplet formation to address these challenges.
Many domestic and international scholars have conducted numerous studies on the design parameters affecting the indicators of ejection behavior in piezoelectric ejection systems, and many results have been obtained. For example, Bartolo et al. 15 used computational fluid dynamics (CFD) modeling to measure material properties (e.g., viscosity), and Tsai et al. 16 investigated the effect of pulse voltage on droplet behavior. Feng 17 proposed a streamlined 3D-CFD model to investigate the effects of droplet motion displacement and nozzle cone angle on droplet diameter. Salary et al. 7 created a 2D CFD model and derived a critical value for the effect of printing speed on process accuracy. Since the CFD model was created as a simplified model and could only be used for a specific printing technology, it could not be used for a wide range of applications by creating a simplified CFD model, while being less efficient.
Although computational fluid dynamics (CFD) models and simplified models based on specific ejection systems have been proposed for quantitative analysis of non-contact jetting printing processes, it is difficult to propose a general CFD model due to limited computational resources. This will hinder its application in real-time printing process optimization. However, due to limited computational resources, it is difficult to propose a general CFD model. This will hinder its application in real-time printing process optimization. In addition, traditional structural design methods only analyze and design for one droplet jetting behavior.18,19 If multiple DEB indexes are to be satisfied, the model must be continuously updated and tested, which increases the time cost. Therefore, there is a need to investigate new design methods for droplet ejection systems.
Machine learning, unlike traditional methods, allows for efficient process optimization by introducing new process modeling and optimization methods. 20 The benefits of applying machine learning to piezoelectric ejection are becoming apparent through recent process optimization studies. 21
Artificial neural networks (ANNs), one of the machine learning models, are used to discover correlations between different input–output parameters of complex systems, which is particularly helpful for general modeling across disciplines without prior knowledge of these phenomena. Su and Chiang 22 and Menon et al. 23 combined physical models and neural networks (NNs) to predict the printing performance of inks using a small amount of data. Huang et al. 24 proposed an unsupervised learning algorithm applied to study the evolutionary behavior of droplets, using video data as a basis. To ensure the accuracy of the number and position of printed droplets, Wang et al. 25 improved the prediction accuracy by back propagation (BP) NN using pressure sensor data as input and droplet ejection state as output.
To the authors' knowledge, no article has explored the potential of a combined NN and finite element (FE)-based approach in obtaining predictive models of droplet diameter and jetting velocity. Since manufacturing piezoelectric ejection devices of different sizes is both expensive and wasteful, it is not feasible to generate a sufficient amount of data to train a typical NN model using conventional methods. In this article, we focus on the use of the FE method to obtain training data for NN models, to build an intelligent optimization algorithm for the design of highly complex nonlinear piezoelectric ejection systems, and to predict DEBs to achieve higher reliability and minimal material waste. The NN model is prone to fall into local minima during training because it is works by the gradient descent method. It was found that by combining ANN with genetic algorithm (GA), the resulting ANN-GA can avoid this problem. 26
Three different models, namely, statistical regression analysis, ANN, and GA-ANN, have been shown to predict DEB. This approach shows great ability in predicting such highly nonlinear and unstable systems.
In this article, a FE model for the design of piezoelectric ejection system is established based on the basic theory of fluid dynamics. The possibility of building an NN model to predict two different indicators of DEB during jetting is tested and discussed from a set of FE calculations. Then, an effective NN model that can be used as a proxy model is combined with a GA search technique to optimize the droplet ejection system design (DESD) parameter values. Finally, experiments were designed to verify the accuracy and validity of the model and to evaluate the effectiveness of the intelligent method proposed in this study for DESD optimization.
FE Modeling and Simulation of Droplet Ejection Process
The process of building FE model
Droplet ejection system design
The piezoelectric-driven droplet injection system studied in this article is referenced from Lu et al.
27
and improved with the structure and dimensions shown in Figure 1. The inlet pressure is provided by an air pump, which is connected to the top of the material reservoir and continuously presses the glue into the piezoelectric injection system. The piezoelectric element is driven by the excitation of a periodic alternating electrical signal. It can output vibrations of corresponding amplitude and frequency. By applying a driving voltage to the piezoelectric element, the inverse piezoelectric effect is used to cause the piezoelectric element to expand and contract, thus achieving the squeezing of the liquid inside the nozzle and finally completing the microdrop spraying. The nozzle size parameters

Design of the studied piezoelectric ejection system and dimensions of core components (nozzle and needle).
Numerical simulation using ANSYS Fluent software
In this article, a multicoupled phase change model of fluid flow was developed using ANSYS Fluent software. The software uses the volume of fluid algorithm to simulate and analyze the fluid flow.
28
The FE simulation (FES) can be set to a computational environment close to the experimental conditions, thus ensuring that the results of the numerical calculations are closer to the experimental results. In the developed model, the following assumptions were made:
The fluid is an incompressible Newtonian fluid. The jetting time is short and the influence of temperature gradient can be ignored.
Since the heat exchange in incompressible fluids is small and negligible, the controlling equations for the droplet ejection process are established using the mass and momentum equations without considering the law of conservation of energy, and the evolution of the flow field is simulated as follows 29 :
Continuity equation
Navier–Stokes (momentum) equation
where
As the fluid inside the nozzle is incompressible fluid, the density is constant, and does not take into account heat transfer; the law of conservation of mass can be simplified as follows:
Generate the mesh and set the appropriate boundary conditions
The two-dimensional diagram of the model designed in this study is shown in Figure 2a. The up-and-down reciprocating motion of the needle driven by a piezoelectric actuator causes the fluid inside the nozzle to be ejected at a certain speed and form individual droplets. To obtain the exact solution, different mesh sizes were tested, and the final FE mesh used in this article has a size of 0.005 mm for tetrahedral and triangular meshes, as shown in Figure 2b.
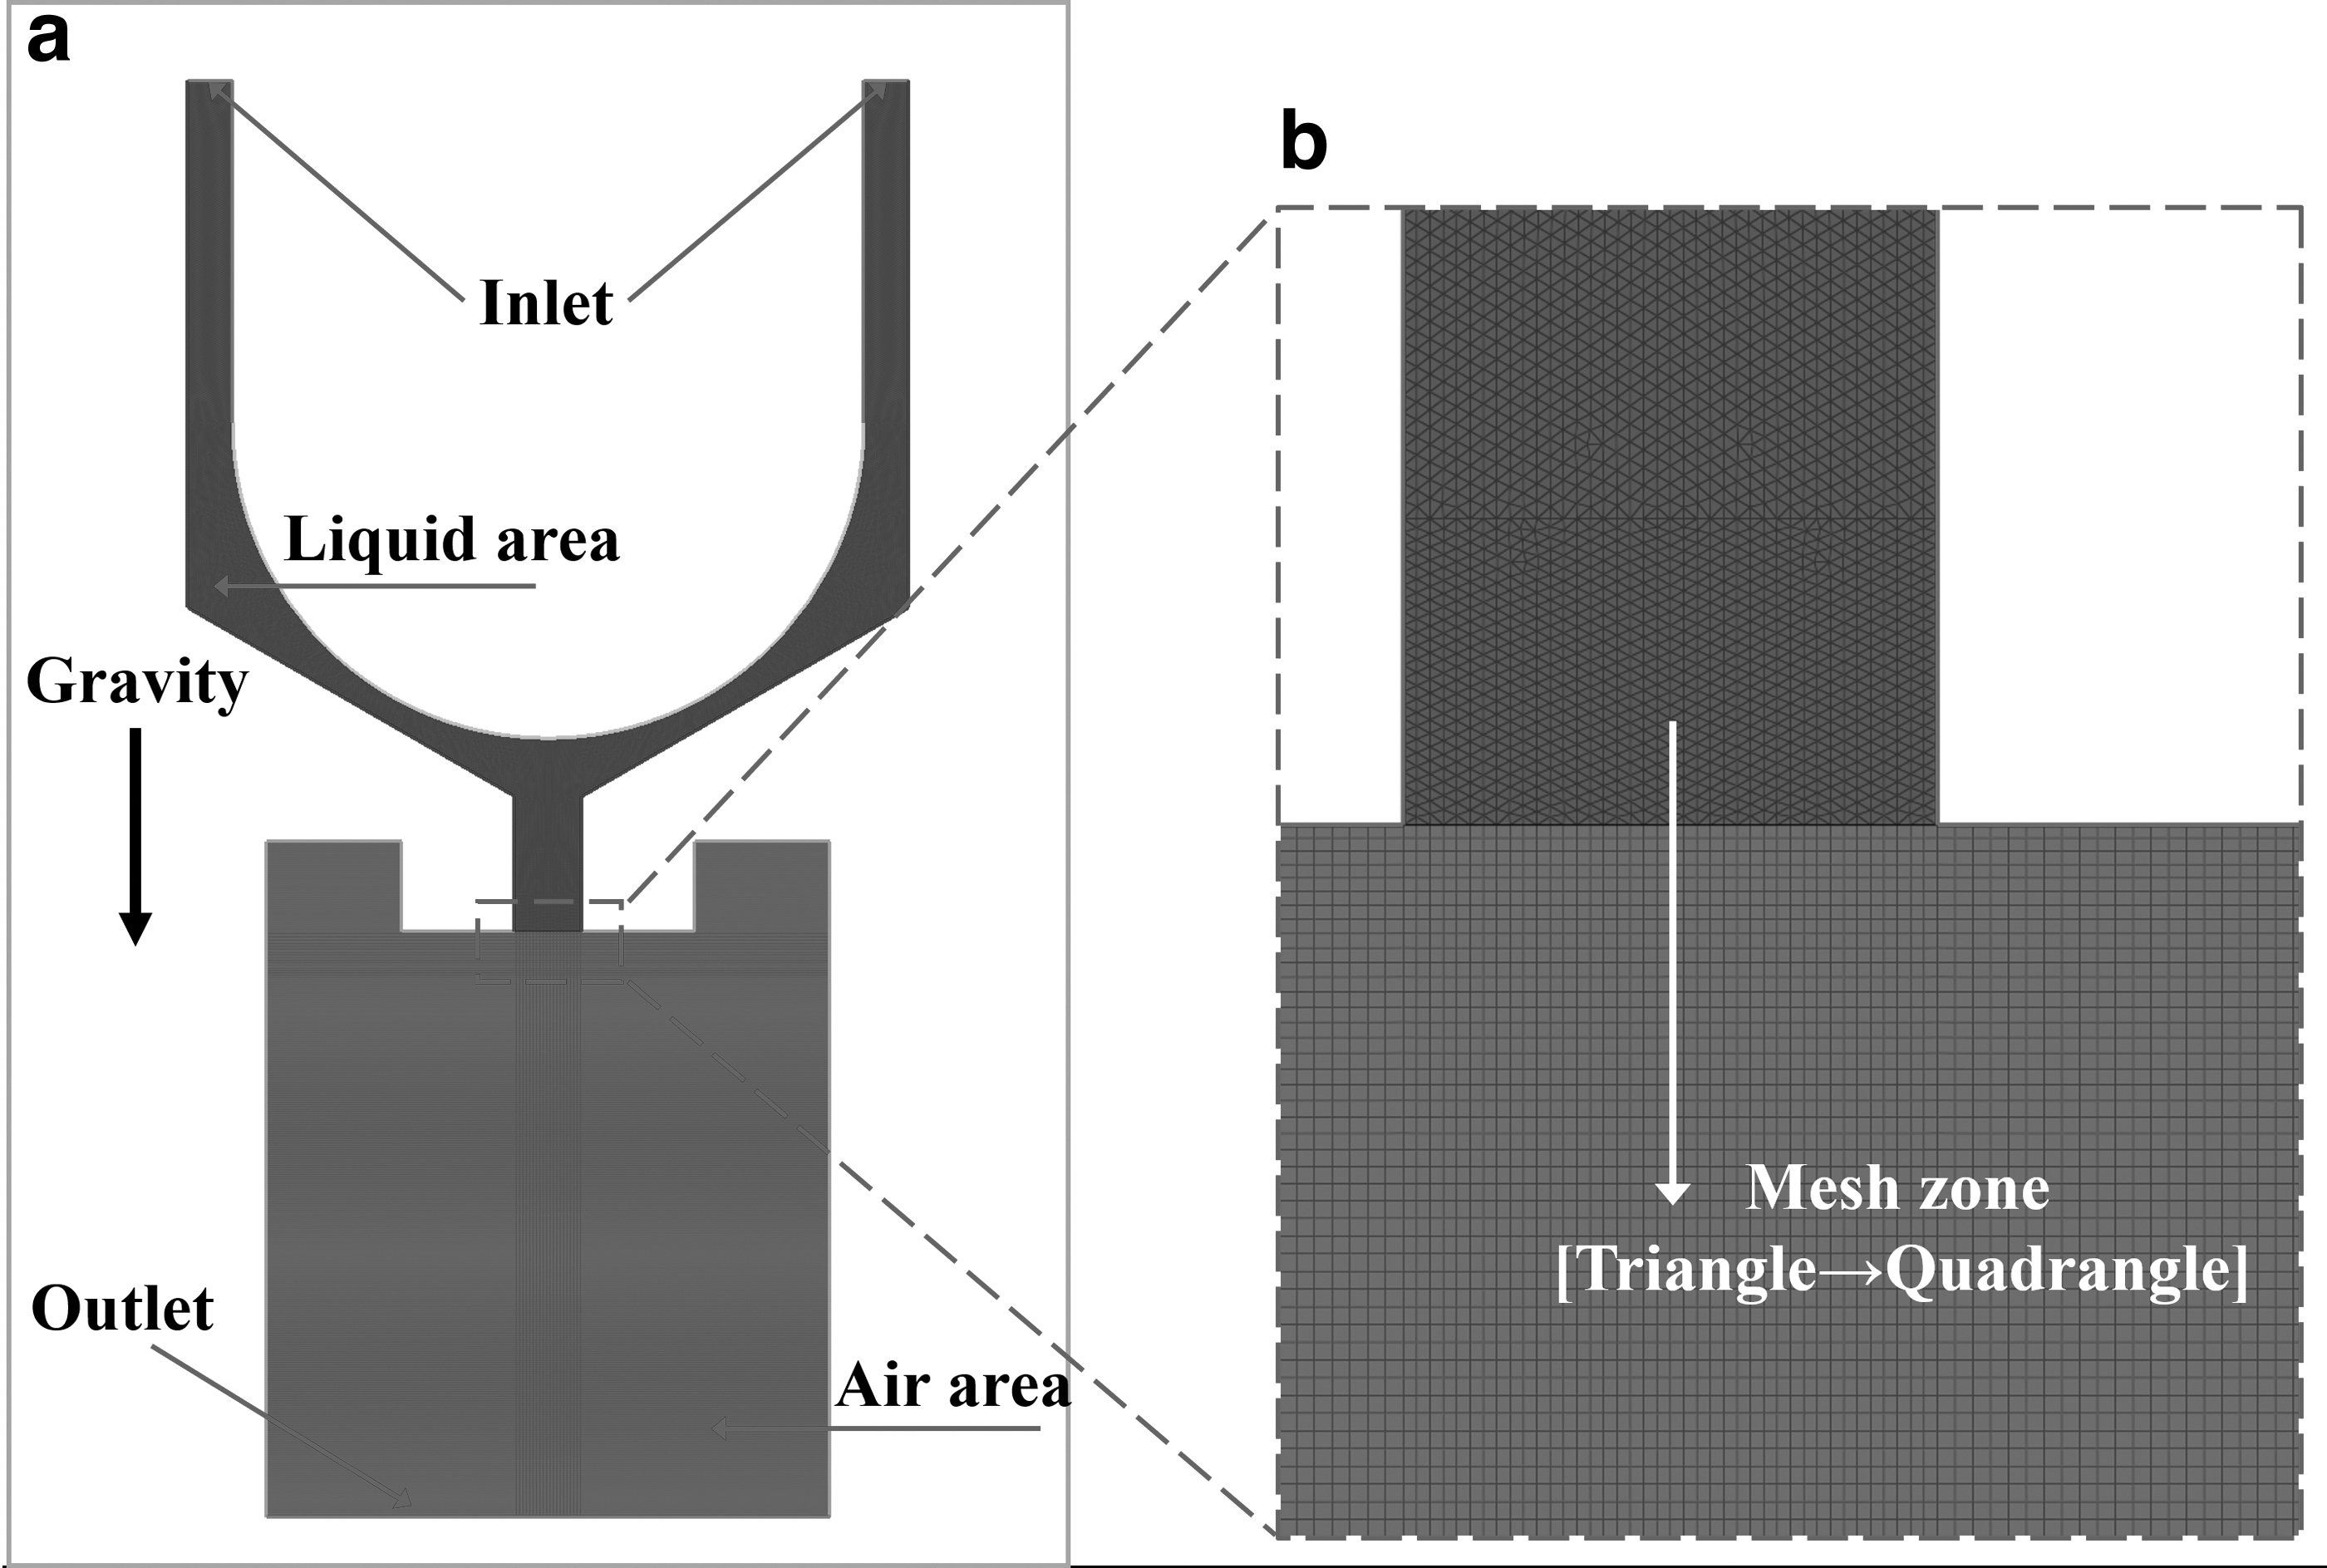
The studied model.
The density and kinematic viscosity of the fluid material used in this study were 1.45 g/cm3 and 0.02 pa/s at 27°C. The pressure at the inlet was kept constant throughout the ejection phase at 0.05 MPa. Heat transfer was not considered. The specific parameters are shown in Table 1.
Fluid Material Parameters
Validation of the FES results
In this article, the validity of the above FE model is verified by comparing the simulation results with literature data and experimental results. The validation process consists of two steps. First, the evolution of the droplet formation process during the ejection phase is verified qualitatively. Then, quantitative validation is considered and the flow velocity of the fluid during ejection is compared with the results of experimental measurements performed using a suitable charge coupled device (CCD) camera.
After considering the corresponding geometric and boundary conditions, experimental simulations were performed with the developed FE model described in The Process of Building FE Model section. Figure 3 shows the asymptotic evolution of the droplet shape during the FES of the ejection. It agrees well with the experimental observations in the literature. 30 The results show that the FES results are in good agreement with the experimental results.

The evolution of the jetting velocity (m/s) versus jetting time (s): computational ejection simulation of the training case number 5.
Quantitative verification experiments were performed by photographing the droplet formation at the end of the nozzle with a CCD camera and flashing light-emitting diode (LED) until it was ejected onto the substrate surface. The details and results of the experiments are presented in the subsequent sections. The distance between the nozzle and the substrate surface was 102 mm, and the time required for droplet ejection was recorded to calculate the velocity of droplet ejection.
Figure 4 shows the results of the FES of the velocity change at point P, the location of the virtual probe, during the jetting process. The velocity of point P gradually increases with time, when the needle moves to the lowest point, the velocity of point P is defined as the droplet jetting velocity, at this time the velocity of point P is 3.52 m/s, and finally, the needle starts to rise, at this time the velocity of point P decreases rapidly, at 0.0012 s the velocity of point P is 0.805 m/s. The results show that the established FE model can predict the droplet jetting velocity relatively accurately.

The velocity of the virtual probe (point P) versus time in case 7.
Therefore, the combined results of the above two experimental verifications show that the FE model developed in this article can accurately predict the DEB in the droplet injection process.
Generating ANN data based on Taguchi orthogonal array
Due to the relatively large number of DESD parameters affecting DEB during piezoelectric injection, it is impractical to build the full combination of
Meanwhile, five new cases are additionally set to evaluate the generalization ability of NN models in this article. Table 2 summarizes all combinations of detected DESD parameters and their corresponding values of jet velocity and droplet diameter. Figure 5 shows scatter plots of jet velocity and droplet diameter versus time for cases 1, 7, 13, 19, 25, and 30, respectively, and they also include velocity clouds and volume fraction clouds when the droplet first starts to detach from the nozzle.
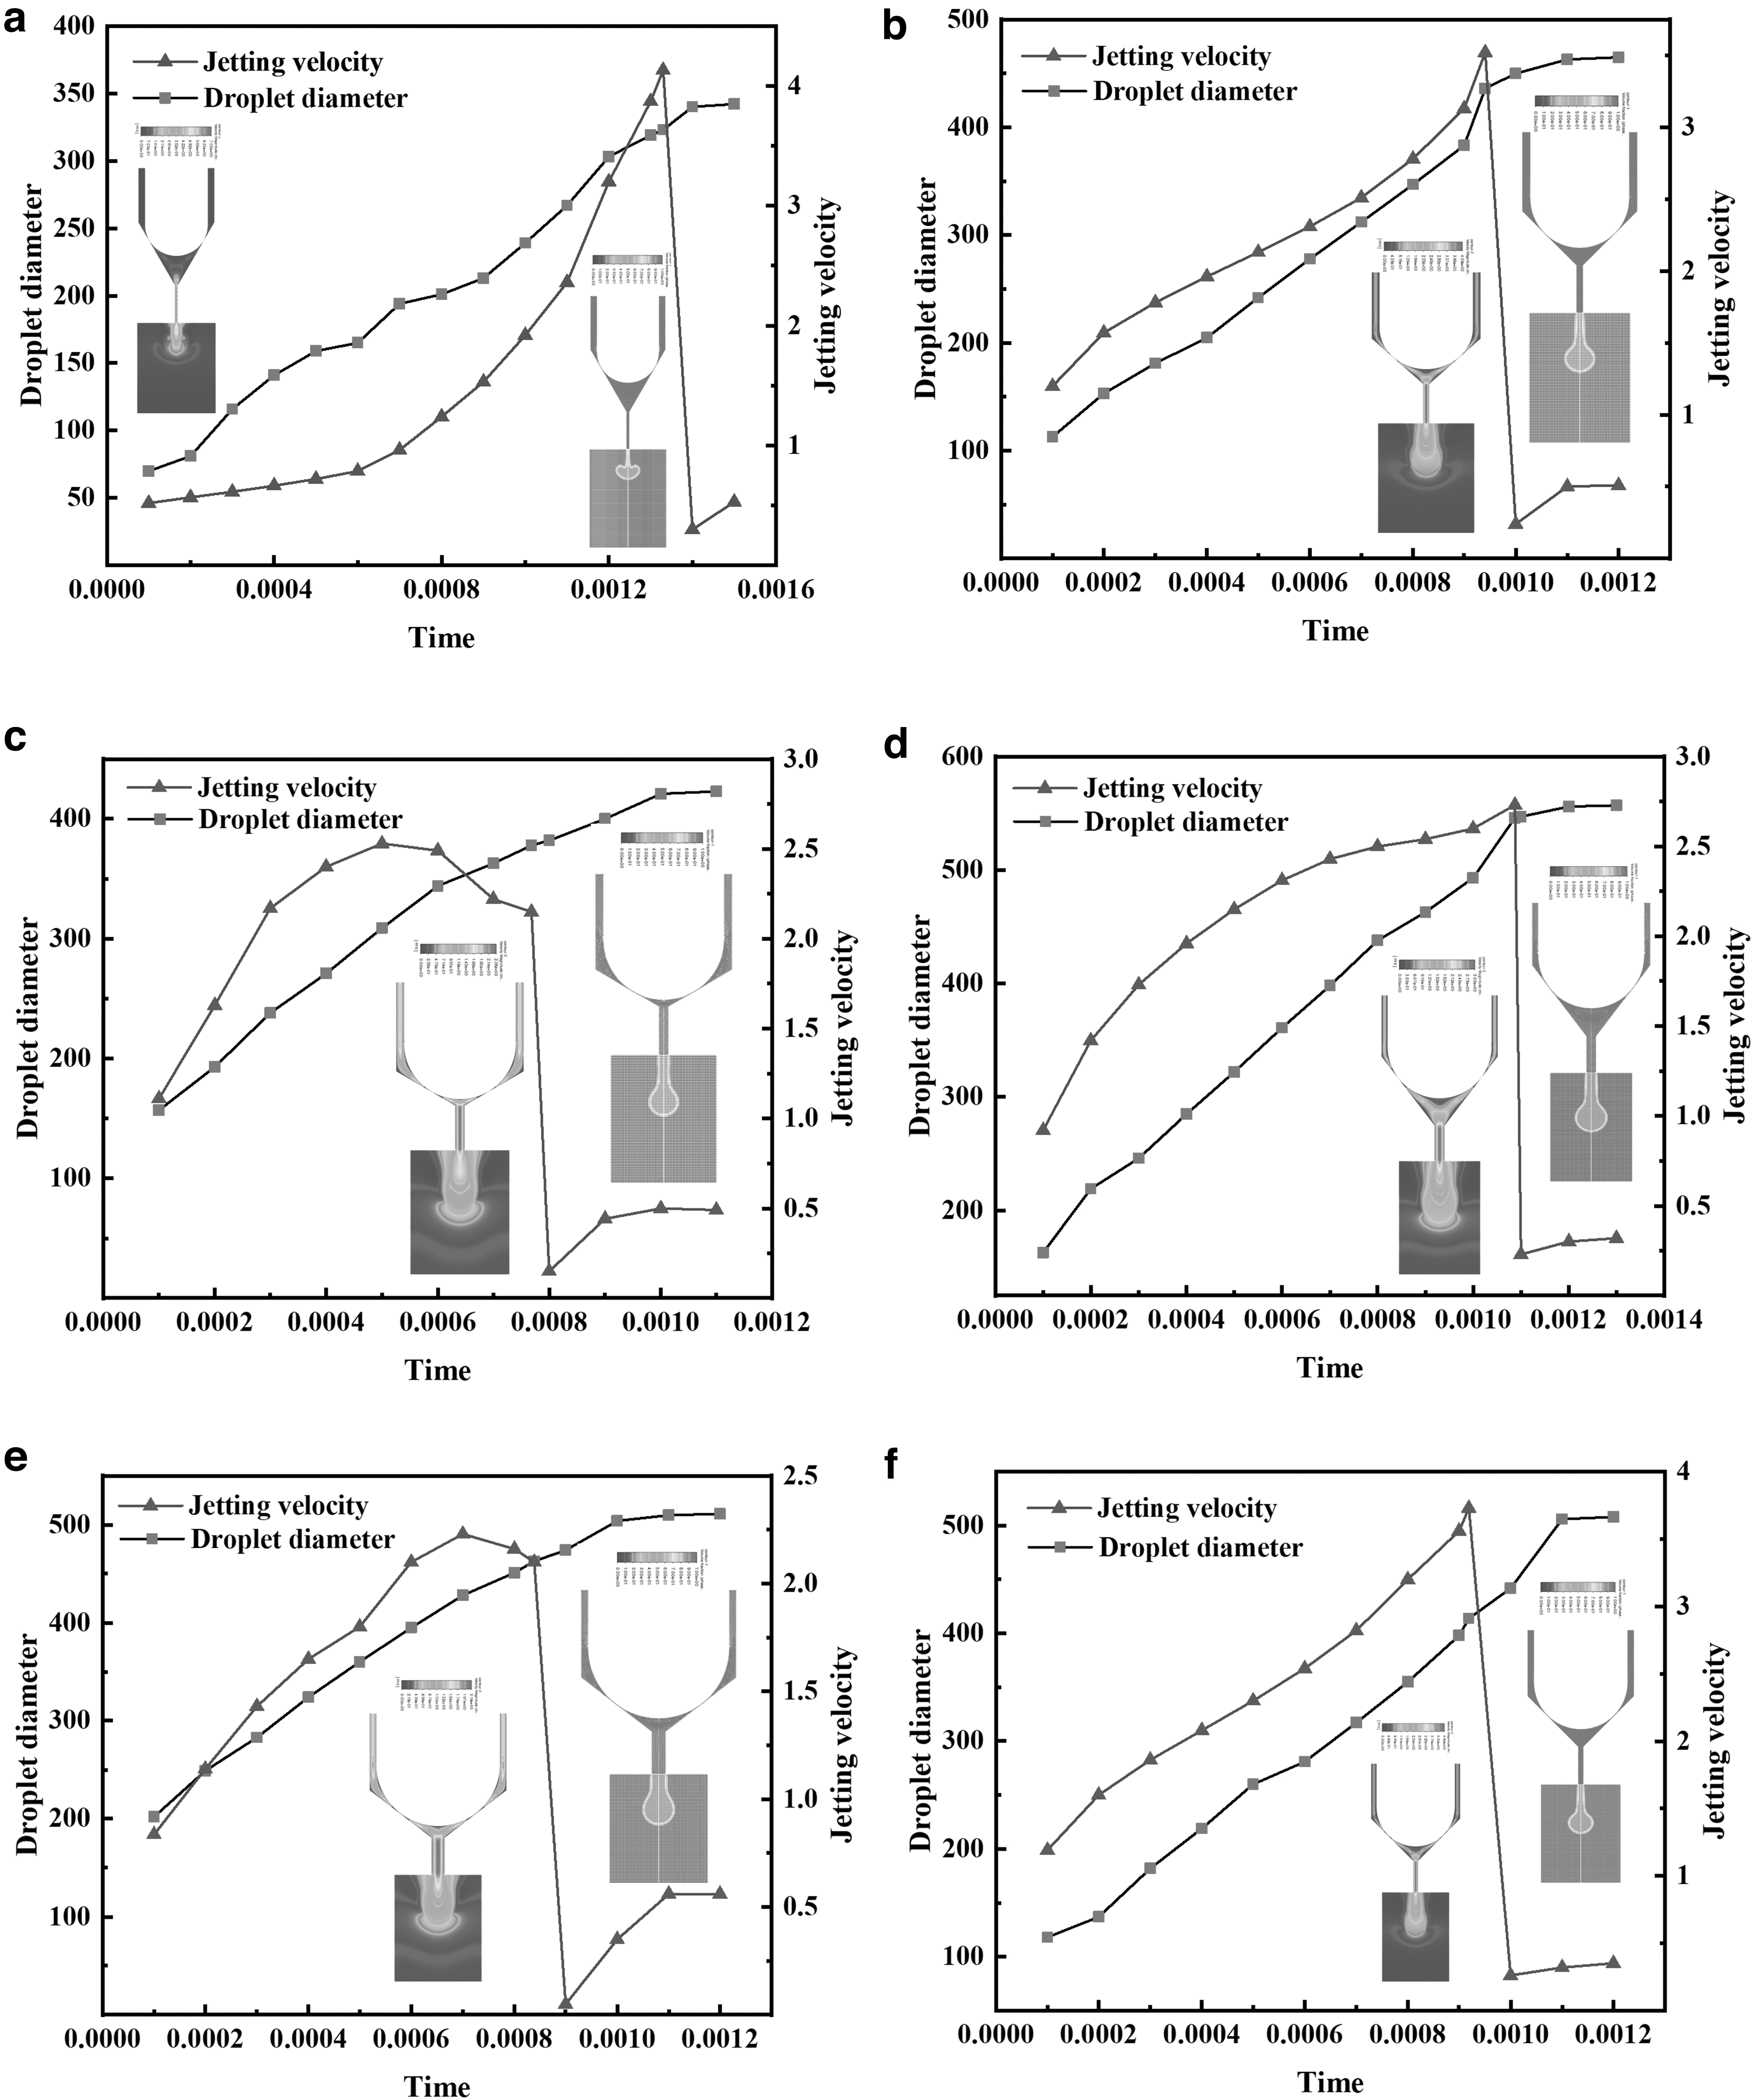
Scatter plots of droplet diameter and jet velocity versus time for different cases:
The Droplet Ejection System Design Parameter Combination Based on Taguchi's and Corresponding Results
In this study, all simulation cases used the same fluid material, boundary conditions, and mesh size to determine the two DEB indexes. As shown in Figure 4, the jetting velocity value for the FES of case 7 was 3.52 m/s. The droplet boundary position is measured using a method unique to Fluent software, and the number of meshes in the droplet region is calculated to determine the droplet diameter. The droplet evolution pattern of case 7 simulated by finite element method (FEM) is shown in Figure 6, and the droplet diameter is 436 μm when it starts to detach from the nozzle.

Results of FE simulation of droplet diameter at different times in case 7:
ANN-GA Optimization Method for DESD
ANN modeling using MATLAB software
ANNs are increasingly used in industry as a tool to deal with nonlinear problems. It can represent complex nonlinear processes between inputs and outputs and has a powerful self-training capability. 32 The accuracy of prediction results can be improved by optimizing the number of hidden layers and the number of neurons and by choosing the appropriate learning algorithm in the model training process. 33 In this article, an ANN model was built by MATLAB software and the most appropriate number of neurons in the hidden layer was determined by testing. Since there are many kinds of training algorithms, through investigation this article finally uses two different back propagation algorithms, Levenberg–Marquardt (trainlm) and Gradient descent with momentum and adaptive learning rate (traingdx), to test the performance of ANN and the results are exposed in the following.
In this article, the data are divided into the following groups, training group, validation group, and performance test group, for the purpose of optimizing the ANN topology as shown in Table 2. The training group (cases 1–20) trains the NN by calculating the gradient and updating the network weights and biases. The validation group (cases 21–25) was used to verify the accuracy of the ANN by monitoring the errors of the validation group during the training process. When the ANN starts to overfit, it indicates that the weights and biases are the most appropriate at that point. The last five cases' data were used to test the generalization capability of the NN model.
First, the ANN model was established on the basis of the experiment data obtained using the Taguchi method and the variables were inputted (
where xmax, xmin, and xi represent the maximum, minimum, and normalized results of the data, respectively.
The input nodes received the normalized input data values via feed-forward back-propagation. Then, the weighted input (
The transfer functions used in this study are tangent sigmoid “tansig” [Eq. (6)] and log-sigmoid “logsig” [Eq. (7)]. The performance in different models is discussed in a later section.
The output value of the network is obtained by iteration, and the specific error is obtained by comparing with the known output data value. Then, the error is reduced by adjusting the weight and bias of each layer. This cycle was repeated and the root mean square error (RMSE) of each network was calculated. In this study, the RMSE and the determination coefficient

where
Optimization process of ANN-GA
The GA incorporates natural selection mechanisms from biology into ANNs, which can ensure that the selection of weights and thresholds is a theoretical optimization process. In this study, the GA in the MATLAB software optimization toolbox was used to connect existing NNs to determine the optimal DESD. The workflow of the ANN-GA-coupled optimization loop is shown in Figure 7. An array of real numbers consisting of weights and thresholds of the BP network are the chromosome population of the GA. The fitness of each individual in the population selects an individual from the current population as the parent chromosome and uses genetic operators to generate the next generation, that is, crossover and variation. The method is repeated until the stopping criterion is reached and an optimal solution is obtained.

DESD optimization model based on ANN-GA. ANN, artificial neural network; DESD, droplet ejection system design; GA, genetic algorithm.
Since the GA has a population search feature, it can avoid getting trapped in a local optimal solution and therefore converges more easily to a global optimal solution.
ANN model evaluation
The topology of the NN is the basis for accurate prediction of DEB indexes. The ANN selected for this study has three layers: an input layer, a hidden layer, and an output layer. The parameters to be analyzed constitute the input layer, and the fitting results are output by the output layer, with the number of neurons in the input and output layers defined by the specification of the problem under study. The intermediate hidden layers are continuously trained to derive nonlinear patterns among the data. The hidden layers can be one or more. The different layers are connected by weights and biases. The number of neurons in one of the hidden layers must be fine-tuned to reduce the bias. There is no definite method for the number of neurons in the hidden layer, and too many or too few of them can affect the accuracy of ANN.
In this study, the optimal number of neurons in the hidden layer was finally determined to be 11 and 15 for both the training algorithms under the jetting velocity and droplet diameter models by detecting the number of neurons in the hidden layer with different training algorithms combined with the trial-and-error method. The established NN models were tested, and the results are shown in Table 3. Then, according to the indexes RMSE and
Performance Indexes of Different Neural Network Models
ANN, artificial neural network; RMSE, root mean square error.
For both the DEB metrics, Figure 8 reveals that the predicted data curves are very close to the target data curves, which implies that the models predict the results accurately, and that the error between the expected and target results for the ANN model training and testing data sets is very small. It also shows a good fit between the target and expected data provided by the two ANN models after the training phase, as it has a high determination coefficient

Performance comparison of both the studied ANN models:
To verify the generalization ability of the two NN models selected in this study, predictions were made on the performance test group data. In this study, the determination coefficients
DESD optimization using GA
GA optimization was performed using the developed NN model, as shown in Figure 7. The range of variables in Taguchi design of experiment was set to the boundary range shown in Equation (10) (dimensions in mm and °), and 100 individuals within the boundary were selected in the initial population.
In the optimization process, the fitness scaling and selection processes were performed using the rank method and the random uniform method, respectively, to determine the parents for the next generation. The population used in this study was 100, of which 2 were elite numbers for the next generation and 80% of the remaining population was used for crossover breeding and 20% for mutation breeding. The values of each parameter of the GA used in this study are shown in Table 4.
Computational Parameter Setting of Genetic Algorithm
Figure 9 shows the best fit and average fit values for the droplet diameter and injection velocity models for case 27. The jetting velocity model reaches convergence after the 38th generation with a stable best fitness value of 3.41 m/s. The results show that the average value of the jetting velocity obtained from the FES is 3.53 m/s, which is quite close to the ANN-GA prediction (3.41 m/s) with an error of no more than 3.34%. The droplet diameter model reaches convergence after the 11th generation with the best fit of 466 μm.

Case number 27: variation pattern of average and best fitness for different models. Upper grey line refers to average fit curve for droplet diameter model, upper black line refers to average fit curve for jetting velocity model, lower black line refers to Best fit curve for droplet diameter model, lower grey line refers to best fit curve for jetting velocity model.
The results show that the droplet diameter value obtained from the FES is 453 μm, which is quite close to the ANN-GA prediction (466 μm) with an error of no more than 2.87% between them. It follows that both the DEB indexes (jetting velocity and droplet diameter) can be used to optimize DESD and improve the print quality in the piezoelectric ejection process.
In summary, an optimized NN model can reliably predict the jetting velocity and droplet diameter for a large combination of DESD variables. These predictions can be performed relatively quickly and easily compared with FES. Finally, the GA-ANN model proposed in this study can significantly reduce the simulation time required to determine the ideal combination of design parameters. However, for this strategy, the results of GA-ANN predictions must be verified experimentally. If the results are consistent, the improved design solution is approved for use. In addition, when a new FE model is built, it is updated with new training cases for the NN model to continuously enhance the accuracy of the NN model.
In addition, compared with the traditional gradient-based method, the intelligent method based on the ANN-GA model proposed in this article can solve the highly nonlinear problem and converge to the global minimum to avoid falling into the local minimum, which also makes the fitness value of this model more accurate and less costly than the traditional method.
Finally, it should be noted that only one material was used to collect experimental data in this study, but the method we propose is general. It can be extended to any similar material and piezoelectric ejection system process design in terms of shape and size.
Experimental Verification
In this study, a monitoring system based on a piezoelectric ejection device was developed, as shown in Figure 10. The monitoring system consists of components such as a piezoelectric distributor, a piezoelectric driver, a CCD camera, a strobe LED, a camera lens, and a computer. By controlling the pulses of the piezoelectric driver, the interval time of the pulses is adjusted so that the image can be captured at a specific time instant. Then, we can process and analyze the images of the droplet ejection process to obtain the droplet diameter and the displacement of the droplet at a certain time. Referring to the method of Ball et al., 34 the diameter of the droplet and the displacement of the droplet are calculated by capturing the number of pixels within the droplet region in the image and the scale of the distance of the picture to the true distance.
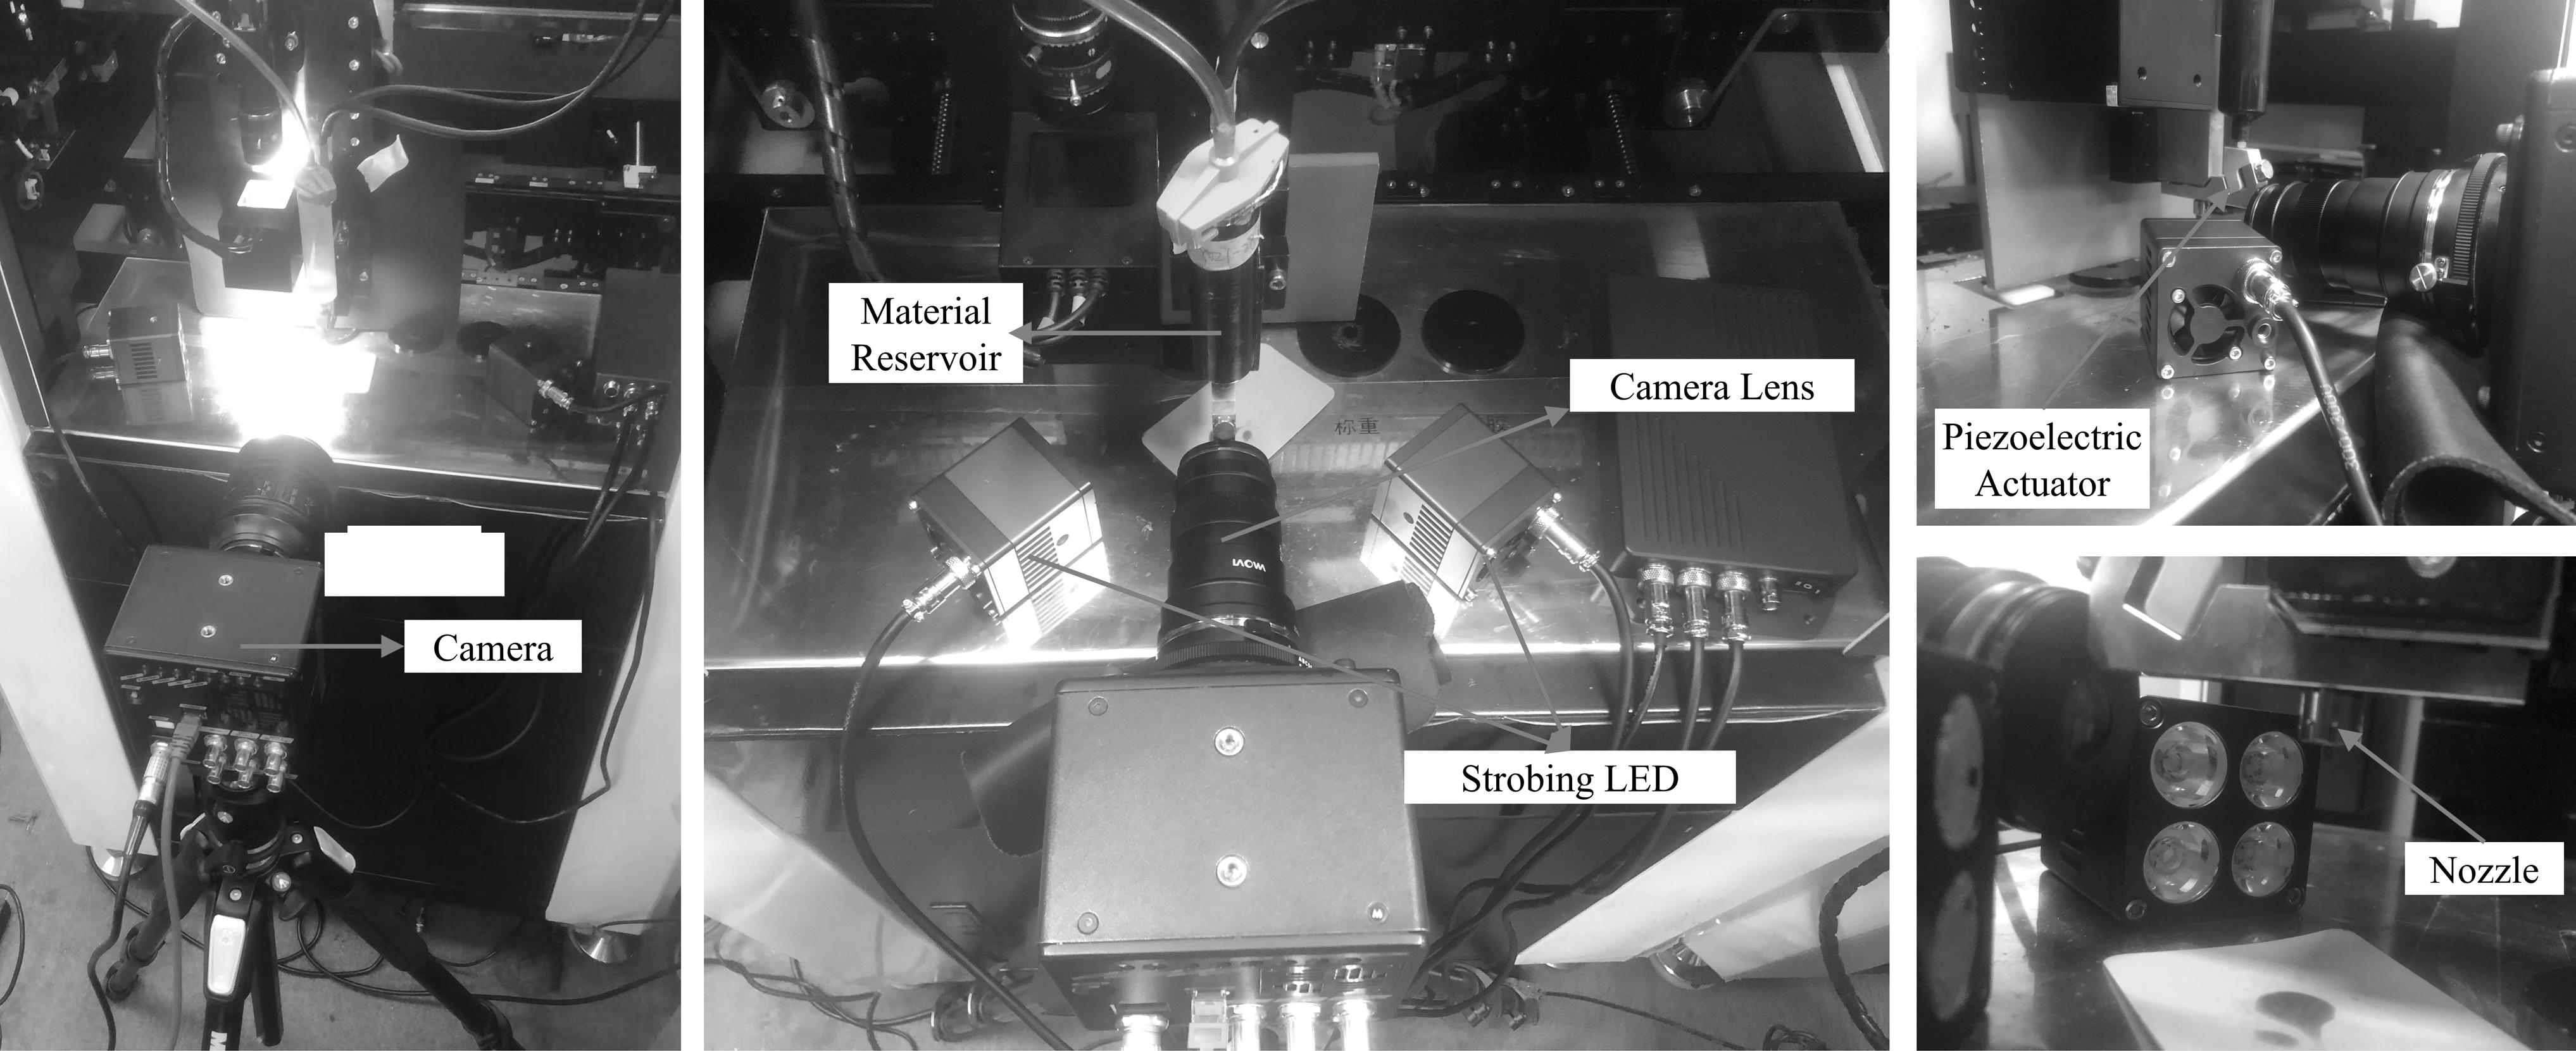
Photograph of the established experimental system.
Case number 27 was used as an example for validation. A needle with a diameter of 1.25 mm and a nozzle with a diameter of 0.16 mm and a taper of 75° were used in the experiments, and the specific parts are shown in Figure 11. The jetting velocity was measured and calculated several times for different displacements and times according to the displacement-time acceleration equation. A total of five sets of experiments were conducted in this study, and each set of experiments recorded data for two different displacements and times, and finally, the jetting velocity was calculated according to the equation. The specific experimental results are shown in Table 5, and the images captured in group 2 of experiments are shown in Figure 12.

Different sizes of nozzle and needle samples.
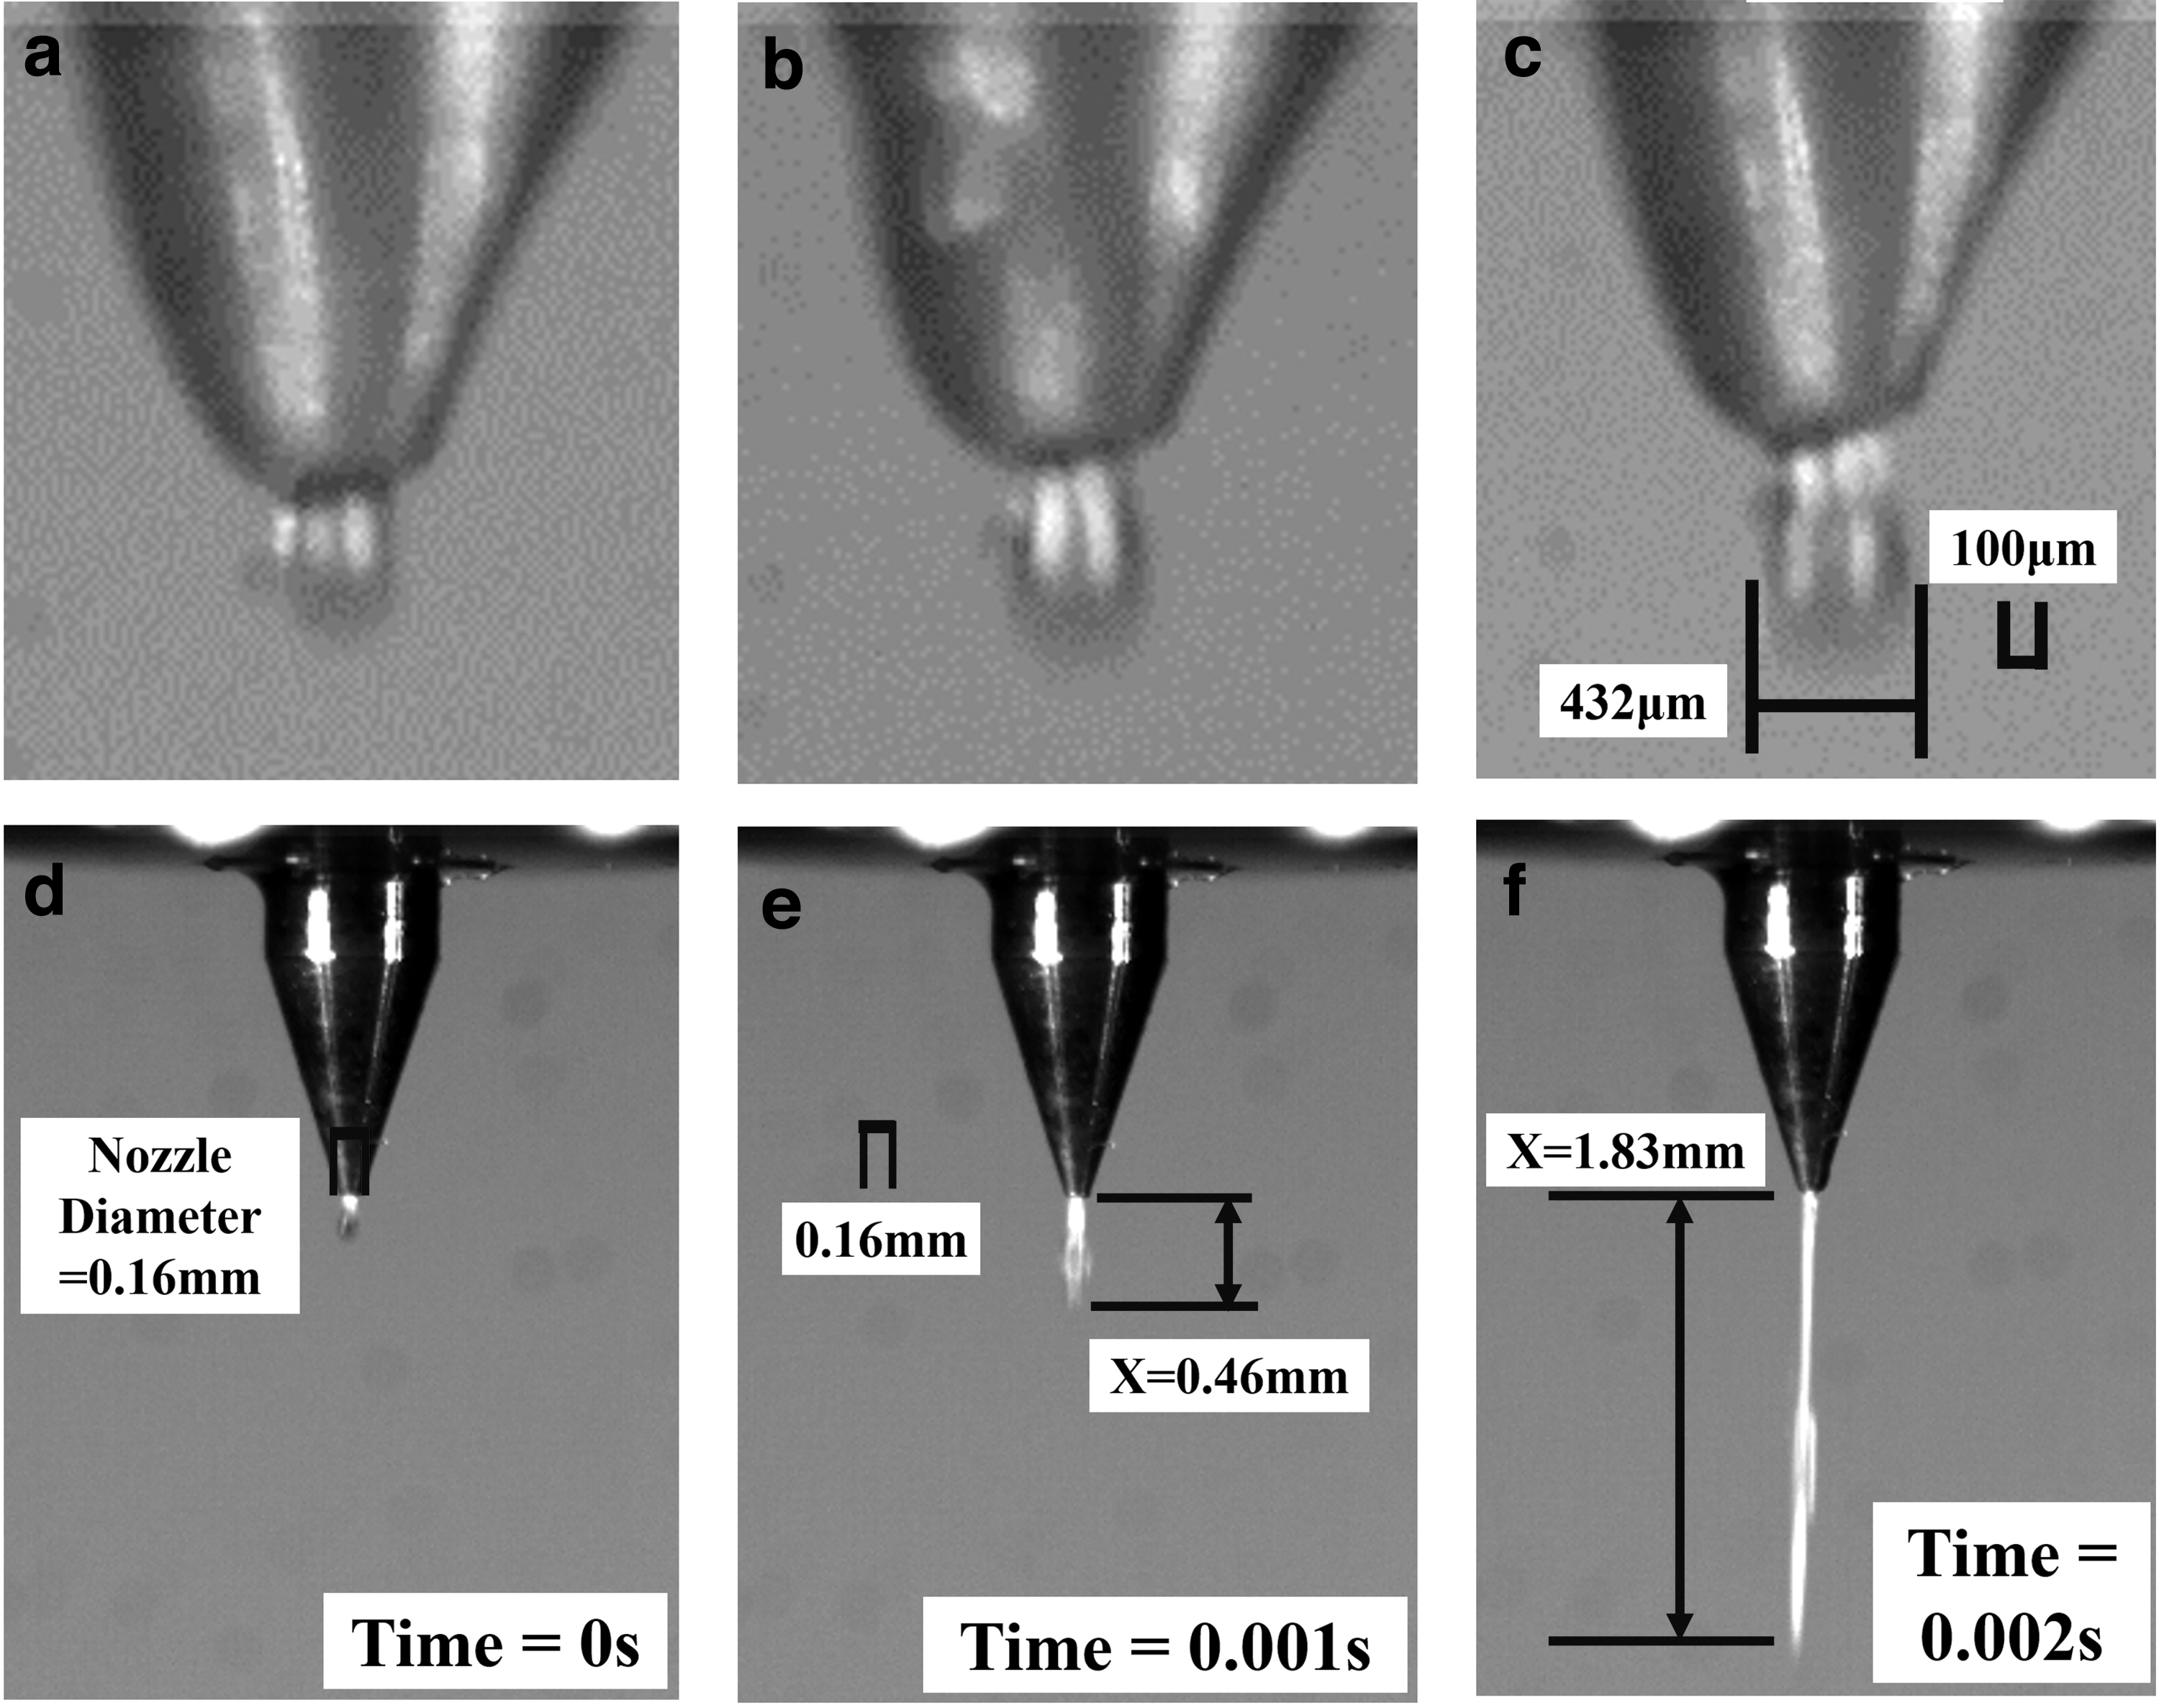
Images captured at different moments for group 2.
Statistics of the Experiment
To ensure the accuracy of the experimental results, the results of the five sets of experiments were averaged, and the average value of the jetting velocity for case 27 was 3.572 m/s. Similarly, the average value of the droplet diameter obtained was 451.2 μm.
In summary, the ANN-GA model established in this article predicts jetting velocity of 3.41 m/s, with an error of 4.48% from the experimental results, and the droplet diameter predicted by the model is 466 μm, with an error of 3.18% from the experimental results, proving that the FE model and ANN-GA model proposed in this article can predict the jetting velocity and droplet diameter more accurately.
Conclusion
This article presents an ANN-GA-based intelligent optimization method for DESD. This method has the distinct advantage that it is based on accurate FE analysis rather than expensive, time-consuming, and error-prone collected experimental data. The coupled modeling of DEB during ejection is performed using ANSYS Fluent software and is verified quantitatively and qualitatively with literature data and experiments.
Based on FE calculations for the combination of DESD parameters, two DEB indexes were determined: jetting velocity and droplet diameter. The feasibility of developing an ANN-GA NN capable of predicting and optimizing each index was investigated. Through some experiments, the optimal network topologies for the jetting velocity and droplet diameter models were determined to be 4-11-1 and 4-15-1, respectively. The two ANN models use Levenberg–Marquardt as the training algorithm, and the activation function is chosen tansig. Finally, it is verified that the two ANN models proposed in this article predict DEB with high accuracy in the specified parameter range.
The optimal DESD is determined by optimizing ANN models with a GA. By comparing the predicted and experimental values of ANN-GA, the error of jetting velocity is 4.48% and the error of droplet diameter is 3.18%. The effectiveness of the proposed optimization method is verified, and it is shown that the intelligent method studied in this article can improve the efficiency of DESD.
Compliance with Ethical Standards
Consent to participate
The authors declare that they consent to participate in this article.
Consent to publish
The authors declare that they consent to publish this article.
Availability of Data
The data that support the findings of this study are available from the corresponding author upon request.
Footnotes
Authors' Contributions
X.L.: Conceptualization, methodology, software, data curation, writing—original draft preparation, and validation.
Y.Z.: Visualization, investigation, supervision, and writing—reviewing and editing.
Author Disclosure Statement
No competing financial interests exist.
Funding Information
Funding was supported by the National Natural Science Foundation of China (52075012).