
Abstract
Fused deposition modeling (FDM) is widely used in the rapid prototyping of polymers. Polyamide (PA) has excellent mechanical properties, but its application in FDM is limited due to its high water absorption, warpage, and forming shrinkage. The material of the filament and the printing parameters of the printer are two critical aspects that affect the performance of a component. The prepared PA6/PA66 (composite polyamide [COPA], PA6:PA66 = 85:15) composite (COPA: acrylonitrile butadiene styrene [ABS]: maleic anhydride grafted acrylonitrile butadiene styrene [ABS-g-MAH]: polyethylene = 800:133:67:100) has low water absorption (0.39%) and high dimensional stability, which has a good application prospect in FDM. The influence of eight FDM parameters, including three rarely reported, on the properties of PA6/PA66 composite specimens was investigated by the Taguchi method. The significance of influencing factors was evaluated by analysis of variance (ANOVA) and the stability by signal-noise ratio. When the layer thickness was 0.15 mm, the infill pattern was zigzags, the build plate adhesion type was brim, and the distance from the nozzle to the printing platform and the layer thickness (ΔL) was 0.05 mm; the specimens' dimensional accuracy, surface quality, and mechanical properties were better than other levels. The layer thickness and infill pattern were the two most important factors. The switch of the cooling fan and the temperature printing platform played a significant role in the specimens' dimensional accuracy and surface quality. ΔL tremendously influenced the thickness and warping degree of the specimens. The preparation of high-performance PA composites and the investigation of multiparameters by the Taguchi method provide a possible solution for applying polyamide in FDM.
Introduction
Additive manufacturing (AM) technology, also known as 3D printing, is a layer-by-layer stacking technology based on digital model files, mainly divided into stereolithography appearance technology (SLA), selective laser sintering technology (SLS), melt deposition forming technology (fused deposition modeling [FDM]), and so on. FDM is widely used in the 3D printing of polymer filaments due to its relatively simple equipment and low production cost. The characteristic of polymer is a critical factor affecting its application in FDM. Polymers with high dimensional stability, low melting point, and low viscosity are widely used in FDM, such as acrylonitrile butadiene styrene (ABS), polylactic acid (PLA), and so on, Fagundes et al. 1
Polyamide (PA) is a widely used thermoplastic with excellent mechanical properties and chemical resistance. PA with short carbon chains, such as PA6, PA66, and PA46, has high water absorption, crystallinity, and melting temperature. 2 The warpage and forming shrinkage of these PAs severely limit their application in the field of FDM, and the preparation of modified composites is the primary solution. Polystyrene (PS) and maleic anhydride-grafted polyolefin elastomer (POE-g-MAH) were added to PA6, which not only reduced the shrinkage stress but also significantly improved the molding stability. 3
There are also a few examples of mixed printing of multiple filaments. For example, Kevlar fiber was embedded into nylon by an FDM printer with two nozzles in different paths and layers and obtained high tensile strength. 4 Compared with PA6 and PA66, PA6/PA66 composites have more negligible water absorption and lower crystallinity, 5 which help reduce the warpage of the parts, resulting in higher dimensional accuracy. The lower melting point improves the machinability of PA6/PA66. At the same time, it has higher impact strength. However, there are few studies on applying PA6/PA66 composites in FDM.
The printing parameters and printer algorithm significantly affect the mechanical strength,6–8 dimensional accuracy,9–11 and surface quality 12 of FDM printing specimens. Many methods have been used to optimize the printing parameters, such as analysis of variance (ANOVA),13,14 finite element analysis, 15 factorial designs,16,17 predictive analysis, 18 and machine learning. 19 The gray relational analysis (GRA) method was used to analyze the influence of different parameters on the mechanical properties and geometric accuracy of cylindrical parts in the machining process. 20 Taguchi method was used to study the effect of various parameters on cylindricity. After obtaining the optimal process parameters, a regression model was established to determine the relationship between control variables and cylindricity. 21 The multiobjective optimization paradigm was used to optimize the FDM printing process parameters of PLA printing parts. 22 The total factorial and Taguchi design of the experiment (DOE) were compared to determine the effects of FDM process parameters on the mechanics and surface properties of nylon 6/66 copolymer.
The results show that the Taguchi method dramatically reduces the experimental workload and provides the most accurate results. 23 These multifactor analysis methods generally select three to five parameters as research objects to reduce the workload, such as layer thickness, infill pattern, printing temperature, printing speed, filling rate, and direction angle. The influence of the cooling fan on/off, layer thickness (ΔL), and printing platform temperature on FDM specimens' characteristics was rarely investigated.
The Taguchi method is essential to study the influence of multifactor and emphasizes reducing research costs and improving product quality using experimental design. 24 This method has also been applied to optimize FDM printing parameters such as layer thickness, specimen orientation, grating width, road width, and deposition speed. The Taguchi L9 DOE was used to study the influence of FDM processing parameters on the dimensional accuracy and mechanical properties of FDM samples. 25 The surface roughness of FDM specimens 26 is also an essential index of component performance. The influence of printing parameters on the energy consumption and processing time of 3D printers was studied in Camposeco-Negrete. 27 The above multiparameter research based on the Taguchi method has achieved good results and significantly reduced the workload.
In this work, PA6/PA66 (85:15 wt%) composites (COPA) enhanced with ABS, polyethylene (PE), and maleic anhydride-grafted acrylonitrile butadiene styrene (ABS-g-MAH) were prepared for FDM by blending, in which a small number of antioxidants and lubricants were added to improve the mixture's oxidation resistance and high-temperature thermal stability. The Taguchi method was used to investigate the influence of eight FDM factors (printing temperature, layer thickness, ΔL, printing speed, build plate temperature, infill pattern, build plate adhesion type, and cooling fan) on the mechanical properties, forming accuracy, and surface quality of COPA composite specimens. ANOVA and signal-noise (s/n) ratio were supplemented to analyze the significance and stability of printing parameters.
Materials and Methods
Materials
COPA and low density polyethylene were purchased from Shanghai Hui Cheng Plastics Co., LTD. ABS was purchased from CHIMEI Corporation, antioxidants and lubricant were purchased from Ling Feng Plastic Firm, and ABS-g-MAH was purchased from DuPont Company.
Preparation and characterization of PA6/PA66 composite filaments
COPA, ABS, ABS-g-MAH, and PE were dried under vacuum at 80°C for 24 h. These raw materials with different weights and a small amount of lubricant and antioxidants were thoroughly mixed in a plastic bucket. The filaments were prepared by a twin screw extruder (YM-20S350) under a rotational speed of 20 r/min and a feeding speed of 5 r/min. The temperatures of six heating zones of the twin-screw extruder were set at 200°C, 220°C, 230°C, 235°C, 240°C, 235°C, and 235°C, respectively. The extruded filament passes through a two-stage water tank. Under the control of a laser caliper (YM-20S350 ancillary facility) and an automatic traction winding machine (YM-25350-3D), a filament with a diameter of about 1.75 mm is produced.
The scanning electron microscope (SEM) sample strips were cooled in liquid nitrogen for 5 min and the brittle fracture was then removed with tweezers. The sample was fixed with a cross-section table, and the gold spraying time was 120 s. An S-type field emission scanning electron microscope (Thermo Quattro) was used to observe the morphology of the brittle section of the samples. The accelerating voltage was 5.0 kV.
The water absorption was determined by drying the test sample in a vacuum oven at 80°C for 24 h, cooling it with the furnace, weighing it as m, soaking it in a constant temperature water bath at 25°C for 24 h, and taking the mass of the sample n after removing the natural water on the surface. The water absorption rate of the model can be calculated according to Eq. (1).
Fused deposition modeling printing of nylon composites
PA6/PA66 composite specimens were prepared with an FDM machine (YM-HT300UH), and the printing process is shown in Figure 1. Filaments were heated to melt in the heating module, the movement direction and height of the nozzle were controlled by the movement axis, and the wire was extruded from the nozzle group to form parts layer by layer. First, establish a 3D model and export files in STL format. Then, import the file in STL format into the slicing software and set the printing parameters. Third, melt deposition molding is according to the GCODE format file on the secure digital card. Finally, post-treatment8,28,29 removes the supporting part of 3D printing specimens.

FDM printing principle of polymer filament. FDM, fused deposition modeling.
Taguchi method
The Taguchi method divided the quality characteristics of products into metrological and counting characteristics. Metrological characteristics used in this article can be subdivided into nominal-the-better, smaller-the-better, and larger-the-better characteristics.
Preliminary tests were carried out to determine the critical printing parameters. Eight printing parameters, namely the fan cooling, printing temperature, layer thickness, ΔL, printing speed, build plate temperature, infill pattern, and build plate adhesion, were selected to evaluate the performance of FDM specimens (Table 1). The printing temperature is slightly higher than the melting point of the PA6/PA66 composite (230°C). The layer thickness is slightly above or below their typical value (0.2 mm) reported in Shakeri et al. 20
Design Parameters and Their Levels
The printing speed was set low to high at 50, 60, and 70 mm/s according to the dimensions of the specimens. The selection of ΔL value mainly considered the discharge and platform stick of the first layer. The build plate temperature is near the cavity temperature. The switch of fan cooling is two levels, and the remaining seven factors are three. The interaction of factors was not considered. The chamber temperature of the printer was set to 80°C, and the infill density of specimens was set to 100%.
The three levels of the infill patterns and build plate adhesion types are shown in Figures 2 and 3, respectively.
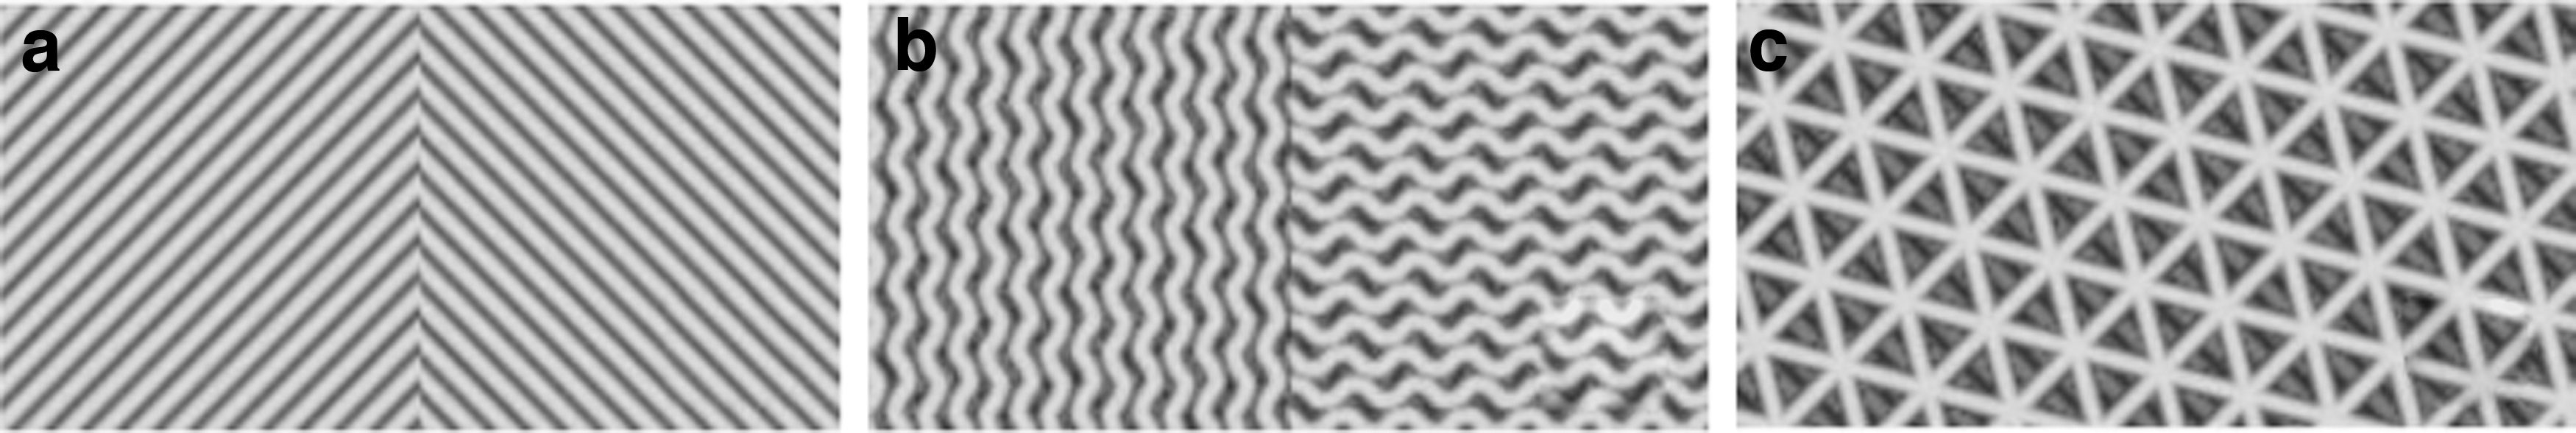
The shapes of the three infill patterns used to fabricate the FDM specimen model.

The type of build plate adhesion:
The orthogonal table used was L18 (Table 2). No glue was applied to the printing platform before printing to ensure the actual effect of the experiment. The top and bottom specimens were set to two layers and printed with a straight line 45°/−45° staggered. The middle layers were the range covered by the filling. The print platform was leveled before each print to avoid errors caused by the platform tilting.
Experimental Results Obtained in 3D Printing of Nylon Composite
ΔL, layer thickness.
The S/N ratio is used as an index to judge whether the quality characteristics of products are stable. The S/N ratio has different calculation equations for different quality characteristics. Let the quality characteristic Y be a random variable.
The common logarithm is taken as the decibel value, and the equation of the nominal-the-better characteristics is as follows:
The equation for calculating the desired smaller-the-better characteristics is:
The equation for calculating the desired larger-the-better characteristics is as follows:
The establishment and measurement of the specimen model
On the modeling software, the specimen was established according to GBT 1040.2–2006. As shown in Figure 4, all specimens' thickness (T) was measured seven times, and the mean value was taken. The width is divided into inner width (ΔW inner) and outer width (ΔW outer). The inner width is measured three times, and the outer width is measured four times. The instrument used for measurement is a vernier caliper with an accuracy of 0.01 mm.

Measurement locations of the printed specimen.
Warping degree
The nylon composite material would produce certain warpage, and the length of the printing specimen is uncertain. The warping degree was used as a measurement index (Fig. 5). Estimating the maximum height h1 of the middle position of the specimen from the horizontal plane and the thickness h2 of the central place of the product and calculating the warpage degree W according to Eq. (8), three samples were tested in each group, and the arithmetic mean was taken.

Warpage degree of 3D printed specimens.
Roughness test
Roughness referred to the surface unevenness of printing specimens and was measured by a roughness meter with an accuracy of 0.001 μm. Take three positions on the front of each specimen to measure, as shown in Figure 6. Then take the average value to ensure the accuracy of experimental data. Use a surface roughness tester to measure the surface roughness of the three measurement positions a, b, and c.
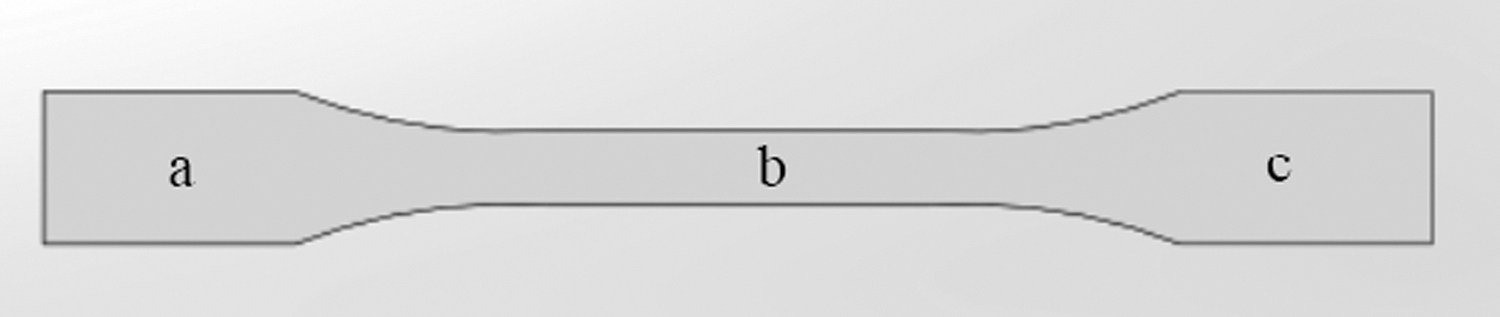
Schematic of sampling location for roughness measurement.
Mechanical properties
The tensile properties of specimens were tested by an electronic universal testing machine (WDW-6100) according to the standard GB/T 1040.2–2006, and the tensile test rate was 5 mm/min. The obtained data calculated the yield strength and tensile strength of each specimen. A set of three specimens takes their mean value.
Analysis of variance
ANOVA can be used to analyze the significance of the influence of different parameters.
12
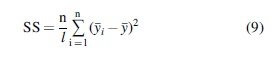
When evaluating the quality characteristic value, whether or not to consider the factor response depends on the size of the factor's response degree. The sum of squares of factors is calculated according to Eq. (9). n is the number of trials; l is the number of factor levels;
The equation for calculating the degree of freedom of the factor is shown in Eq. (10), and l is the number of factor levels.
The equation for calculating the variance of the factor is shown Eq. (11), and SS is the sum of squares of factors, and DOF is the degree of freedom of factors.
All the results of variance calculation in this article were obtained by Minitab software.
Results and Discussion
Preparation and characterization of COPA composite
The copolymer of PA6 and PA66 (COPA, 85:15 wt%) has lower crystallinity and melting point than PA6. 30 However, its water absorption and formation shrinkage do not change much, which can easily lead to the warpage of FDM specimens. A series of COPA composites enhanced with ABS, PE, and ABS-g-MAH was prepared for FDM printing (Table 3). Adding ABS and PE can improve its dimensional stability and reduce its water absorption,31,32 and ABS-g-MAH can help enhance the compatibility of different components. 33
Raw Material Ratio of Different Composites
ABS, acrylonitrile butadiene styrene; ABS-g-MAH, maleic anhydride grafted ABS; COPA, PA6/PA66 (85:15wt%) composites; PE, polyethylene.
The surface of COPA composites was analyzed by SEM (Fig. 7). The compatibility of the first three COPAs is good after the brittle fracture of the samples with liquid nitrogen. COPA-4 showed a decrease in dispersion because of too much filler. The pore size of the first four COPAs is about 2–6 μm, and the hole edge is smooth, showing the characteristics of a brittle section. However, in the process of multiple productions, COPA-2 had the smoothest and most uniform surface. Moreover, PE was added to COPA to reduce the water absorption rate of composites, increase the adhesion between the composite material and the bottom plate, and reduce the warping of the composite material to a large extent.
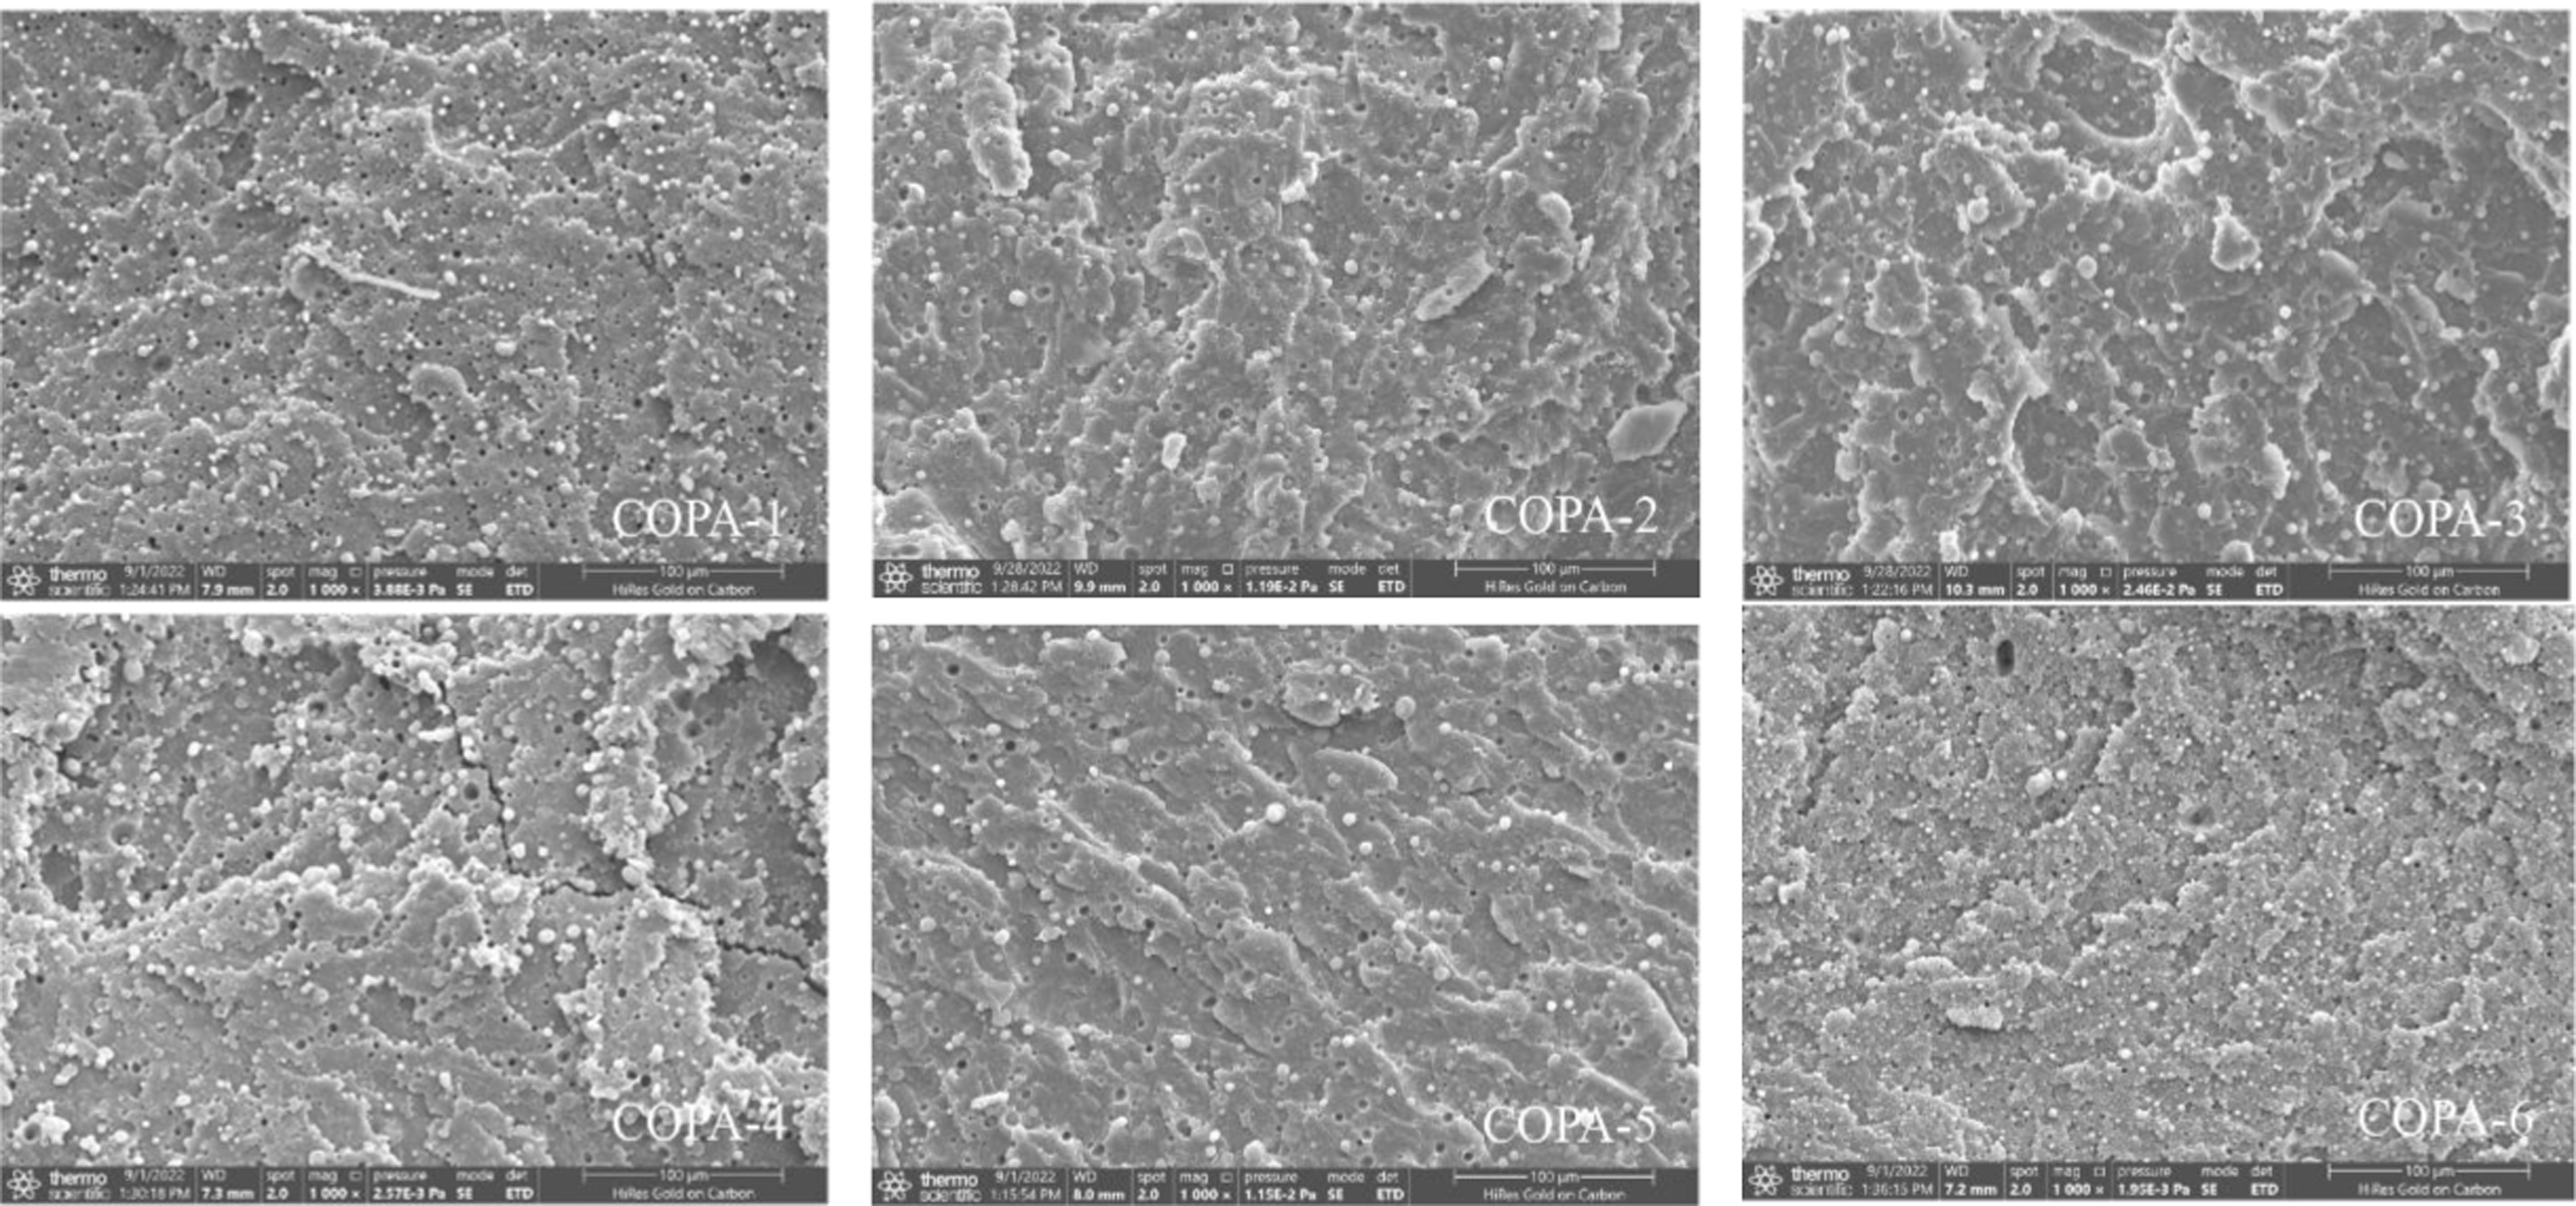
SEM images of COPA/ABS blends. ABS, acrylonitrile butadiene styrene; COPA, PA6/PA66 (85:15wt%) composites; SEM, scanning electron microscope.
A preliminary study showed that it was challenging to prepare the composite filament when a large amount of PE was added. Only two composites containing PE, COPA-5, and COPA-6 were prepared. The size of the dispersed phase decreased significantly. The pore size was about 1 μm, the distribution was more uniform, and the “scale” structure was presented, indicating that the blend had been transformed from brittle to ductile. Thus, COPA-6 was selected as the 3D printing composite based on the adhesion between the material and the printing platform.
The water absorption of each material was tested (Table 4). With the increase of ABS content, the water absorption of the composite decreases, and when PE is added, the water absorption decreases significantly.
Water Absorption Rate of the Material
Dimensional accuracy
The specimens' thickness, inner and outer width, and warpage were considered dimensional accuracy parameters (Supplementary Tables S1 and S2). The thickness and width of specimens were analyzed with nominal-the-better characteristics, and the warping degree of specimens with smaller-the-better characteristics. Combined with the ANOVA of thickness means (Table 5), six parameters are critical factors affecting the layer thickness, in addition to the cooling fan and the printing speed (Supplementary Tables S4 and S5). The thickness of the specimen was more relative to that of the 3D model when the fan was turned on (Fig. 8a), but the effect was insignificant. The thickness is closer to the model at a layer thickness of 0.15 mm, but slightly <4 mm because 4mm is not an integral multiple of 0.15 mm. 25
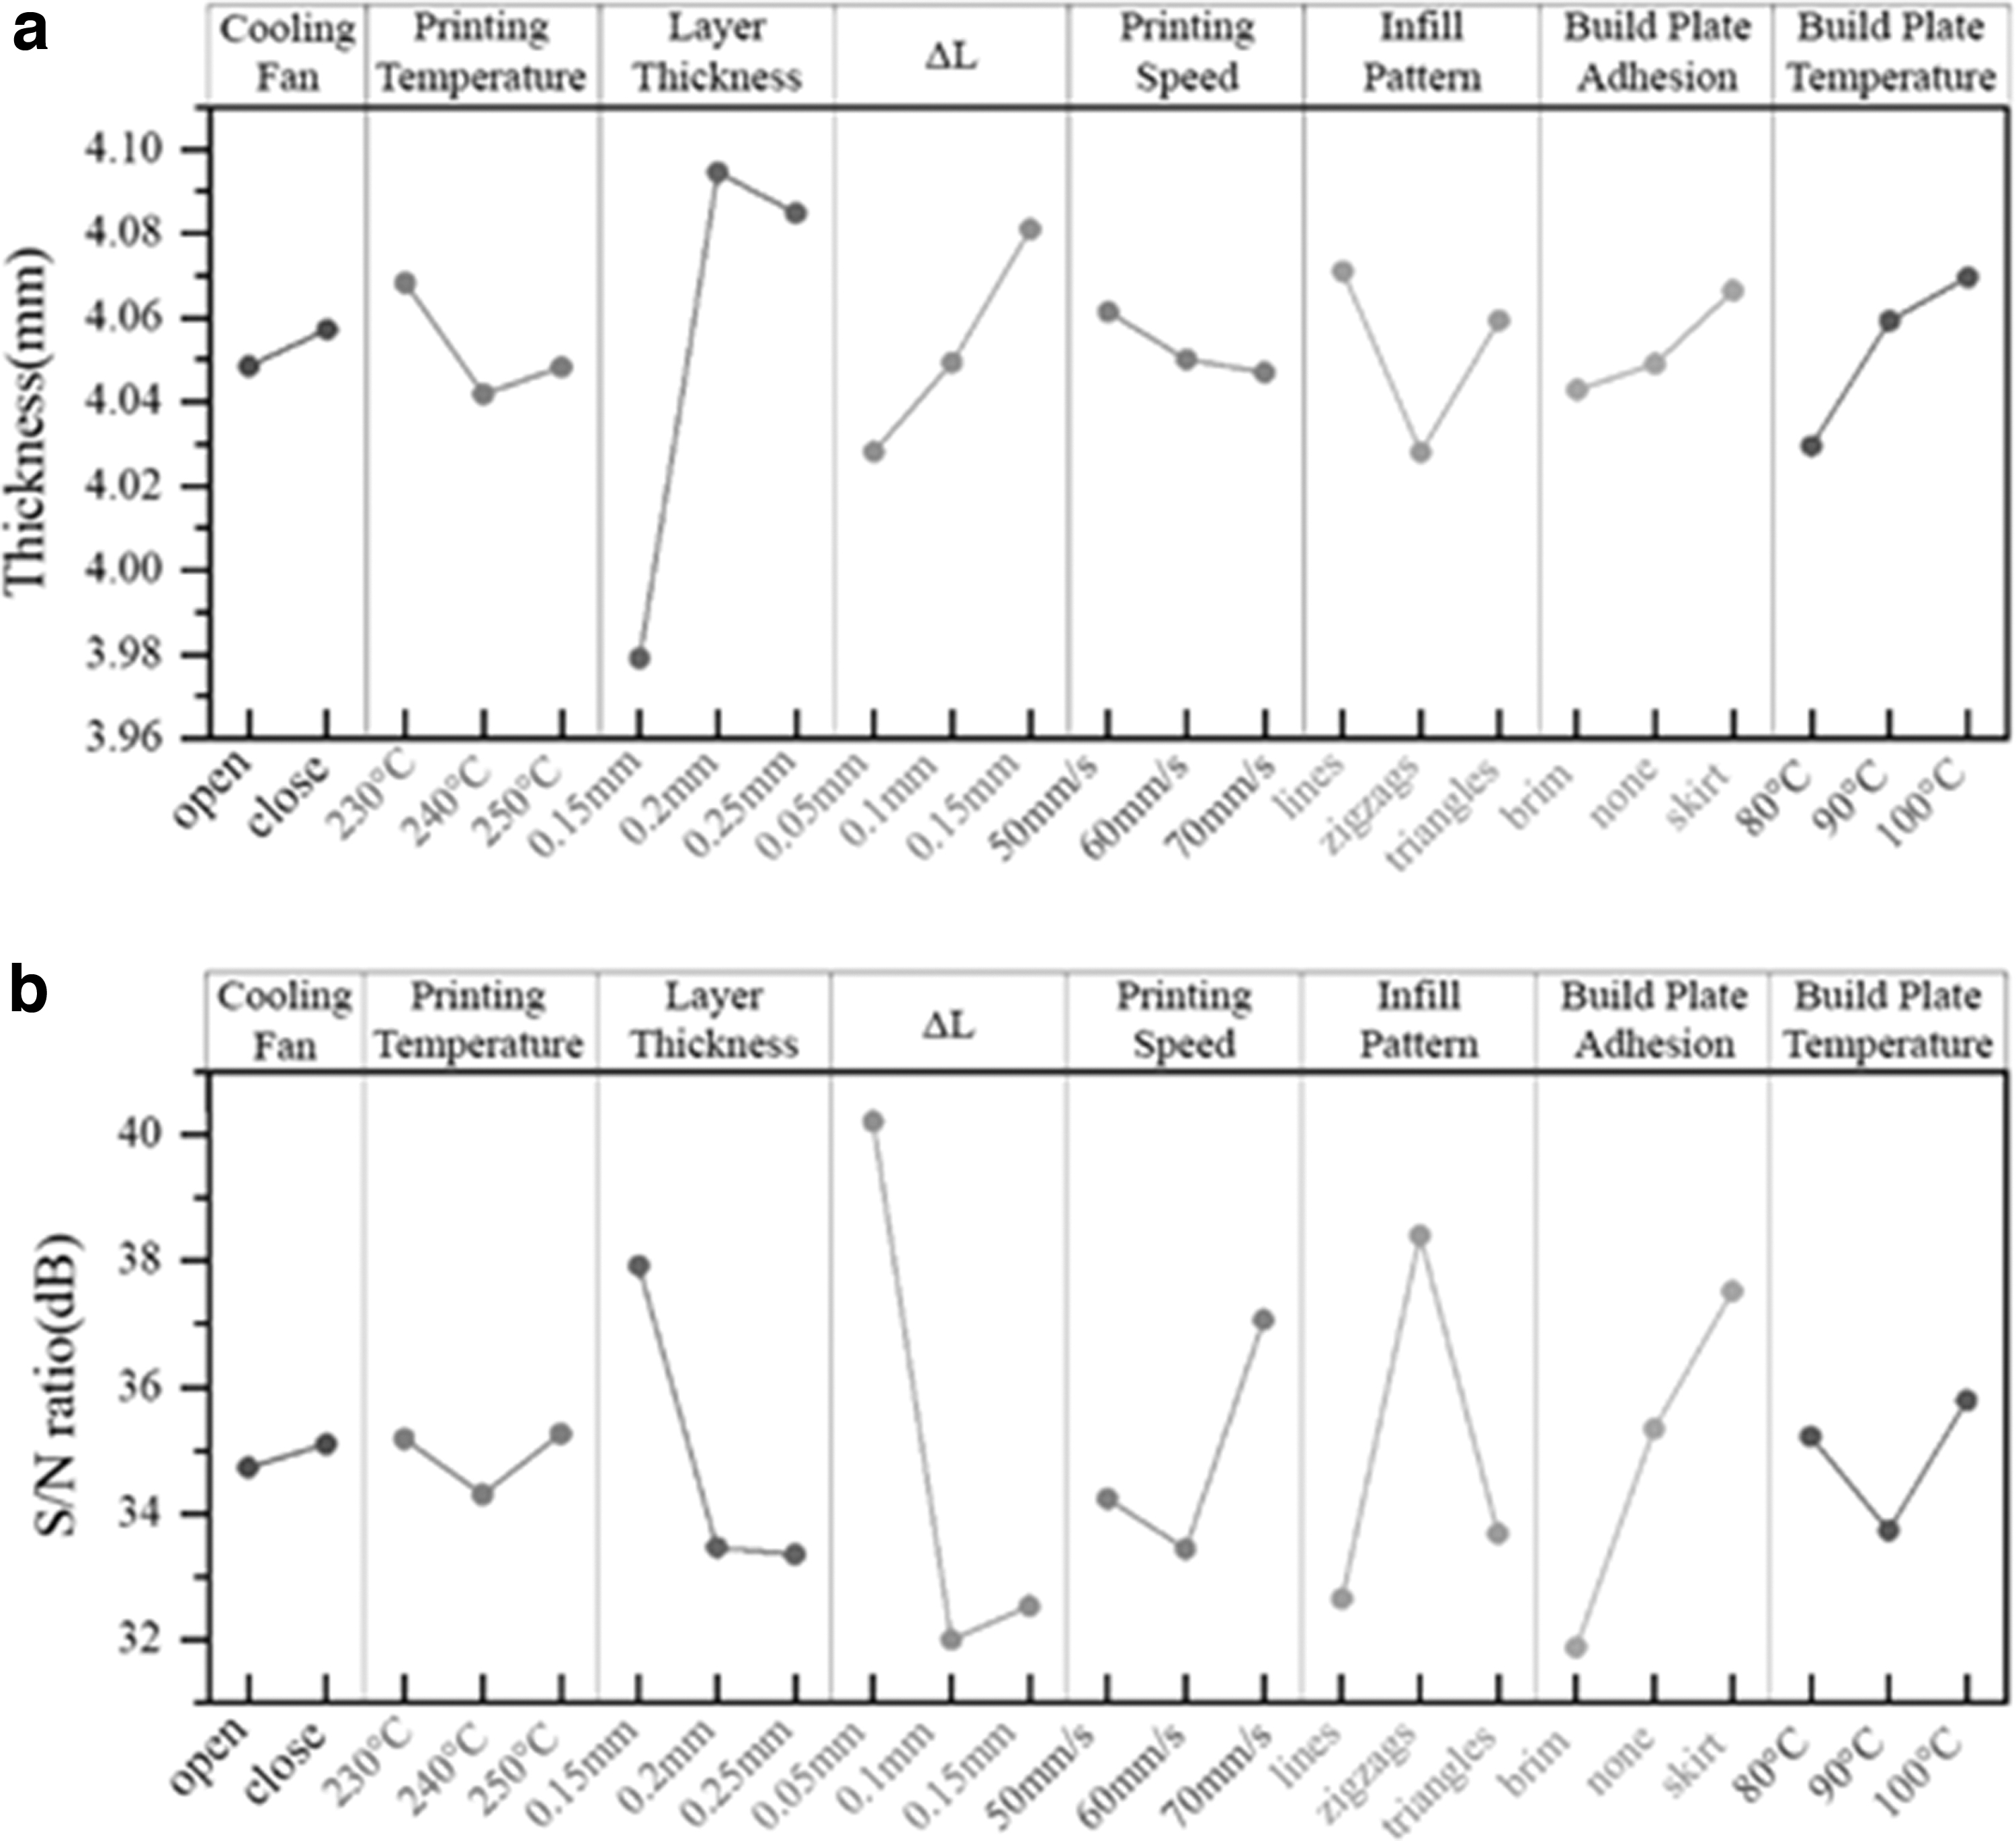
Analysis of Variance of Thickness Means
DoF, degree of freedom; SS, sum of squares.
ΔL significantly influences the thickness. The smaller the ΔL, the closer the nozzle is to the upper layer of the specimen and the better the layer adhesion between the two layers and the closer the bond is. When the printing speed is 70 mm/s, the infill pattern is zigzags, the build plate adhesion style is brim, the printing temperature is 240°C, and the build plate temperature is 80°C, the thickness is closest to the 3D model. For the best S/N ratio, a 0.15 mm layer thickness, a zigzag infill pattern, a skirt build plate adhesion, a build plate temperature of 100°C, a 0.05 mm ΔL, a 70 mm/s printing speed, and the cooling fan turned off are expected to generate the most repeatability in the specimen's thickness (Fig. 8b).
Pattern and build plate temperature were essential factors affecting the specimen's width (Tables 7–8 and Supplementary Tables S6–S9). When the cooling fan was turned on, the printing temperature was 230°C, the layer thickness was 0.15 mm, the printing speed was 50 mm/s, the infill pattern was zigzags, and the build plate temperature was 100°C, the width of the specimens was closer to the model (Figs. 9a and 10a).
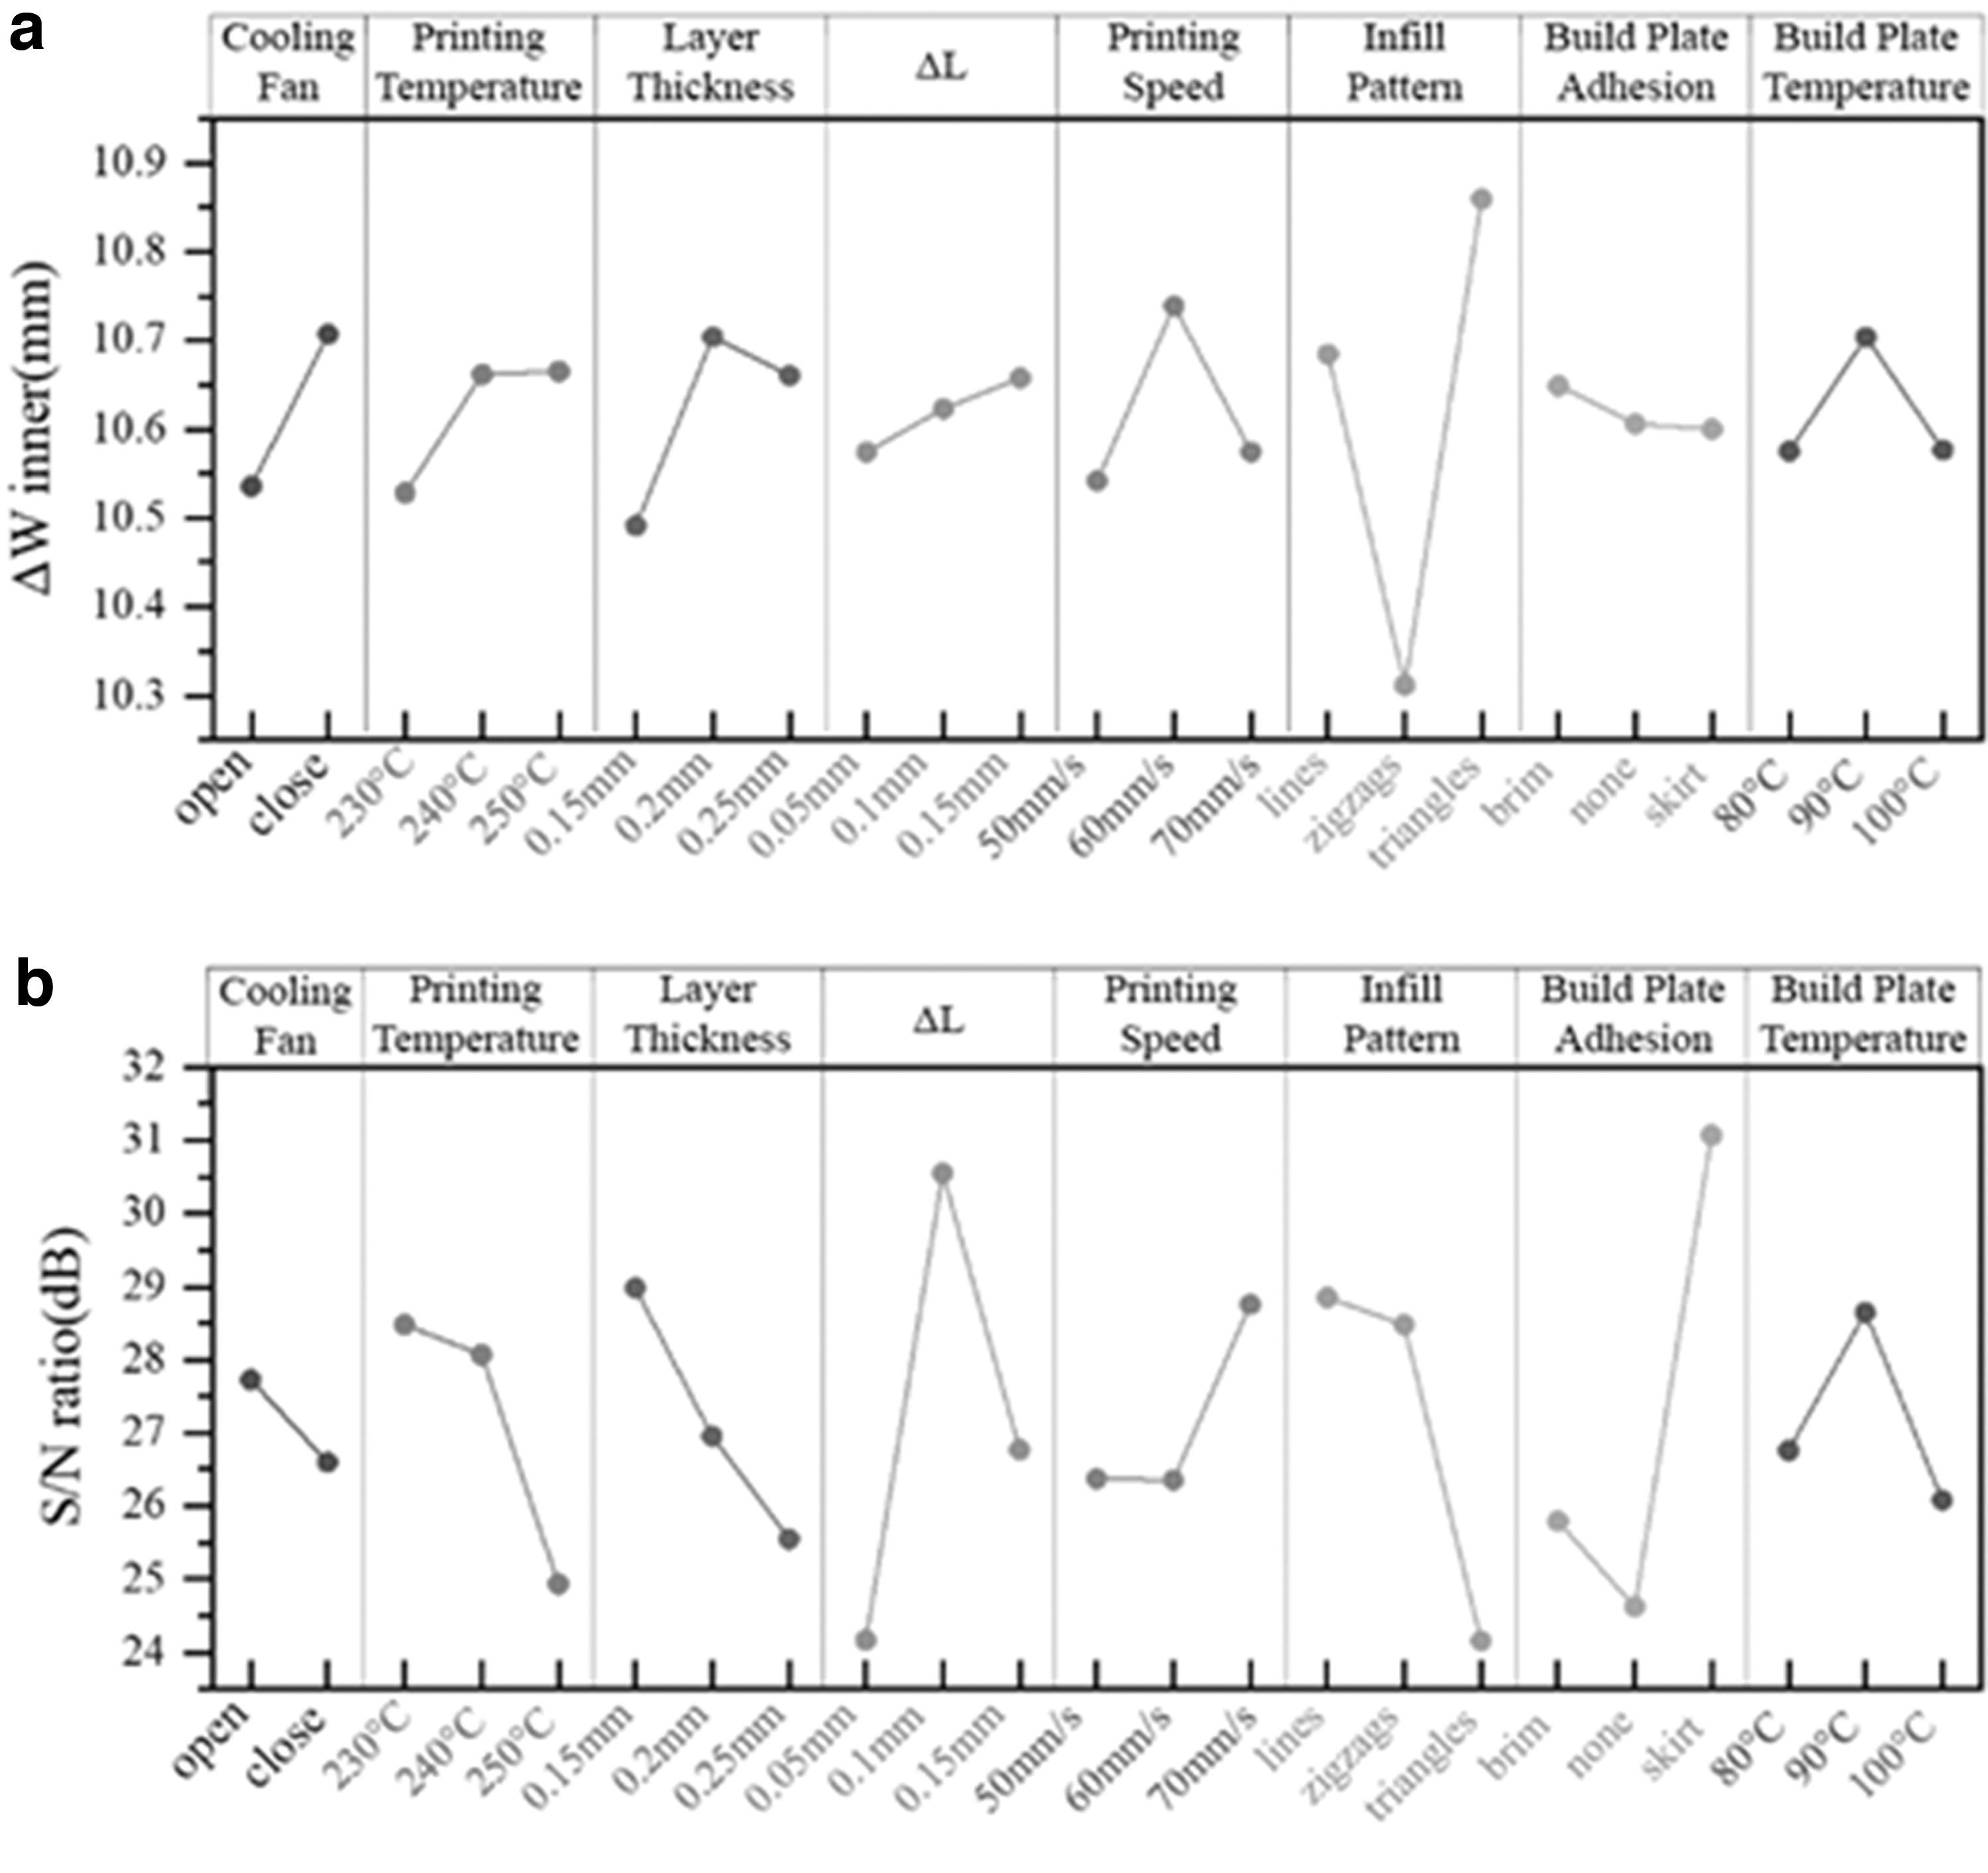

Analysis of Variance for Means——ΔW Inner
Analysis of Variance for Means——ΔW Outer
Analysis of Variance for Means——Warping Degree
Turning on the cooling fan is conducive to the cooling effect of the nozzle and the stability of extruded wire temperature, resulting in uniform material. The size of most FDM specimens is larger compared with 3D models (Supplementary Table S1), which is consistent with the conclusions of Qattawi. 25 The width of specimens with the most refined wire thickness of 0.15 mm is closest to the 3D model. When the infill pattern was triangular or alternating −45°/45 straight lines, the edge of the specimen was very rough due to the incomplete recovery of the nozzle and the fused material overflow at the edge of the specimen.
The ΔL and build plate adhesion were essential factors affecting the degree of warpage (Table 8 and Supplementary Tables S12 and S13). The warping degree of the specimen has a positive linear relationship with ΔL (Fig. 11a). The smaller the ΔL, the better the layer adhesion between the two layers, and the specimen also adhered more closely to the build plate. The contact area between the specimen and a brim build plate is more extensive than the other two, so the adhesion is better (Fig. 3). For the best S/N ratio, a brim build plate adhesion and a 0.05 mm ΔL are expected to generate the most repeatability in the specimen's warpage degree (Fig. 11b).
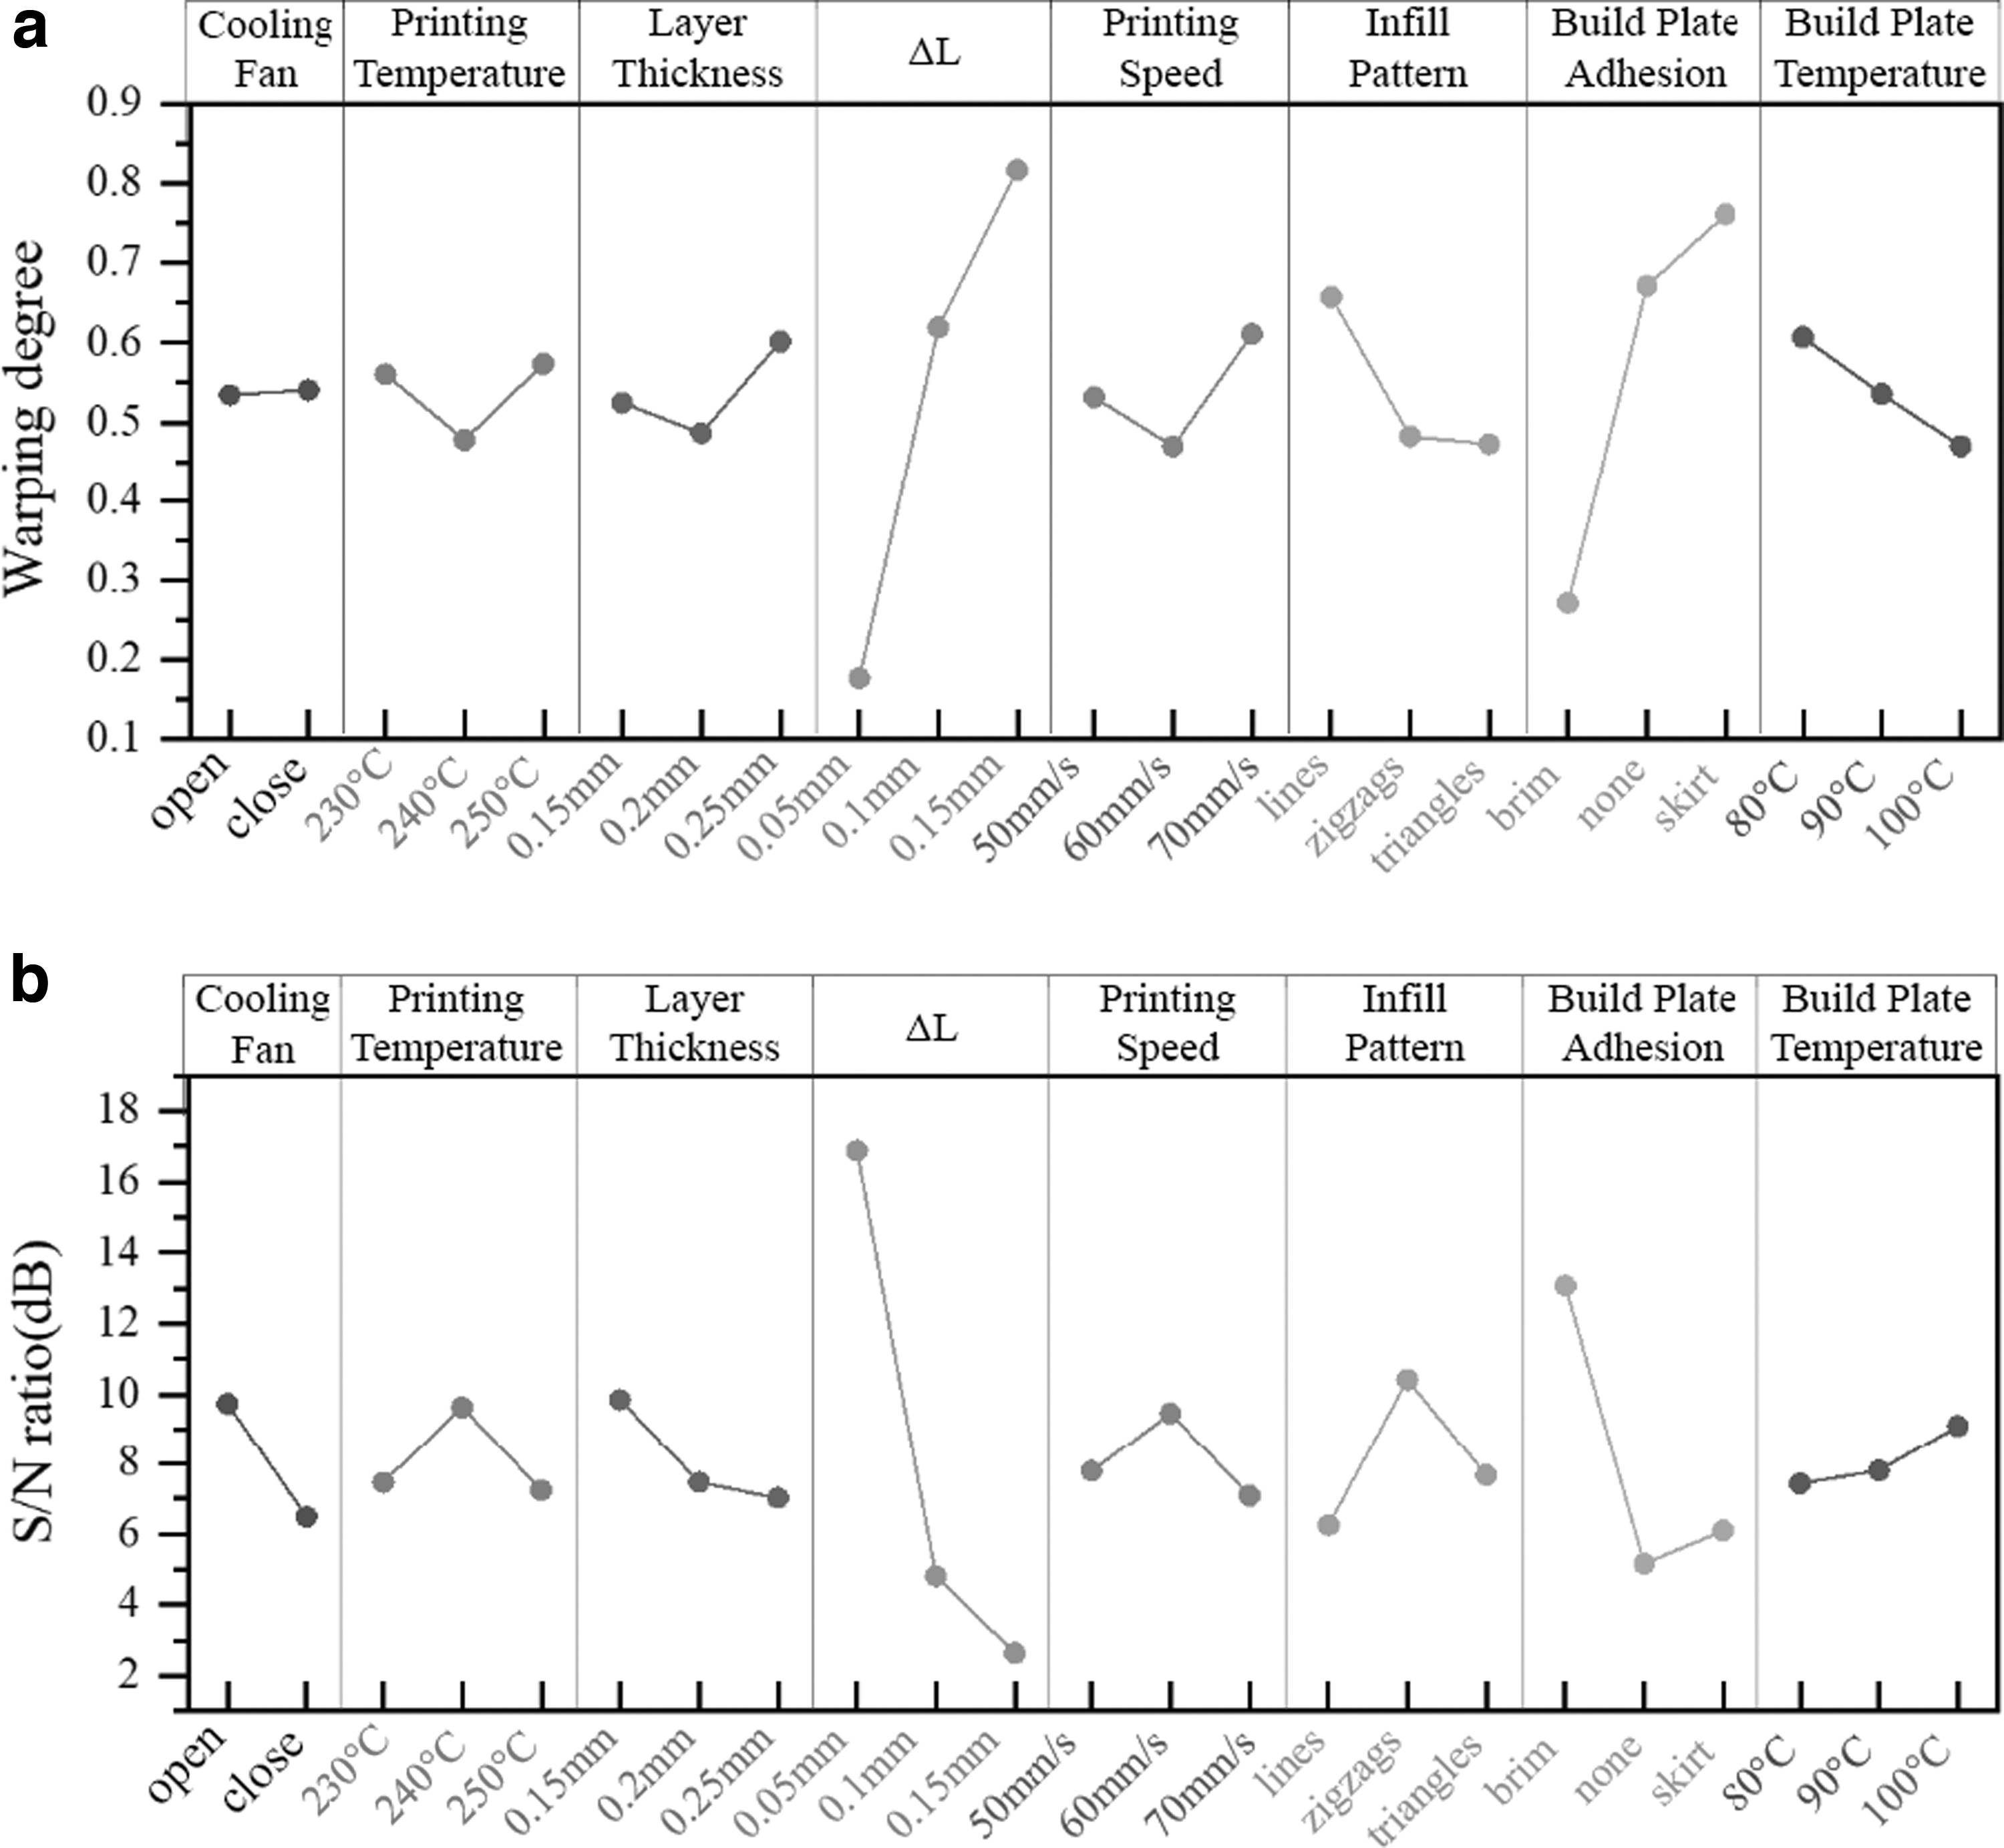
The above results showed that the specimen's dimensional accuracy was better when the cooling fan was turned on, the layer thickness was 0.15 mm, ΔL was 0.05 mm, the infill pattern was zigzags, and the build plate adhesion was brim (Figs. 8–10). The higher dimensional accuracy was obtained from smaller layer thicknesses, and the width error was greater compared with thickness, indicating that the dimension error increased with the specimen size, 34 which was consistent with Ghorpade A's conclusion. 35 The warping degree significantly correlated with ΔL and build plate temperature. The optimum parameters for thickness and width are slightly different.
Surface quality
The roughness of specimens was analyzed with the smaller-the-better characteristics (Fig. 12 and Table 9). The cooling fan switch, layer thickness, infill pattern, build plate adhesion, and build plate temperature were essential factors affecting roughness (Supplementary Tables S10 and S11). Turning on the cooling fan helps the heat dissipation of the nozzle, and the discharging impact is better. The part has the lowest roughness at the layer thickness of 0.15 mm, which is consistent with the result in Mani et al. 36
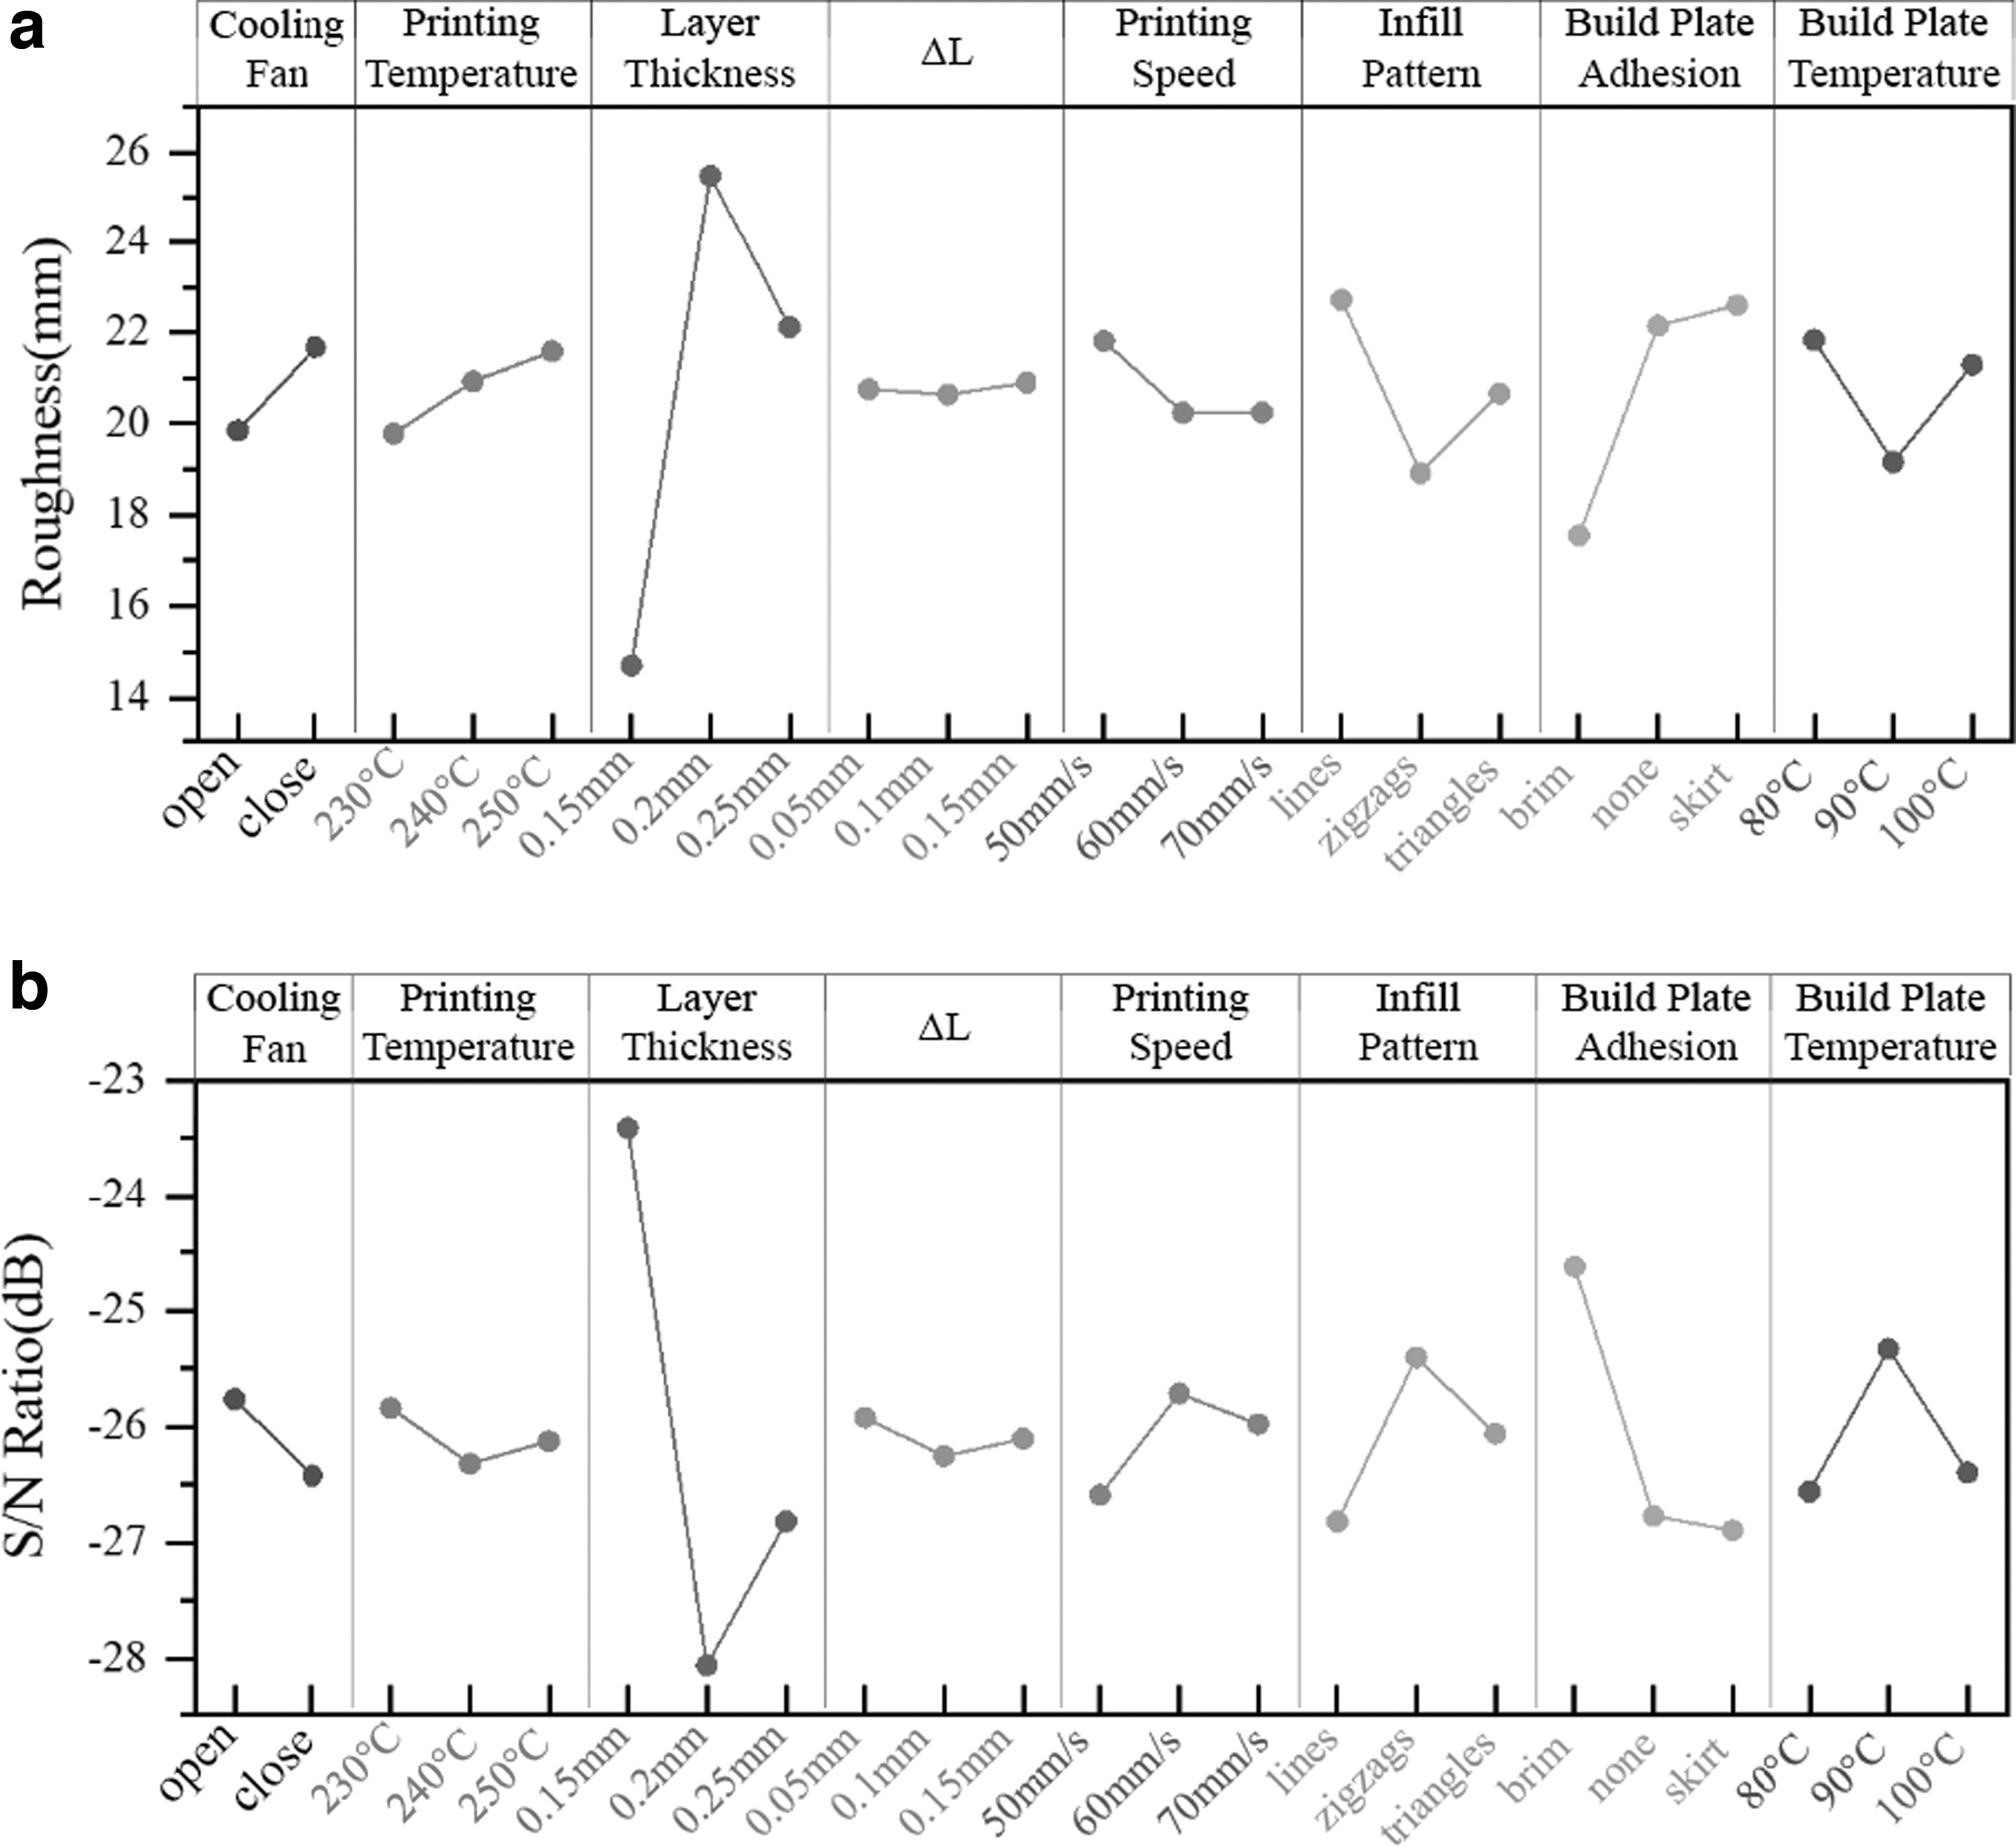
Analysis of Variance for Means——Roughness
The thinner the printing layer thickness, the smaller the diameter of wire extruded by the nozzle, and the printing process is more delicate. When the infill pattern is zigzags, and the build plate adhesion type is brim, the roughness is lower due to the lower specimen's warping degree. The large warping degree increases the roughness because the high-temperature nozzle will generate friction with the upper layer of the specimen. Nozzle squeezing deteriorates the surface morphology. 37
For the best S/N ratio, a 0.15 mm layer thickness, a zigzag infill pattern, a brim build plate adhesion, a build plate temperature of 90°C, and the cooling fan turned on are expected to generate the most repeatability in the specimen's roughness (Fig. 12b).
Mechanical properties
The mechanical properties of specimens were analyzed with larger-the-better characteristics. The printing parameters influence tensile strength (Fig. 13 and Table 10), similar to yield strength (Fig. 14 and Table 11). The printing layer thickness and the infill pattern were essential factors affecting the tensile and yield strength (Supplementary Tables S3 and S14–S17). And the tensile and yield strength decrease as the layer thickness increases. Small layer thickness is favorable for layer adhesion. A reduction in layer thickness increased specimen stiffness. 38


Analysis of Variance of Tensile Strength Means
Analysis of Variance for Means—Yield Strength
The variation of tensile strength and yield strength with process parameters is similar, which is consistent with the conclusion of Camposeco-Negrete. 27 The tensile and yield strength are better when the filling mode is straight and zigzags than triangular, and the best is when the filling mode is a straight line, which is consistent with the result of Camposeco-Negrete. 27 When the infill pattern is triangular, the nonadjacent printing paths lead to poor interlayer fusion and mechanical properties.
Conclusion
Reducing water absorption, crystallinity, and melting point is essential in applying PA composites to FDM. ABS, PE, and ABS-g-MAH were added into PA6/PA66 to prepare FDM composites with high dimensional stability and low water absorption. To reduce the printing workload, the Taguchi method supplemented with ANOVA and S/N ratio analysis was applied to study the influence of eight printing parameters, including three rarely reported ones. The results show that the thickness and infill pattern are the most critical parameters. The switch of the cooling fan and the temperature printing platform played a significant role in the specimens' dimensional accuracy and surface quality. ΔL tremendously influences the thickness and warping degree of the specimens. These methods and results of the investigation of printing parameters have guiding significance for applying PA in FDM. The results can be optimized in future work to meet the optimal parameters under different requirements.
Footnotes
Acknowledgments
The author would like to thank the College of Chemistry and Chemical Engineering, Central South University, for providing a 3D printer and material for conducting the experimental trials.
Authors' Contributions
Z.L.: conceptualization, methodology, data curation, writing—original draft, writing—review and editing, visualization, and validation. Y.L.: editing and review. Z.L.: data processing. Y.L.: supervision, writing—review and editing, visualization, and validation.
Author Disclosure Statement
We declare that we do not have any commercial or associative interest that represents a conflict of interest in connection with the article entitled “The influence of fused deposition modeling parameters on the properties of PA6/PA66 composite specimens by the Taguchi method and ANOVA” for publication in 3D Printing and Additive Manufacturing. There is no professional or other personal interest in any product, service, or company that could be construed as influencing the position presented in, or the review of, the article. All funding sources supporting the work and the institutional or corporate affiliations of the authors were acknowledged.
Funding Information
This work is supported by the Key Research and Development projects of Hunan (no. 2019WK2031), Changsha City, China.
References
Supplementary Material
Please find the following supplemental material available below.
For Open Access articles published under a Creative Commons License, all supplemental material carries the same license as the article it is associated with.
For non-Open Access articles published, all supplemental material carries a non-exclusive license, and permission requests for re-use of supplemental material or any part of supplemental material shall be sent directly to the copyright owner as specified in the copyright notice associated with the article.