
Abstract
Highly dense zirconia ceramic dental crowns were successfully fabricated by a digital light processing (DLP) additive manufacturing technique. The effects of slurry solid content and exposure density on printing accuracy, curing depth, shrinkage rate, and relative density were evaluated. For the slurry with a solid content of 80 wt%, the curing depth achieved 40 μm with minimal overgrowth under an exposure intensity of 16.5 mW/cm2. Solid content and sintering temperature had remarkable effects on physical properties and microstructure. Higher solid content resulted in better structural integrity, higher relative density, and denser microstructure. Compressive strength, Vickers hardness, fracture toughness, and wear resistance significantly increase with lifting solid content, reaching values of 677 MPa, 12.62 GPa, 6.3 MPa·m1/2, and 1.5 mg/min, respectively, for 1500°C sintered zirconia dental crowns printed from a slurry with 80 wt% solid content. DLP is deemed a promising technology for the fabrication of zirconia ceramic dental crowns for tooth repair.
Introduction
Zirconia ceramics are known for their excellent chemical stability, mechanical properties, wear resistance, high-temperature resistance, and corrosion resistance, and for these characteristics, they are widely used in industrial and biomedical fields. Also, zirconia ceramics have the unique nature of phase transformation to increase the toughness and have better structural reliability than other ceramics. Therefore, they have in-depth clinical applications as biomaterials for tooth repair with outstanding restoration outcomes. For example, zirconia ceramic dental crowns have better esthetic characteristics and biocompatibility than metallic ones.1,2
Currently, computer-aided design (CAD) and computer-aided manufacturing (CAM) are usually used for the fabrication of zirconia dental crowns. In this technology, standard presintered zirconia ceramic blocks are machined to obtain patient-specific shapes and dimensions, and then fully sintered for densification to achieve the required mechanical properties. After sintering, there are still complex postprocessing steps to acquire crowns with final features for clinical use.3–5
Up to 80% of the material is wasted in the machining process. In addition, due to the high hardness of zirconia, the service life of the machining tools is significantly reduced, so that the processing cost is increased notably. 6 New advanced manufacturing technologies are required to fabricate zirconia dental crowns more cost-effectively, saving time and resources.
3D printing can realize the rapid prototyping of complex structures through computer control in layers of stacking.7,8 The emergence of the 3D printing technique provides hope for simplifying the production process and reducing the processing cost of ceramic products including dental crowns. American Society for Testing and Materials committee divides additive manufacturing technology into seven types: photopolymerization,9–11 fused deposition modeling (FDM),12–14 powder bed fusion,15,16 material jetting (MJ), 17 binder jetting,18–20 sheet lamination, and direct energy deposition. 21
The FDM, MJ, and laser-based vat photopolymerization technologies are commonly used in the processing of ceramic materials. 22 The laser-based vat photopolymerization manufacturing of ceramic products has attractive advantages, including high precision, high surface finish, fast speed, room temperature forming, and excellent mechanical properties.
In 1996, Griffin and Halloran first used laser-based vat photopolymerization technology (stereolithography [SLA]) to manufacture ceramic products. The photosensitive ceramic–resin slurry with a solid content of 40–55 vol% was prepared. Three kinds of ceramic materials, silicon oxide (2.3 μm), alumina (0.34 μm), and silicon nitride (0.44 μm), were selected for experiments. The ceramic product manufactured has a layer thickness of 150 μm, 136 layers. 23
Licciulli et al. 24 used SLA technology to prepare zirconia–alumina multiphase ceramics. The slurry had a solid content of 60 vol%. The relative density of the ceramics was <90% after sintering. Wu et al. 25 used SLA technology to fabricate zirconia–alumina multiphase ceramics, with a relative density of 99.5%, bending strength of 530 MPa, and Vickers hardness of 17.76 GPa. Bae et al. 26 used SLA technology to manufacture silicon oxide ceramics. The slurry had a solid content of 60 vol%. The curing depth was 100 μm. The density of the fabricated ceramics was not high.
The above-mentioned laser-based vat photopolymerization technology is based on photopolymerization through a point-by-point curing laser. Another type of photopolymerization-based printing technology is digital light processing (DLP), which is based on plane-by-plane curing ultraviolet (UV) light scanning. The curing depth can be controlled at 15–200 μm, and the smoothness of the printing surface is <1 μm, which is <0.3% accuracy error compared with CAD/CAM fabricated products.27,28
Due to the advantages of fast printing speed and high accuracy, DLP technology is widely used for the fabrication of zirconia ceramics. Sun et al. 11 successfully prepared zirconia samples by DLP with a density of 99.71 ± 0.15%; the Vickers hardness and flexural strength were 12.59 ± 0.25 GPa and 1042 ± 75 MPa, respectively. The fracture toughness was 6.68 ± 0.17 MPa·m1/2. The preparation of zirconia ceramic products with complex shapes and controlled structures proves that DLP is a very versatile and powerful manufacturing technique.
Gao et al. 29 successfully prepared hexagonal and square honeycomb sandwich structures of zirconia ceramic by DLP. The bending strength of the honeycomb sandwich structure can reach 170 MPa at a relative density of 41.72%. Osman et al. 30 had successfully prepared zirconia implants using the DLP and evaluated the dimensional accuracy of zirconia dental implants. The printed zirconia implants were dimensionally accurate with a root mean square value of 0.1 mm. It is proved that the DLP has sufficient precision for printing dental implants. Also, the process can be used for precision ceramic printing.
Li et al. 31 successfully prepared zirconia dental bridges and implants by DLP technology, and proved that the technology has great potential in the preparation of dental ceramic prostheses by evaluating its dimensional accuracy and geometric shape, and proposed that the density and process defects that need to be solved urgently in the preparation of crowns are the main factors affecting the commercial use of zirconia crowns. And in another study, Li et al. 32 emphasized the important role of sintering scheme in the preparation of zirconia ceramics by DLP method, and reported the asynchronous densification of zirconia samples fabricated by stereolithography additive manufacturing at lower sintering temperature, which may have a negative impact on the dense ceramic components.
Chen et al. 33 prepared zirconia ceramic dental crowns by DLP, and evaluated their biological properties and physical properties. The relative density was 98.02 ± 0.32%, and the Vickers hardness and fracture toughness were 12.62 ± 0.15 GPa and 6.11 ± 0.36 MPa·m1/2, respectively. Due to the low slurry solid content, it remains challenging to fabricate dense ceramic products, including zirconia dental crowns. The hardness, strength, and toughness, as well as the microstructure, need further improvement to achieve the property requirement for practical utilization.
This study aims to reveal the effects of DLP printing parameters on the physical properties and microstructure of zirconia ceramic crowns, and to further compare the mechanical properties and microstructures between DLP-printed zirconia ceramics and traditionally prepared zirconia ceramics.
Materials and Methods
Materials and equipment
The zirconia powder employed in this study is 3 mol % yttrium-stabilized zirconia (3Y-TZP). The powder is produced by Tosoh Co. Ltd. The key particle size features are D10 = 0.084 μm, D50 = 0.345 μm, and D90 = 0.870 μm. Figure 1 shows the polyhedral morphology of zirconia powder and the particle size distribution. Zirconia powder has a submicron particle size and exhibits a polyhedral morphology, which is beneficial to well disperse in the photosensitive resin and generate an easily spreadable slurry.

SEM images and particle size distribution curve of zirconia powder. SEM, scanning electron microscope.
The laboratory apparatus used includes an AUTOCERA-M DLP-based ceramic 3D printing equipment (Beijing Ten Dimensions Technology Co. Ltd., Beijing, P.R. China), detailed parameters are shown in Table 1, field emission scanning electron microscope (FESEM) (MERLIN Compact; Carl Zeiss, Inc., Oberkochen, Germany), an optical microscope BXT-1304E (OM) (Shanghai Bingyu Optical Instrument Co. Ltd., Shanghai, P.R. China), and a sintering furnace KSL-1500X (Hefei Kejing Material Technology Co. Ltd., Anhui, P.R. China).
Equipment Parameters of AMTOCERA-M Printer
UV, ultraviolet.
Slurry preparation
Photosensitive resin and dispersant were made in-house. The prepolymer (acrylated aliphatic urethane 60 wt %), active monomer (1,6-hexamethylene diacrylate 37 wt %), and photoinitiator (1-hydroxy cyclohexyl phenyl ketone 3 wt %) were homogenized by Vacuum defoamer (SIE-MIX80; SIENOX Co., Ltd., Guangzhou, Guangdong, P.R. China) for 30 min to prepare photosensitive resin.
The zirconia–resin slurry was prepared by mixing zirconia powder and photosensitive resin in proportion, and adding 1 wt % dispersant of polymeric phosphoric acid ester solution. The slurry was shaken in an Ultrasonic shaker (SKYMEN, JP-020s, skymen cleaning equipment; Shenzhen Co. ltd., Guangdong, P.R. China) for 20 min to uniformly distribute the zirconia particles in the resin, which was placed in a vacuum defoamer (SIE-MIX80; Guangzhou Sienox Information Technology Co., Ltd. Guangdong, P.R. China) for 30 min to further homogenize the zirconia–resin slurry.
Zirconia ceramic slurries with different solid content (60, 70, and 80 wt%) were prepared, and their printing behaviors were evaluated by experiments.
The rheological behavior of zirconia ceramic slurries with different solid content (40, 50, 60, 70, 80, and 90 wt%) was evaluated. The spreading state of the slurry on the glass slide for 30 s was observed, and the spreading area of the zirconia ceramic slurries at the time of spreading for 30 s (equivalently approximated to a perfect circle, each slurry was measured three times) was calculated; the viscosities of the slurries for the six solid contents were measured by a Digital Viscometer (De-cca Precision Measuring Instrument Shenzhen Co., Ltd.).
Green body manufacturing
Optimize the exposure intensity and design the precision experiment of the gradient hole. The single-layer gradient hole strip samples were printed using DLP at the same exposure time of 7 s (optimized by our previous study) but at different exposure intensities (13.5 mW/cm2, 16.5 mW/cm2, 19.5 mW/cm2, 22.5 mW/cm2, and 23.5 mW/cm2). Ten samples were prepared under each exposure intensity for slurries with solid contents of 60, 70, and 80 wt%. The curing overgrowth degree of the gradient hole under each exposure intensity was evaluated by an optical microscope. The hole size and actual curing depth were measured by digital vernier calipers 111-101-10G with 0.001 mm accuracy (Digital Measurement and Control Co., Ltd., Guilin, Guangxi, China).
By using optimized processing parameters, crack-free green bodies of zirconia ceramic dental crowns were fabricated with optimal printing accuracy, shrinkage rate, surface smoothness, and structural integrity, as well as excellent interlayer bonding.
Debinding and sintering
The as-printed green bodies of zirconia dental crowns were carefully heat treated for debinding and solidification. To remove photocured resin without generating defects (e.g., cracking and interfacial delamination), the weight loss was monitored by thermogravimetry/differential scanning calorimetry (TGA-DSC). To obtain the optimal debinding–sintering temperature scheme, the crowns were debinded at 300°C to 500°C and sintered at 1400°C, 1500°C, and 1600°C, respectively.
Physical property determination
Shrinkage rate and relative density
The linear shrinkage rates of the samples were calculated by measuring the three dimensions of the green body and sintered samples. The dimensions in three directions in the green body and final part were measured using calipers (DL91200; DELI Co. Ltd.).
The linear shrinkage rates were calculated using the following equation:
In Eq. (1), PL represents the linear shrinkage rates of the X direction, L denotes the length of the green body in the X direction, and L1 represents the length of the sintered sample in the direction.
In Eq. (2), PW represents the linear shrinkage rates of the Y direction, W denotes the length of the green body in the Y direction, and W1 represents the length of the sintered sample in the direction.
In Eq. (3), PH represents the linear shrinkage rates of the Z direction, H denotes the length of the green body in the Z direction, and H1 represents the length of the sintered sample in the direction.
The relative densities of the sintered 3Y-TZP samples were measured according to Archimedes' principle. The relative density of the sintered samples was then calculated using the following equation:
where ρr is the relative density of sintered samples; M t and M w , are, respectively, mass of the sintered samples measured in air and water; ρw is the density of water; and ρ is the theoretical density of 3Y-TZP. The theoretical density of the 3Y-TZP sample is 6.07 g/cm3. 34
Compressive strength, Vickers hardness, and fracture hardness
The compressive strength of the 3Y-TZP samples was tested on an electronic universal testing machine (Instron 4301 [Max. 5 kN] [Instron Company, Norwood, MA]). Experimental 3Y-TZP samples of sandwich structure with dimensions of 10 × 10 × 2 mm3 were prepared to investigate the effects of solid content and sintering temperature on mechanical properties.
The Vickers hardness of the 3Y-TZP samples was tested on Hardness Tester (VTD405 [Max. 49 N] [Wolpert Technology Company, Beijing, China]) (load 49 N, time 5 s). The fracture toughness is calculated by the crack propagation length of the indentation, and the formula is provided as follows
35
:
In Eq. (5), HV represents hardness, P is the indentation load (N), and d is the average diagonal length of the indentation mark (μm).
In Eq. (6), KIC represents fracture toughness (MPa·m1/2), E is Young's modulus (210 Gpa), Hv is the hardness (GPa), P is the indentation load (N), a is the half diagonal length (μm), and l is the crack length (μm).
Abrasive wear resistance
The wear resistance was measured by a grinding and polishing machine (YMP-2B; Metallurgical Equipment Co. Ltd., Shanghai, China). A continuous load of 2 N was applied to the 3Y-TZP samples; the sliding speed and the total sliding distance are 450 r/min and 4.24 km, respectively. In the experiment, the samples were worn on the gauze paper (water lubrication) with 100 mesh SiC abrasive grains for 20 min.
Microstructure and characterization
The macrostructure and microstructure of DLP fabricated and finally sintered zirconia ceramic dental crowns were characterized by optical microscope BXT-1304E (OM) (Shanghai Bingyu Optical Instrument Co. Ltd.) and FESEM (MERLIN Compact; Carl Zeiss, Inc.). X-ray diffraction (XRD) (XRD-6100; SHIMADZU Co. Ltd.) was used to evaluate the phase composition of zirconia crowns sintered at different temperatures.
Results and Discussion
Optimization of slurry solid content
The prepared three photosensitive zirconia–resin slurries with different solid content have different flowability. Figure 2 shows the slurry spreading state observed through an optical microscope and the equivalent approximate diffusion area for 0.1 mL doses of the five slurries at 30 s. The slurry flowing ability decreases with the increase of solid content. With 40 and 50 wt% solid content, the slurry flows very fast to form a large spreading area on the glass slide, but the spreading area has a small thickness, which is not favorable for DLP printing.
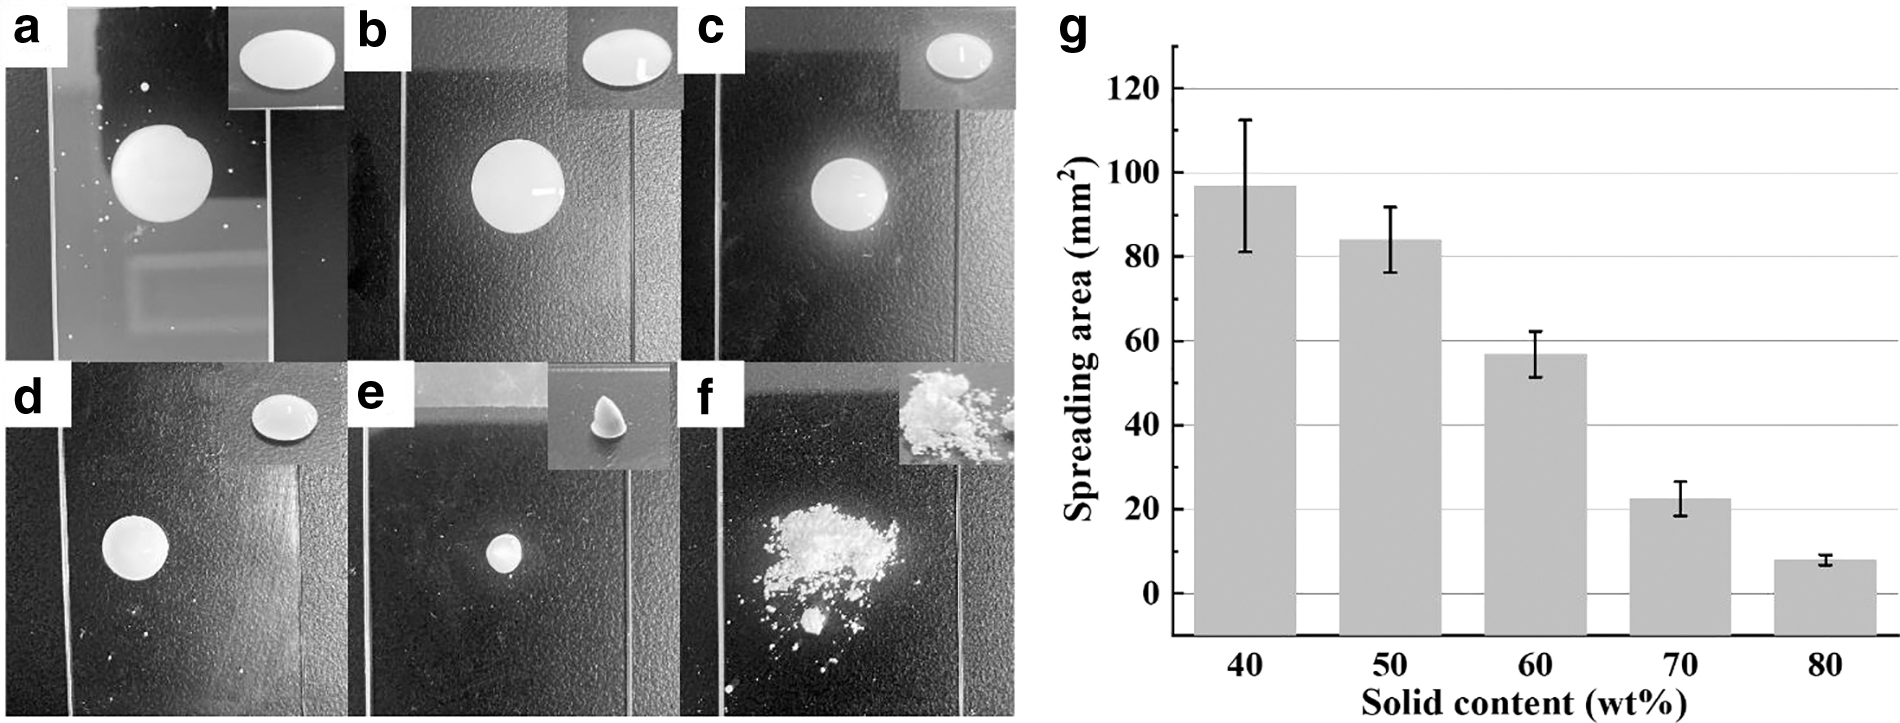
Flowing state of zirconia–resin slurry with different solid content of
With 60, 70, and 80 wt % solid content, the slurry flows slower to form a moderate and thick spreading area, which is beneficial to DLP printing. With 90 wt% solid content, the powder forms large aggregates, and the slurry does not flow, which is not printable by DLP. The rheological property of zirconia–resin slurry with different solid content was evaluated by testing the viscosity (Table 2).
The Viscosity of Five Zirconia–Resin Slurries with Different Solid Content
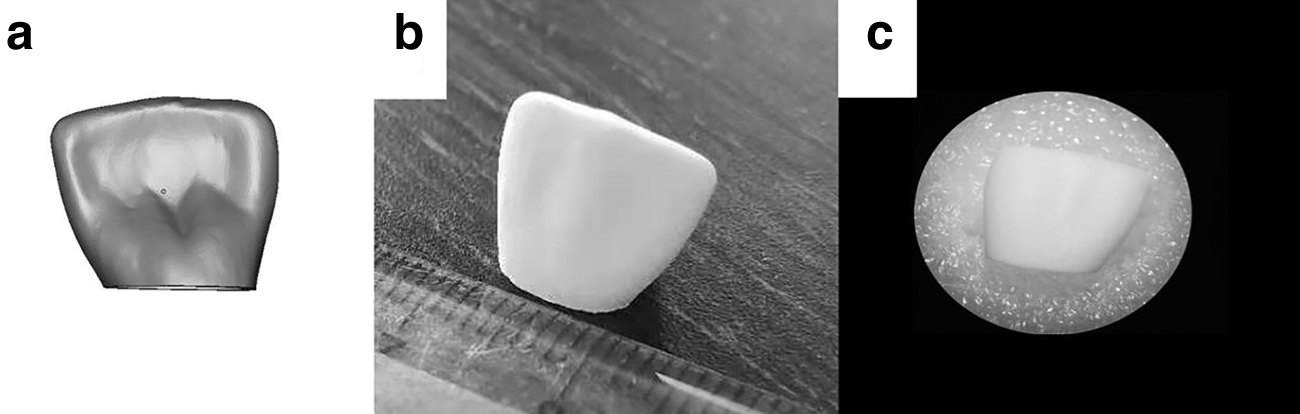
Combined with Table 2 and Figure 2, it proves that the viscosity is negatively correlated with the spreading area. The 80 wt% slurry has the highest viscosity and minimal spread area. The 3D model, DLP-sprinted green body from the slurry with 80 wt% solid content, and sintered sample of the 3Y-TZP ceramic dental crown are shown in Figure 3. As can be seen, the green body and sintered sample both have good surface smoothness and well-controlled shape, without any visible cracks.
Optimization of exposure intensity for selected slurry solid content
DLP is based on plane-by-plane curing UV light scanning. The exposure intensity and exposure time of the light source are the main parameters that affect the accuracy of the printed object. Selecting the appropriate exposure intensity is very important for DLP printing zirconia ceramic crowns. Exposure intensities of 13.5, 16.5, 19.5, 22.5, and 23.5 mW/cm2 were used to print single-layer strips with gradient holes, by using three photosensitive zirconia–resin slurries with different solid content of 60, 70, and 80 wt%.
Other printing parameters employed include an exposure time of 7 s, and model file slice thickness of 25 μm, which have been proven to be optimal in our preliminary research. Evaluate print accuracy of samples by measuring cure depth and cure overgrowth. Figure 4b shows the appearances and gradient hole size of as-printed single-layer strips by using slurry with a solid content of 60 wt%. Curing overgrowth exists for all used exposure intensities, which makes the low printing accuracy of the gradient holes. There are shape errors between the 3D model and printed samples.
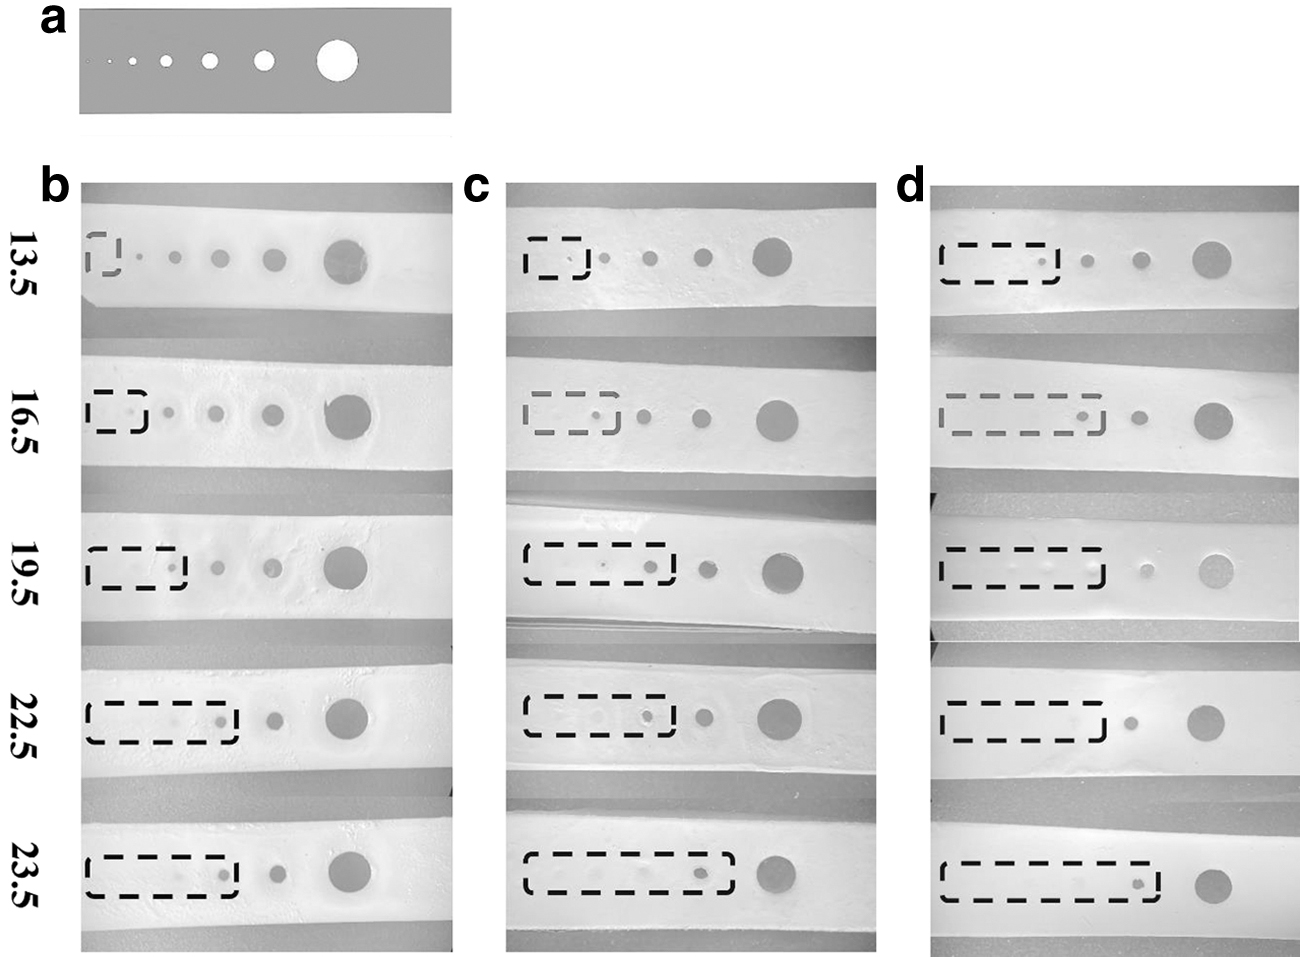
Printing accuracy of three solid contents containing zirconia–resin slurry under different exposure intensities:
With the increase in exposure intensity, the curing overgrowth gets worse, and the curing depth increases. When the exposure intensity is >19.5 mW/cm2, the three small holes are blocked. When the exposure intensity is 13.5 mW/cm2, the curing depth is 40 μm, slightly bigger than the model slice thickness of 25 μm, and the number of holes that can be printed is the largest, which proves that the printing accuracy is the highest, and good interlayer bonding can be achieved.
It can be seen from Figure 4c that curing overgrowth and shape error exist for the used exposure intensities to print single-layer strips by using slurry with a solid content of 70 wt%. The curing overgrowth becomes worse with increasing exposure density. It can be seen from Table 3, when the exposure intensity is 13.5 mW/cm2, the curing overgrowth is the slightest, but the curing depth is 30 μm, which is too close to the model slice thickness to realize strong interlayer bonding. When the exposure intensity exceeds 19.5 mW/cm2, more than three holes are blocked. When the exposure intensity is 16.5 mW/cm2, the curing depth is 40 μm, which can achieve appropriate accuracy with good interlayer bonding.
The Curing Depth of Zirconia–Resin Slurry with Three Different Formulations Under Five Exposure Intensities
Figure 4d shows that there are curing overgrowth and shape errors in the as-printed single-layer strips by using different exposure intensities and slurry with a solid content of 80 wt%. The curing overgrowth is much worse than the strips fabricated from slurries with a solid content of 60 and 70 wt%. Under the exposure intensity of 13.5 mW/cm2, two small holes are blocked. However, the curing overgrowth is minimal compared with other stronger exposure intensities.
The curing depth is 30 μm, which is too close to the model slice thickness to realize strong interlayer bonding. When the exposure intensity is 16.5 mW/cm2, the cure overgrowth is close to that for an intensity of 13.5 mW/cm2 with a curing depth of 40 μm, which can achieve appropriate accuracy with good interlayer bonding. According to the above discussion, the optimal exposure intensities for slurries with solid contents of 60, 70, and 80 wt% are 13.5, 16.5, and 16.5 mW/cm2, respectively.
Figure 5 shows the zirconia ceramic dental crown green body, interlayer bonding state, and microstructure after sintering. The sample was prepared with optimized exposure intensity of slurry solid content of 80 wt% and a sintering temperature of 1500°C. As can be seen, the printed crown has a well-maintained shape compared with the 3D model, and its surface smoothness is good. There are no visible macrocracks or other defects generated by printing. Interlayer bonding and structural integrity are excellent. No delamination and microcracks can be found. The green body and sintered sample both have dense microstructure.
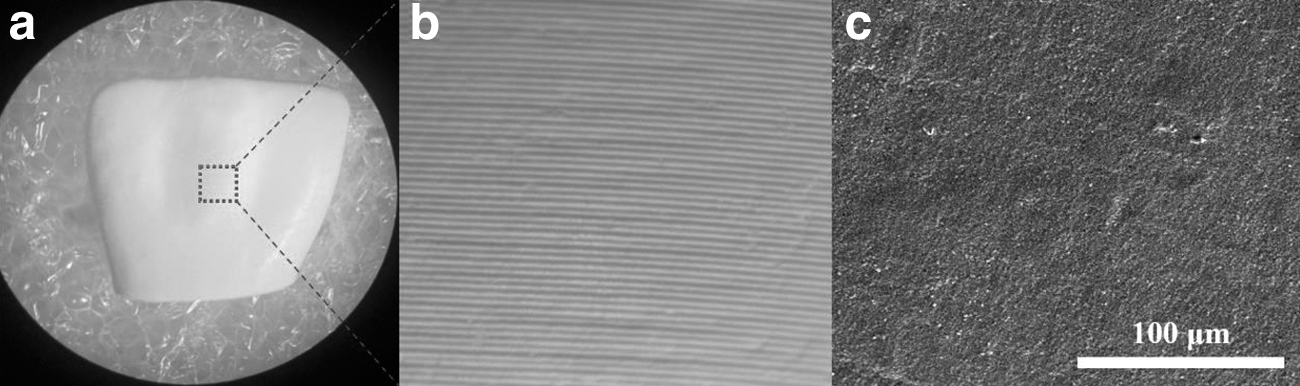
Zirconia ceramic dental crown prepared with optimized printing parameters:
Optimization of debinding and sintering scheme
Figure 6 shows the TGA-DSC curve of DLP-printed zirconia ceramic dental crown to study the mass loss and thermodynamic feature, which helps the optimization of the debinding and sintering scheme. The peak mass loss occurs at the temperature range of 350°C and 500°C. Endothermal valleys appear at 400°C and 600°C. The mass loss and heat absorption result from resin decomposition. Three debinding and sintering schemes are set as shown in Figure 7.

TGA-DSC curve of DLP-printed zirconia dental crown with 80 wt% of the zirconia–resin slurry solid content. TGA-DSC, thermogravimetry/differential scanning calorimetry.
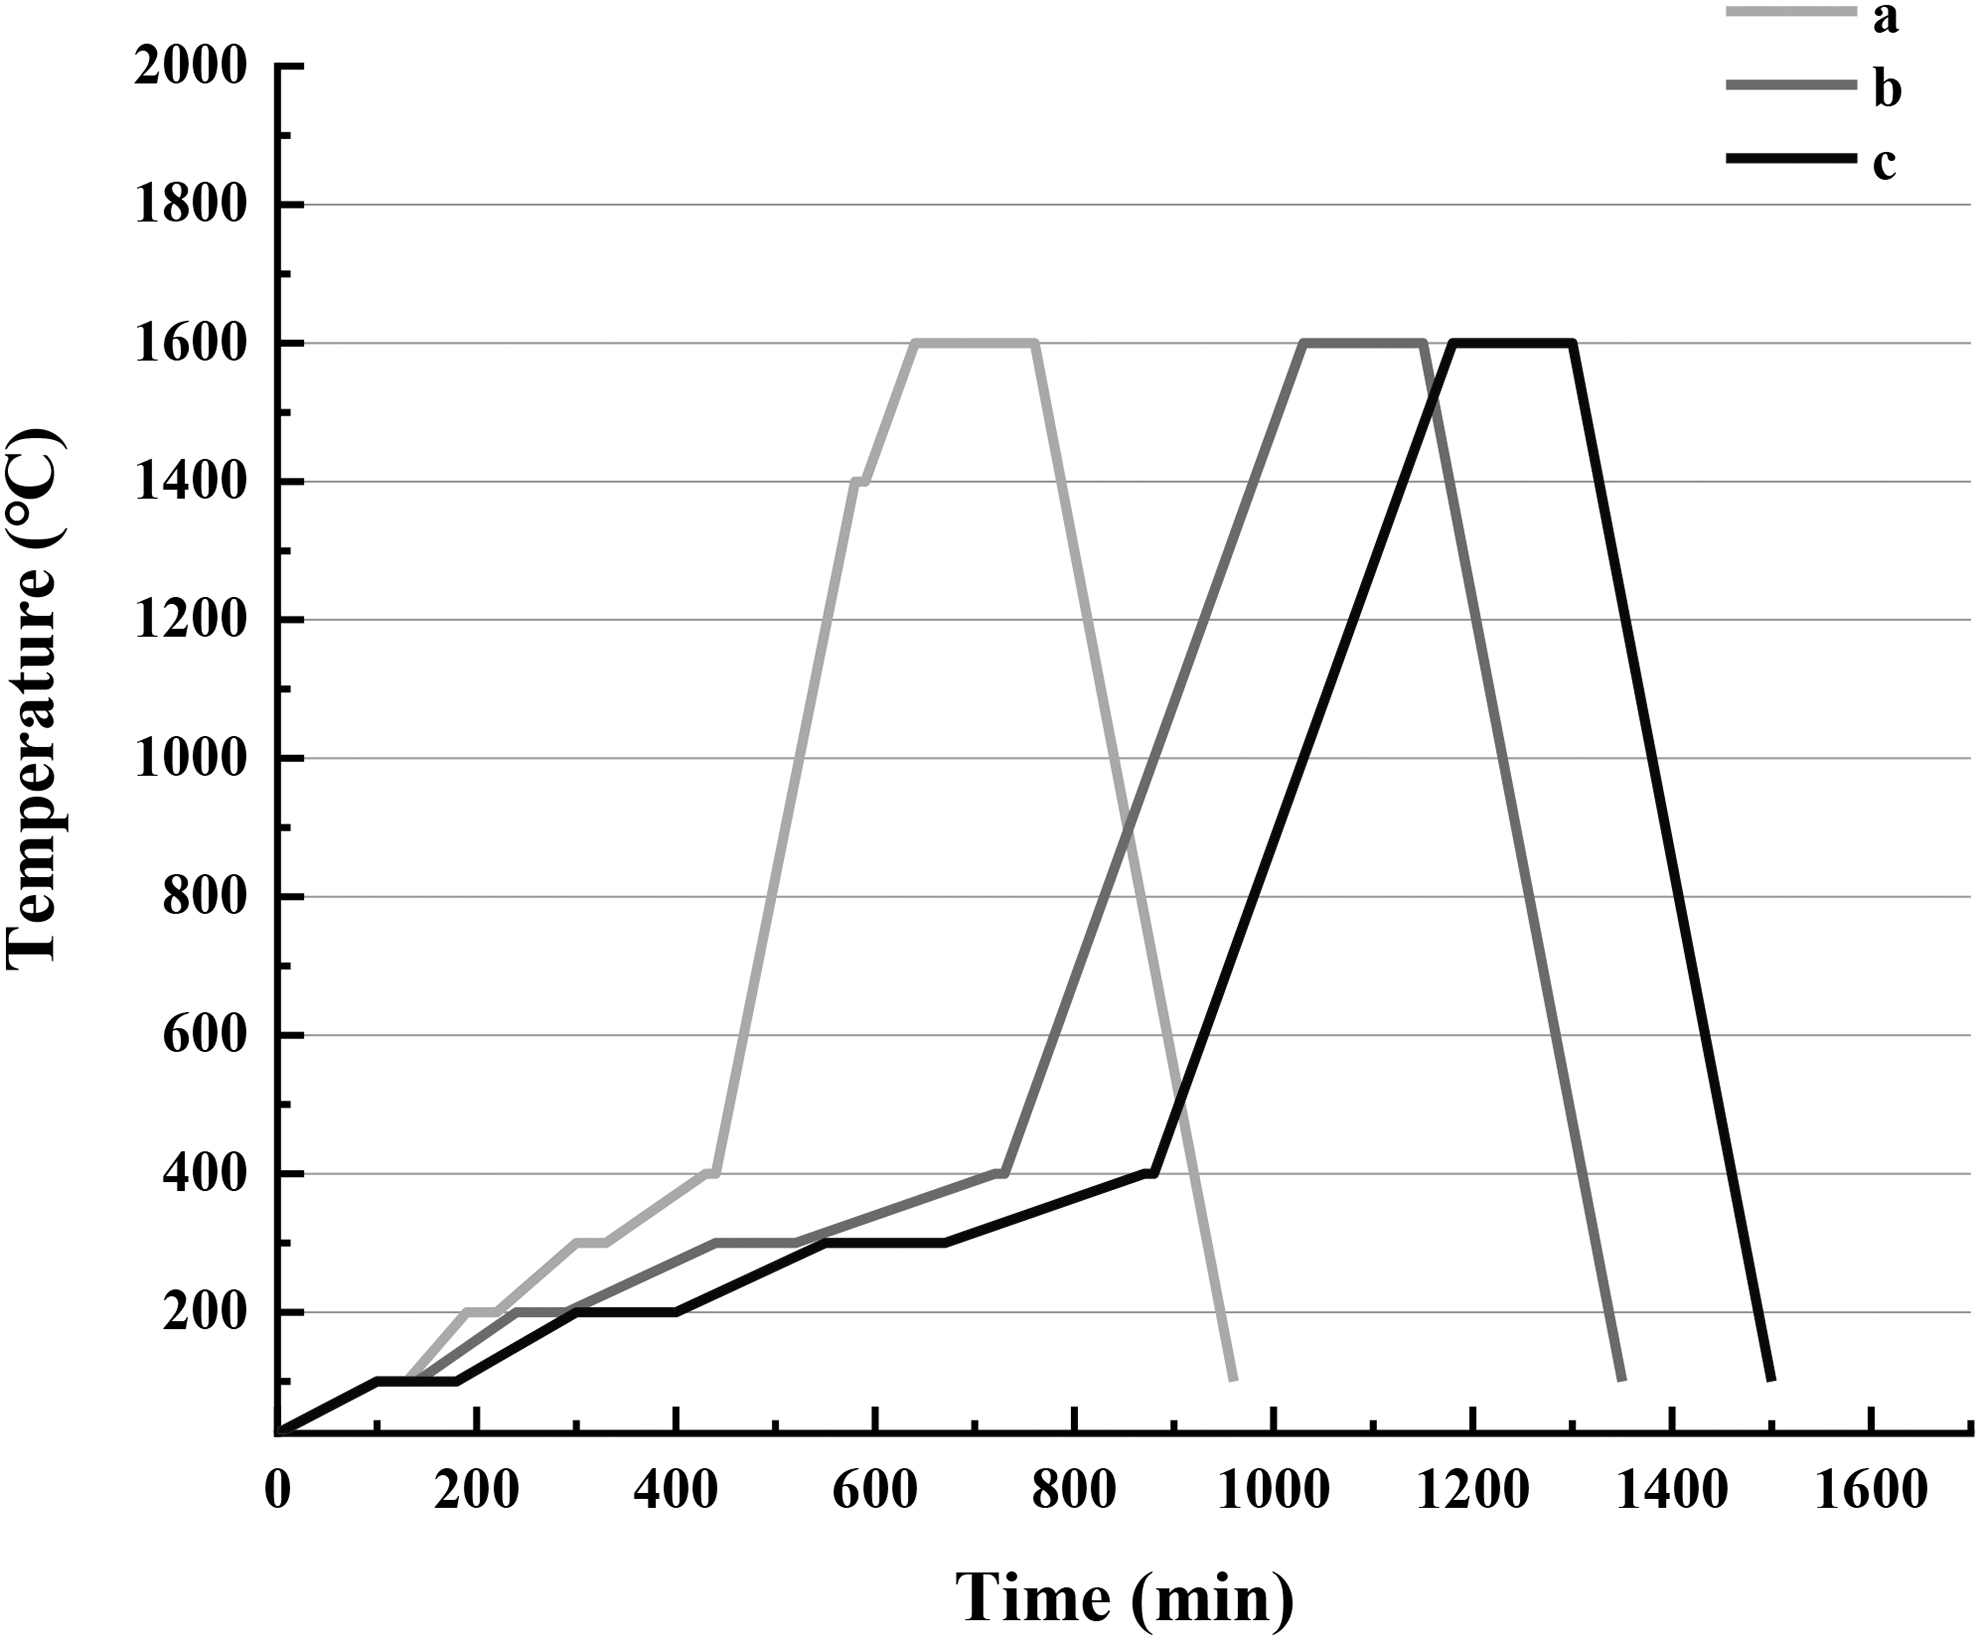
Debinding and sintering scheme curves for DLP-printed zirconia dental crown:
With the increase of holding time from 350°C to 500°C, the zirconia crowns have better structural integrity with cracks disappearing. As can be seen in Figure 8, there are visible lateral cracks on the crown surfaces for scheme 1 and scheme 2. On the contrary, no cracks are found in the crown by using scheme 3.
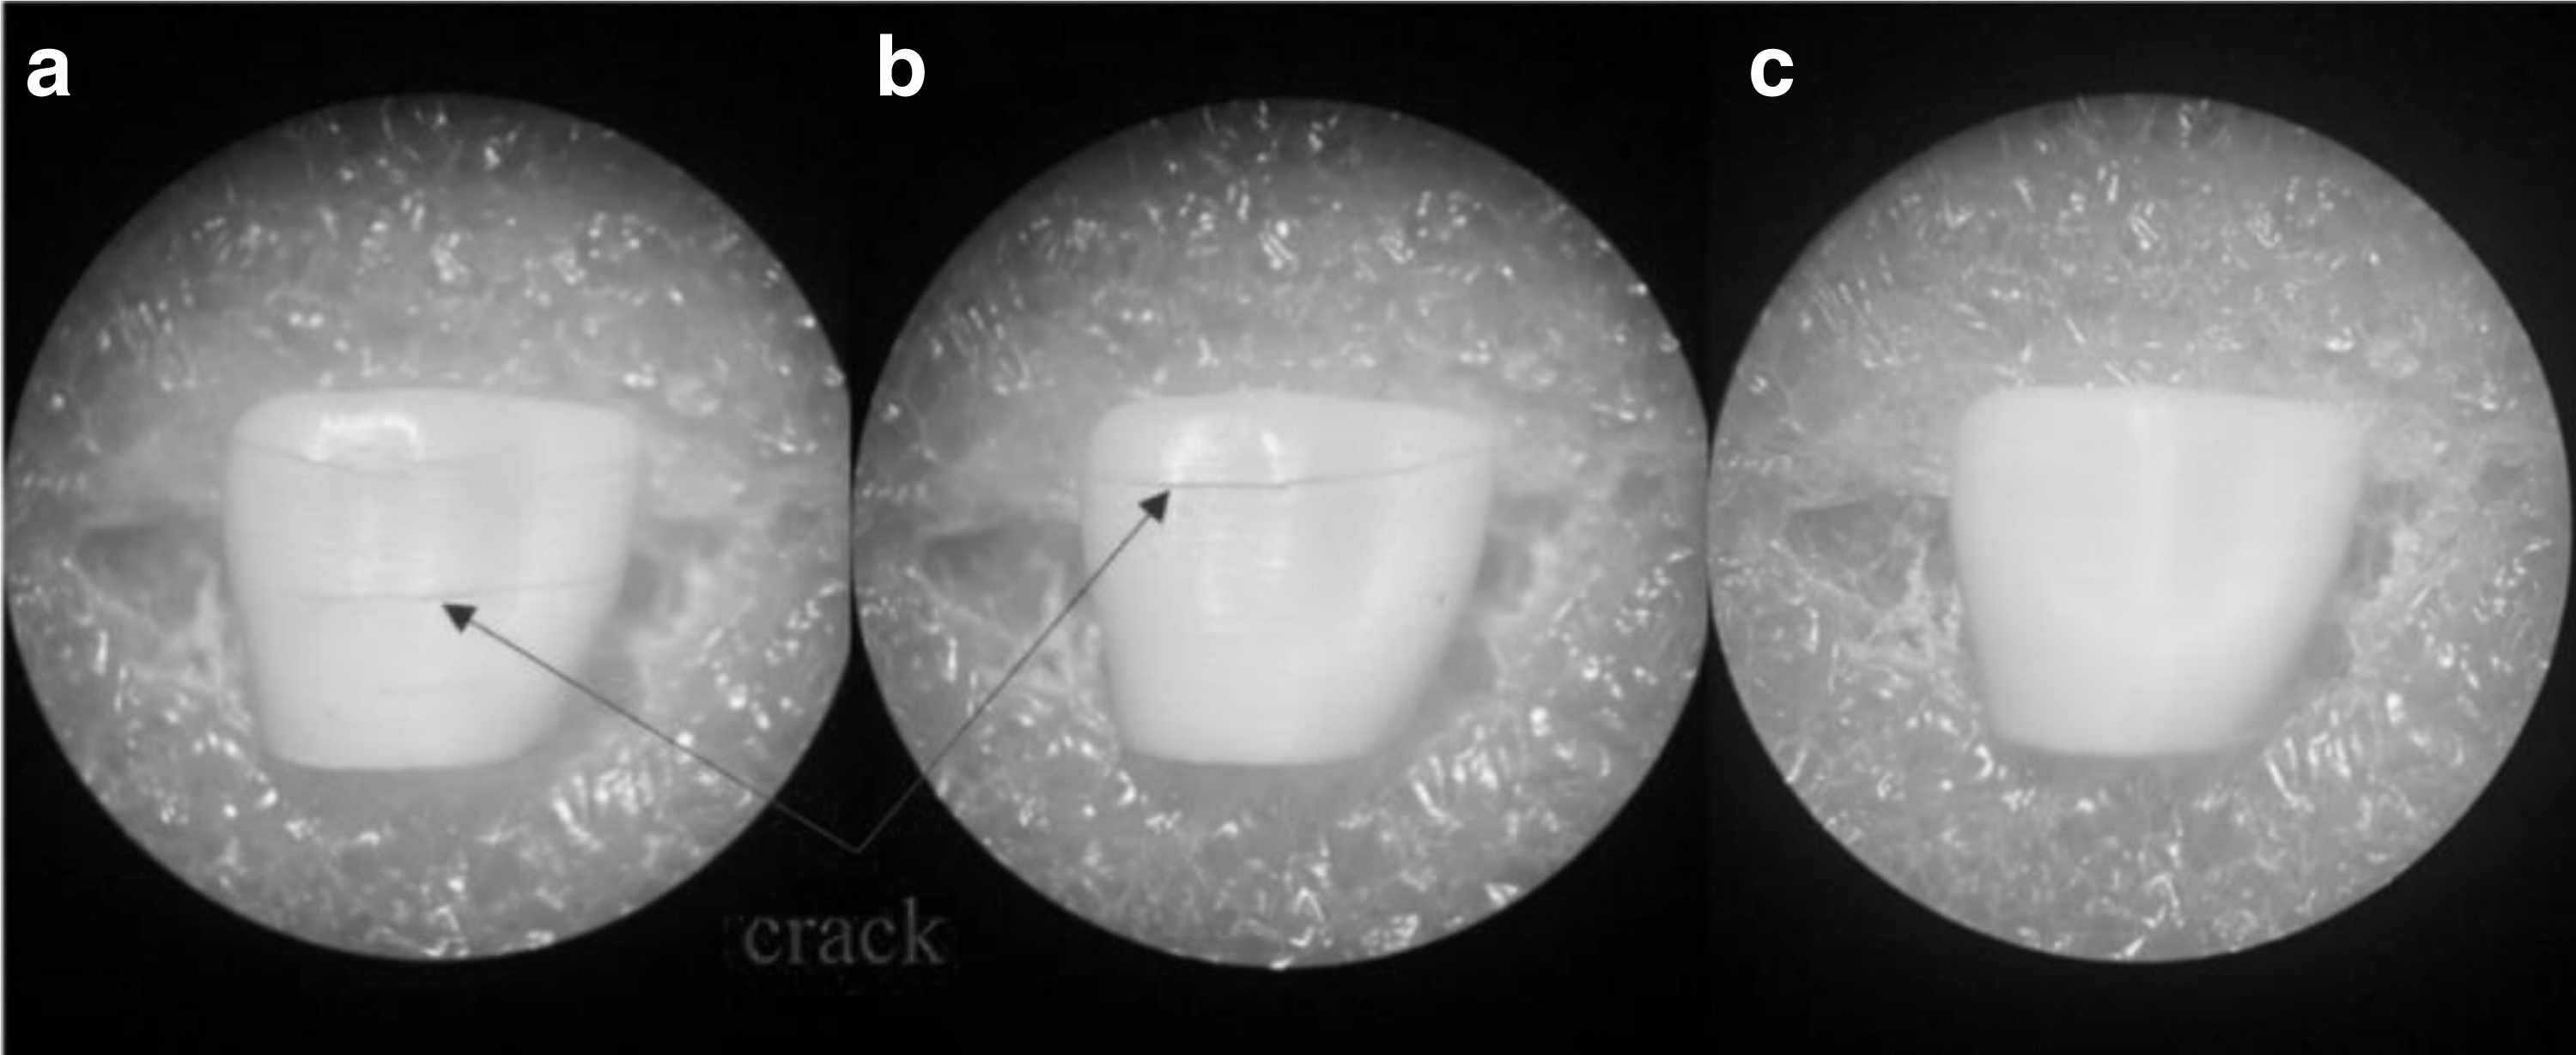
Digital photographs of sintered zirconia dental crowns:
Phase composition analysis
Figure 9 shows the crystalline phase of DLP-printed zirconia ceramic dental crowns sintered at different temperatures. No obvious monoclinic phase peak is detected in all samples, indicating existence of a pure metastable tetragonal phase.

XRD patterns of DLP-printed zirconia dental crowns sintered at different temperatures. XRD, X-ray diffraction.
Structural integrity characterization and solid content optimization
Figure 10 displays the appearance of zirconia ceramic dental crowns DLP printed from slurries with solid contents of 60, 70, and 80 wt%, and sintered at 1400°C, 1500°C, and 1600°C. Severe lateral cracks occur in the samples with a low slurry solid content of 60 wt%. This results from excess resin decomposition and ignition, which leads to uneven volume change during the debinding process.
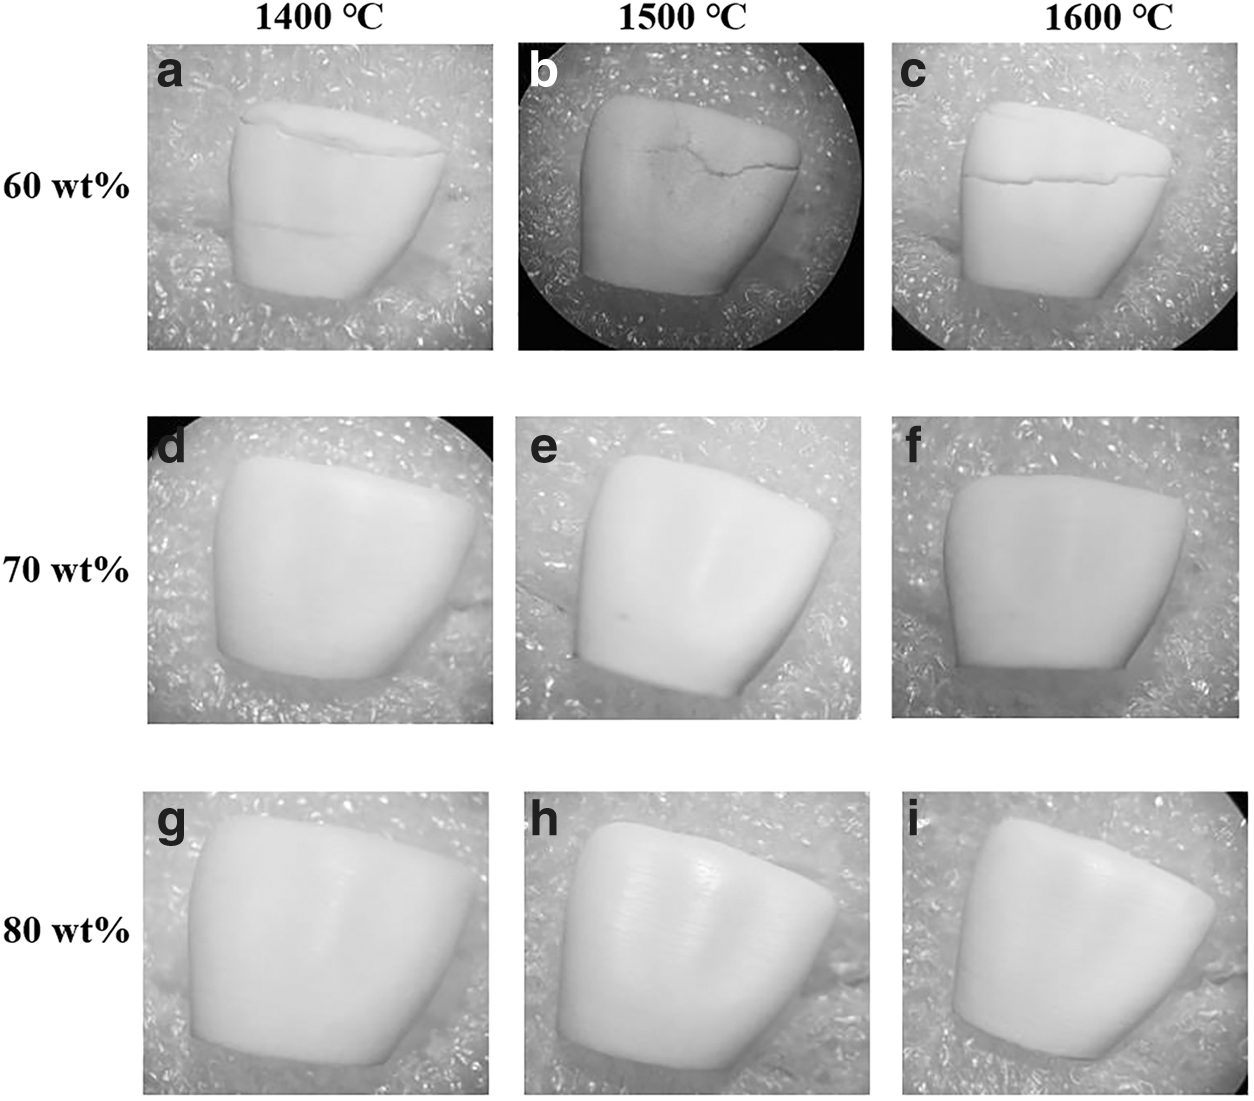
Digital photos of zirconia dental crowns printed from slurries with different solid contents and sintered at different temperatures:
The sample with 70 wt% slurry solid content has some small cracks, but much fewer and slighter than those in the 60 wt% solid content sample. The cracks disappear with the increase of solid content to 80 wt%. Therefore, slurry solid content has a remarkable effect on structural integrity, surface quality, and shape accuracy. The influence of sintering temperature is minor.
The linear shrinkage rates of DLP-printed zirconia dental crowns were measured and are listed in Table 4. Slurry solid content and sintering temperature both have a notable effect on the linear shrinkage rate. With the increase of slurry solid content, the shrinkage rate decreases significantly. With the increase of sintering temperature, the shrinkage rate increases gradually. It is also found that the linear shrinkage rate in the curing direction (Z axis) is slightly bigger than that in printing plane directions (X and Y axes). The shrinkage rate reaches the largest when the slurry solid content is 60 wt% and the sintering temperature is 1600°C. The smallest shrinkage occurs for samples sintered at 1400°C and prepared from slurry with a solid content of 80 wt%.
Shrinkage Rate of 3D-Printed Zirconia Crown Ceramics Prepared with Different Zirconia–Resin Slurry Solid Content and Sintering Temperatures
Physical property evaluation
Relative density
Table 5 shows the relative densities of DLP-printed zirconia ceramic crowns and dry-pressed zirconia ceramics sintered at different sintering temperatures. The relative density of dental crowns with 60, 70, and 80 wt% solid content increases with the increase in temperatures. At 1500°C and 80 wt%, the density of the zirconia crown is 6.02 g/cm3, and the relative density reaches 99.2%. Our results are close to a study previously reported by Lian et al., which showed higher relative densities (99.30%). 34
Relative Densities of Digital Light Processing-Printed Zirconia Ceramic Crowns and Dry-Pressed Zirconia Ceramics Sintered at Different Temperatures
The relative density of dry-pressed zirconia ceramics sintered at 1500°C under a pressure of 120 Mpa was 99.5%, which is close to the relative density of DLP-printed zirconia ceramics. It is proved that the process parameters of crown preparation have a good optimization effect, and the printed sample has a dense microstructure. The results of this work demonstrate that the performance of the DLP-prepared zirconia ceramics is comparable with those of conventionally fabricated zirconia. The densification process was further explored by observing the microstructure.
Compressive strength
The compressive strength curves of DLP printed with 80 wt% solid content samples at different temperatures (1400°C, 1500°C, and 1600°C) are shown in Figure 11a. The relationship between compressive strength and sintering temperature of DLP-printed samples was clarified. When the sintering temperature is increased from 1400°C to 1600°C, the compressive stress increases from 496 to 698 MPa. It is proved that the compressive strength increases with the increase of the sintering temperature.
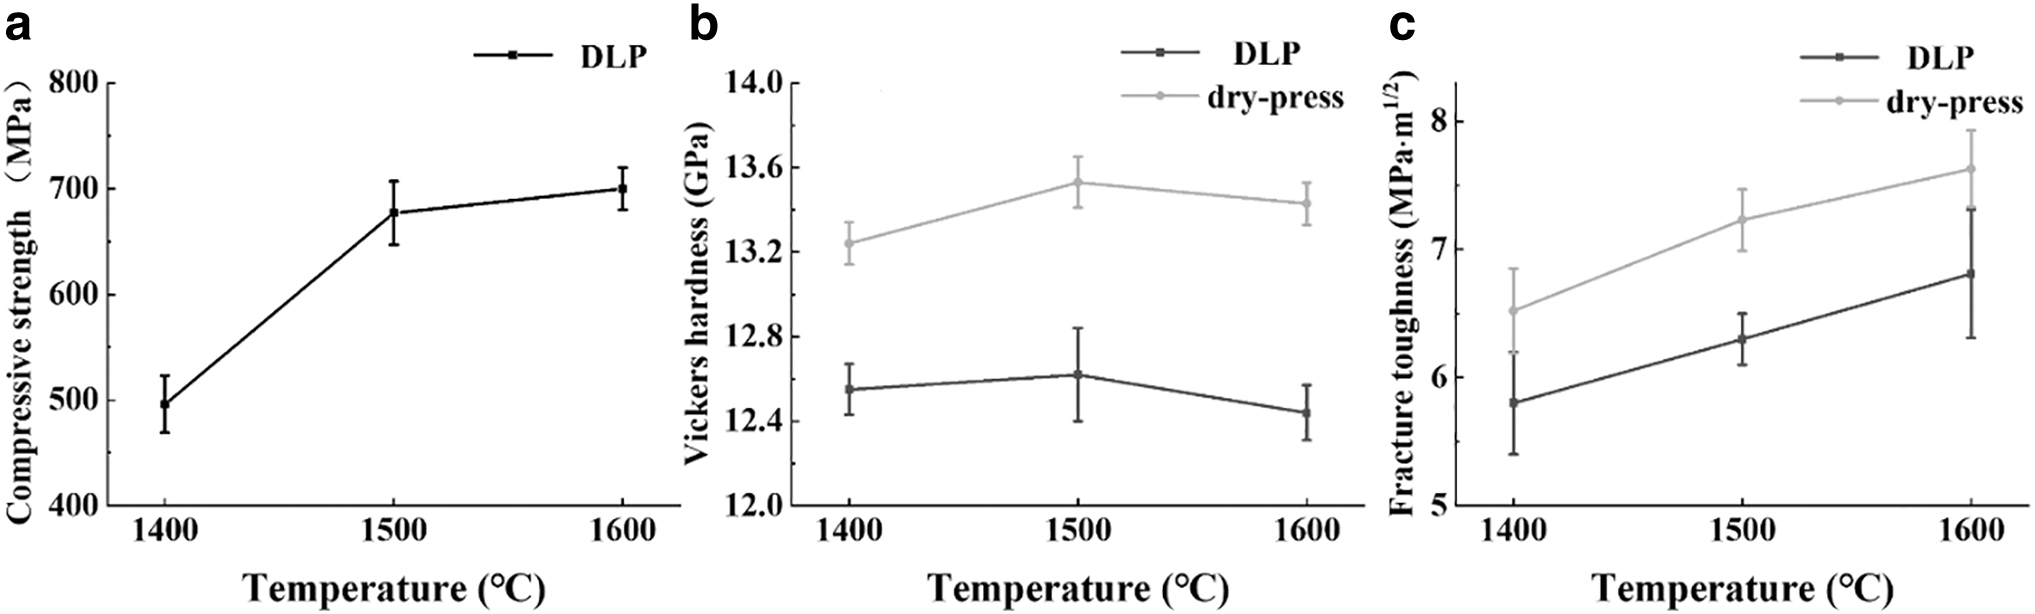
Mechanical properties of dry-pressed and DLP-printed 80 wt% slurry solid content samples versus sintering temperature curves:
The compressive strength curves of DLP-printed samples with slurry solid contents (60, 70, and 80 wt%) are shown in Figure 12a; the compressive strength increases with the increase of the slurry solid content. When the slurry solid content is increased from 60 to 80 wt%, the compressive stress increases from 165 to 698 MPa. From the observation data, it has been noted that under the selected parameters, the slurry solid content has a remarkable effect on the compressive stress. The influence of sintering temperature is minor.
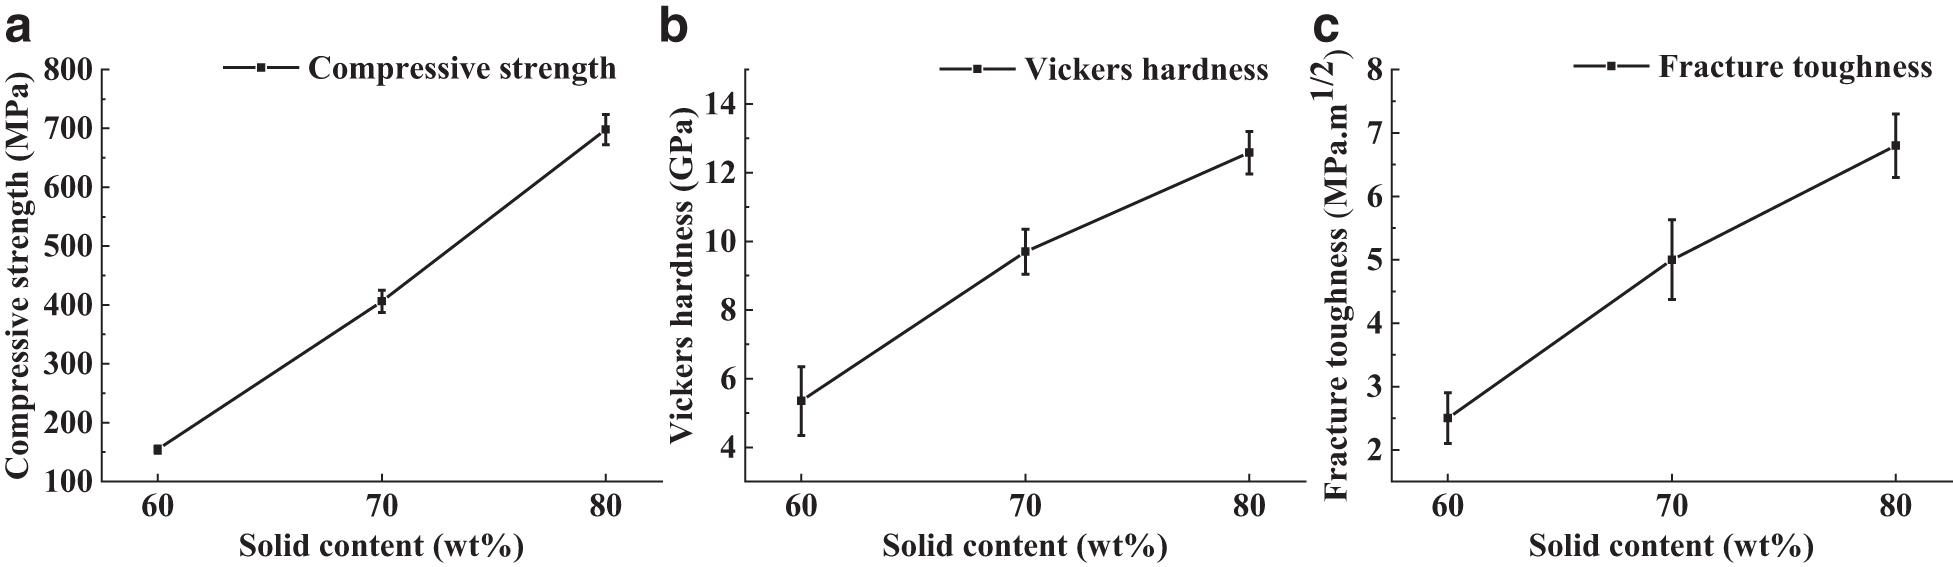
Mechanical properties of DLP-printed zirconia ceramics samples versus slurry solid content curves:
Vickers hardness
Figure 11b shows that the Vickers hardness of dry-pressed and DLP-printed with 80 wt% slurry solid content samples versus sintering temperature curves. It can be seen from Figure 11b that the Vickers hardness of DLP-printed with 80 wt% slurry solid content samples shows an upward trend when sintered at 1400–1500°C, reaching 12.62 GPa at a sintering temperature of 1500°C, which is close to the Vickers hardness value of the dry-pressed samples. The changes in the Vickers hardness of the samples sintered at different temperatures (1400°C, 1500°C, 1600°C) are mainly related to the degree of densification and grain size. During the sintering process from 1400°C to 1500°C, it can be seen from Table 5 that the degree of densification increases, the zirconia ceramic samples become denser, and the Vickers hardness of the samples increases.
During the sintering process from 1500°C to 1600°C, the density decreases, and the Vickers hardness also decreases, which may be related to the change in the grain size of the zirconia ceramic samples. Rice et al. studied the relationship between ceramic grain size and hardness, and proved that ceramic hardness decreases with an increase in grain size. 36 In this study, the zirconia samples sintered at 1500°C may have a fine-grained microstructure. This hypothesis will be verified in the microstructural characterization section.
The Vickers hardness of samples with slurry solid content (60, 70, and 80 wt%) prepared by the DLP is mainly affected by the degree of densification. The zirconia samples with low solid content have a low content of zirconia powder. After sintering, the resin is discharged and more pores are generated, resulting in low density and poor hardness.
On the contrary, zirconia samples with high solid content have higher density, fewer pores, and higher hardness. Figure 12b shows that the Vickers hardness of the DLP -printed samples increases with the increase of the slurry solid content, and the hardness value changes drastically when the solid content changes from 60 to 80 wt%. It is proven that the solid content of the slurry has a great influence on the hardness of zirconia ceramics prepared by DLP.
Fracture toughness
The fracture toughness of the zirconia samples was calculated by the indentation method, Eq. (6). The relationship between fracture toughness and sintering temperature is shown in Figure 11c. The fracture toughness of DLP-prepared zirconia samples increases with increasing temperature. Consistent results were obtained from the study of Ruiz et al. 37
Many studies have proved that the fracture toughness of zirconia varies with the grain size. With the increase in temperature, the grain size becomes coarser, which is easy to induce t-m transformation, and the fracture toughness decreases.37,38 The relationship between fracture toughness and the slurry solid content of the zirconia samples is shown in Figure 12c, and the fracture toughness increases with the increase of the slurry solid content of the zirconia samples.
The zirconia samples prepared by the DLP, when the slurry solid content is 80 wt% and the sintering temperature is 1600°C; the fracture toughness is 6.8 MPa·m1/2, which is ∼7.63 MPa·m1/2 of the dry-pressed zirconia samples. The fracture toughness of zirconia ceramics prepared by the DLP is higher than that of 6.11 ± 0.36 MPa·m1/2 previously reported by Chen et al. 33
Wear resistance
The wear rates of dry-pressed zirconia samples and DLP-printed zirconia samples with 80 wt% slurry solid contents versus sinter temperature curves are shown in Figure 13a. With the sintering temperature increasing from 1400°C to 1500°C, the wear rate of the zirconia samples decreases. For the 1600°C sintered sample, the wear rate increases, which may be related to the enlarged grain size. According to Hvizdo et al., the fine-grained microstructure has higher wear resistance. 38 The 1500°C sintered zirconia ceramic samples may have a fine-grained microstructure. This hypothesis will be verified in the microstructural characterization section.
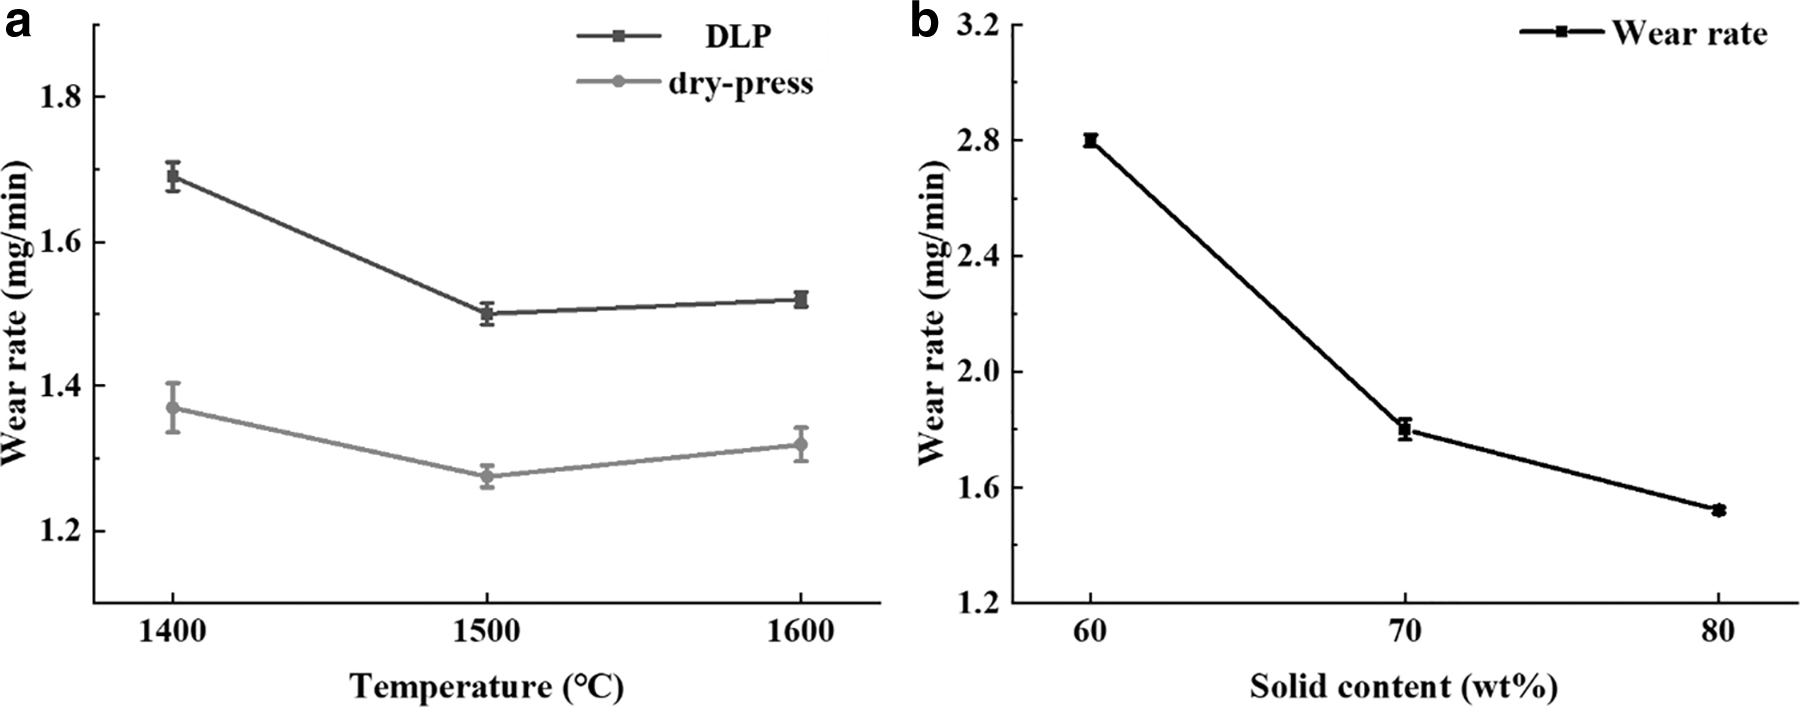
Wear rate of 3Y-TZP samples:
The worn surface microstructures of zirconia ceramic samples sintered at different temperatures were characterized by SEM, as shown in Figure 14, to further explain the change in wear rate. The mechanism of material loss is that the indentation and microcutting of abrasive grains on the surface of the sample lead to grain fracture and pullout from the material surface. As can be seen in Figure 14, there are typical flake-like features resulting from a brittle material fracture in the worn surface. For 1600°C sintered samples, long macrocracks parallel to the sliding wear direction were observed, which would exacerbate the wear, suggesting further degradation of this material's performance. 38

SEM images of the worn surface microstructure of zirconia samples with 80 wt% of slurry solid content prepared by DLP:
The wear rate of the sintered sample at 1500°C was 1.50 mg/min (consistent with the highest density in Table 4), which was close to that of the dry-pressed zirconia sample sintered at 1400°C (1.37 mg/min). It is proved that zirconia ceramic samples prepared by DLP have excellent wear resistance comparable with that of dry-pressed 3Y-TZP samples.
The wear rates of DLP-printed zirconia ceramic samples versus solid content curves are shown in Figure 13b. With the increase of slurry solid content, the wear rate decreases, and 80 wt% solid content leads to smallest wear rate. The slurry solid content has a greater influence on the wear resistance of DLP-prepared zirconia ceramic than the sintering temperature. The wear features are further explored through microstructure observation.
As shown in Figure 15, the sample fabricated from low slurry solid content has a large shrinkage, resulting in local stress concentration on the surface, so it is more likely to cause a surface fracture when the abrasive particles are pressed into the surface and in the process of abrasive particle microcutting. Figure 15 shows more fracture features. In the literature, the erosion wear of alumina ceramic was studied in detail,39,40 and it was revealed that grain fracture and pullouts are the main causes of material loss, which is consistent with the present study on the abrasion wear of DLP-fabricated zirconia ceramic.

SEM images of the worn surface microstructure of zirconia samples prepared by DLP:
Microstructure characterization
Slurry solid content and sintering temperature have notable effects on the microstructure of DLP-fabricated zirconia ceramic dental crowns. With the increasing slurry solid content and sintering temperature, the microstructure becomes denser, and the grains turn bigger. As shown in Figure 16, the samples with slurry solid contents of 60, 70, and 80 wt% and sintered at 1400°C have loose microstructures with a significant number of micropores, which indicates that they cannot be fully sintered at this temperature.
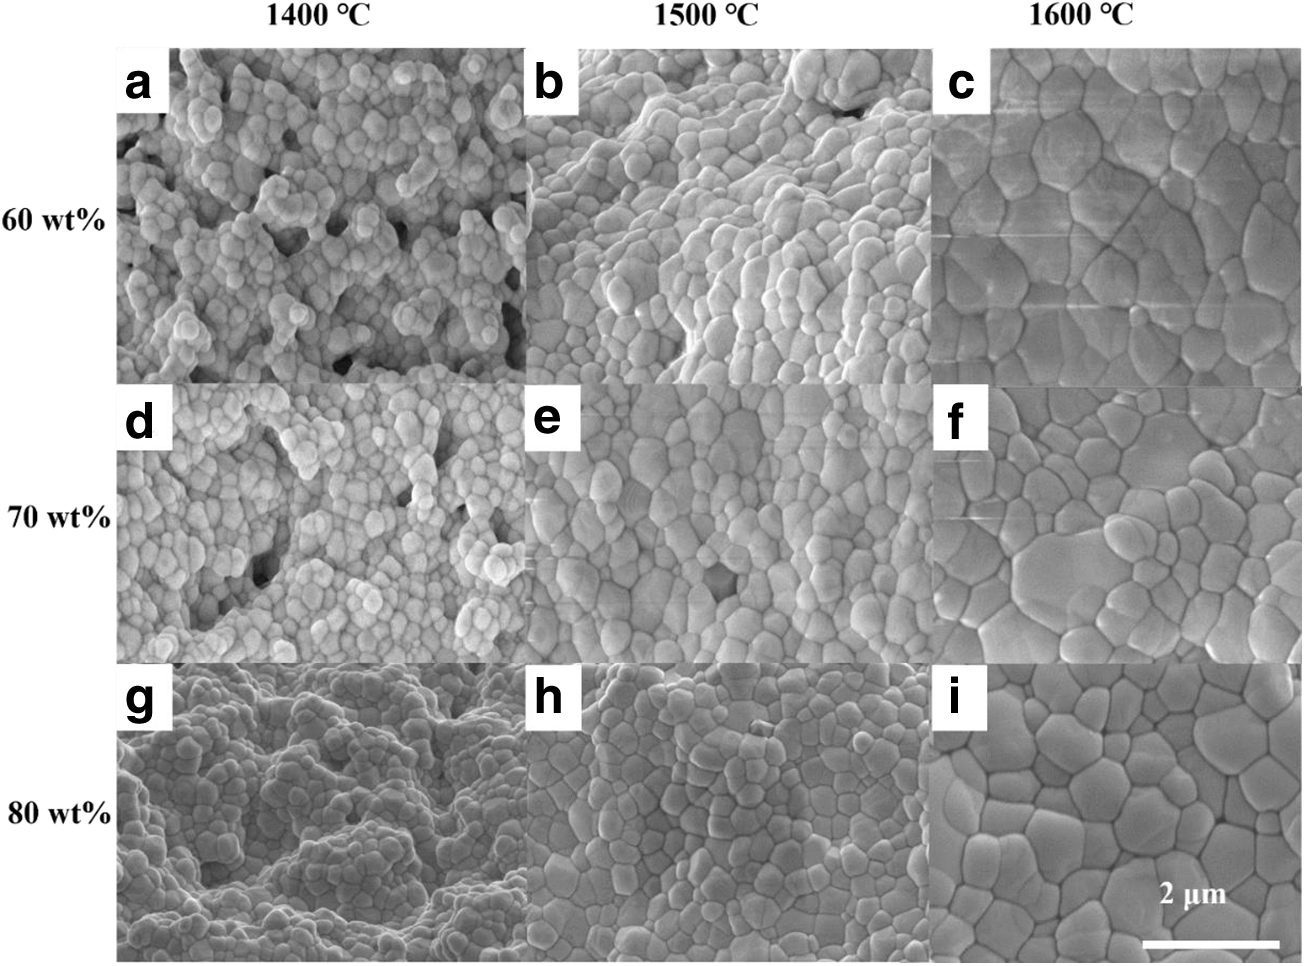
SEM images showing the as-sintered surface microstructure of DLP-printed zirconia ceramic dental crowns with various slurry solid contents.
When the sintering temperature increases to the optimal 1500°C, the microstructure is denser with micropores almost disappearing. When the slurry solid content increases to the optimal 80 wt%, the grains are more uniform with less overgrown ones. As shown in Figure 17, the average grain sizes are <0.8 μm, which is beneficial to the excellent physical properties. 36 Further increasing the sintering temperature will result in coarse grains and uneven grains. It can explain the decrease of the hardness and wear resistance of zirconia samples prepared by dry pressing process and sintered at 1600°C.

Histogram of the relationship between grain size and sintering temperature.
Conclusion
Highly dense and crack-free zirconia ceramic dental crowns can be successfully fabricated by DLP. Curing depth tends to increase with the increasing exposure density and decreasing solid content. The curing overgrowth exhibits the same trend. Solid content and sintering temperature have remarkable effects on physical properties and microstructures. Higher solid content and sintering temperature result in better structural integrity, higher relative density, fewer cracks, and denser microstructure. With elevating sintering temperature, shrinkage rate and grain size increase notably.
The optimized process parameters include slurry solid content of 80 wt%, exposure time of 7 s, exposure intensity of 16.5 mW/cm2, and sintering temperature of 1500°C. Relative density, compressive strength, Vickers hardness, fracture toughness, and wear resistance significantly increase with increasing solid content, reaching the best values of 99%, 677 MPa, 12.62 GPa, 6.3 MPa·m1/2, and 1.5 mg/min, respectively. DLP is promising for the fabrication of zirconia ceramic dental crowns.
Footnotes
Authors' Contributions
F.Z. contributed to writing—original draft, visualization, and experimental investigation. J.Y. designed conceptualization, visualization, writing—review and editing, supervision, and funding acquisition. X.J. assisted with conceptualization and visualization. Y.Z. performed 3D model creation, samples fabrication, data curation, and visualization. K.Z., H.G., S.Z., and H.C. conducted experimental investigation, data curation, and visualization. G.L. contributed to funding acquisition.
Author Disclosure Statement
No competing financial interests exist.
Funding Information
The authors are grateful to the National Natural Science Foundation of China (grant no. 51802048), the Medical leading talents of Xuzhou (XWRCHT20210035), the Xuzhou Plan of introducing a team of clinical medical experts (2019TD002), and Jiangsu Health Commission of Health (QNRC2016392, M2022048) for their financial support.