
Abstract
The microstructure, mechanical properties (tensile, fatigue, etc.) and the anisotropies of the Al-Mg alloy fabricated by wire arc additive manufacturing are studied in this work. The results show that the microstructure of the deposited alloy is composed of coarse columnar grains in the inner-layer region and fine equiaxed grains in the interlayer region. The tensile and fatigue properties exhibit strong anisotropies. The ultimate tensile strength (258 MPa), yield strength (140 MPa), elongation (21.3%), and fatigue life (2.56 × 10⁵) of the sample along travel direction (0° direction) are the best, whereas those of the sample along the deposited direction (90° direction) are the lowest and those of the sample along 45° direction are the medium. It is found that the lowest strength and elongation of the sample in the deposited direction can be attributed to the large weak bonding areas between the deposition layers, whereas the lowest fatigue property is associated with the fatigue crack propagation along the grain boundaries of the columnar grains.
Introduction
Al alloys are widely used in various industrial fields because of their high specific strength, high corrosion resistance, good weldability, good thermal conductivity, and many other advantages.1–3 With the increasing requirements for economy and efficiency in aerospace and other industries, it has become an inevitable trend to find new technologies to manufacture large-size parts of high-strength aluminum alloy.4,5
Compared with laser powder bed fusion,6,7 electron beam melting, 8 droplet deposition manufacturing, 9 and other additive manufacturing technologies, wire arc additive manufacturing (WAAM) has the advantages of fast deposition rate, high material utilization, relatively low production cost, and equipment cost in manufacturing large-scale metal components. It is a promising method of manufacturing large-scale components.10–12 Al-Mg alloy is very suitable for WAAM technology because of its good weldability. 13
In recent years, WAAM of aluminum alloy has attracted extensive attention.14–21 The main focus is on the following aspects: (1) The effect of the addition or loss of trace elements on the microstructure and properties. Yuan et al. 15 studied the loss of element Mg in Al-Mg alloy during WAAM, and they discussed the effect of Mg loss on the mechanical properties of the alloy.
Ponomareva et al. 16 studied the WAAM of Al-Mg alloy with scandium and zirconium, and they obtained samples with maximum yield strength of 268 MPa, ultimate tensile strength of 403 MPa, and elongation greater than 16%. (2) The relationship between microstructure evolution and mechanical properties. Qi et al. 18 studied the relationship between microstructure and mechanical properties of Al-Mg-Si alloy produced by WAAM. (3) The combination of cold working and WAAM to improve alloy properties.
Gu et al. 19 proved that the combination of rolling deformation and WAAM is an effective method to improve the microstructure and mechanical properties of aluminum alloy. (4) The influence of heat input on WAAM. Tawfik et al. 20 studied the influence of heat input on microstructure characteristics and tensile properties by changing travel speeds. Aldalur et al. 13 proposed a new metal conversion pulsed-alternating current mode, which is applied to aluminum, and studied the influence of heat input on microstructure and porosity.
As a revolutionary new technology different from the traditional manufacturing process,22–24 WAAM has broad prospects of development because of its various advantages that other manufacturing processes do not have. However, there are still some problems to be discussed and solved: difficulty in controlling the shape and boundary during the manufacturing process due to excessive heat input and heat accumulation, the complex distribution of workpiece temperature field leading to residual stress, a large number of defects such as pores, and anisotropy in the mechanical properties of the deposited alloy.
These problems seriously restrict the quality, dimensional accuracy, and mechanical properties of wire arc additive manufactured parts. Tawfik et al. 25 proved that low heat input and post-treatment can reduce residual stresses, deformation, and the number of micropores. Colegrove et al. 26 studied the method to improve the thermodynamic performance of multilayer straight wall structure in WAAM process, and they established the three-dimensional transient model and the stable thermal analysis model.
Su et al. 27 proved that samples with different deposition strategies exhibit similar phase compositions, but differ in deposited layer size, grain size, and phase size. Gu et al. 28 studied the effect of interlayer rolling load on the microstructure, porosity, and mechanical properties of wire arc additive manufactured 2219 aluminum alloy, and they found that the use of 45 KN interlayer rolling load can effectively inhibit porosity defects and improve elongation.
Many researchers have studied the process route and forming system of WAAM, optimized the efficiency of WAAM, reduced the residual stress and internal defects of deposited alloy, and improved all aspects of properties of the alloy produced by WAAM. But the anisotropy of mechanical properties and the causes of anisotropy are less studied.
This study focuses on the tensile and fatigue properties and their anisotropies in Al-Mg alloy produced by WAAM, and it explores the causes for the anisotropy of tensile and fatigue properties of the alloy. Combined with the microstructure of the alloy, the relationship between the microstructure evolution and the anisotropy of mechanical properties was studied by characterizing the tensile and fatigue fracture of the alloy and analyzing the fatigue crack propagation behavior of the alloy.
Materials and Methods
Al-Mg alloy welding wire was used to conduct the wire-arc additive manufacturing process, and the chemical compositions of the welding wire are shown in Table 1. The fabricated part is a rectangular annular component with the dimensions of 180 mm length, 80 mm width, 120 mm height, and 15 mm thickness. The specific additive manufacturing process is as follows: welding current is 160 A, wire feeding speed is 8 m/min, and scanning speed is 1.8 m/min. The sampling positions and directions of the samples for microstructure analysis, tensile test, and fatigue crack propagation test are shown in Figure 1.
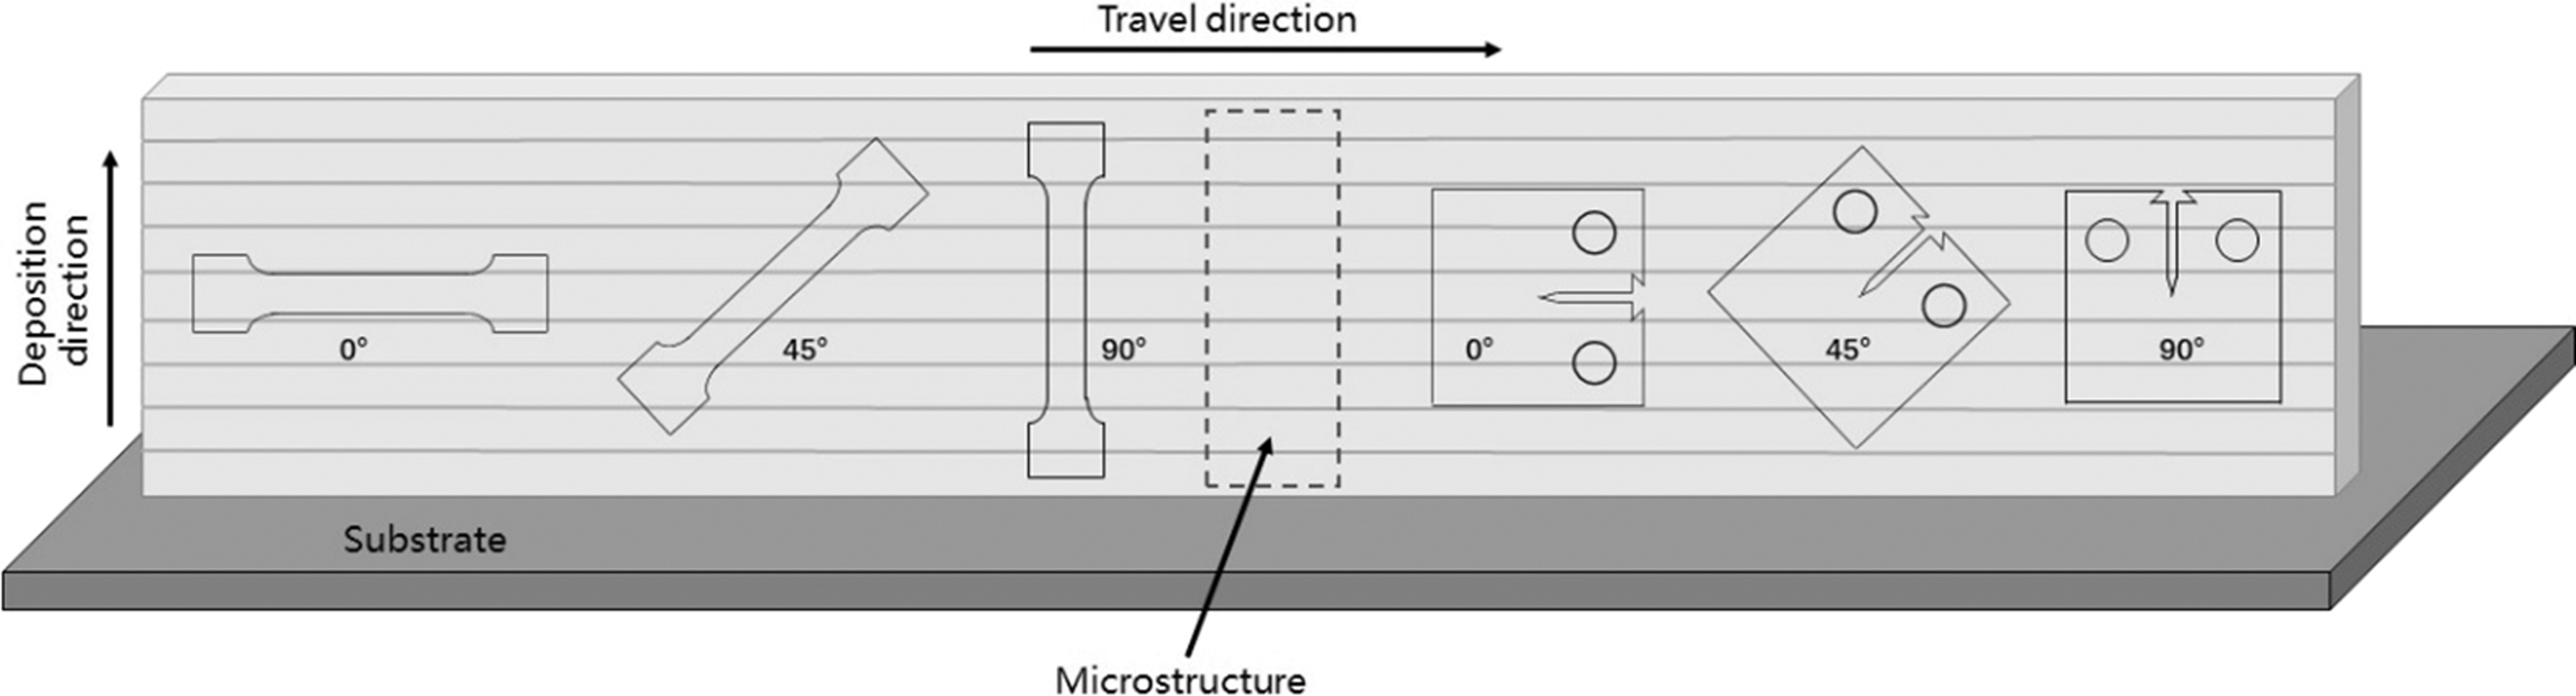
Diagram for sampling location of the deposited Al-Mg alloy.
The Chemical Compositions of the Al-Mg Alloy Welding Wire (wt.%)
Metallographic samples were prepared by standard mechanical polishing method and observed by ZEISS Axioskop. Electron backscattered diffraction (EBSD) images were taken by ZEISS ∑IGMA field emission scanning electron microscope (SEM) equipped with EBSD system, and the scanning steps are set to be 15 μm at 20 kV. Tensile samples in different directions were prepared according to ISO 6892-1: 2009.
After mechanical polishing, the tensile tests were carried out on UTM5000 testing machine. The loading speed of tensile tests was 1 mm/min. Samples were taken in the 0°, 45°, and 90° directions of the alloy, respectively. The tensile fracture was observed by XL30ESEM, PHILIPS SEM. Fatigue crack propagation samples in different directions are prepared according to ASTM E467 standard. After mechanical polishing, fatigue crack propagation test is conducted on MTS-810 testing machine.
The load ratio r is 0.1 and the frequency is 10 Hz. The fatigue crack propagation rates of alloy in 0°, 45° and 90° directions are tested. The fatigue fracture is observed by XL30ESEM, PHILIPS SEM. The characteristics of fatigue crack propagation behavior are studied.
Results
Microstructure
Figure 2a shows the OM microstructure of the deposited Al-Mg alloy. The microstructure of the sample has obvious layered structure characteristics. There are columnar grains in the inner-layer region, and the growth direction of these columnar grains is parallel to the deposition direction. The inter-layer region is composed of fine equiaxed grains.
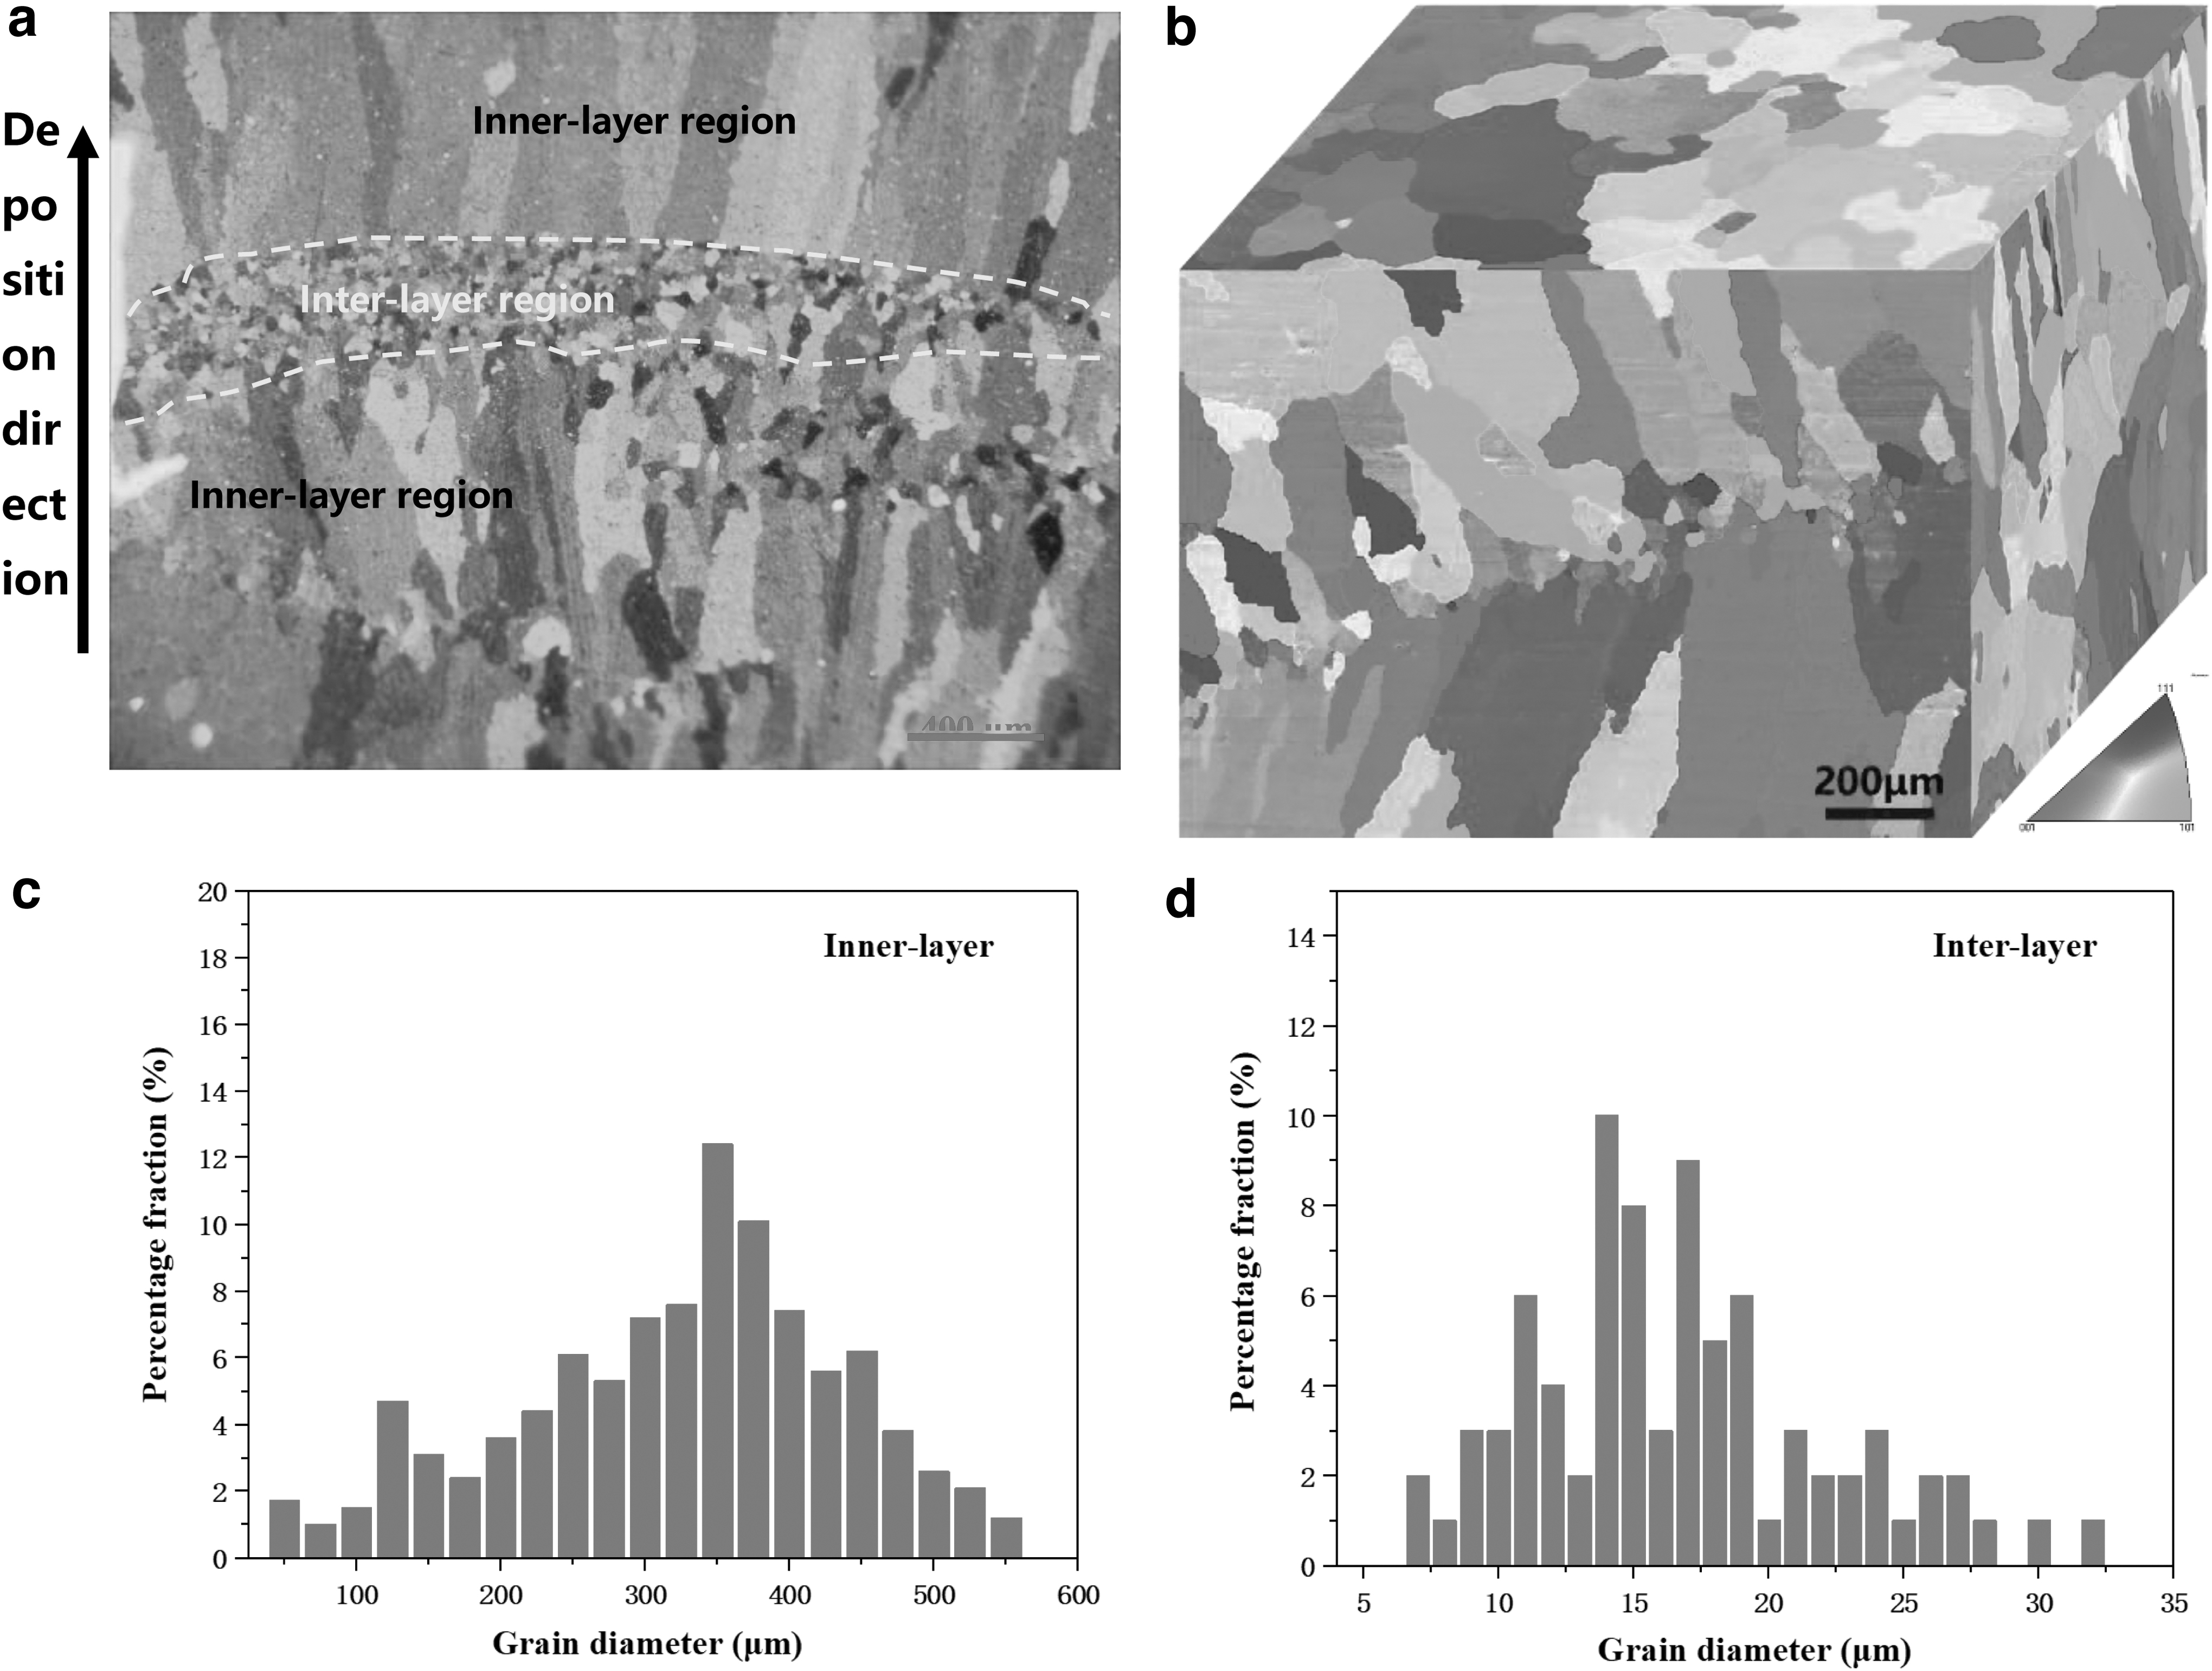
Microstructure and grain size distributions of WAAMed Al-Mg alloy:
Figure 2b shows the EBSD image of the deposited Al-Mg alloy. The columnar grains are clearly parallel to the deposition direction in the inner-layer region, and the fine equiaxed grains in the inter-layer region can also be observed. Figure 2c and d show the grain sizes distribution of the inner-layer region and the inter-layer region. The average grain size in the inner-layer region is 327.4 μm, and the average grain sizes in the inter-layer region is 16.6 μm.
The formation of columnar grains is related to the heat dissipation of the deposited alloy. 29 During the alloy deposition process, the heat flow in the layer mainly flows to the substrate direction. At the initial stage of solidification, the grains will grow preferentially along the heat flow direction, and the grain growth rate inconsistent with the heat flow direction is slow, resulting in the formation of columnar grain structures perpendicular to the inter-layer region.
The formation of equiaxed grains is due to the effect of rear layer remelting on the front layer during the deposition of the alloy, which makes it located at the bottom of the molten pool. The actual temperature of the liquid metal in this area is lower than the liquidus temperature, 30 which will produce a great undercooling, and the unmelted part at the bottom of the molten pool will strongly promote the heterogeneous nucleation, so a large number of fine equiaxed grains will be formed.
Tensile properties
The stress-strain curves of the samples along the directions of 0°, 45°, and 90° are shown in Figure 3. The corresponding results of the mechanical properties are shown in Table 2. The results show that the tensile strength, yield strength, and the elongation of the sample along 0° direction are 258 MPa, 141 MPa, and 21.3%, respectively. The tensile strength, yield strength, and elongation of the sample along 45° direction are 231 MPa, 137 MPa, and 13.9%, respectively.
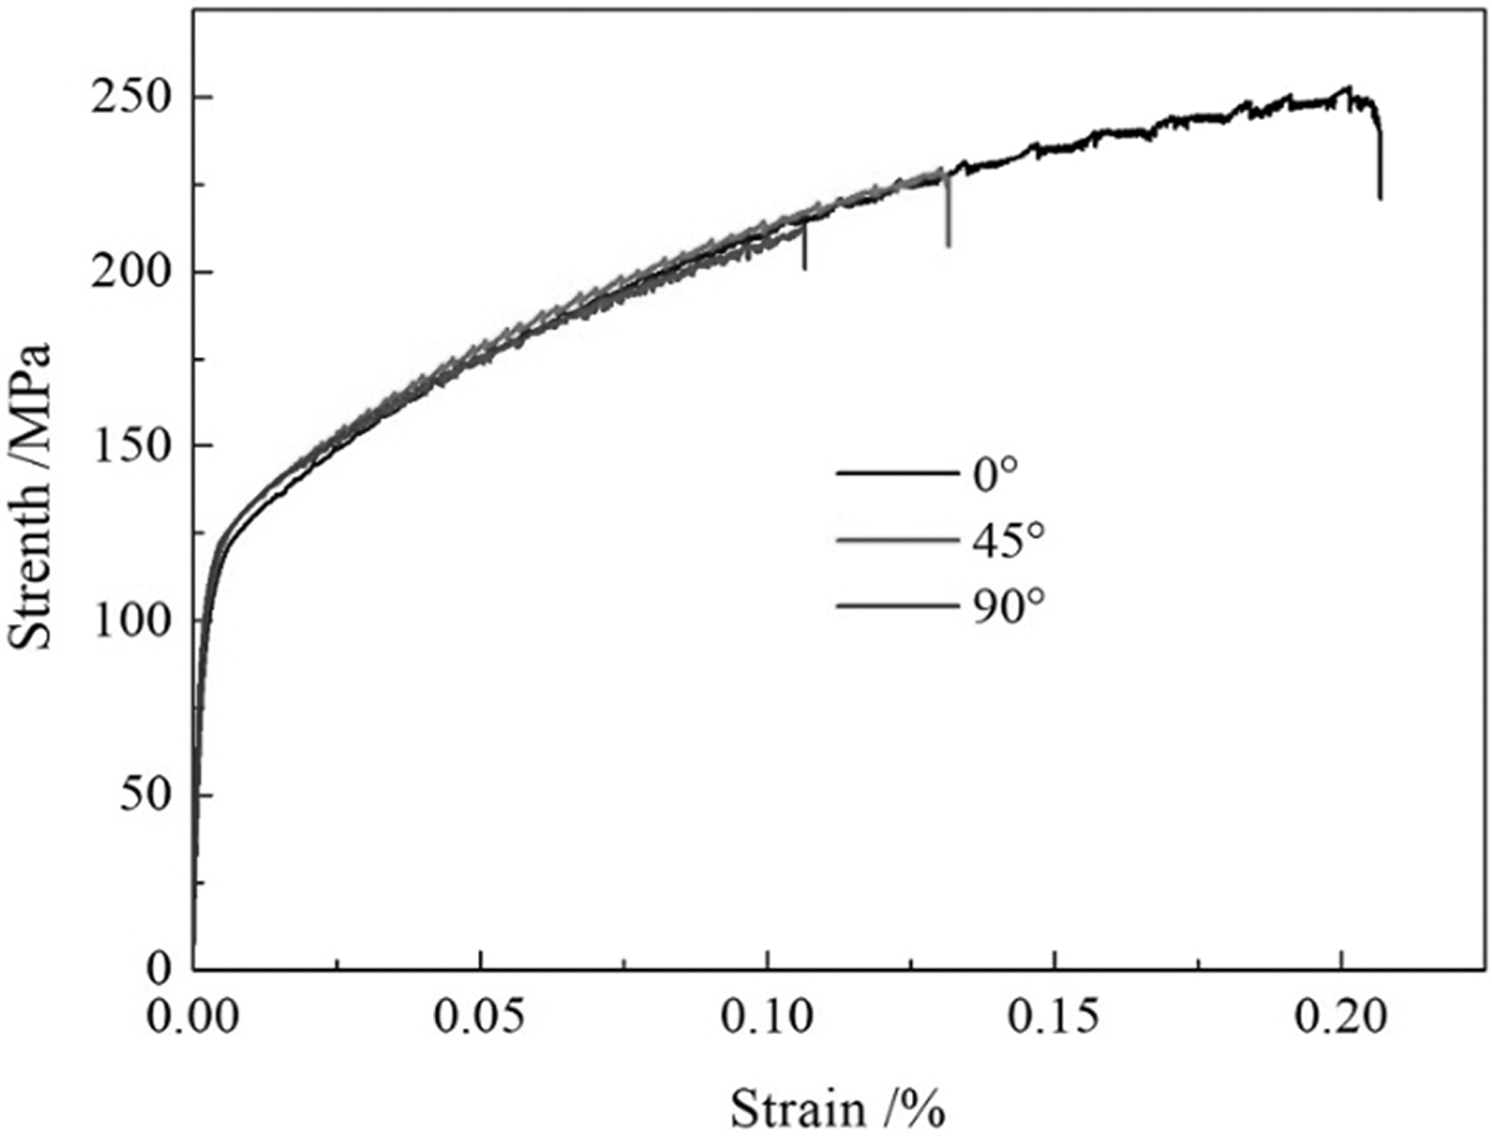
Stress-strain curves of the WAAMed Al-Mg alloy along different sampling directions.
Mechanical Properties of the WAAMed Al-Mg Alloy Along Different Sampling Directions
WAAM, wire arc additive manufacturing.
The tensile strength, yield strength, and elongation of the sample along 90° direction are 219 MPa, 131 MPa, and 10.8%, respectively. It can be found that the mechanical properties of the alloy significantly varied in different directions, which implies that the anisotropy of the mechanical properties is significant. The tensile properties of the alloy in the direction of 0° are the best, and the tensile properties of the alloy in the direction of 45° and 90° are relatively poor.
The tensile strength of the sample along 0° direction is 11.7% and 17.8% higher than those of the samples along 45° and 90° directions, respectively. The elongation of the sample along 0° direction is 1.5 times and 2 times than those of the samples along 45° and 90° directions, respectively. The difference in elongation is more significant than that in strength.
Fatigue crack propagation behavior
Figure 4 shows the macromorphology images of fatigue crack samples along different directions. For the sample in the 0° direction (Fig. 4a), the fatigue crack propagation direction is completely parallel to the notch direction, and the crack is relatively smooth and flat. For the sample in the 45° direction (Fig. 4b), the fatigue crack propagation direction deviates significantly from the notch direction and moves to the oblique cutting direction.
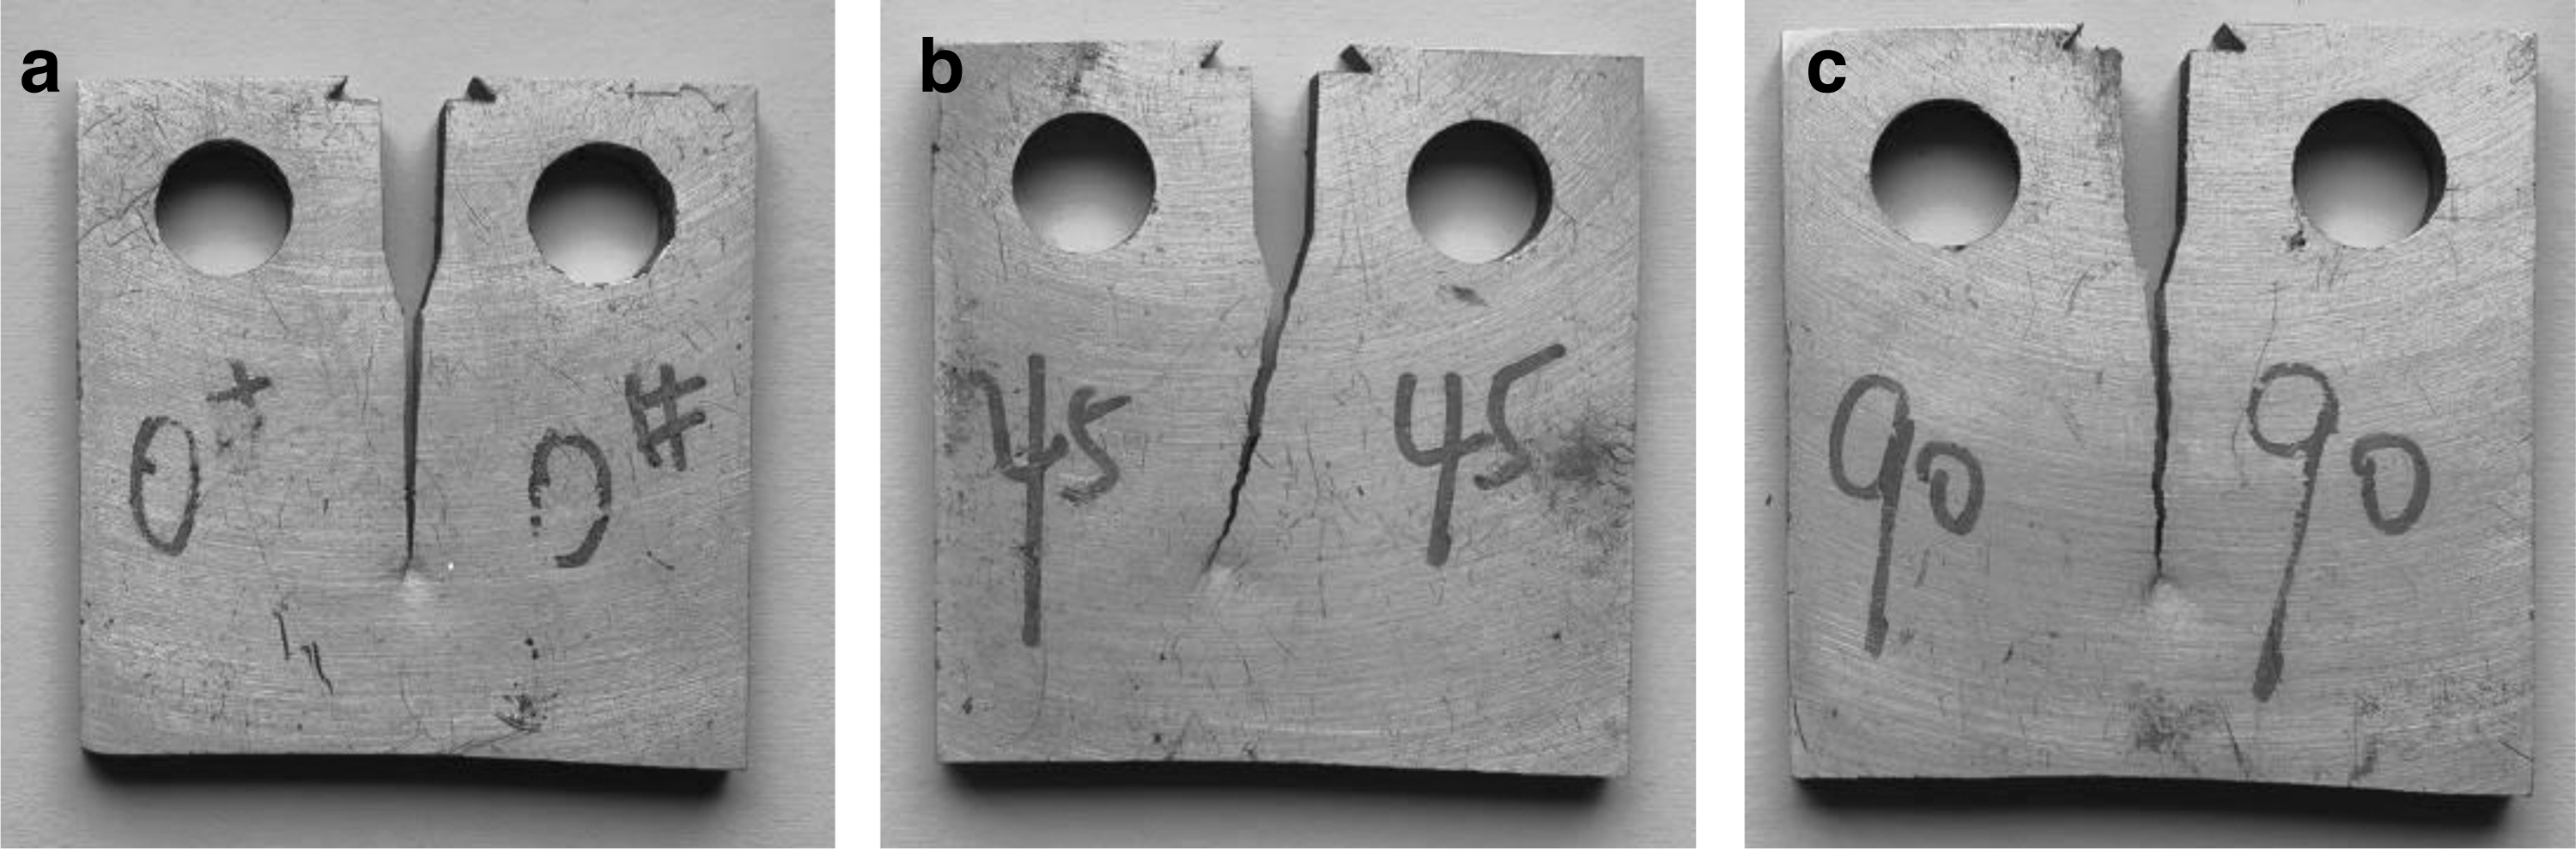
Macro morphology images of the samples along different sampling directions:
For the sample in the 90° direction (Fig. 4c), the fatigue crack propagation direction is basically parallel to the notch direction, but a slight fluctuation in the crack propagation path can be observed. According to the macrocrack propagation trend of the alloy, the crack propagation evolution will be discussed later combined with the microstructure of the deposited alloy.
Figure 5a shows the a-N curves of fatigue crack propagation along different directions. With the increase of N (cycle times), a (fatigue crack length) gradually increases, and the fatigue crack propagation rate (slope) also increases. The fatigue crack propagation trends of samples along different directions are basically the same. It can be observed that the curve corresponding to the sample along 0° direction is always below the curves of the other two samples.

Fatigue crack propagation results of the samples along different sampling directions:
This means that the fatigue crack propagation rate of the sample along 0° direction is significantly slower than the other two samples along 45° and 90° directions. The fatigue crack propagation of the sample along 0° direction is hindered the most, and the fatigue performance is the best. In terms of fatigue life, the maximum fatigue cycles of the sample along 0° direction are 256,405, which is significantly higher than those of the samples along 45° direction (235,046) and 90° direction (221,230).
Figure 5b shows the da/dN-ΔK curve of the samples along different directions obtained by fatigue crack propagation experiments. It can be observed that with the increase of stress intensity factor, the fatigue crack propagation rate also increases gradually, and the fatigue crack propagation rate of the sample along 0° direction is significantly lower than those of the sample along the other two directions. This shows that the fatigue performance of the samples along 0° direction is better than those of the samples along the other directions. The da/dN − ΔK curves of fatigue crack propagation rates of the samples along different sampling directions could be described by Paris model
31
:
C and m are the fitting parameters related to different sampling directions. Table 3 summarized the fitting parameters and fatigue threshold value ΔKth (estimated by ΔK when the crack propagation rate is 10−7 mm/cycle). As can be seen, the calculated results were in good agreement with the experimental data, and the correlation coefficient reached 0.94 or higher.
Fitting Results by Paris Model
It can be seen from Table 3 that the ΔKth of the alloy varies in different directions. There is little difference in ΔKth between the samples along 45° and 90° directions, and the values of ΔKth are 1.72 and 1.63 MPa·m1/2, respectively. The ΔKth of the sample along 0° direction is 2.98 MPa·m1/2, which is 73.2% higher than that of the sample along 45° direction and 82.8% higher than that of the sample along 90° direction.
For the hindrance of fatigue crack propagation, that of the sample along 0° direction is significantly greater than those of the other two samples. Figure 5b shows that the curves of the sample along 45° and 90° directions are basically the same. The cracks begin to expand almost at the same time, and the propagation rates are similar. When the crack in the sample along 0° direction begins to expand, ΔK is large and the propagation rate is low. It proves that the fatigue performance of the alloy is the best in this direction, which is consistent with the result in Figure 5a.
Fatigue fracture morphology
The process of fatigue crack propagation can be divided into three stages, denoted as: low-speed propagation zone (I), stable propagation zone (II), and rapid propagation zone (III). Since the crack growth experiment mainly consists of the first and second stages, the rapid growth stage can be ignored when analyzing the fatigue fracture pattern. 32 In the first stage, the driving force of crack propagation is small, the rate of crack propagation is low, and the crack propagation near the threshold is discontinuous.
In the second stage, the driving force of crack growth increases, and the fatigue crack continues to expand in a steady state. 33 The phenomenon of fatigue striation can be observed in the ductile material, which is the most important characteristic zone of the fatigue fracture occupying a large part of the fracture. Therefore, we mainly study the stable crack growth zone. Figure 6 shows the fatigue fracture morphology of the stable crack propagation zone of samples along different sampling directions.

Fatigue fracture morphology of the stable crack propagation area of specimens in different directions:
It shows a layered structure, and high or low fluctuation fracture surfaces can be observed. Due to the deviation of grain boundary orientation, the fatigue crack propagation is hindered, and a large number of fatigue steps are formed on the fracture surface. The secondary cracks and fatigue striations are also shown in Figure 6a. The secondary cracks inhibit the crack propagation rate by reducing the energy at the crack tip. 34
From Figure 6a, c, and e, the roughness of the fracture surface and the number of secondary cracks in different sampling directions can be observed. The fracture surface in the 0° direction is rough, and the number of secondary cracks is the largest. Laird's 35 crack continuous passivation and sharpening model can explain that the fatigue striations are perpendicular to the local crack propagation direction, but the striations of different grains are not continuous or parallel.
Many fatigue steps were formed on the fracture surface because the misorientation of grain boundaries hindered the propagation of fatigue cracks. 34 Figure 6b, d, and f show the fatigue striation morphology of the samples in the directions of 0°, 45°, and 90°, respectively, and the corresponding fatigue striation width is 0.17, 0.39, and 0.57 μm; the width of fatigue striation varies greatly with the change of sampling direction. Each fatigue striation is the propagation trace of a stress cycle, and the smaller is the width of the fatigue striation, the shorter is the crack propagation distance, the slower the crack propagation rate is in the fatigue stress cycle, and the larger is the fatigue crack propagation resistance.
It can be seen that the width of fatigue striation in the 0° direction is significantly lower than those in the other two directions, which indicates that the fatigue crack propagation resistance of the alloy is the largest in the 0° direction. In 0° direction, the alloy shows the best fatigue performance, which is also consistent with the analysis results in Figure 5.
Discussion
Anisotropy of the mechanical properties
As shown in Figure 3 and Table 2, the deposited alloy samples in different directions show significant anisotropy of mechanical properties. Meanwhile, the stress-strain curves (Fig. 3) also suggest that the difference of the strength of the samples along different directions is mainly originated from the plasticity or elongation of the alloy, because the basic trends of the stress-strain curves of the samples in the three directions are almost the same.
In this case, the strength of the alloy samples is determined by their elongation. Therefore, it is necessary to analyze the fracture of different samples from their fracture morphologies, as shown in Figure 7. Figure 7a shows the fracture morphology of the sample along 0° direction. It indicates that there are large numbers of dimples, which are the characteristics of typical ductile fracture. Figure 7b and c show the fracture morphology of the sample along 45° direction and 90° direction, respectively.
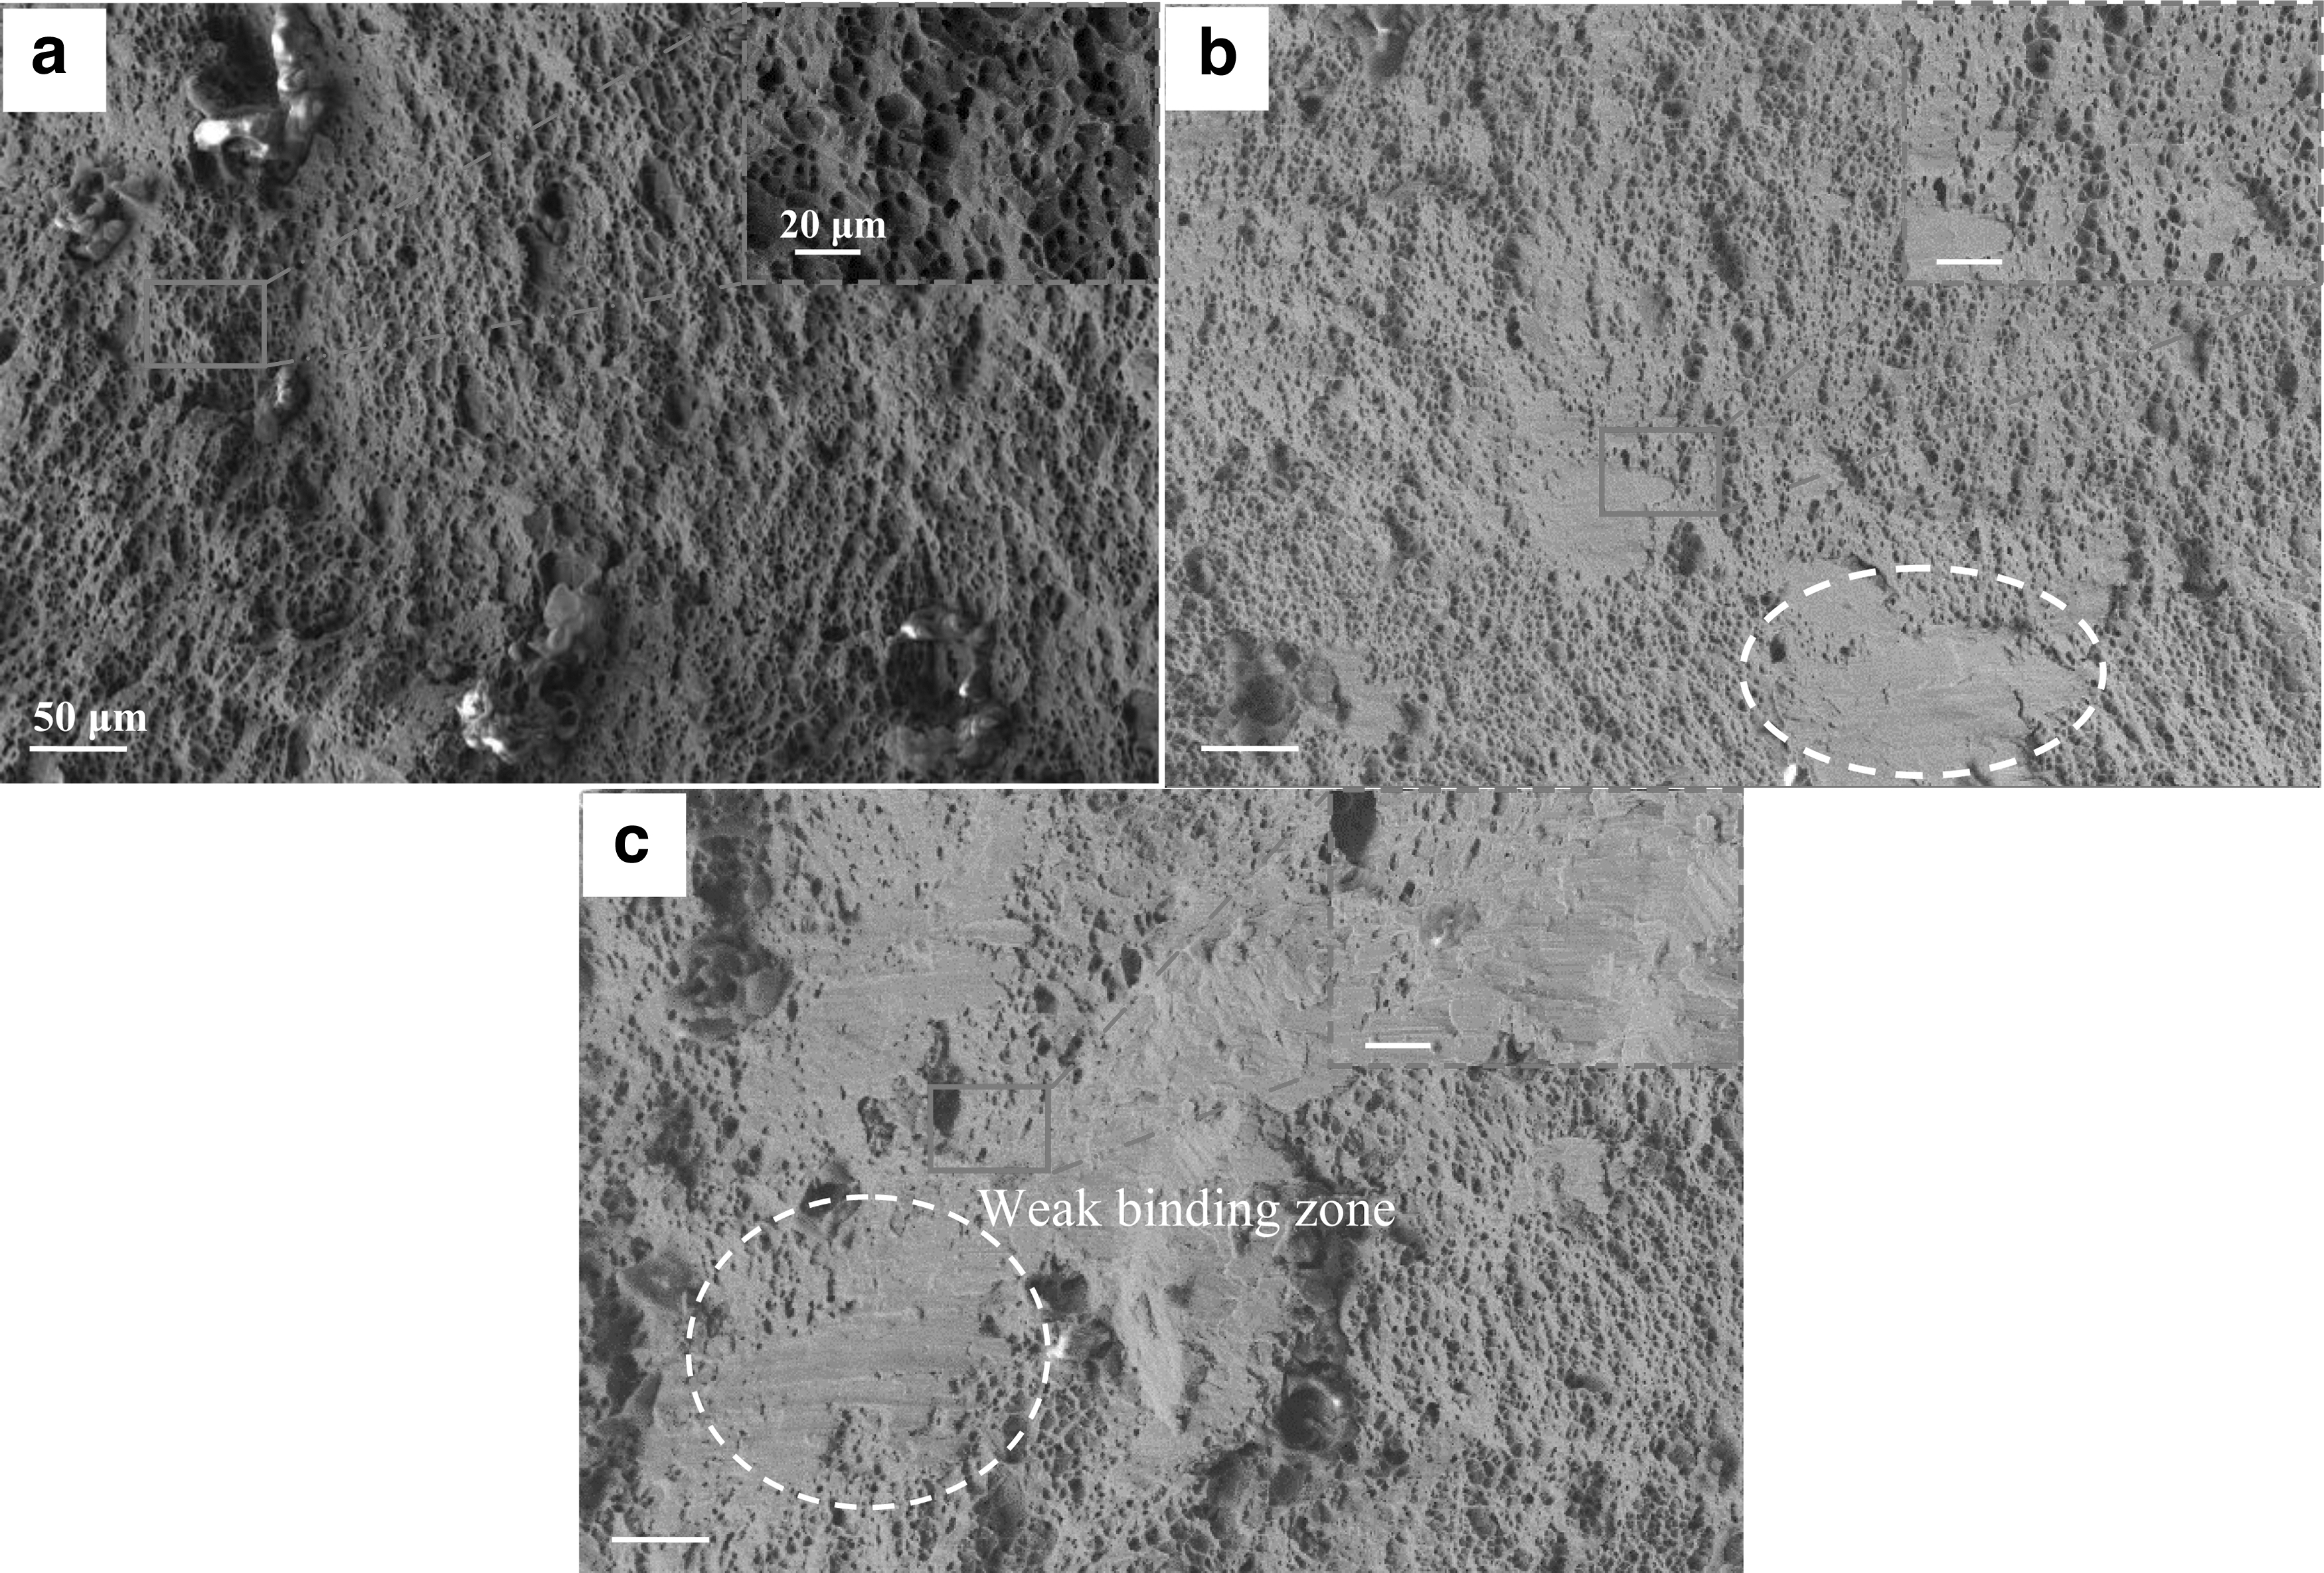
SEM morphology of tensile fracture of the fabricated Al-Mg alloy along different directions:
The tensile fractures have a large area of smooth and flat platform morphology, which is manifested as a weak bonding zone with poor interface adhesion due to the poor interface adhesion between the deposited layers. The weak bonding zone is more significant for the sample along 90° direction. Under the effect of tensile load, the weak bonding zone will become the fracture source of tensile cracking, which seriously affects the mechanical properties of the alloy and leads to fracture failure.
As a result, the tensile strength and elongation of the alloy in the 90° direction are seriously weakened compared with those in the 0° direction, and the tensile strength is reduced by 15.2% whereas the elongation is reduced by 49.3%. The tensile mechanical properties of the alloy show significant anisotropy.
Anisotropy of fatigue crack propagation behavior
The experimental results (Fig. 5) indicate that the samples in different directions show significant anisotropy in the fatigue crack propagation behavior, and the fatigue performance of the sample in 0° direction is the best. According to the fatigue crack closure effect, crack closure is one of the shielding mechanisms that is peculiar to the fatigue crack growth process, and it plays a positive role in fracture retardation.
The crack closure theory deems that a crack can grow only when the applied load is greater than the fatigue crack opening and closing loads 36 ; when the fatigue crack growth driving force is less than the threshold ΔKth, the crack tip will close and cannot expand. The larger the threshold is, the stronger the crack propagation resistance is. The results show that the ΔKth in 0° direction is the highest. The obstacle effect of high-density grain boundaries is the main factor causing the high threshold.
The microstructure of Figure 2 shows that there are a large number of columnar grains in the deposited alloy, which proves that the fatigue crack propagating in the direction of 0° will face a large number of grain boundaries perpendicular to its propagation direction, and the grain boundary is the main factor hindering the propagation of fatigue crack. 37 In the stage of fatigue crack propagation, the fatigue crack will tend to expand along the grain boundary, whereas the grain boundary perpendicular to the propagation direction will seriously deflect the crack, making the fracture surface more rough, resulting in a higher degree of mismatch between the crack surfaces.
During unloading, the mismatch of crack surfaces will promote the early contact between crack surfaces, especially near the crack tip. This will reduce the effective driving force of crack propagation and eventually result in the crack closure effect induced by roughness.38,39 Previous studies have also shown that a large number of secondary cracks caused by crack tip deflection appear on the fatigue fracture surface in the 0° direction, which increases the crack closure intensity factor and reduces the driving force of crack propagation, resulting in a low crack propagation rate.
Figure 8 shows the influence of sampling direction on the fatigue crack propagation path, showing the microstructure distribution and crack propagation path of the alloy in different directions. The circular structure represents the equiaxed grain in the inter-layer region, whereas the long strip structure represents the columnar grain in the inner-layer region. Figure 8a illustrates the fatigue crack propagation trend of the sample in the 0° direction.
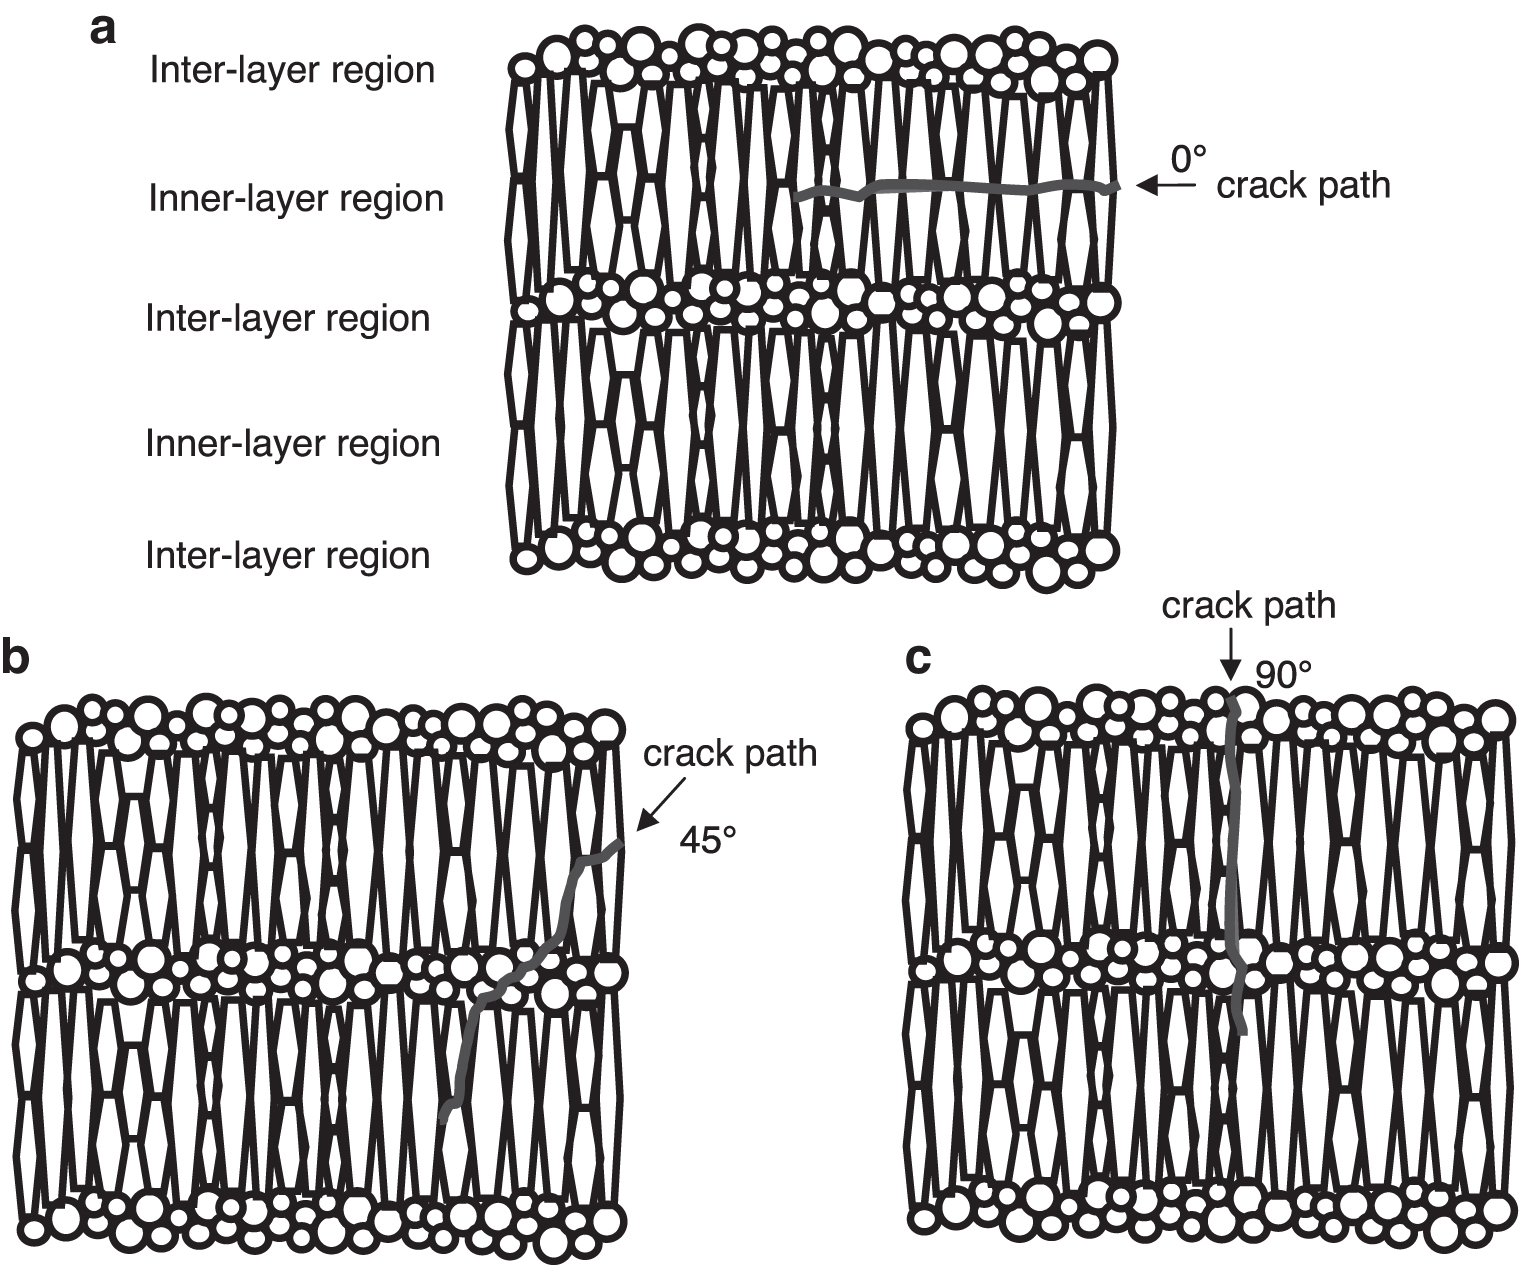
Illustration for the influence of sampling direction on fatigue crack propagation path:
In this direction, the crack propagation path is perpendicular to columnar grain structures in the alloy and is hindered by its high-density grain boundaries. If the crack tends to expand, it must overcome the obstruction of grain boundary and cross the grain boundary. Its fatigue crack propagation mechanism is transgranular propagation. Figure 8b illustrates the fatigue crack propagation trend of the sample in the 45° direction. In this direction, the crack propagation path is obliquely tangent to columnar grain structures in the alloy.
Under the traction of grain boundary, the crack propagation direction shifts longitudinally. Its fatigue crack propagation mechanism is mainly intergranular propagation. Figure 8c illustrates the fatigue crack propagation trend of the sample in the 90° direction. In this direction, the crack propagation path is parallel to columnar grain structures in the alloy. Under the traction of grain boundary, the crack basically propagates along the grain boundary. Its fatigue crack propagation mechanism is intergranular propagation.
Conclusions
The present work studied the microstructure, tensile properties, fatigue crack propagation behavior, and the changes of tensile properties and fatigue properties in different directions of an Al-Mg alloy fabricated by WAAM. The main conclusions are summarized as follows:
The tensile properties of the fabricated alloy exhibit strong anisotropies. The tensile properties in the 0° direction of the alloy are the best, and those in the 90° direction are the worst. The tensile strength reaches 258 MPa and the elongation is 21.3% in the 0° direction, whereas the tensile strength and elongation are 219 MPa and 10.8% in the 90° direction, respectively. The large weak bonding areas between the deposition layers are considered as the main reason of the worst tensile property in the 90° direction. The fatigue crack propagation behavior of the fabricated alloy also exhibits strong anisotropies. The maximum fatigue cycles and the fatigue threshold ΔKth of the sample along 0° direction (2.56 × 10⁵ and 2.98 MPa·m1/2, respectively) are significantly higher than those of the samples along 45° direction (2.35 × 10⁵ and 1.72 MPa·m1/2, respectively) and 90° direction (2.21 × 10⁵ and 1.63 MPa·m1/2, respectively). The difference for the fatigue crack propagation of the samples along different directions is closely related to the columnar grain microstructure of the fabricated alloy. The fatigue crack growth direction of the 0° sample is perpendicular to the columnar grain boundaries of the fabricated alloy, and the crack propagation is more likely to be blocked and deflected. On the other hand, the fatigue crack growth direction of the 90° sample is parallel to the columnar grain boundary of the fabricated alloy, and the crack propagates more easily along the columnar grain boundary.
Data Availability Statement
The raw/processed data required to reproduce these findings cannot be shared at this time as the data also form part of an ongoing study.
Footnotes
Authors' Contributions
Z.Z.: Writing—review and editing, writing—original draft, formal analysis, investigation, methodology, data curation, resources, and visualization. J.C.: Conceptualization, funding acquisition, methodology, project administration, supervision, review and editing. J.R.: Formal analysis, review and editing. J.M.: Software, methodology. T.X.: Formal analysis, investigation, and data curation. S.Z.: Investigation, methodology, and visualization. R.G.: Conceptualization, supervision.
Author Disclosure Statement
No competing financial interests exist.
Funding Information
The authors are grateful for the financial support from the Natural Science Foundation of Jiangxi Province of China (Grant No. 20212BAB204022, 20213BCJL22042, and 20202ACBL214002), National Natural Science Foundation of China (Grant No. 51961013), and Program of Qingjiang Excellent Young Talents of Jiangxi University of Science and Technology (Grant No. JXUSTQJYX2020022).