
Abstract
Due to its inbuilt ability to release biocompatible materials encapsulating living cells in a predefined location, 3D bioprinting is a promising technique for regenerating patient-specific tissues and organs. Among various 3D bioprinting techniques, extrusion-based 3D bioprinting ensures a higher percentage of cell release, ensuring suitable external and internal scaffold architectures. Scaffold architecture is mainly defined by filament geometry and width. A systematic selection of a set of process parameters, such as nozzle diameter, print speed, print distance, extrusion pressure, and material viscosity, can control the filament geometry and width, eventually confirming the user-defined scaffold porosity. For example, carefully selecting two sets of process parameters can result in a similar filament width (FW). However, the lack of availability of sufficient analytical relationships between printing process parameters and FW creates a barrier to achieving defined scaffold architectures with available resources. In this article, the factorial design of experiment (DoE) method has been adopted to obtain a relationship among scaffold properties that is, FW with 3D printing process parameters. The FW was determined using an image processing technique and an analytical relationship was developed, including various process parameters to maintain defined FW variation for different hydrogels within an acceptable range to confirm the overall geometric fidelity of the scaffold. The validation experiment results showed that our analytical relationship obtained from the DoE effectively predicts the scaffold's architectural property. Furthermore, the proposed analytical relationships can help achieve defined scaffold architectures with available resources.
Introduction
Bioprinting is a developing technology that creates 3D tissue scaffolds for tissue engineering using a computer-controlled 3D printing process. There are several types of bioprinting techniques, including inkjet, extrusion based, and laser assisted.1,2 Extrusion-based bioprinting is especially versatile and can deposit a wide range of substances, including various types of bioink.3,4 By adjusting the printing parameter, both acellular bioink5,6 and cell-laden bioink7–9 have been extruded to form scaffold structures, and good cell survival (>80%) and density10,11 are accomplished with this very simple technology.
The biomaterial chosen and its rheological and mechanical properties have a direct impact on the functionality of scaffolds made with the 3D bioprinting process.12–14 To simulate the in vivo microenvironment and promote tissue formation, it is important to construct scaffolds with controlled pore size, porosity, and connectivity.15–17 Studies have shown that variations in pore size and geometry affect cell behavior within the scaffold structure. 18 However, the extrusion-based bioprinting approach often results in a large discrepancy between the design and manufactured item due to both material and process properties. 19 This makes it challenging to achieve shape fidelity, biocompatibility, and mechanical integrity within the scaffold structure. Researchers are currently investigating the best biomaterials for producing 3D controlled porous structures using additive manufacturing (bio-AM).
Natural hydrogels such as alginate, gelatin, chitosan, collagen, and fibrin, as well as synthetic polymers such as polycaprolactone (PCL), polyethylene glycol (PEG), and polylactic acid (PLA), are commonly used in the construction of scaffolds using 3D bioprinting techniques. 20 Alginate is a popular choice due to its biocompatibility and ease of use. 21 However, achieving the desired shape fidelity and porosity of 3D printed scaffolds depends largely on the appropriate selection of material components and composition, while the selection of process parameters is often overlooked.22–24 This can result in difficulties printing defined scaffold architecture due to the lack of suitable process parameters available, such as air pressure, 3D bioprinter capabilities, and nozzle size.
A schematic illustration of print parameters (PPs) such as nozzle diameter (ND), print speed (PS: speed of moving printer head), print distance (PD: distance between the nozzle tip and print bed), extrusion pressure (EP: applied pressure to release material from the nozzle), and layer height (LH: height of a filament after extrusion) is shown in Figure 1a.
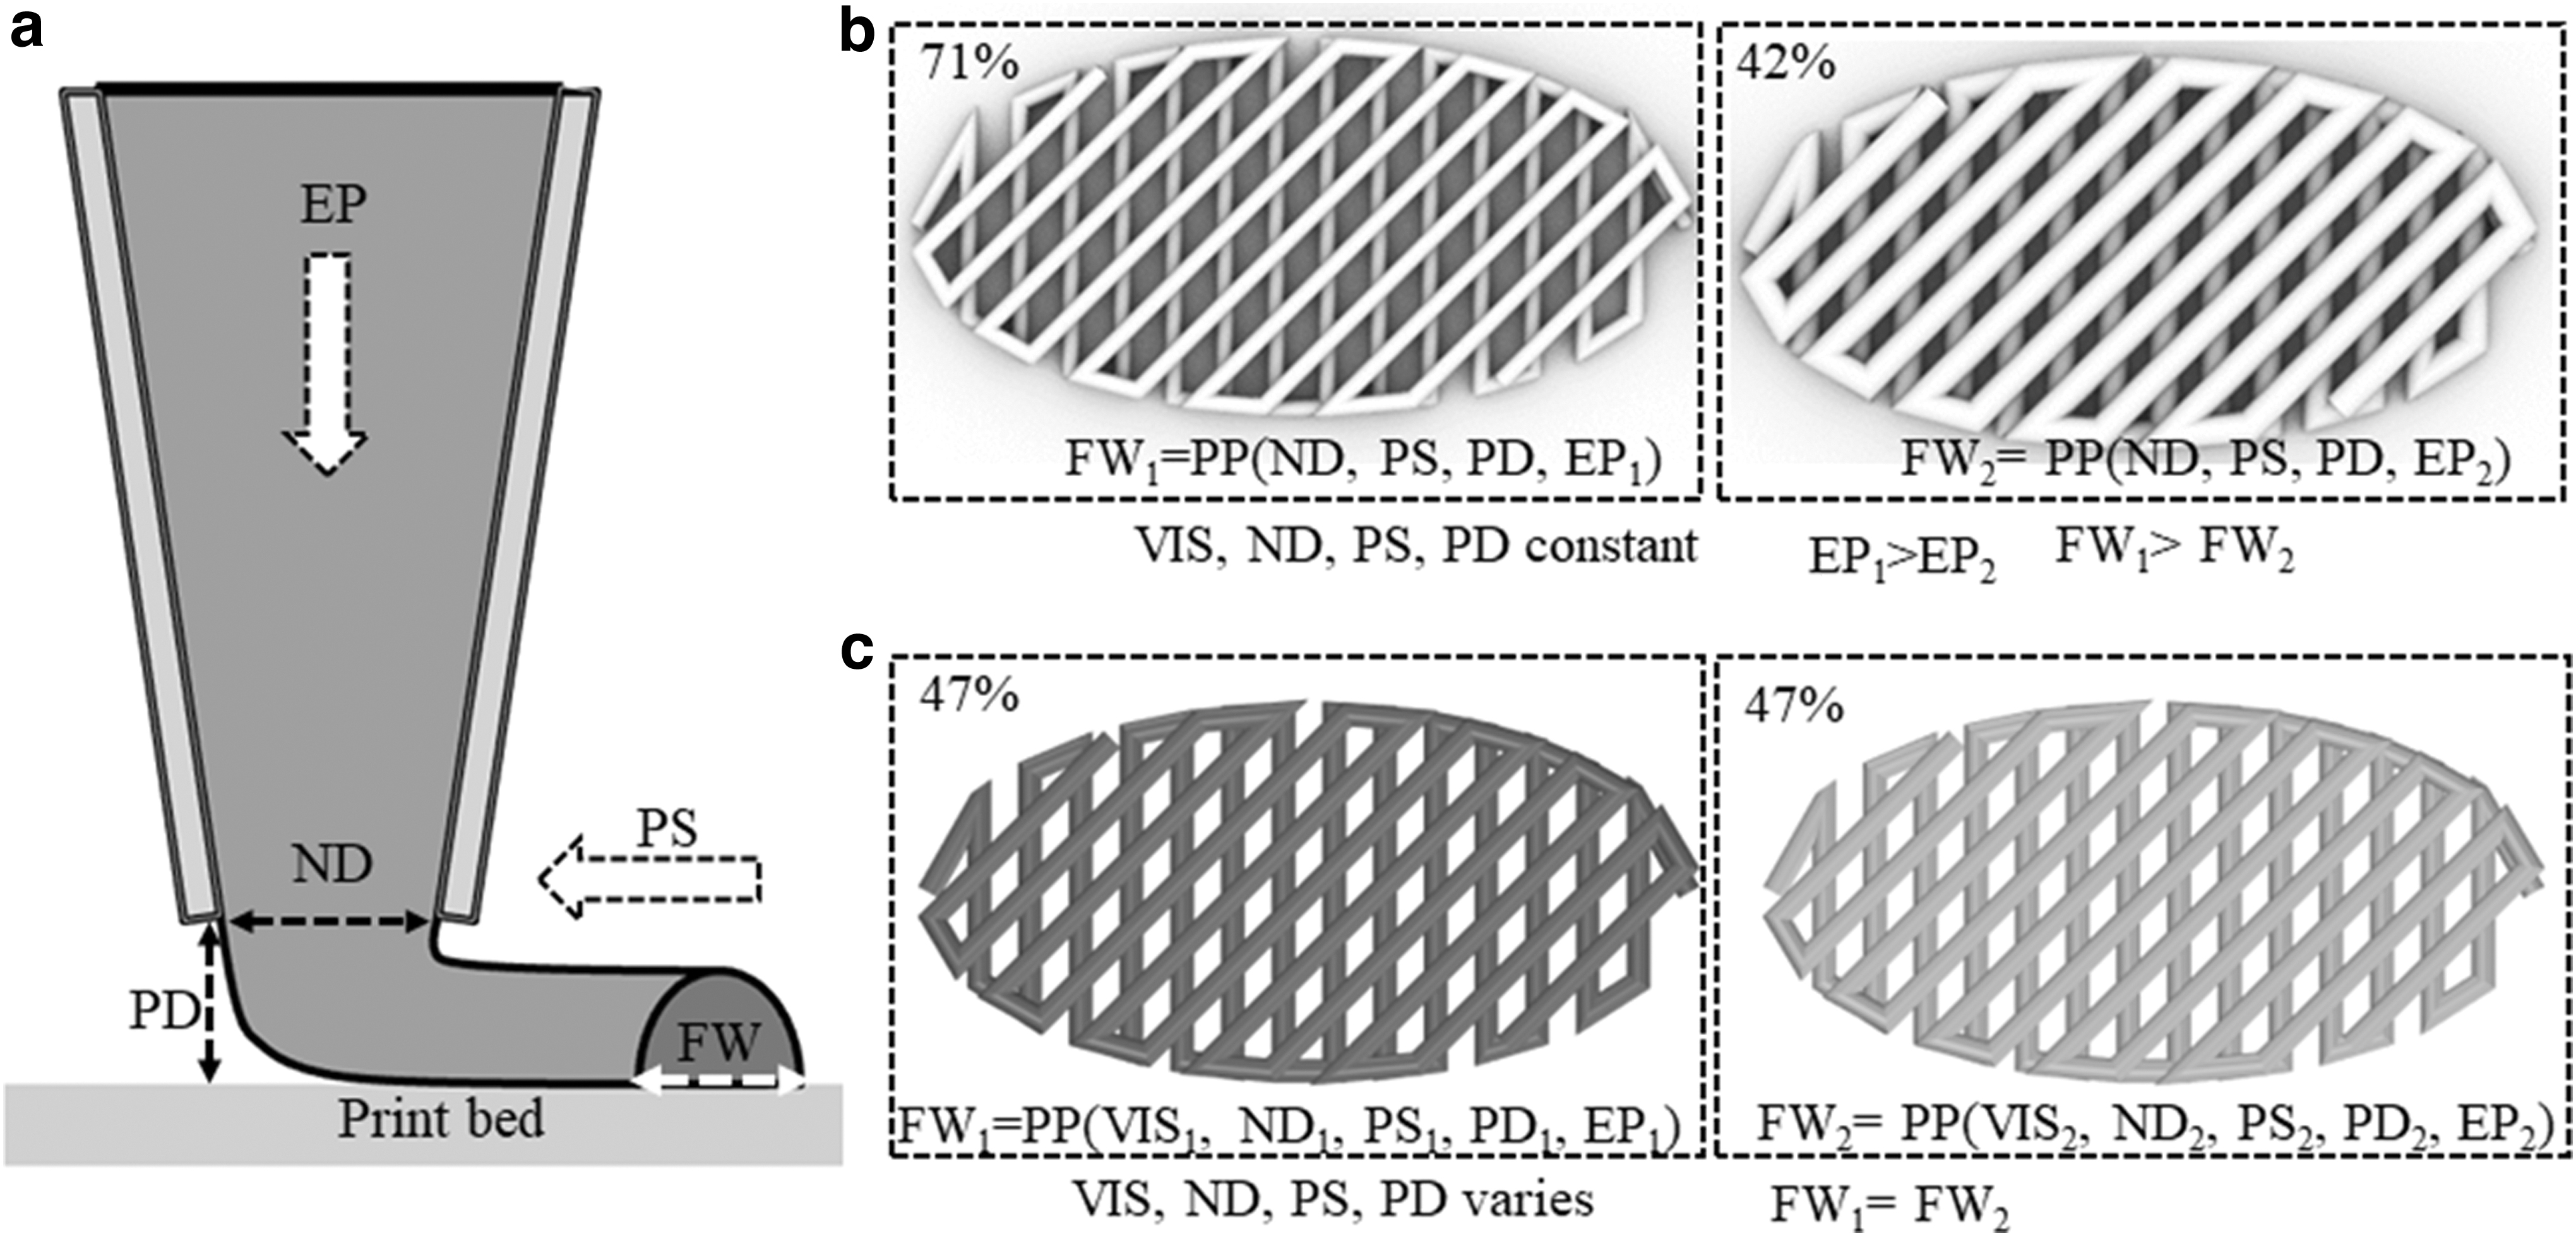
A systematic selection of a set of process parameters, such as ND, PS, and EP, can control the filament geometry and width (filament width [FW]), and eventually confirm the user-defined scaffold porosity of a material, 21 as shown in Figure 1b. In contrast, Figure 1c demonstrates how process parameters can be systematically controlled to achieve filaments with similar widths using materials with different viscosities (VIS). 25 Nevertheless, the insufficient analytical relationship between printing process parameters and FW poses a challenge to creating defined scaffold architectures using available resources. In this work, we have adopted the design of experiment (DoE) 26 method to understand the relationships between scaffold architecture property that is, FW with 3D printing process parameters such as such as ND, PS, and EP.
The DoE method has been a proven method for systematically obtaining the maximum amount of information through randomized experiment with least amount of resources. 27 Griffiths et al. 28 utilized the DoE method for 3D printed part optimization considering scrap weight, energy consumption, and production time. The complexity of bioink variations and the intricate relationship between mechanical properties and bioink composition in hybrid hydrogels make it challenging to analyze the factors that affect printability. Recently, Hegab et al. 29 used the DoE approach to understand the biomaterial composition's impact on the mechanical properties of the bioink. However, these works did not discuss the relationship between process parameters and scaffold porosity for soft materials or bioprinting.
In this study, FW was measured using an image processing technique, and an analytical relationship was established, which considers various process parameters to maintain a consistent FW variation for different hydrogels within an acceptable range, ensuring the overall geometric accuracy of the scaffold. These proposed analytical relationships can aid in achieving defined scaffold architectures using available resources.
Materials and Methods
Processing of materials and experimental setup
To identify the impact of various process parameters such as EP, PS, ND, and PD on the FW, we used 4% (w/v) alginate- and 4% Carboxy Methyl Cellulose (CMC, w/v, pH: 6.80; Sigma-Aldrich, St. Louis, MO)-prepared material following protocol described in our previous work. 31 We will denote this material composition as A4C4 in this article. Table 1 shows the process parameters used in this article, unless otherwise stated. Several aspects have been considered to select the levels of process parameters. Prior experience of printing with the materials and the 3D printer's capacity are key considerations.31–34 Besides, it ensured the distance of high and low levels of parameters so that the effect of parameters is clearly distinguished if there exists any.
All Process Parameters Used in the Article, Unless Otherwise Stated
Coded values used for the design of experiment where −1 and +1 express the low and high levels, respectively.
EP, extrusion pressure; ND, nozzle diameter; PD, print distance; PS, print speed.
To maintain the FW similar to two scaffolds fabricated by two different materials, two pre-crosslinked materials such as A2.5C2CS1 and A3C3CS1.5 (A2.5C2 and A3C3 pre-crosslinked with 1% and 1.5% CaSO4 [CS], respectively) have been considered, mentioned in literature. 35 In this study, A2.5C2CS1 and A3C3CS1.5 are defined as Mat 1 and Mat 2. Mat 1 and Mat 2 have a viscosity of 6 × 10⁶ and 2.4 × 10⁷ mPa.s, respectively, at a 0.01 s−1 shear rate. Rheological properties were analyzed using a rotational rheometer (MCR 102; Anton Paar, Graz, Austria) with a parallel plate geometry (25.0 mm flat plate). All measurements were recorded with a 1.0 mm plate–plate gap width at room temperature (25°C).
An extrusion-based 3D bioprinter (BioX; CELLINK, Boston, MA) has been used to fabricate the filaments and scaffolds. Hydrogels were prepared, accordingly, loaded into a 3.0 mL disposable nozzle, and extruded pneumatically on a stationary build plane. A visual basic-based Computer-Aided Design (CAD) software, Rhino 6.0 (https://www.rhino3d.com), was used to design and define the vectorized tool path of a scaffold. Slicer (https://www.slicer.org), a G-code generator software, was used to generate a Bio-X compatible file, including the tool path coordinates and all process parameters to build the scaffold.
A layer-upon-layer manner to release the materials has been followed throughout the bioprinting process. For each measurement, three filaments were fabricated. The images of fabricated filaments were captured between 1 and 2 min of printing using the CK Olympus bright field microscope (Shinjuku, Tokyo, Japan) and images were taken at the lowest possible time. The width of the filament was determined using the method discussed in Measurement of FW from Experiment section.
Measurement of FW from experiment
Accurate measurements of 3D bioprinted FWs are crucial for understanding the pore geometry, porosity, and internal and external geometries of the final scaffold. 30 To increase the accuracy of measurement, a pixel-based image analysis technique has been used to identify the width of the filament. Images were taken of deposited filaments with a microscope within a minute of printing them, as shown in Figure 2a.

The scale of the microscope image was calculated to determine the width of an image. These images were then analyzed using MATLAB (MATHWORKS, Natick, MA) image batch processing toolbox. Images were loaded into the program, processed, and binarized. Afterward, the FW was measured by locating the coordinates of the beginning and ending pixels across to find the diameter/width, as shown in Figure 2b. These measurements were then repeated three times to find an average diameter for the printed filament. The deviation of FW extruded through the ND was defined as diffusion rate (DR), which was calculated from DR formula
Design of experiment
To examine how the PPs affect the printed object's properties, the factorial DoE approach has been used. This approach is effective for efficiently gathering data and using statistical analysis to determine the importance of input parameters concerning the resulting output responses. For this study, a 2 k full factorial experimental design was chosen, which is commonly used and a straightforward method. This type of experiment involves evaluating k factors at two levels each (high: +1 and low: −1).
Using this full factorial DoE approach, we plan to investigate the influence of EP, PS, and ND, and their interactions on the FW of the printed scaffold in this article. The experimental treatment combinations both in the natural values and coded values are presented in Table 1. The conversion of natural to coded parameter level can be calculated using Equation (1), assuming X represents any process parameter. Considering 3 replications on each combination of process parameters as a full factorial design, there will be a total of 24 experiments run in this study.

Other process parameters such as LH, PD, bed temperature, and print temperature were maintained constant at 0.15 mm, 0.3 mm, 23°C, and 30°C throughout the experiments.
Results
Experimental data analysis
As per the design mentioned in Table 1, experiments have been conducted and three replications of FW were collected. Figure 3 depicts filaments fabricated with various process parameters mentioned in Table 1 along with their mean width values (Supplementary Data).
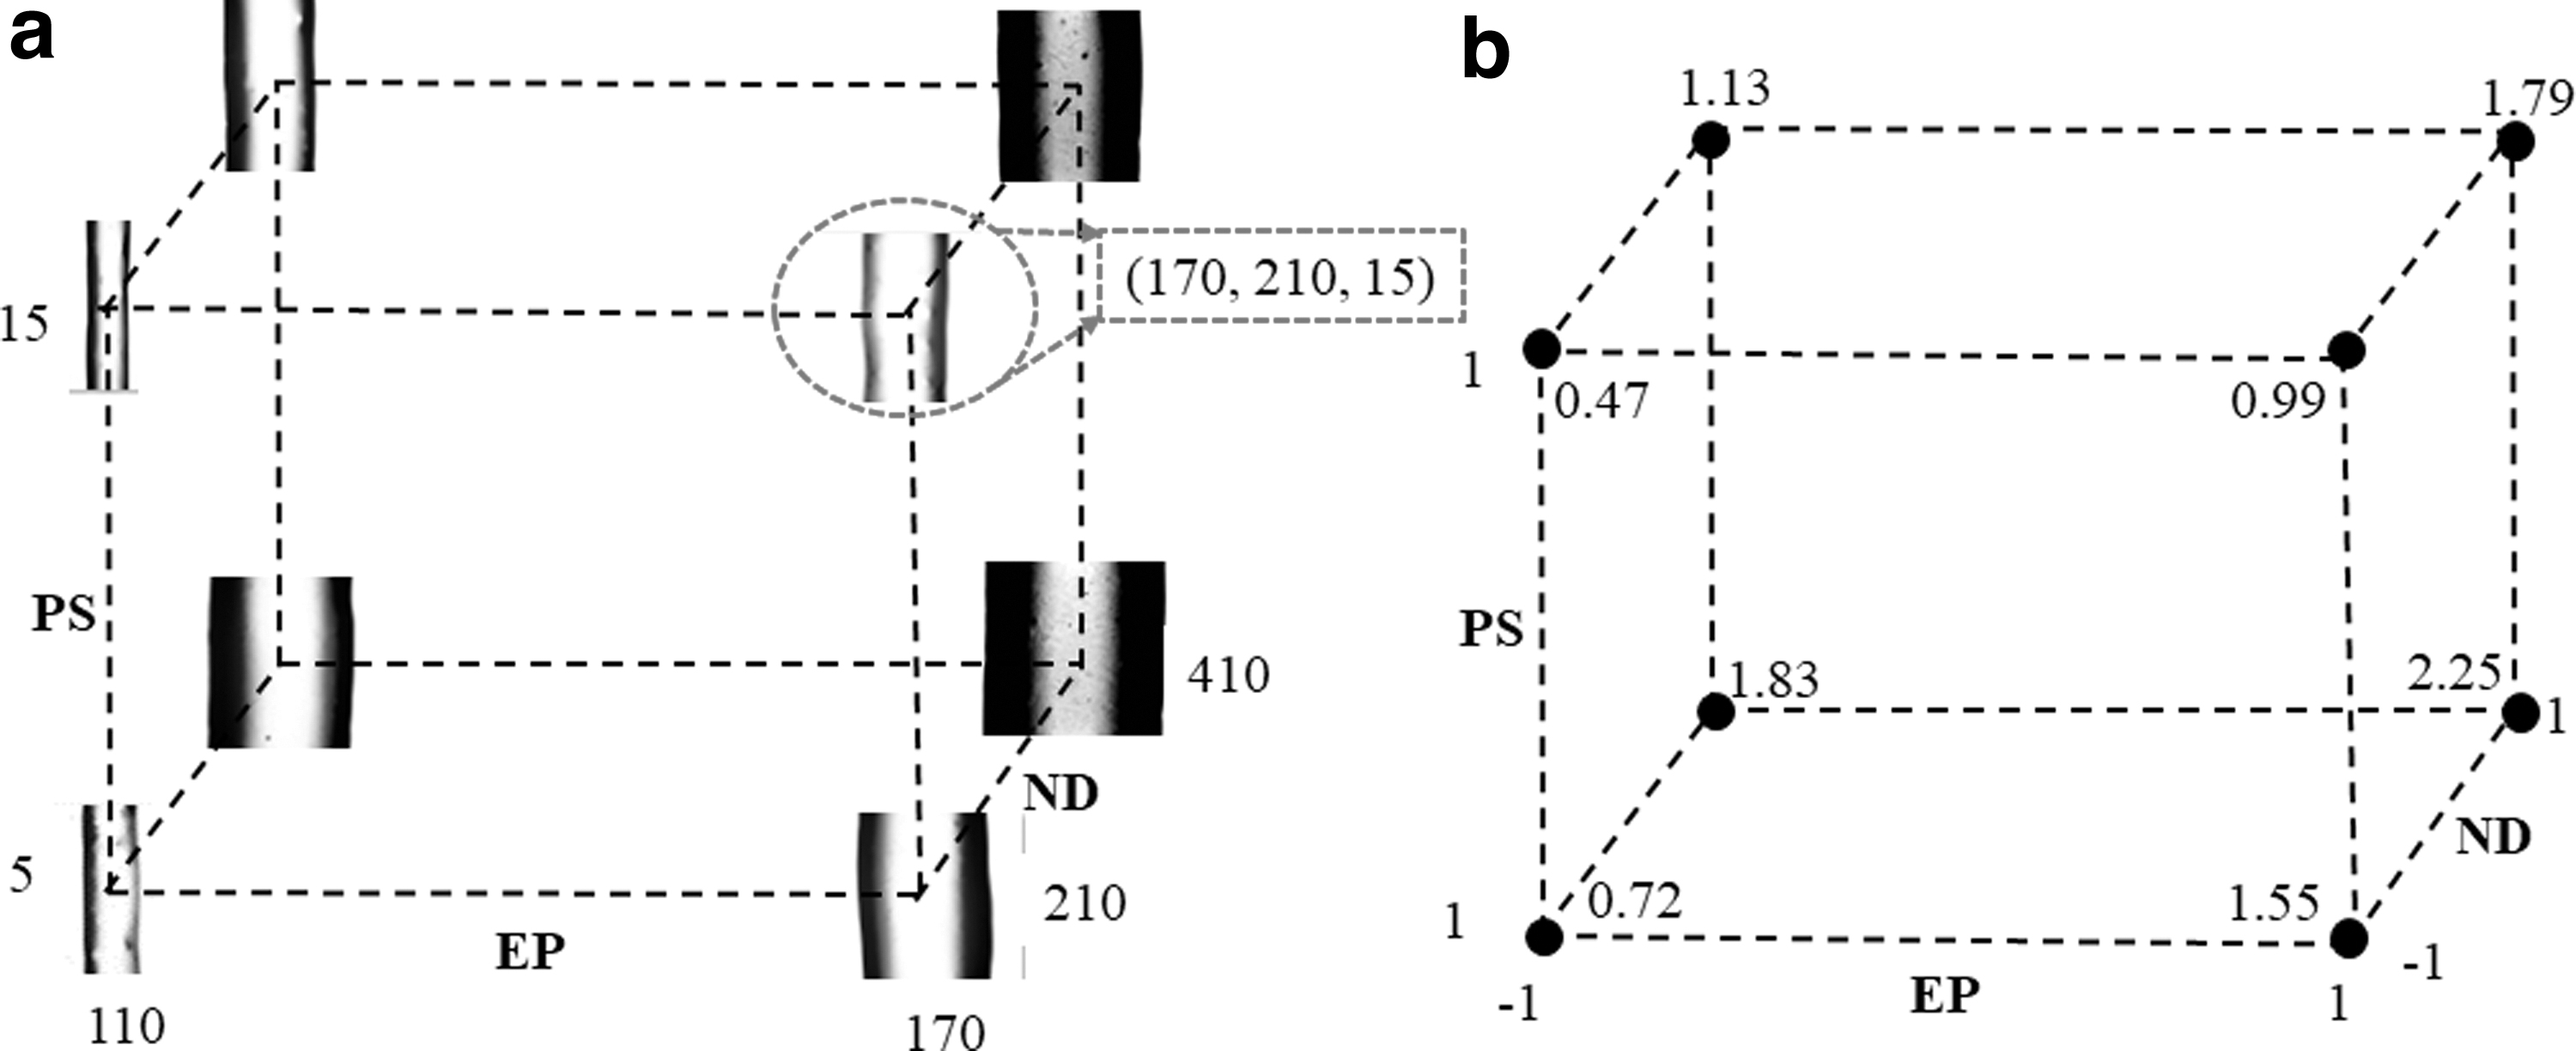
Table 2 represents the analysis of variance (ANOVA) Table for experimental data. It clearly shows the statistical significance of the overall model because of the lower p-value. The adjusted R-square value is 93.93%, which indicates the percentage of FW variation in this experiment can be effectively explained by the model. Considering standard significant level α = 0.05, all individual process parameters and their combination of three-way interaction show statistically significant in the ANOVA table. In terms of percentage contribution, individual process parameters have the most significant impact, such as EP, PS, and ND have 27.14%, 17.86%, and 48.38% resulting in a sum of 93.38%. Therefore, the three-way interaction can be omitted (only 1.4%), and, in this case, the adjusted R-square value becomes 92.47%.
Analysis of Variance Table for Full Factorial Experiment Data
DF, degrees of freedom; SS, sum of squares.
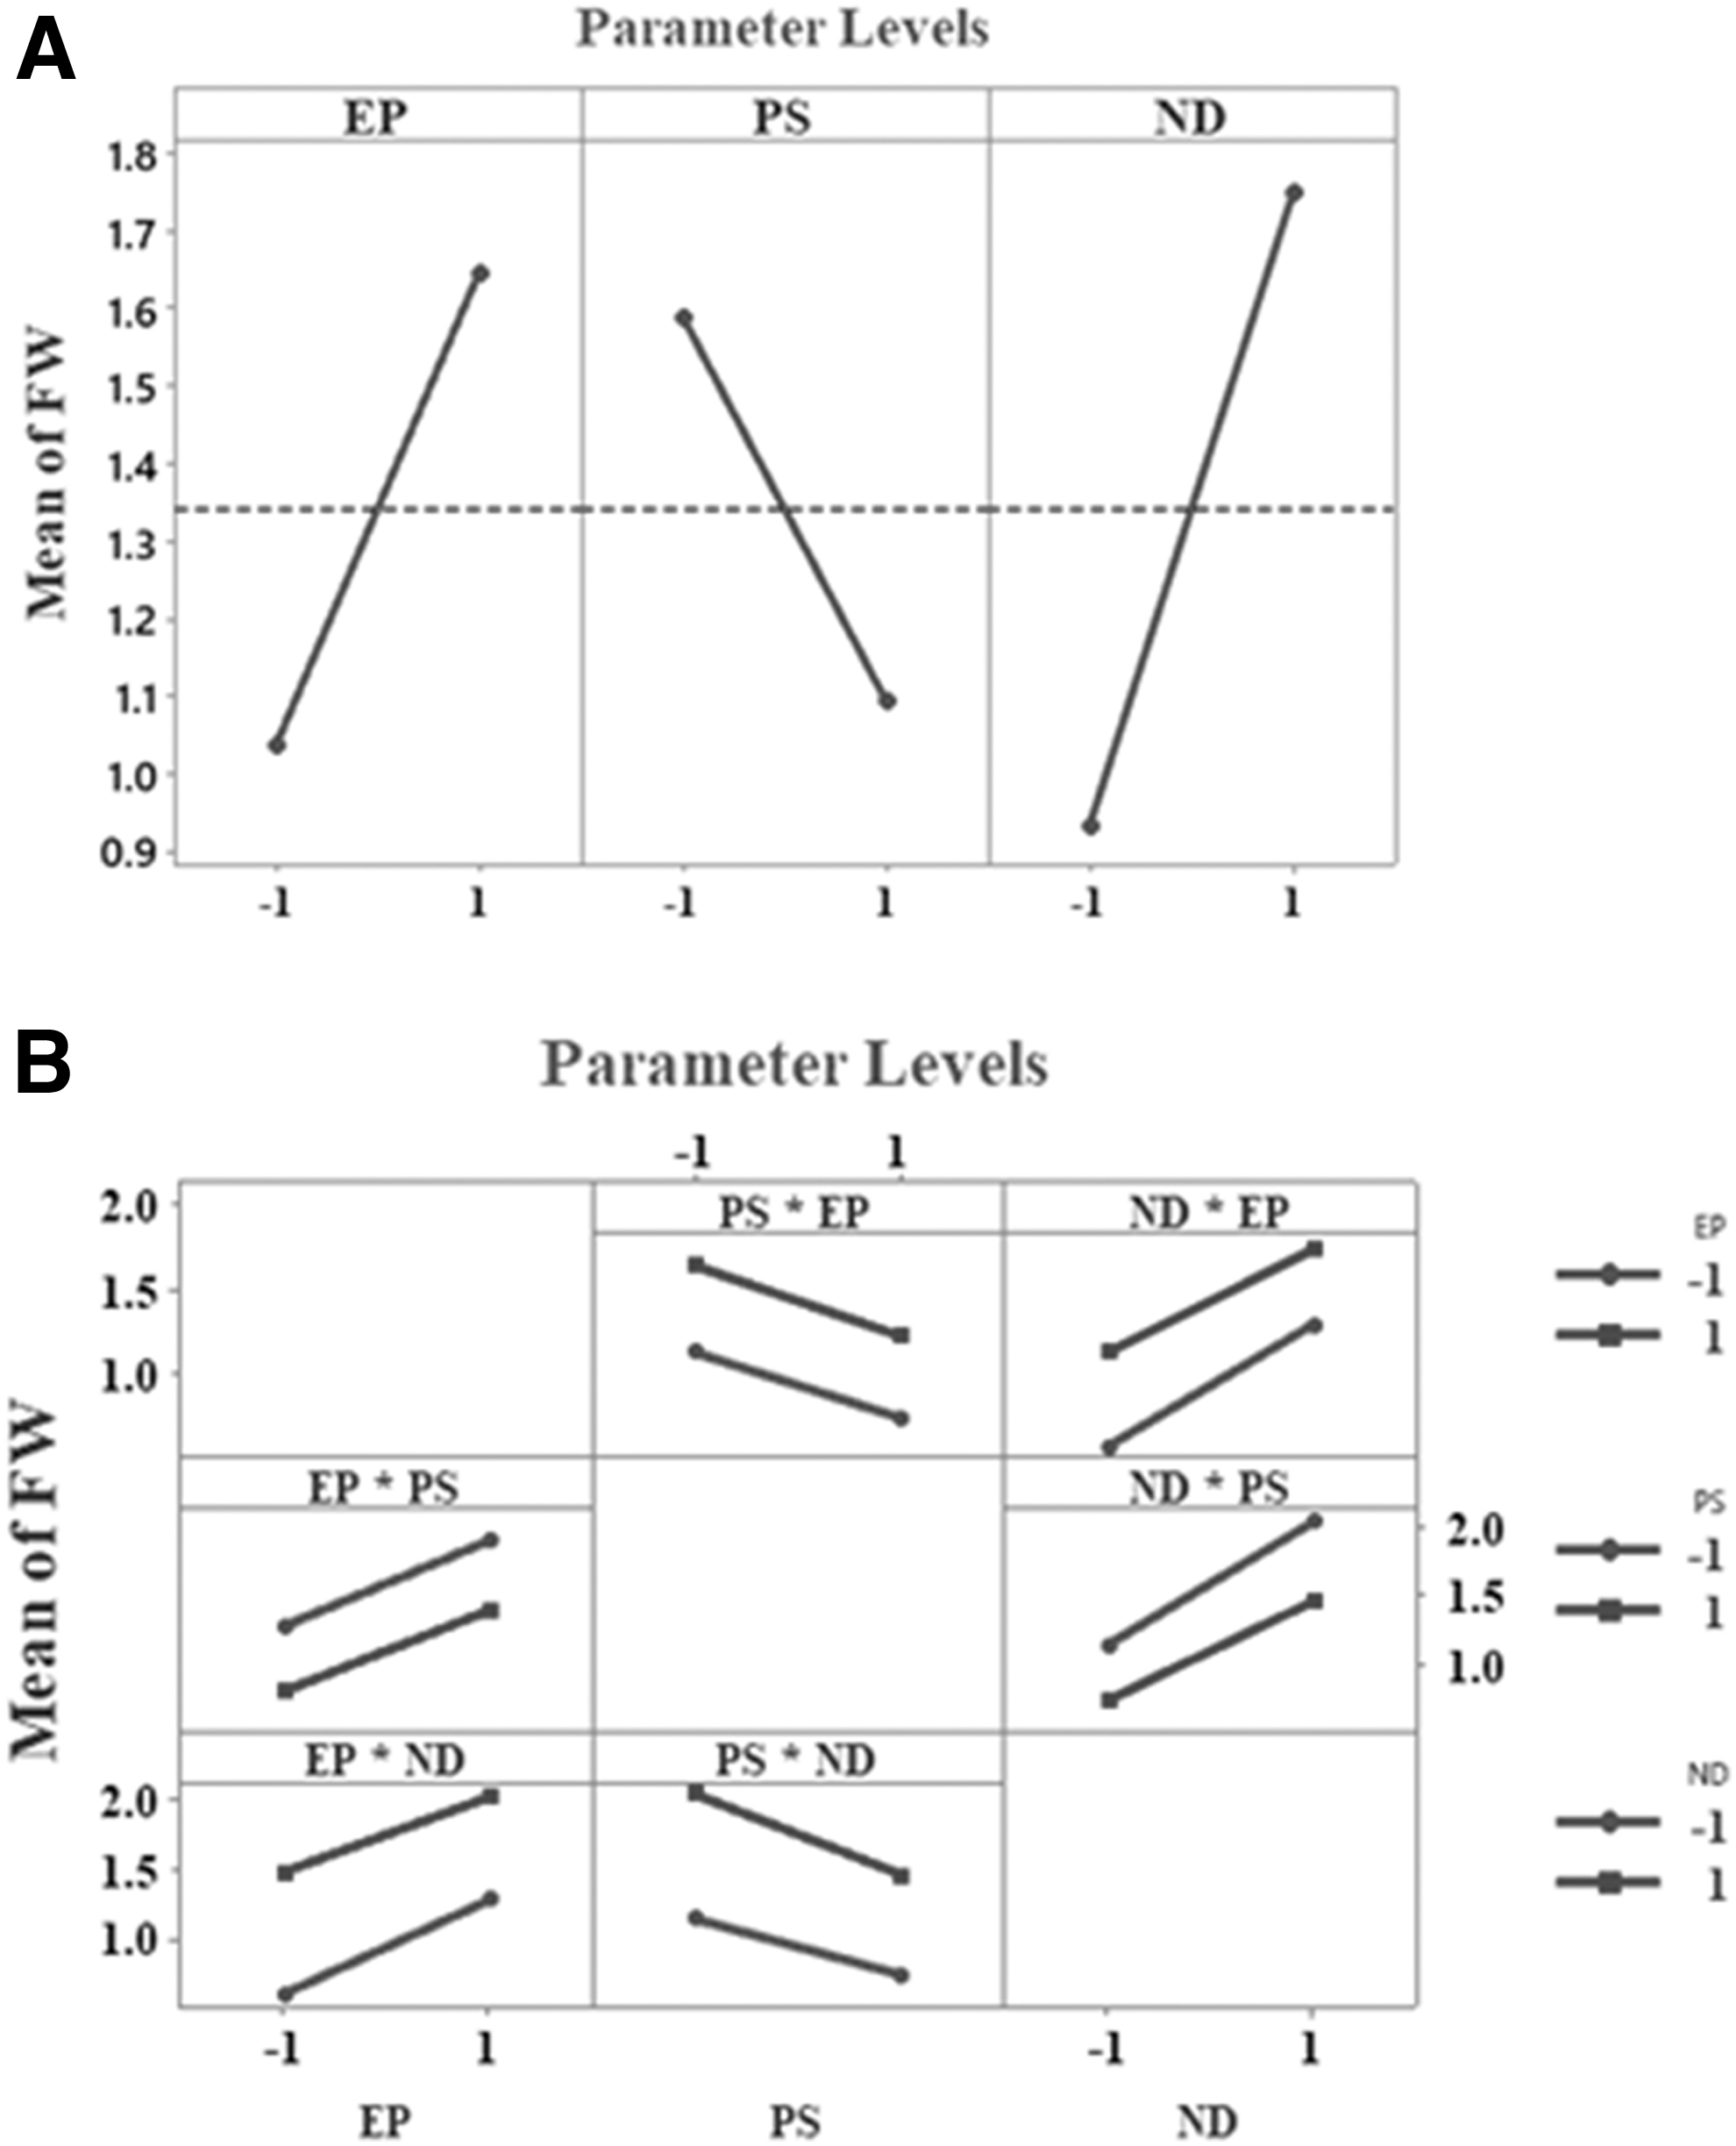
The analysis indicates that among the process parameters, ND has the highest positive impact (48.38%) on FW. This also aligns with the physical printing process as a positive impact indicates larger ND 3D bioprinter will print scaffold with higher FW. The EP has the second highest positive effect (27.14%) on FW. That indicates the higher the EP, the larger the FW will be printed. The PS has a negative effect, as shown in Figure 4a and Table 3. Table 2 represents PS has the least contributing impact (17.86%) on the object's FW. That is with higher PS, FW of the printed object will be smaller. This also confirms the physical phenomena of the printing process, which is at higher PS; the volume of material deposition would be lesser, resulting in smaller FW.
Effect and Coefficient Estimates
SE, standard error.
Figure 4 shows the effect of each parameter such as EP, PS, and ND, and the interaction matrix between process parameters. While each parameter has a significant effect, as shown in Figure 4a and Table 2, the interaction between any two process parameters does not show any crossing line that confirms the ANOVA that there is no interaction of process parameters, which are statistically significant on FW.
The p-values of EP × PS, EP × ND, and ND × PS such as 0.771, 0.271, and 0.164, respectively (Table 2), are much greater than the standard significant level of 0.05, confirming that there is no interaction of process parameters. The contour plot and 3D surface plot also confirm our conclusion about the insignificance of the process parameter's interaction effects. The contour lines in Figure 5a do not show any presence of curvature, rather they are approximately straight lines. The surface plot in Figure 5b does not show any twisting of the plane.

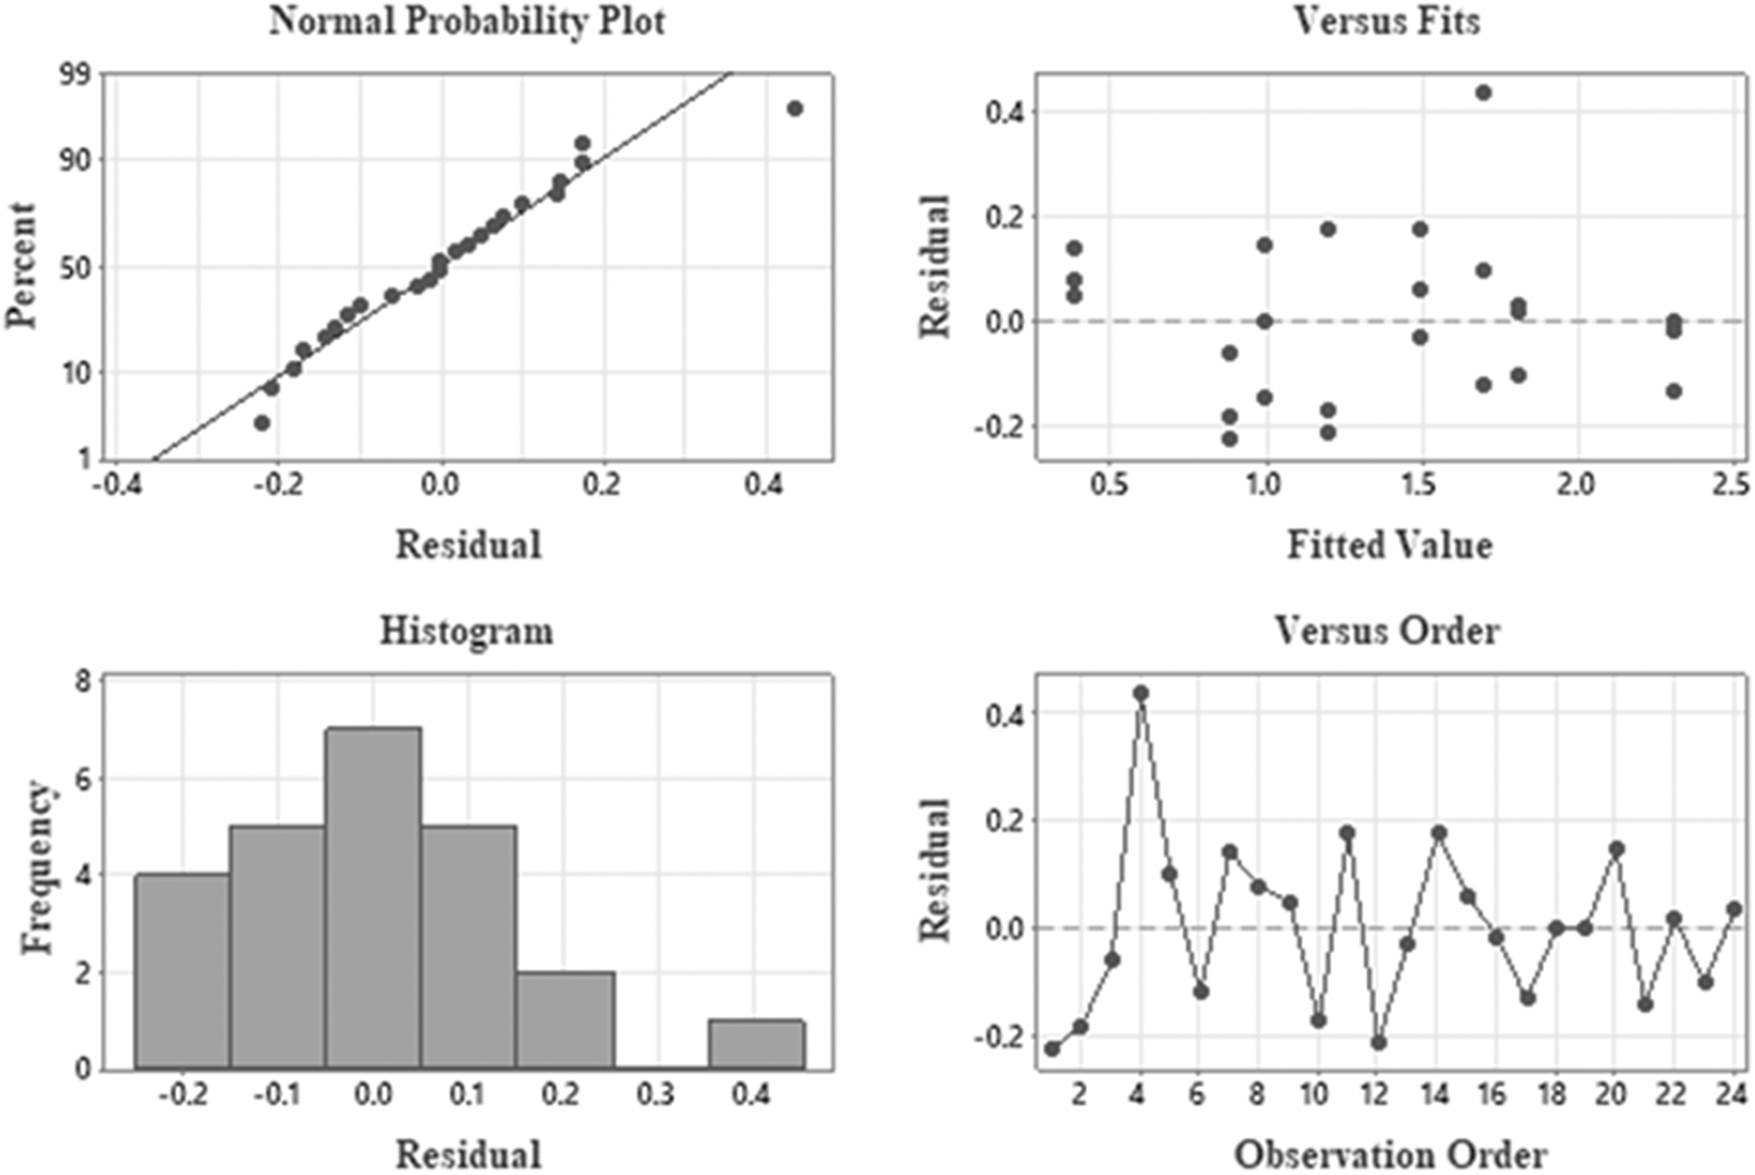
Figure 6 depicted the residual analysis of the data. The probability plot of residual data indicates a fairly straight line. The residual histogram also distributed on both sides of the zero indicates there is no significant issue with data symmetry or normality. The versus fit plot shows that the data did not have any pattern, which confirms the constant variance of the error term in this analysis. The observation order plot is also distributed fairly on both sides of the zero line, indicating experiments reasonably follow the randomization process and have no significant bias issues.
Residual analysis of experimental data.
Table 3 lists the statistically significant parameters along with their estimates. The effect estimates indicate the mean change of output response, while process parameter changes from low to high level. For instance, FW would increase by 0.61 U when EP changes from low to high level. It is mentioned that in the presence of interaction terms, the interpretation requires more investigation of the physical printing process. As we use the two-level coded factorial design, the coefficient estimate is exactly half the effect estimates. The lower value of the coefficient's standard error represents higher accuracy of the estimates. From Table 3 of the coefficient estimate, we got the response surface equation in terms of coded process parameters as follows:
where it clearly indicates that EP and ND have a positive impact on the FW, whereas PS has a negative impact.
Implementation and validation
FWs were predicted for all combinations of coded PPs used for DoE, applying the response surface equation [Eq. (2)]. The percentage of the difference between the modeled-FW and experimental FW (Exp-FW) was calculated, as shown in Figure 7. A difference ranging from 0.081% to 21.59% is observed. It can be mentioned that we found most of the modeled-FW showed less than a 10% difference compared to Exp-FW, except for the experiment-coded combination of (−1 − 1 −1) and (−1 1 − 1).
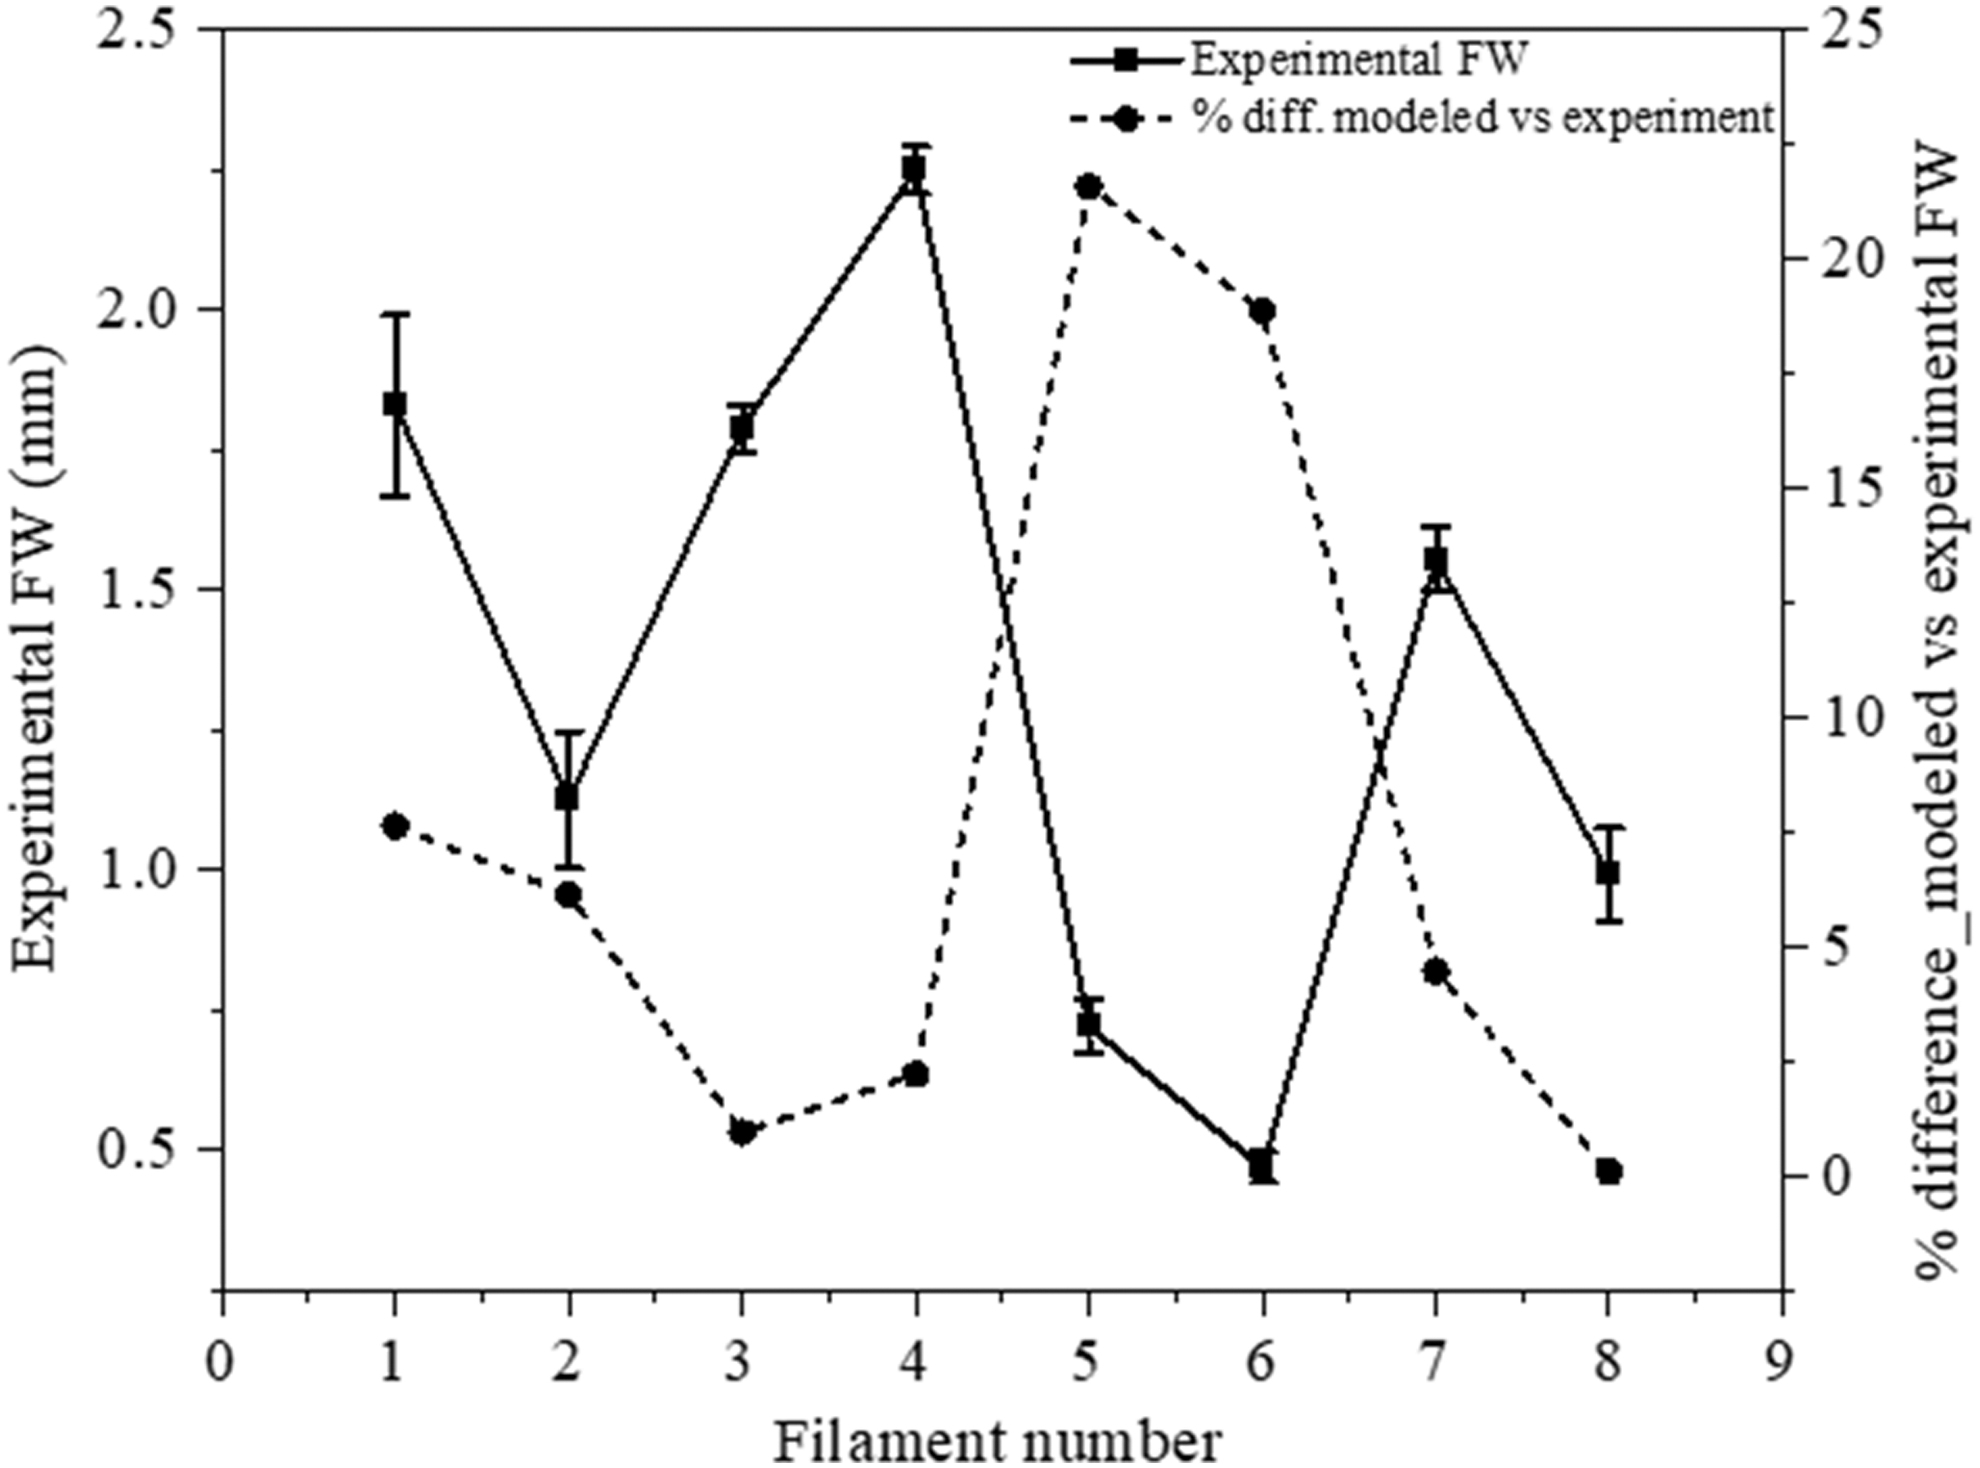
Experimental data of FW and % of the difference between modeled and experimental data.
We conducted an experiment using two nozzles with ND of 210 and 410 μm, applying 110 and 130 kPa EP to extrude 12 more filaments as a part of validation, as depicted in Figure 8. The measured FWs are displayed in Table 4. This set of experimental results revealed that the FW decreased with increasing PS for each EP, as shown in Figure 8. Moreover, the FW increased with increasing ND for each EP, as shown in Figure 8. This phenomenon supports the response surface equation [Eq. (2)].

Filaments extruded through 210 and 410 μm nozzles using 130 and 150 kPa EP and 5, 10, and 15 mm/s PSs.
Responses or Modeled-Filament Widths for Various Coded Process Parameters and Comparison in Relationship to Experimental Filament Width
Exp-FW, experimental filament width; FW, filament width.
Filaments created with all considered pressures showed a range of filament DRs [DR = (width of extruded filament − ND)/ND × 100), ranging from 155% (110 kPa, 15 mm/s) to 736% (150 kPa, 5 mm/s), as shown in Figure 9. This figure confirms that for each ND, such as 210 and 410 μm, FW decreases with increasing PS. For example, filaments 16, 17, and 18, as circled shown in Figure 9, were fabricated using an ND of 210 μm using 5, 10, and 15 mm/s PS, respectively. This phenomenon indicates that we can achieve larger FW with a smaller ND by controlling the DR driven by careful selection of the EP and PS.
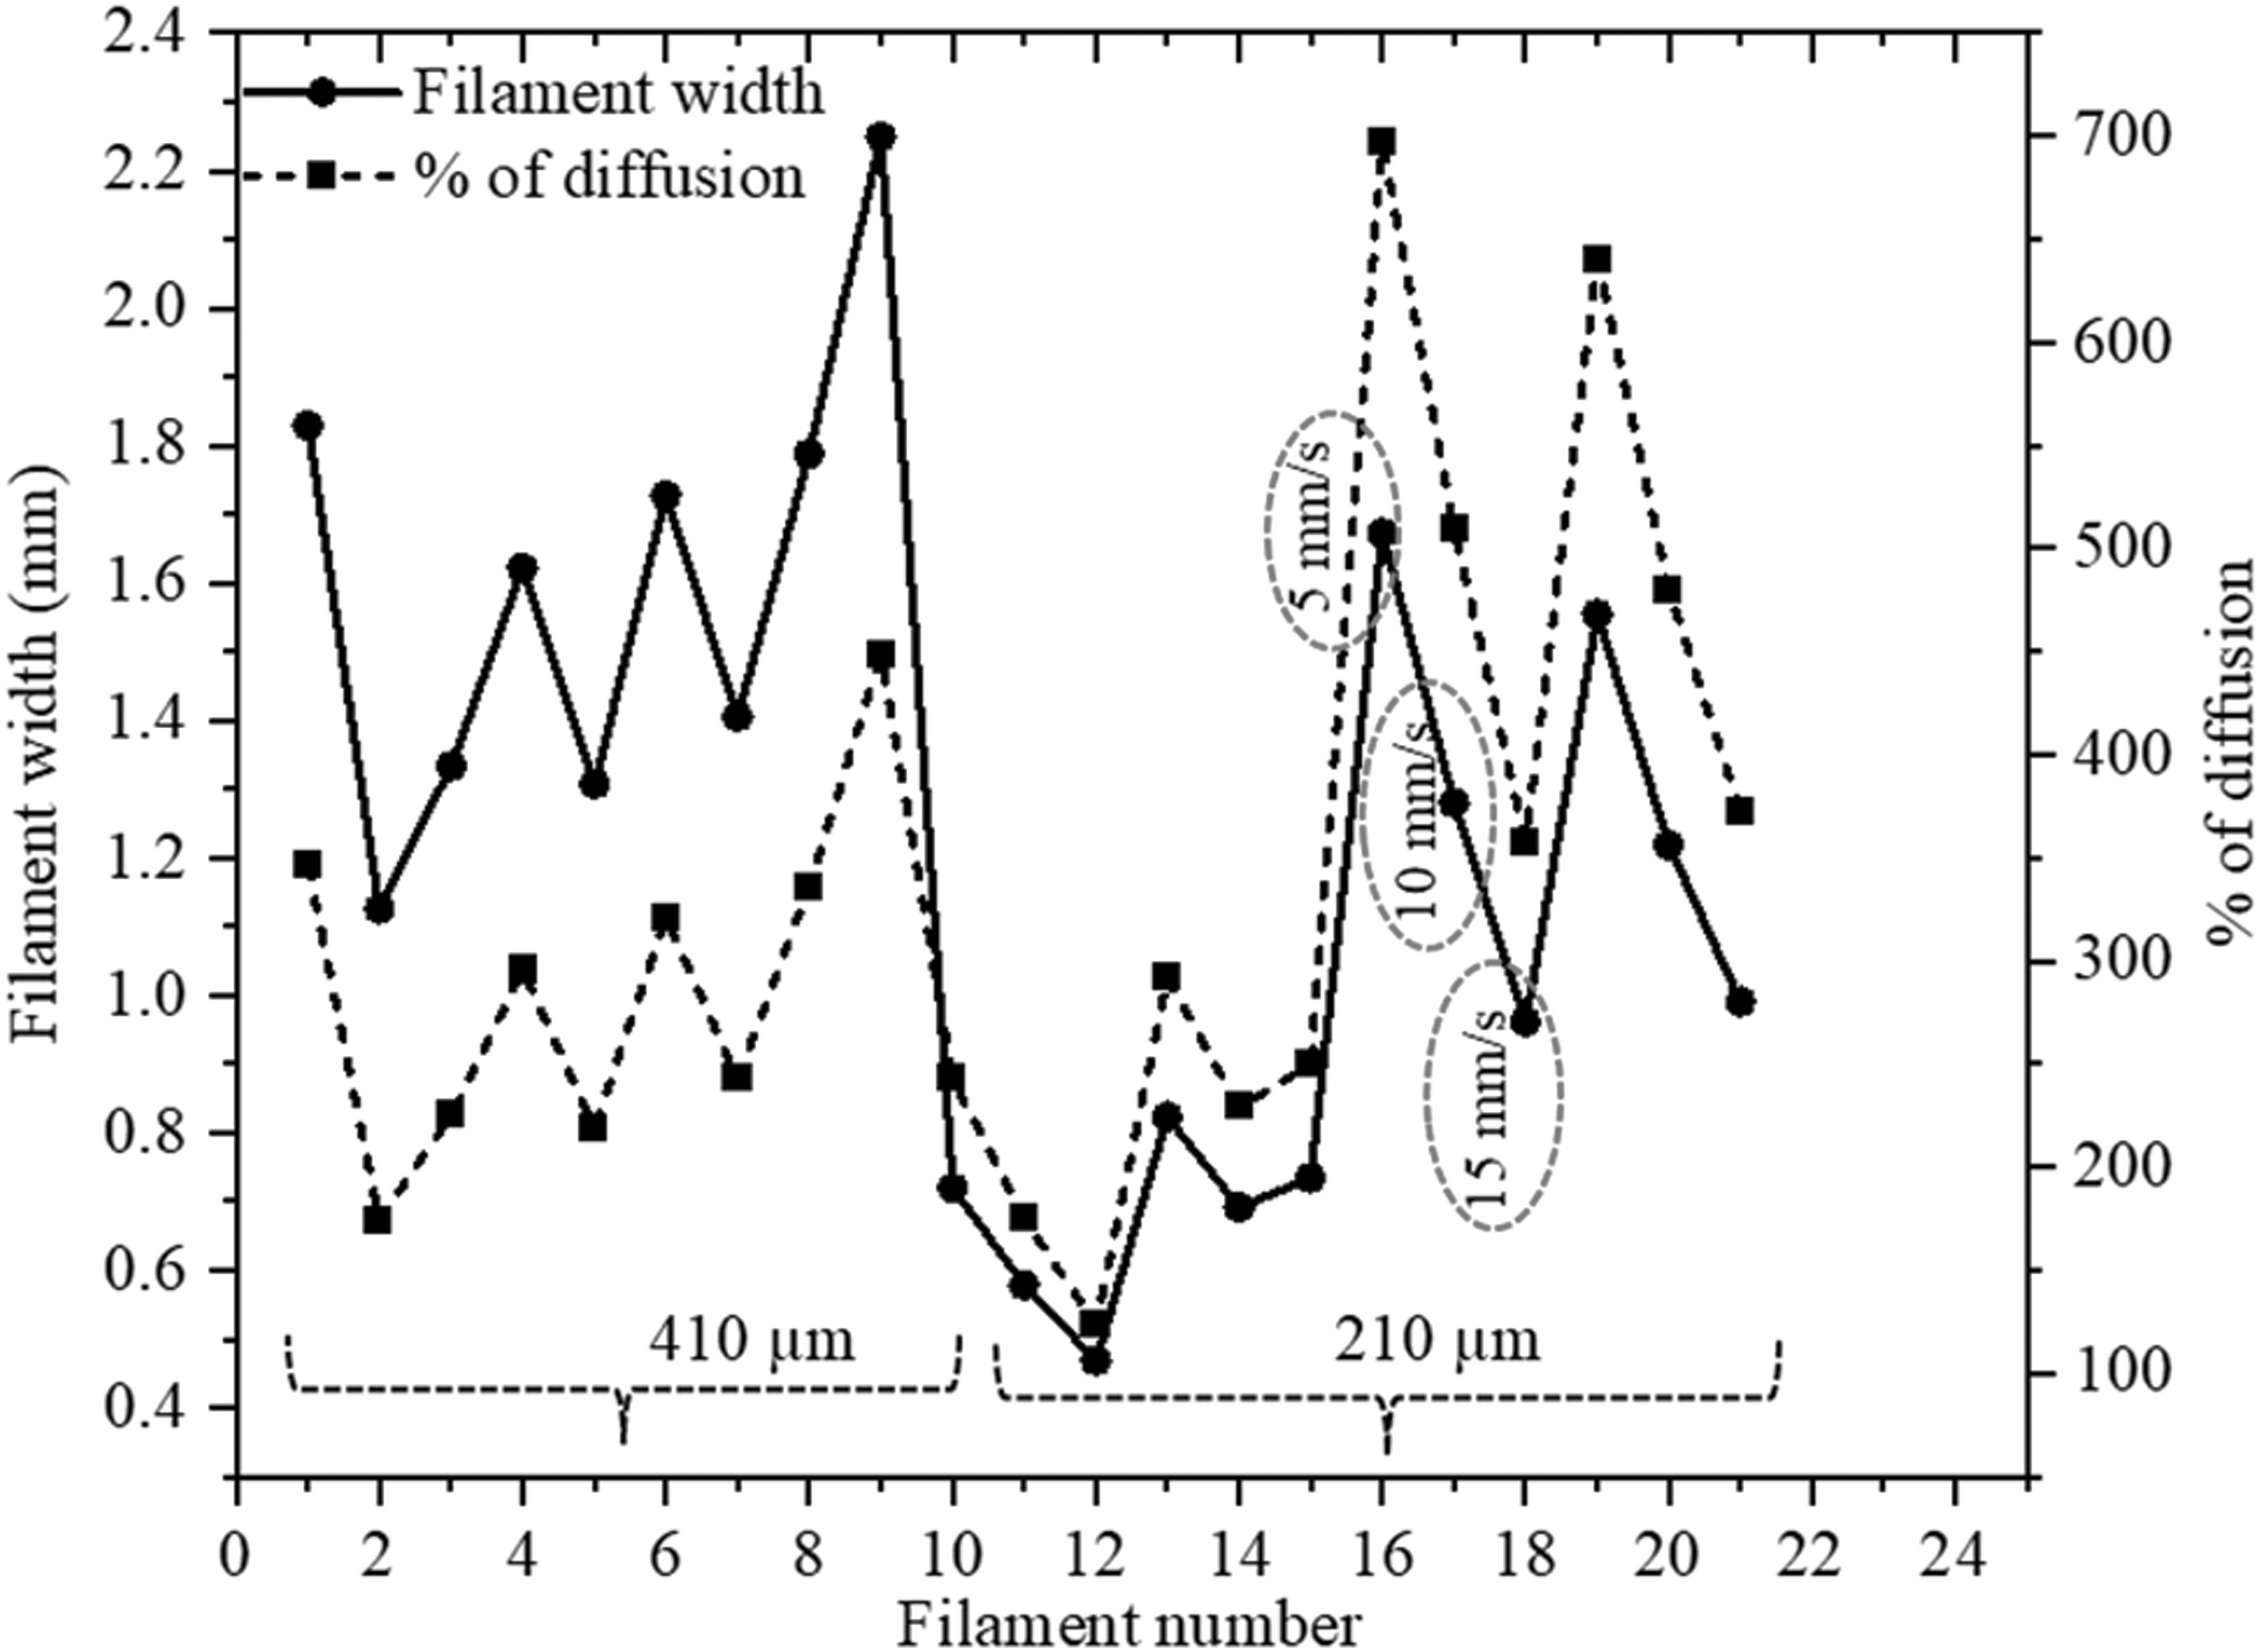
Measured FWs and % of diffusion rate with respect to the ND.
To test how well Equation (2) predicts the FW with respect to PPs other than the PPs considered in DoE, the PPs (130 and 150 kPa EP coded as −0.33 and 0.33, respectively, and 10 mm/s PS was coded as 0) were coded by using Equation (1), as shown in Table 4. The response surface equation [Eq. (2)] is then used to calculate the value of the FW, which has been referred to as Modeled-FW in Table 4. A comparison has been made between the Modeled-FW and the Exp-FW and the difference between the two expressed as a percentage (% of diff) in Table 4. The difference has been found to range from 1.60% to 23.36%.
Figure 10 shows the box plot of FW obtained from the experiment and mathematical Equation (2). The connecting mean line is approximately a straight horizontal line, indicating that there is no significant difference between Exp-FW and Modeled-FW.
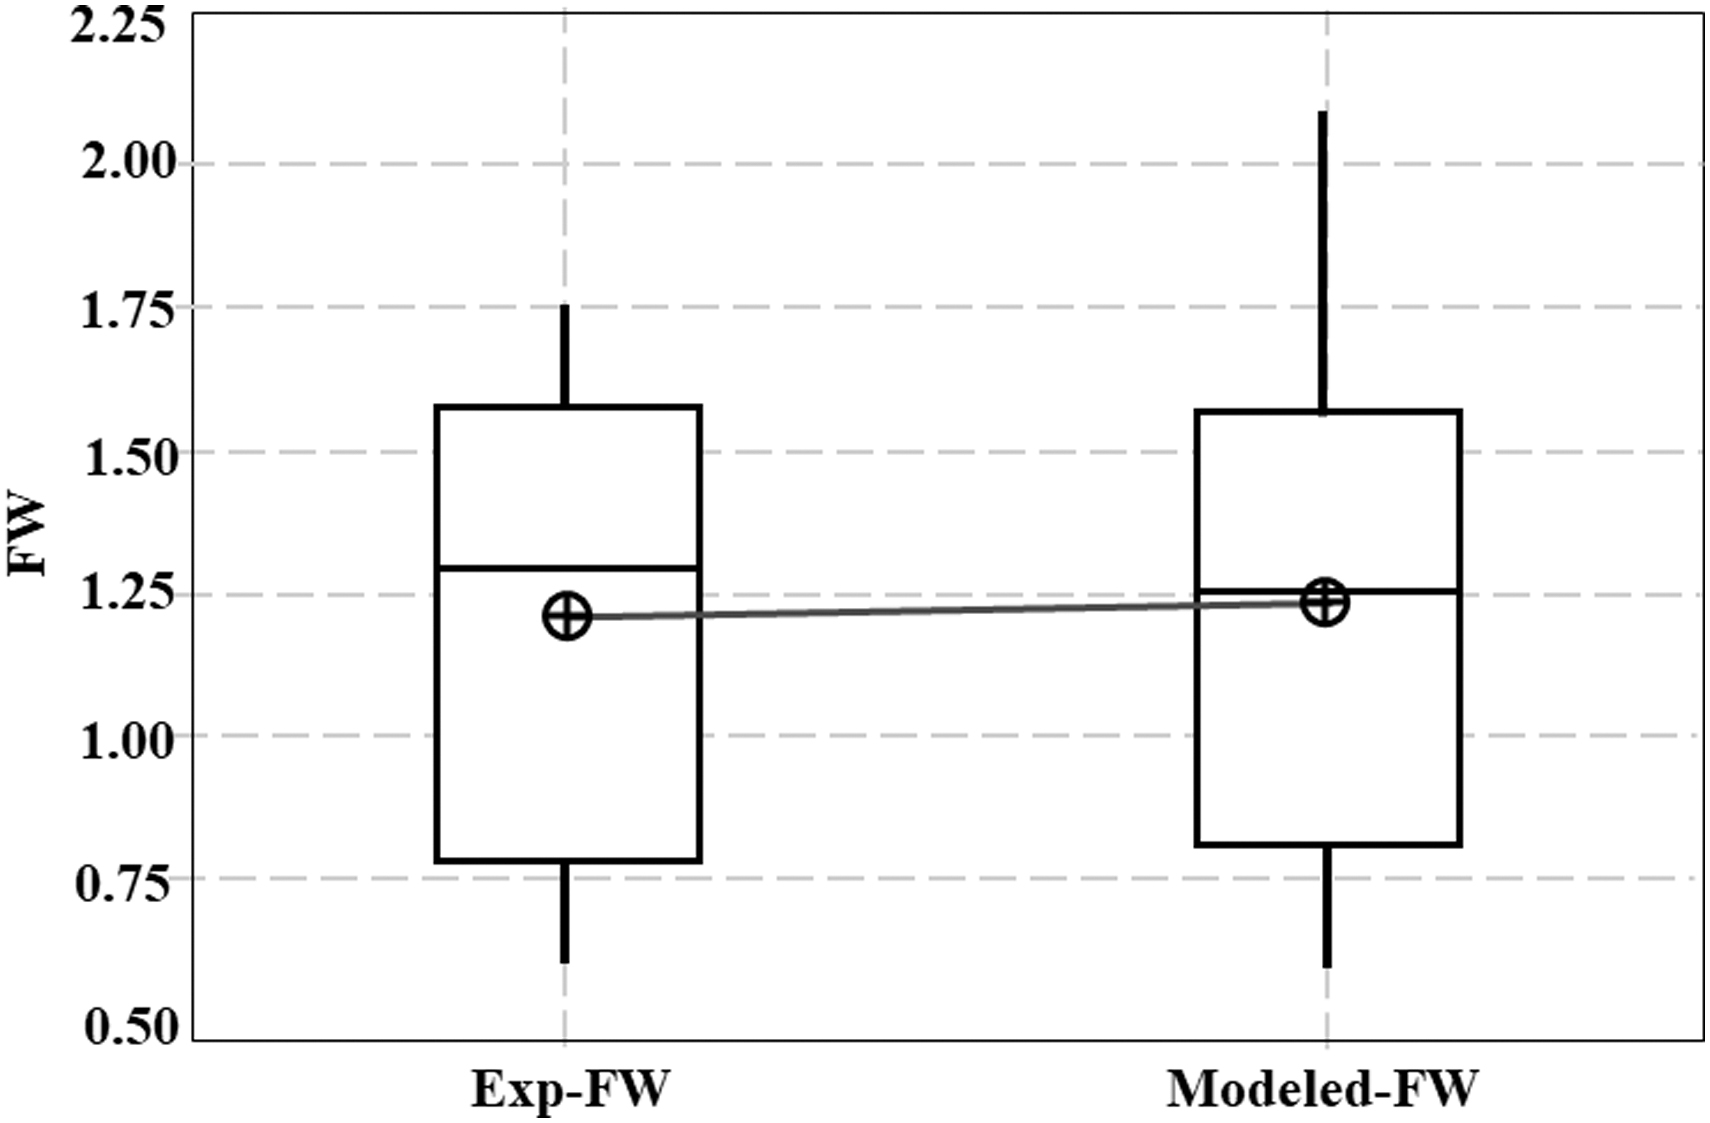
Box plot showing the FW difference between experimental and mathematical models.
For further confirmation of FW's differences, we have conducted a two-sample t-hypothesis test. The hypothesis is formed as there is no difference between Exp-FW and Modeled-FW (null hypothesis) versus there are differences between Exp-FW and Modeled-FW (alternative hypothesis). The hypothesis test resulted in a p-value of 0.898, which is much greater than the significant level of 0.05, and we fail to reject the null hypothesis. The FW's difference confidence interval is [−0.396, 0.349], which contains zero that reassures the hypothesis test and confirms that the Exp-FW and Modeled-FW have no evidence of statistically significant differences. Therefore, it is suggested that Equation (2) can be used systematically for various EP, PS, and ND to predict scaffolds with consistent FW, pore geometry, and porosity.
Fabrication of targeted FW with various process parameters
In this section, it has been explored how the targeted FW utilizing various sets of available resources can be fabricated. After an exhaustive search of our experimental data, it is noticed that two different sets of process parameters can fabricate similar FWs. For example, two different sets of process parameters, (410 μm, 130 kPa, 15 mm/s) and (210 μm, 150 kPa, 10 mm/s) resulted in a 2.13% difference in FW by producing similar widths of 1.30 and 1.28 mm, respectively.
It has been further observed that similar FW can be produced by extruding through the same nozzle and applying a systemic mix of the EP and PS. For example, a 410 μm nozzle and a combination of 110 kPa-10 mm/s and 130 kPa-15 mm/s EP-PS have been used to produce filaments of 1.33 and 1.30 mm in width, respectively. This interesting phenomenon implies that selecting process parameters and resources carefully can lead to similar FWs. With an exhaustive search, it is that found a set of combinations of process parameters for 210 and 410 μm NDs can create FW showing a difference from 1.97% to 9.34%, as listed in Table 5.
A Set of Combinations of Process Parameters That Created Similar Filament Width with a Difference of 1.97–9.34%
Since finding various combinations to fabricate targeted FW with available resources can be time- and resource-consuming, Equation (2) can be used to find them. For example, if we plug in the coded values for (410 μm, 110 kPa, 10 mm/s) and (210 μm, 170 kPa, 5 mm/s) such as (+1, −1, 0) and (−1, +1, −1) in Equation (2), we get the modeled FW as 1.44 and 1.48 mm, respectively having a difference of 2.8%.
Fabricating scaffolds having similar porosity with various process parameters
This section focuses on the inclusion of material viscosity as a new variable in analyzing FW alongside the various process parameters. Mat 2 had a viscosity four times higher than Mat 1 at a 0.01 s−1 shear rate, with values of 2.4 × 10⁷ and 6 × 10⁶ mPa.s, respectively. Bilayer scaffolds were printed with a 2.5 mm raster width using a 610 μm ND and 50 mm/s PS for both materials, as shown in Figure 11a.i and a.ii.

However, the EP used for Mat 1 and Mat 2 was 100 and 140 kPa, respectively. The average FWs were 1.03 and 1.1 mm for Mat 1 and Mat 2, respectively, as shown in Figure 11a.v, indicating a 7% difference. Figure 11a.iii and a.iv indicate a 7% difference in the intersection area of Mat 1 and Mat 2 with values of 3.43 and 3.67 mm2, respectively. It is further noted that there is a small difference in pore areas ranging from 0.74% to 6.74% for a total of nine pores, as shown in Figure 11b. In the future, we will include viscosity as another factor in our model to estimate the FW and eventually the scaffold porosity.
Conclusion
Obtaining the desired properties of 3D bioprinted objects is an urgent need, especially in biomedical and tissue engineering applications. In this work, a controlled design of the experimental method has been employed to understand the 3D printed scaffold's print properties in terms of extrusion-based printing process parameters. The three most critical process parameters such as EP, printing speed, and ND were considered in the experimental study. The FW of the printed object has been considered the desired scaffold property in this work. The experimental results revealed that ND has the highest positive impact, EP has the second most positive impact, and printing pressure has the least negative impact on the printed FW. The result analysis did not find any potential interaction between process parameters.
The quantitative relationship between FW and process parameters obtained from the study has been proven to be very robust. The validation results showed that FW obtained from the developed analytical relationship and the experimental process have no significant difference. This indicates that our obtained analytical relationship can be used by carefully selecting process parameters to create a scaffold with a precise FW, which confirms the scaffold's shape accuracy.
The analytical relationship obtained in this study is limited to the biomaterial A4C4 mentioned in Materials and Methods section. In the presence of different biomaterials, material types could be a potential process parameter. Nozzle distance and printing environmental conditions could have the potential to be included as process parameters in future work. In case of a higher number of process parameters, the fractional factorial DoE method can be implemented instead of the full factorial design to make the experiment study efficient and effective. In the presence of a high number of experimental data with multiple scaffold properties, developing a machine learning model is another potential future work. Accomplishing this long-term objective could propel extrusion-based 3D bioprinting to a new level, allowing for the creation of patient-specific tissue scaffolds by controlling scaffold porosity without expensive experimental trials.
Footnotes
Authors' Contributions
A.H.: Supervision, conceptualization, methodology, and writing—original draft preparation. S.M.L.: DoE-related data curation, methodology, result, and writing—review. R.S.: Data collection and writing—review. C.Q.: Experimental setup, research conduct, data collection, software, and validation.
Author Disclosure Statement
Authors declare no conflict of interest.
Funding Information
Financial support provided by National Science Foundation Grant number OIA-1355466, Department of Transportation US-DOT number 693JK31850009CAAP, and National Institute of Health under COBRE: CDTSPC Grant number P20GM109024 is acknowledged.
References
Supplementary Material
Please find the following supplemental material available below.
For Open Access articles published under a Creative Commons License, all supplemental material carries the same license as the article it is associated with.
For non-Open Access articles published, all supplemental material carries a non-exclusive license, and permission requests for re-use of supplemental material or any part of supplemental material shall be sent directly to the copyright owner as specified in the copyright notice associated with the article.