
Abstract
The manufacturing sector's interest in additive manufacturing (AM) methods is increasing daily. The increase in energy consumption requires optimization of energy consumption in rapid prototyping technology. This study aims to minimize energy consumption with determined production parameters. Four machine learning algorithms are preferred to model the energy consumption of the fused deposition modeling-based 3D printer. The real-time measured test sample data were trained, and the prediction model between the parameters of 3D fabrication and the energy consumption was created. The predicted model was evaluated using five performance criteria. These are mean square error (MSE), mean absolute error (MAE), root mean squared error (RMSE), R-squared (R2), and explained variance score (EVS). It has been seen that the Gaussian Process Regression model predicts energy consumption in the AM with high accuracy: R2 = 0.99, EVS = 0.99, MAE = 0.016, RMSE = 0.022, and MSE = 0.00049.
Introduction
Additive manufacturing (AM) or 3D printer technology is defined as a layer-on-layer material assembly process from computer-aided design (CAD) models. 1 This technology has many applications, such as automotive, energy, soft actuation, food, medicine, robotics, agriculture, and livestock.2–5 It has been used to produce medical tools to reduce deficiencies in treatment, such as the supply of masks, especially during the epidemic. 6 According to the ASTM F2792 standard, AM is examined in seven categories. These categories are material extrusion, powder bed fusion, vat photopolymerization, material jetting, binder jetting, sheet/plate lamination, and direct energy deposition.7–10
The fabrication of complex 3D geometries, which was not possible before with conventional manufacturing methods, has become possible with AM.11,12 Many companies and universities have accelerated their work in the field of AM to be more precise, efficient, faster, and more cost-effective.13,14 The rapid growth of this technology has made it necessary to focus on the energy consumption of 3D printer systems.
There are relatively few studies on energy consumption estimation modeling for the 3D printer manufacturing process.15,16 However, no efficient machine learning (ML) method is available to predict energy consumption in the fused deposition modeling (FDM)-based AM process.
Knowing the relationship between process parameters is essential for controlling energy consumption in AM.17,18 While there are many studies on the surface roughness and mechanical properties of a part produced in a 3D printer, research on energy consumption still needs to be done.19,20 Gutowski et al. demonstrated that energy efficiency in
The results showed that the FDM printing process consumes more energy than the material acquisition, postprocessing, and shipping stages. Baumers et al. compared and evaluated the power consumption of the polymer laser sintering platform. 25 Yoon et al. presented a comparative study on the energy consumption at the process level for AM processes. 26 Murphy et al. applied the deep learning algorithm to estimate the part mass and support material mass. 27 This prediction model has low accuracy, with determination coefficients of 46.8% for the part mass and 30.1% for the support material mass. Energy and material consumption vary according to AM technology process parameters, and environmental impacts differ.
Based on the studies mentioned above, little work has been done to develop an efficient model based on part orientation to predict and minimize energy use in 3D printing manufacturing. In our current work, four popular ML algorithms are used to create an efficient model that best predicts the energy consumption in the AM process. These algorithms are Gaussian Process Regression (GPR), Support Vector Machine (SVM), Linear Regression (LR), and Decision Tree Regression (DTR).
This study estimates the energy consumption in the fabrication process with 3D printing based on FDM technology. This technology is one of the most preferred methods in AM because of its ease of supply and cheapness. The working principle of FDM is based on the extrusion of melted thermoplastic filaments to produce 3D parts using polymer materials. In this method, many parameters affect the product's print quality, such as layer thickness, bed temperature, nozzle temperature, printing speed, and fill rate.
In this study, real-time experimental results of energy consumption are modeled for the production of ASTM 638 type tensile specimen by AM method using four ML algorithms. Thermoplastic acrylonitrile butadiene styrene (ABS) material was used to produce the samples. While creating the experimental design, the factors affecting energy consumption in AM were determined as layer thickness, infill volume, table temperature, and printing direction. Many experimental data samples are obtained through design experiments, and the model is trained with MATLAB to get the relationship between process parameters and energy. From the simulation results, it has been determined that the prediction accuracy of the GPR method is high against other ML methods. With the GPR model, we can choose the appropriate direction of the part to be produced to reduce energy consumption. This prediction model can be used with FDM to stimulate ideas for new designs.
This study has three main aims:
Predict the energy use of FDM-based additive manufactured parts. Evaluate the effect of specified printing parameters on energy consumption. Calculating average optimal printing parameters and energy consumption with ML methods.
Materials and Methods
Experiment apparatus
Knowing the final energy consumption is very important to save costs and shorten the printing time of produced parts. In FDM prints made with a 3D printer, the production time even exceeds 24 h depending on the size of the part. The main reason why this process takes a long time is that the printing parameters cannot be determined at the optimum level. For this reason, in this study, analyses were made with different ML techniques to find the best printing parameters of samples printed with FDM using
Experiments designated for this study were produced using an FDM-based 3D printer with a red ABS. This printer is an FDM-based ZAXE X1 type brand, as seen in Figure 2. In total, 81 test specimens were produced. Energy consumption was noted at the end of each experiment. ASTM 638 type tensile specimen was used for the experiments. The technical drawings and dimensions of the test specimen are shown in Figure 1.

The specimen dimensions (mm) for energy consumption test.
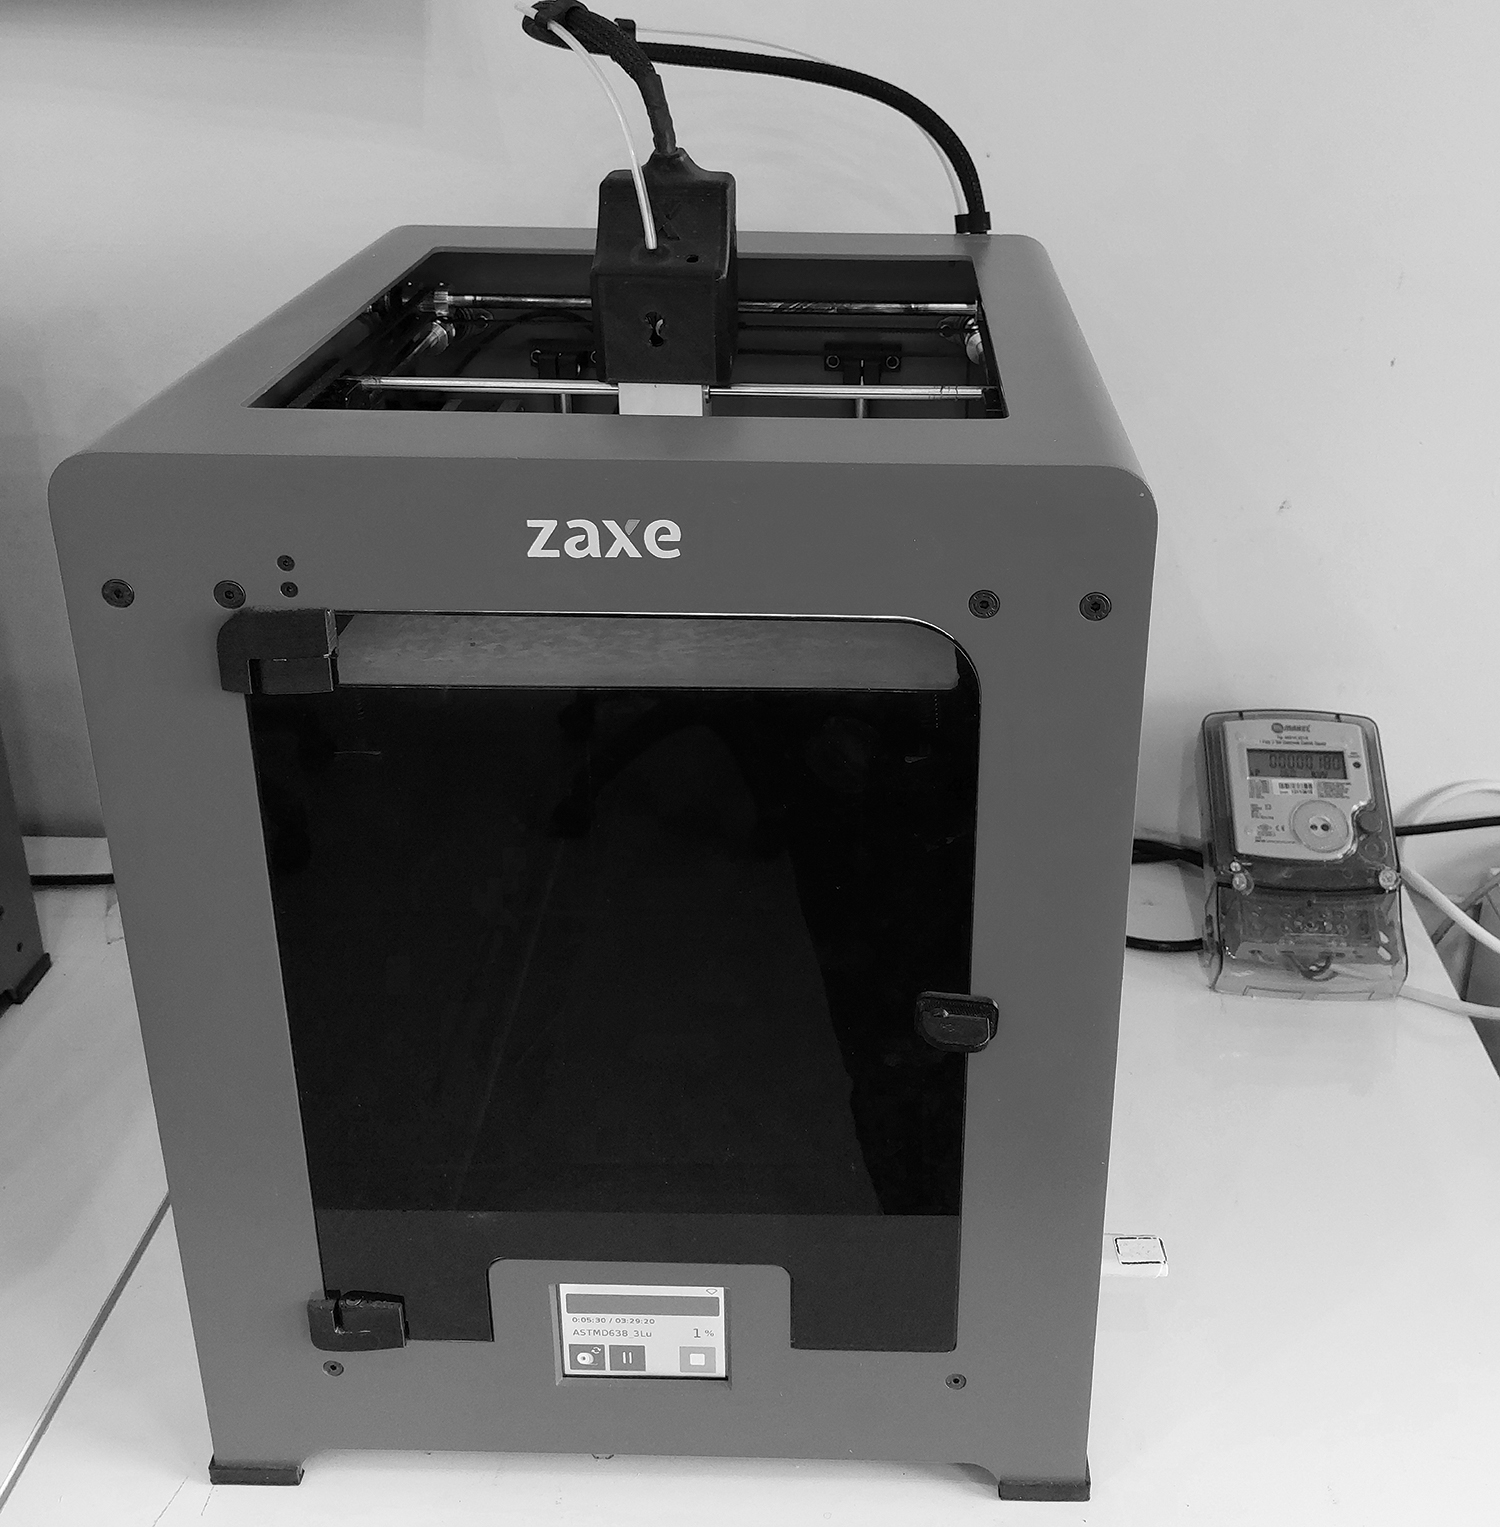
3D printing equipment and single phase energy meter.
3D printing is a process for the fabrication of 3D solid objects from a digital file. To create an object, it starts to create the object with the layered production technique. Each of the layers is stacked one after the other and the object begins to form. Each of these layers is seen as thin slices in the horizontal section of the object. In the AM process, the model is first designed in 3D in computer-aided manufacturing (CAD) software and the files are saved in standard triangle language format. This file is then imported into ZAXE's slicing program.
After the necessary parameters are entered in this program, a set of G codes is derived that tells the printer to print the desired geometry layer by layer as needed. This code is transferred to the 3D printer with the help of USB and the production process is started. At the end of the production, postprocessing such as sandblasting and painting is carried out, if desired, to remove the part from the table and clean it from the supports. These steps were repeated for each test sample.
In this study, the experimental setup created with a 3D printer and a single-phase energy meter is shown in Figure 2. An energy meter can measure harmonics, voltage, current, power, and other conventional measurements. The energy consumption of each sample during printing was measured with this meter. It is known that the ambient temperature will affect the power consumption of the bearing used. For this reason, experiments were carried out at room temperature to minimize the effect of the outside temperature.
The main purpose of this experiment is to measure energy consumption, but to reduce data preparation and computation time, data are averaged and output is taken every 1 s. A total of 81 test samples were produced with different printing parameters. The images of some ABS samples produced are given in Figure 3.

Some test samples fabricated with a 3D printer.
Experiment procedure
Before the samples were produced on the 3D printer, the experimental design was prepared. In this design, factors and levels need to be determined. When studies that may be similar are examined, many parameters affect energy consumption in the FDM 3D printing process, such as extrusion speed, print volume, extrusion temperature, amount of support, layer thickness, and table temperature. Layer thickness and infill volume are the most critical parameters affecting the FDM printing process. In addition, the printing direction parameter, which has yet to be examined before, was also observed in this study.
Each set of measurements begins with a 5-min background measurement before the printer warms up. Based on experience from many experiments, four main parameters, including layer thickness (μm), fill volume (%), table temperature (°C), and printing direction (axis), were chosen to examine their effect on energy consumption. The determining factors and their levels are given in Table 1. Moreover, each test was repeated twice to develop the reliability of observed data.
Factors And Levels For Design of Experiment
To achieve success in ML, appropriate input and output variables must be determined. Through many experiments, 81 data points were selected to model energy consumption. Thus, there are 81 data points consisting of four input variables and one output variable. The layer thickness (μm) factor, one of the input variables, consists of three levels. These were determined as 100, 200, and 300 μm, respectively. We set the second factor as infill volume (%). Levels in this factor were determined as 30%, 60%, and 90%, respectively. The third factor is the table temperature (°C). The levels are 80°C, 90°C, and 100°C, respectively. The last factor mentioned is printing direction. The levels here are determined as XY, XZ, and ZX axes.
ML algorithms
Gaussian process regression
GPR is a nonparametric Bayesian approach to regression that makes fluctuations in the field of ML.
28
GPR has several benefits, where it works well on small datasets and can provide measures of uncertainty over predictions. GPR calculates the probability distribution over all acceptable functions suitable for the data. The regression model function is expressed by the following equation.
29
In Equation (1), y is the response variable and x is the input variable. Additive noise

The mean function m(x) and the covariance function
Assuming
Here I denotes the unit matrix. The covariance function is the central component in the GPR model, so function selection is very important. It is the most used quadratic exponent in the literature from different functions such as linear, exponential, Matérn, rational quadratic, and squared exponent. The reason for this can be explained by the fact that the function is infinitely differentiable and therefore uniformly distributed. The squared exponential function used as the covariance function in this study is shown in Equation (6).
In Equation (6),
Support vector machine
SVM is a supervised learning method that learns from a dataset and can be used for both regression and classification. 31 The purpose of the algorithm is to find a decision boundary between the two classes that are maximally distant from any point in the training data. The method provides flexible control over the model complexity, so it gives successful results in solving nonlinear problems even with a small training set. Contrary to classification, in regression, error minimization is carried out by ensuring that the error remains within a certain threshold value so that the maximum data remain within the hyperplane boundaries. 32
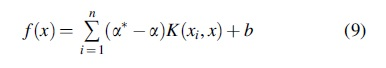
The nonlinear SVM tries to find a regression function expressed by
Here C is a predetermined parameter and is an adjustment parameter that balances between adaptation of errors and flatness of the regression function.
After solving Equation (8), we can find the expression
Here
Hyperparameters must be carefully tuned for a successful SVM model. Low C values can cause flat functions, while high C values can cause overlearning. On the other hand, a high
Linear regression
LR is a supervised learning algorithm. It aims to fit the problem into a linear hypothesis. 34 When two or more input parameters are involved, it is called multivariate LR. The algorithm assigns coefficients to the variable and then the output value is estimated. The difference between the actual and estimated value is called the cost. The cost value here is estimated by finding the distance between the actual data point and the regression line. 35 The following equation defines the mathematical formula for LR:
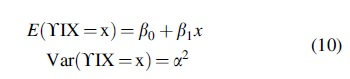
This model is created with the mean function. Here is a linear equation combining a set of input values  , representing the predicted value. The
  with
with

where ei is the error calculated in estimation, which depends directly on the unknown parameters.
Decision tree regression
In many studies, a number of methods are needed when performing certain operations to make the best decision about the problem at hand. 36 Among these methods, the DTR is the most widely used one among the classification models, which provides convenience for the decision maker to understand the problem, and has high reliability. We can use the decision tree algorithm for both regression and classification. The decision tree method tries to find the best order in predicting the target by performing many tests. Each test creates branches in the decision tree, and these branches cause other tests to occur. This situation continues until the test process terminates at an end node. 37
The tree structure will change as we have more data. Maybe even more branches. This means that the algorithm draws much more constraints. While it will give much better results when classifying, it can draw too many boundaries when regressed. It is more used in solving regression problems than classification, as it gives the value of values that come within the boundaries it draws, like the mean.
Results and Discussion
Energy consumption results
This study uses experimental data to train ML algorithms to predict energy consumption in the FDM process. As a result of the determining factors and levels, a total of 81 samples were produced. The energy consumption of each sample was noted in turn. The measurement results obtained are given in Table 2. In this table, it is read to which factor and level the measured values belong. As can be seen from the table, the energy consumption amount for each measurement was calculated in Watt-hour (Wh).
The Printing Experiments Data
The highest energy consumption value was measured in experiment number 21. The layer thickness in this experiment is “100 μm,” the infill volume is “90%,” the table temperature is “80°C,” and the printing direction is “ZX.” The lowest energy consumption value was measured in experiment number 61. Here, the layer thickness is “300 μm,” the infill volume is “30%,” the table temperature is “100°C,” and the printing direction is “XY.” From these results, it is observed that layer thickness and printing direction seriously affect energy consumption. The increase in layer thickness affects energy consumption by about 50%. It is possible to obtain smooth parts with low layer thickness. However, this increases energy consumption.
Likewise, the printing direction of the piece being ZX; in other words, placing the piece in an upright position increases energy consumption significantly. The printing direction is ZX, which increases energy consumption by ∼95%. Although the effect of infill volume on energy consumption is less than others, it increases energy consumption by ∼9%. Of these input parameters, only the increase in the table temperature reduces the energy consumption. This rate is around 7%. The fact that the table is hot ensures faster fabrication of the part. Therefore, it reduces energy consumption. Experimental results showed that the printing direction and layer thickness are the main factors affecting energy consumption.
ML algorithm results
In this study, we propose a model to predict energy consumption in 3D printers from data obtained with the experimental setup. Four ML algorithms were used to find the most effective model. These algorithms are GPR, SVM, LR, and DTR. Before training these algorithms, it is necessary to prepare and perform some operations on the data set. The flow chart of the ML process is given in Figure 4.
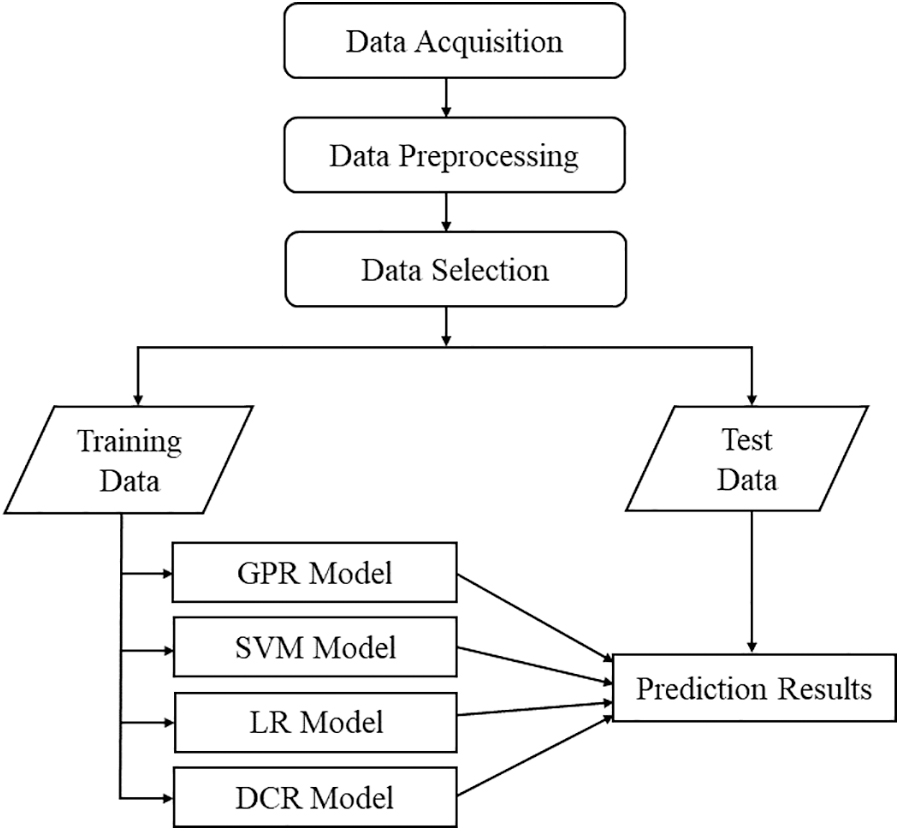
Machine learning process flowchart. DTR, Decision Tree Regression; GPR, Gaussian Process Regression; LR, Linear Regression; SVM, Support Vector Machine.
The processes begin with the creation of the experimental setup and the collection of necessary data from this setup. Measurement and other errors in the collected data are eliminated. Error-free data are organized so that it can be used in ML. Before performing the regression analysis on the dataset data, data preprocessing was performed, and the data were standardized. “XY,” “XZ,” and “ZX” data in the “Printing Direction” field were digitized as “1,” “2,” and “3,” respectively, using the label encoder method.
In addition, since the data in the “Energy Consumption” field consist of large numbers, the data were normalized using the min-max normalization method over these data, and the values here were converted to values in the “0–1” range. After data preprocessing, it was observed that the regression estimations gave better results. The data are used in two groups training data and test data. This study used 80% of all data for training and 20% for test data. First, the training was carried out with the ML methods. By using the training models obtained through these methods, predictions were produced with the test data. To evaluate the performance of ML approaches, five statistical indicators were calculated: mean square error (MSE), mean absolute error (MAE), root mean squared error (RMSE), R-squared (R 2 ), and explained variance score (EVS).
The values corresponding to the actual energy consumption data were written to evaluate the results of data analyzed in the range of 0–1 during normalization. As a result, the minimum energy consumption is 90 Wh, while the maximum value corresponds to 740 Wh. The process parameters in Table 2, layer thickness, infill volume, table temperature, and printing direction, and the model results developed based on an estimation that relates the energy consumption to the process parameters are given in Figure 5 graphically. This figure shows a graphical comparison process between the actual energy values and the estimated energy for each part according to their different orientations using ML algorithms. Some models predict results closer to actual values. The model based on the GPR method very well predicts the behavior of the energy consumption response with little deviation.
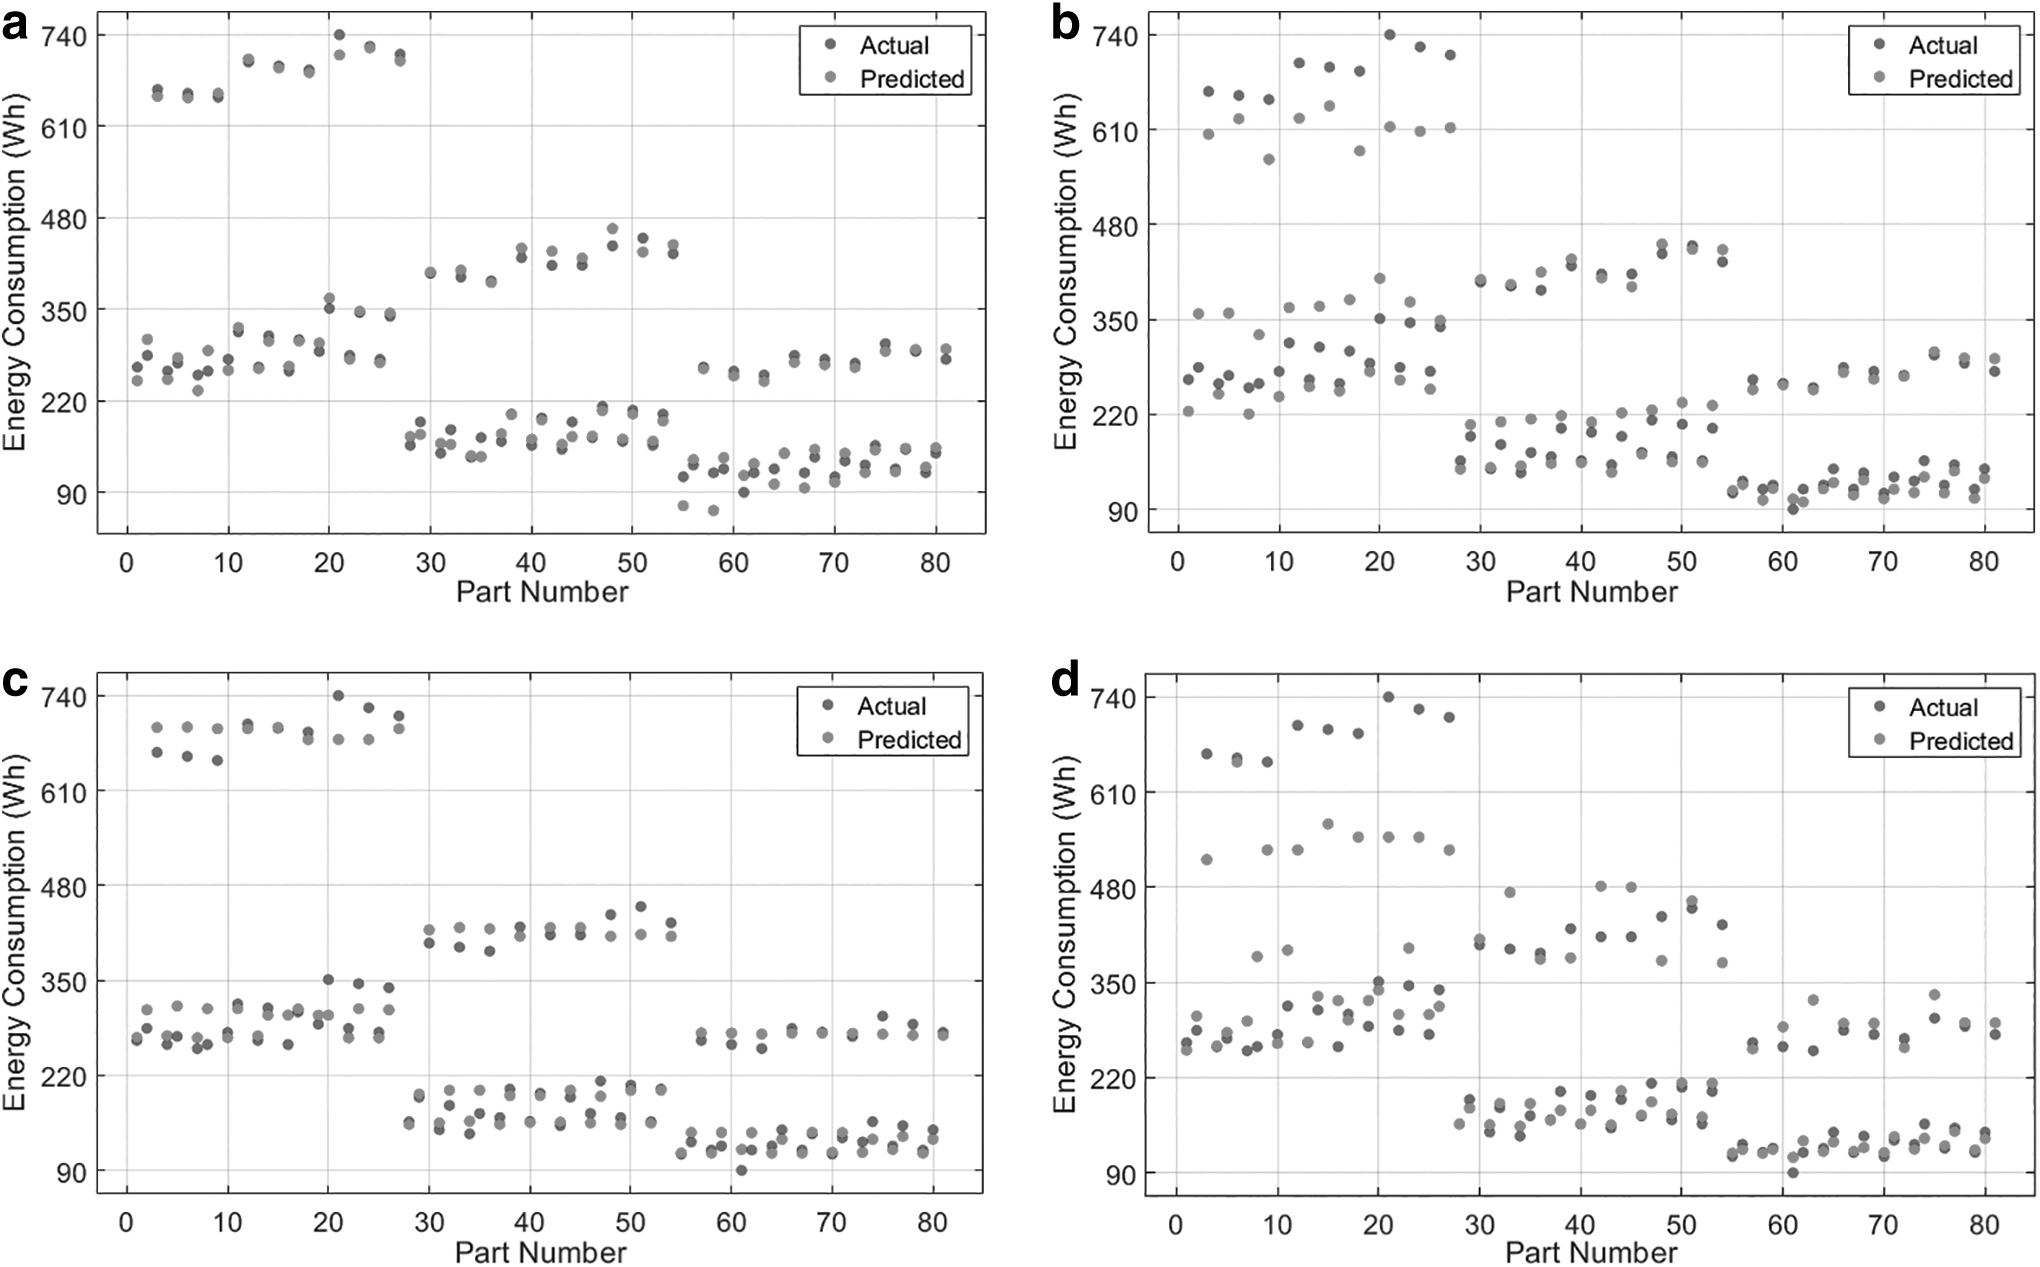
Actual and predicted energy consumption values for each part with prediction algorithm.
This study performed hyperparameter optimization in ML models using Bayesian optimization. This optimization allows an intelligent hyperparameter selection process instead of a random search in the hyperparameter space. This process uses the results of the previous iteration to decide the next set of hyperparameters, which will improve model performance. Optimization studies were carried out using the MATLAB program. The results of the improved estimation model as a result of the optimization study are given in Figure 6. It is seen that the best answer among the ML methods is the GPR method. In addition, the DTR method has a high rate of improvement.
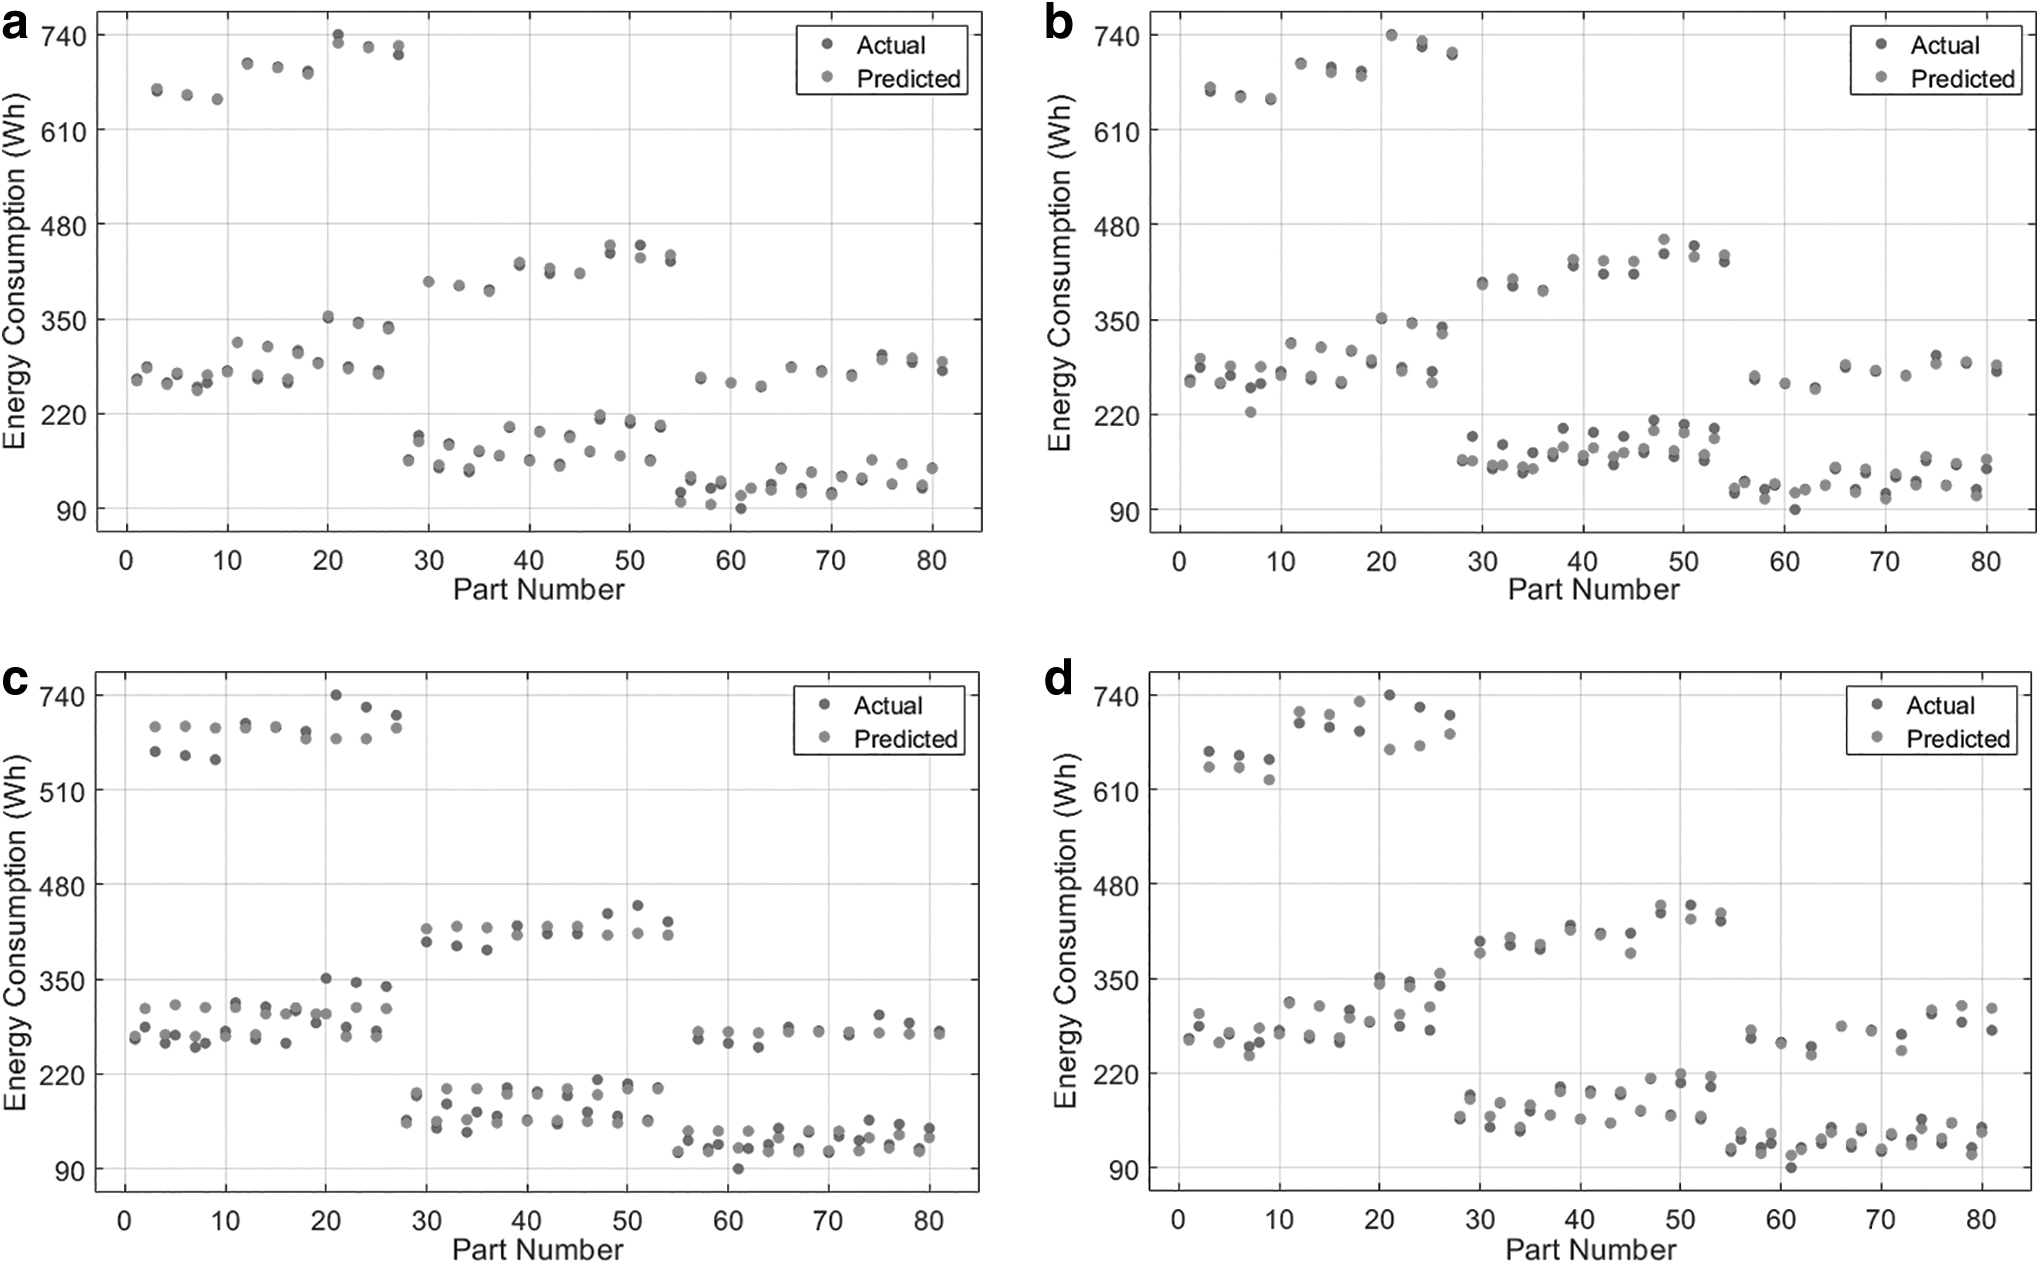
Actual and estimated energy consumption values for each part with optimization prediction algorithm.
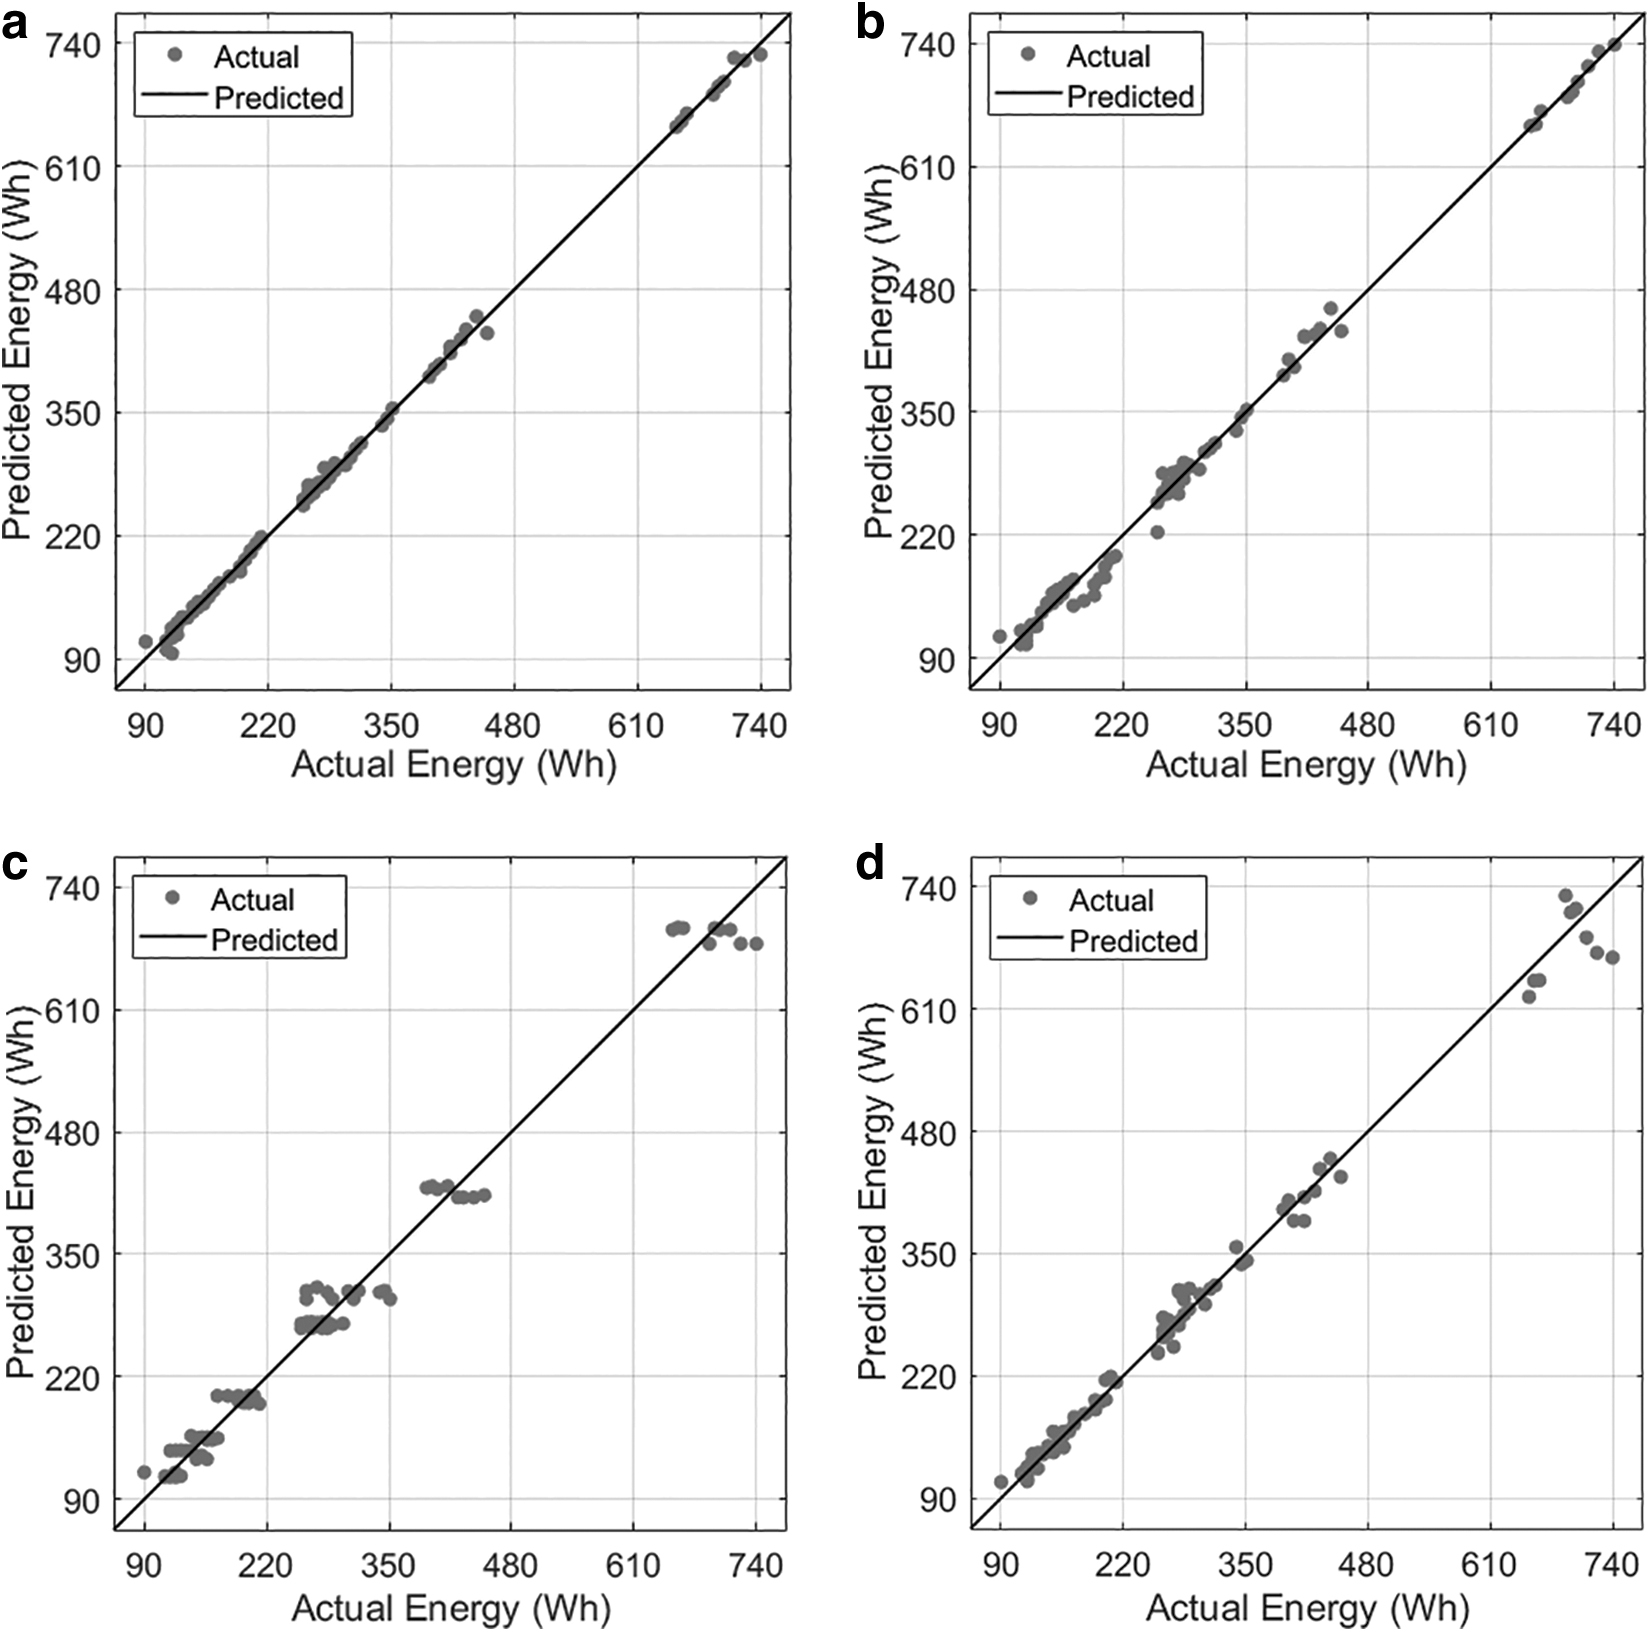
The trend line between the actual and predicted values of each prediction ML algorithm is shown in Figure 7. As seen in Figure 7a, the difference between the measured and predicted values in low energy consumption values in the GPR method is less. However, it is farther apart in the higher value range.

Regression diagram of actual and predicted validation data.
A similar situation is observed in the SVM, LR, and DTR methods in Figure 7b–d, but the difference between them is much more significant. When all the results are evaluated together, it is evaluated that the success of the DTR method is lower than other methods, but it still produces usable results. It is seen in Figure 7a that the estimation results obtained by the GPR method are excellent. It is thought that the accuracy of estimation results produced by the methods is at different levels due to the algorithm of methods used, the number of data, and the applied area.
The trend line obtained as a result of the hyperparameter optimization study is given in Figure 8. As a result of the optimization, it is seen that there is a decrease in error rates from all graphs. It is clear from Figures 7, 8, and Table 3 that the GPR estimation model achieved the highest precision with 99.84% as the EVS value.
Optimized regression diagram of real and predicted validation data.
Error Comparison for Different Machine Learning Models Before Optimization
DTR, Decision Tree Regression; EVS, explained variance score; GPR, Gaussian Process Regression; LR, Linear Regression; MAE, mean absolute error; MSE, mean square error; RMSE, root mean squared error; SVM, Support Vector Machine.
The results of statistical approaches made to evaluate the quality of results obtained in Figures 5 and 6 are shown in Table 3. First, in this study using 80% of data for training and 20% for testing in Table 2, it was found that the MAE was <5% and the coefficient of determination (R 2 ) was more significant than 0.89. The GPR method has the highest R2 and EVS and the lowest MSE, MAE, and RMSE. Compared to other models, these values seem to be the best. The most successful model parameters are shown among the models where the R2 value approaches 1, and the MSE value approaches 0. Other error rates appear to be within the acceptable range for all ML methods. The data in Table 3 show that the above-related experimental results have a high analysis accuracy and precision, and the error can be controlled within the requirements.
As a result of the hyperparameter optimization study, it is seen in Table 4 that the errors in the prediction model have decreased significantly. Looking at the table, the best performance result is seen in the GPR method. There is a significant improvement in the DTR method. These studies have revealed that the studies conducted with the ML method yield very close results to the energy consumption values measured in real experimental setups.
Error Comparison For Different Machine Learning Models After Optimization
The minimum MSE results of ML algorithms are shown in Figure 9. These results were obtained from the hyperparameter optimization made in the MATLAB program. Hyperparameters refer to parameters the model cannot learn and must be provided before training. For any ML algorithm model, the application tries different combinations of hyperparameter values using an optimization scheme that tries to minimize MSE and returns a model with optimized hyperparameters. Bayesian optimization was used in this study, which was tuned for 30 iterations.

Minimum MSE plots obtained after adjusting the optimization hyperparameters.
In the graphs in Figure 9, the yellow dot indicates the iteration corresponding to the hyperparameters giving the minimum observed MSE, and the light blue dot denotes the MSE value calculated during the optimization process by changing the hyperparameters of algorithms. Dark blue dots correspond to the observed minimum MSE calculated so far by the optimization process. The red square represents the iteration corresponding to the optimized hyperparameters. It can be noted that the error varies depending on the combination of hyperparameters of the ML algorithms of the minimum MSE value. The highest minimum MSE values are 0.06, 0.16, 0.006, and 0.04 for GPR, SVM, LR, and DTR, respectively. The results in Figure 9 show that the best model is the GPR method. The best model has a Sigma of 0.058833, a linear basis function, and a nonisotropic squared exponential kernel function.
Conclusions
Characterizing and modeling the energy consumption model of systems produced by
This study uses four ML algorithms to model and predicts the energy consumption in the AM process of ASTM 638-type tensile specimens. Real-time energy consumption data were measured using an FDM-based 3D printer. In total, 81 measurements were made. Eighty percent of these data were used for training and 20% for testing. Experimental results showed that the printing direction and layer thickness are the main factors affecting energy consumption in the 3D printing process.
A functional relationship has been developed between the printing parameters and the energy demand of FDM technology using ML algorithms. However, optimal parameter settings have been found using hyperparameter optimization, one of the current evolutionary approaches. To evaluate the performance of ML methods, five statistical indicators were calculated: MSE, MAE, RMSE, R2, and EVS. It has been seen that the GPR predicts energy consumption in the
The next study will focus on the printing process in terms of the whole life cycle to develop a sustainable green
Footnotes
Authors' Contributions
Conceptualization, O.U., M.S.B., and M.K.; methodology, O.U., M.S.B., and M.K.; software, O.U. and M.K.; validation, O.U., M.S.B., and M.K.; formal analysis, O.U. and M.S.B.; investigation, O.U., M.S.B., and M.K.; resources, O.U., M.S.B., and M.K.; data curation, O.U. and M.S.B.; writing—original draft preparation, O.U. and M.K.; writing—review and editing, O.U., M.S.B., and M.K.; visualization, O.U. and M.S.B.; supervision, M.S.B. and M.K.
Author Disclosure Statement
No competing financial interests exist.
Funding Information
No funding was received for this article.