
Abstract
Material extrusion (MEX) enables the economical manufacturing of complex parts and small lot sizes. The quality of the additive manufactured parts is significantly influenced by process parameters, which are defined beforehand. However, the resulting part quality is often unknown, leading to a reduced applicability of the process and relatively high safety factors for the process parameters to ensure a certain quality. This results in long print times and high material consumption. This article aimed for an accurate prediction of the linear dimensional accuracy in X, Y, and Z direction of parts manufactured with MEX. A neural network (NN) was used with a hyperparameter tuning based on an evolutionary algorithm. The developed NN achieved a mean absolute percentage error (MAPE) of 1.3% or lower for X and Y direction and 2.3% for Z direction by testing random parameter combinations (parameter sets). Moreover, when dealing with random and untrained interval lengths, the NN achieved a MAPE of 0.6% for X and Y direction and 3.3% for Z direction. The results show that the NN model achieved a more accurate and robust prediction compared with a multiple linear regression. The performed research fills an existing gap by developing a powerful NN model that enables the accurate prediction of linear dimensional accuracy based on used process parameters. The implications for practice are significant, as these prediction models can be readily used to improve the parameter settings for MEX and ensure that the desired accuracy levels are met. With further exploration of additional dimensional features and advances in data sharing techniques, the findings pave the way for future research to push the boundaries of accurate dimensional prediction in the field.
Introduction
Material extrusion (MEX-TRB/P), hereafter referred to as MEX, enables the rapid manufacturing of plastic parts at low cost and allows the economic manufacturing of small quantities. As the equipment became more affordable and the resulting part quality improved, the MEX process has matured into a lucrative manufacturing alternative. Process parameters—such as infill density, number of shells, and layer thickness—are of crucial importance for the resulting part quality. 1 Compared with most conventional manufacturing processes, where part properties highly depend on material properties, the quality of the additively manufactured parts depend to a high extent on predefined process parameters.
As a result, the achieved quality is mostly unknown. On one hand, this limits the applicability of the MEX process. On the other hand, this leads to the use of high filling densities, low print speeds, and a high number of surrounding perimeters to ensure high quality, which increases material costs and print time. With an accurate prediction of quality characteristics, the quality of parts can be compared with the already estimated print time and material cost, which are usually output in the slicer program, resulting in highly optimized print jobs.
In addition, the prediction can be used to test the suitability of the MEX process for a particular use case. However, a prediction model for dimensional accuracy with acceptable prediction accuracy and practical applicability is missing.
Therefore, this publication aims to predict the linear dimensional accuracy in X, Y, and Z direction of MEX manufactured parts, allowing to vary parameters and targeted dimensions freely in predefined parameter ranges. In this article a neural network (NN) approach is used with a hyperparameter tuning based on an evolutionary algorithm. The results of this article enable identifying a suitable parameter set based on the linear dimensional accuracy. Combined with existing prediction models it can be extended to evaluate multiple quality characteristics, time, and material cost.
This publication gives researchers and practitioners an approach to accurately predict the linear dimensional accuracy of MEX-manufactured plastic parts. The generated data and the prediction model can be used without modification and can be adapted for deviating use cases. In addition, the use of NNs enables promising approaches such as transfer learning, which allows the use of existing prediction models for slightly different use cases to reduce the required training data volume, and federated learning, which enables training prediction models by multiple companies without compromising the confidentiality of their proprietary information to increase the training data volume.
In the following, the used error metrics to evaluate the prediction accuracy of models and the current state of the art are presented. Subsequently, the used approach and the test sample are described. In the “Results” section, the measured data are analyzed and the resulting prediction accuracy is evaluated and compared with a multiple linear regression (MLR). The effect of the findings and results of this article are discussed in the “Conclusion” section.
Predicting Dimensional Accuracy in MEX: State of the Art
Error metrics for prediction accuracy
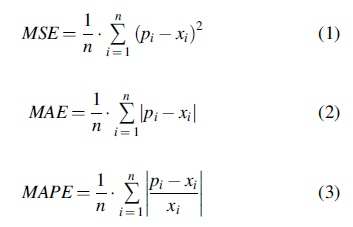
The performance of the prediction models is evaluated by common error metrics: mean squared error (MSE) (Eq. 1), mean absolute error (MAE) (Eq. 2), mean absolute percentage error (MAPE) (Eq. 3), and root mean square error (RMSE) (Eq. 4). 2 They are calculated using the predicted value pi, the measured value xi, and the number of samples n. Additionally, the number of outliers is used to describe the prediction results. An outlier is detected using the absolute percentage deviation (division within the absolute value bars in Eq. 3). This article detects a parameter set as an outlier if the value is more than one and a half times the interquartile range below the first quartile or above the third quartile.
Predicting dimensional accuracy
Besides dimensional accuracy prediction, multiple research activities investigate the influence of process parameters on the dimensional accuracy with an experimental approach.3–5 Other related research focuses on optimizing dimensional accuracy in postprocessing 6 or trying to reduce shrinkage in the MEX process. 7 An approach to increase the accuracy between parallel faces in MEX was developed by Noriega et al. using a NN model. 8 However, the approach does not consider process parameters and is based on the location of the material deposition. Boschetto and Bottini used a geometrical model of the extruded filament in dependence of the deposition angle and layer thickness to predict the part dimensions. 9 Nevertheless, the achieved prediction accuracy was not stated with common metrics and solely two parameters—deposition angle and layer thickness—were varied. Akbaş et al. used a linear regression and a numerical method to observe the effect of nozzle temperature and feed rate on the dimensional accuracy of holes. The regression method resulted in the best accuracies with a MAPE of 2.2% with a maximum prediction error of 9.7%. 10
Vyavahare et al. used a regression model to predict the dimensional accuracy of an outer pyramidal region and an inner conical region of a pyramidal part, achieved prediction accuracies ranging from a MAPE of 2.3% to 15.0%. 11 The results showed that the developed model had a high variation in prediction accuracy and therefore a high number of outliers, which significantly reduces the robustness of the developed prediction model.
Yang and Zhang predicted the dimensional accuracy based on process parameters, in detail layer thickness, filling speed, extrusion speed, fallback speed, and layer width offset. The used NN was trained and tested with 32 H-shaped samples. 12 A stated prediction accuracy using common metrics was missing and the predictions were based on trained parameters steps. This leads to a low applicability of the developed NN, as the prediction accuracy of the NN is not verified for freely varied parameters. Mohamed et al. used a NN approach to predict the dimensional accuracy of length and diameter of cylinders and achieved a percentage deviation lower than 9.0% by testing three samples. 13 However, the scatter of lengths of the trained samples were lower than 1.4%. This indicates that the achieved prediction accuracy may be inaccurate as the data set itself scattered only slightly.
Sharma et al. predicted the dimensional accuracy of shafts, holes, and rectangular slots using a decision tree regression algorithm. The model was trained with a data set of 33 samples for acrylonitrile butadiene styrene material and 26 samples for polylactic acid material varying the process parameters, wall thickness, infill density, build plate temperature, print speed, layer thickness, and extrusion temperature. 14
The authors claim that the developed prediction approach leads to satisfactory prediction results without stating the accuracy of the algorithm using common metrics or state the differences of predicted and measured values.
The presented research lacks in providing an applicable approach for linear dimensional accuracy prediction. The existing approaches lack in observed parameters, achieved prediction accuracy, and applicability. Most conducted research focused on predicting the part length, width, and height and did not consider the prediction of part features. The existing literature predicts mostly equal dimensional distances without verifying their achieved prediction accuracies for deviating distances. The prediction accuracy is mostly tested with trained parameter steps resulting in fixed parameter steps for the selection process, leading to a low applicability.
This article presents an approach of predicting the linear dimensional accuracy in X, Y, and Z direction based on the length and direction of the dimension and the used process parameters. The prediction accuracy is tested using randomly varied parameter sets and targeted lengths. Therefore, the model does not depend on predefined parameter steps, which increases the applicability for practice. The results are compared with an MLR and evaluated using the common metrics MSE, MAE, MAPE, RMSE, and outliers. Overall, this article aims to fill the aforementioned research gaps and uncertainties to provide an applicable method to predict linear dimensional accuracy with an acceptable accuracy.
Methods and Approach
Used sample, equipment, and software
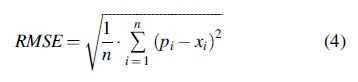
A sample, based on DIN EN ISO/ASTM 52902, was used for training and testing of the prediction models. 15 Therefore, the linear sample was orientated in X, Y, and Z orientation and merged to one sample (Fig. 1). Other features, for example, cylinders, holes, roundings, and wall thicknesses were included within the sample to enable further prediction attempts on other characteristics in case of a success of this work. The sample was created using the software Autodesk Fusion 360 and was already used successfully for a printer benchmarking. 16 For manufacturing, a Prusa i3 MK3S+ without enclosure was used with glycol-modified polyethylene terephthalate (PETG) from Prusament. The slicing was performed with the associated software Prusa Slic3r.
Test sample with marked measuring intervals.
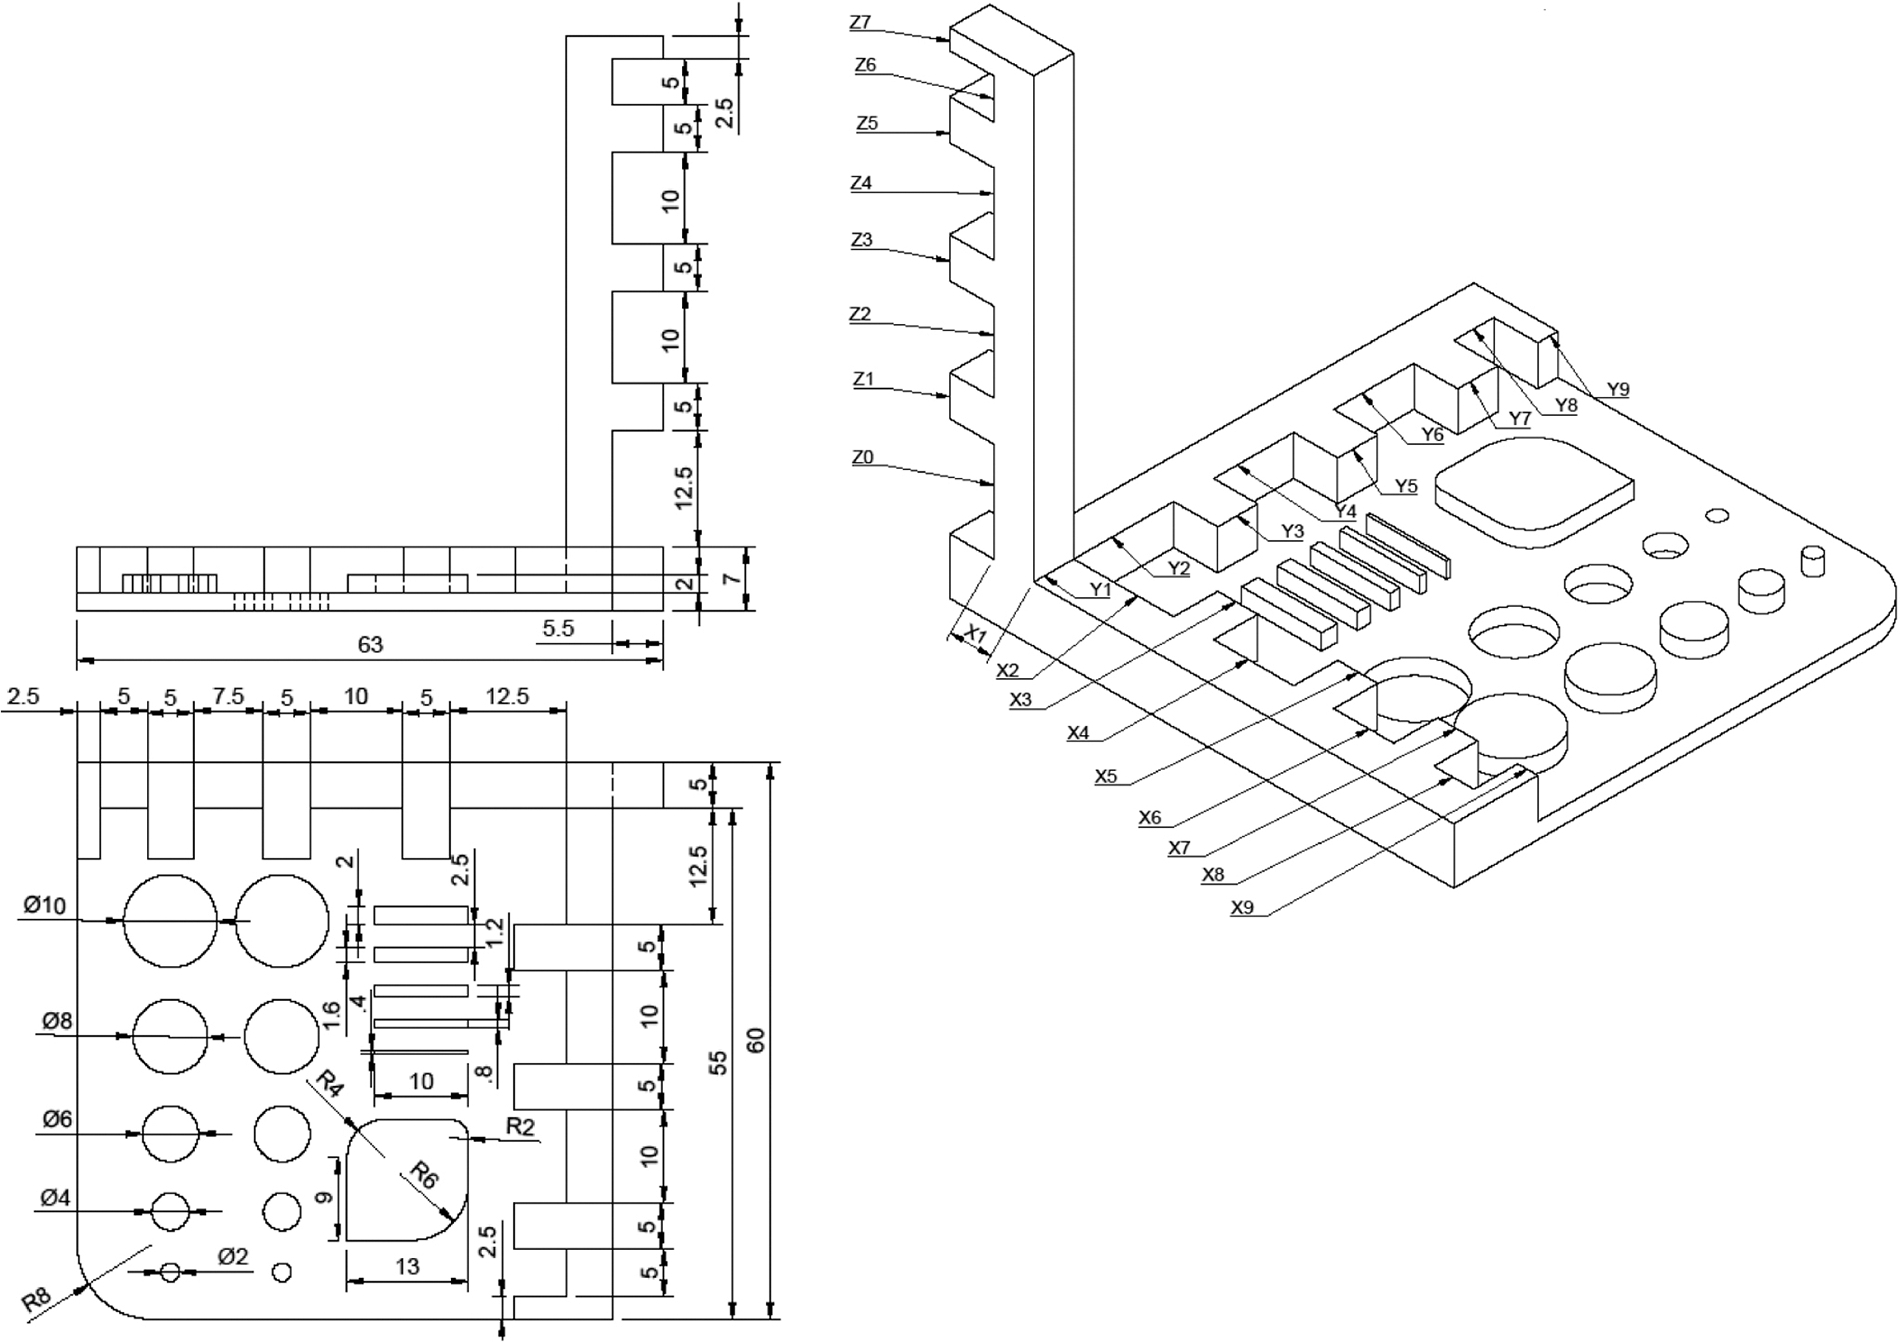
An optical microscope VHX-5000 from Keyence was used for measuring with an accuracy of 0.001 mm. In X and Y directions, nine intervals were measured. In Z direction, seven intervals were measured since the used microscope did not allow measuring the Z-bar while connected to the sample. The required distance for optical focus was too small. Therefore, the Z-bar was gently cut with a side cutter in interval 0 and without putting pressure on the part to prevent deformation of the other intervals. A picture of the printed sample is shown in Figure 2. In this work, several software were used, which is stated in Table 1.
Printed test sample.
Used Software and Version
Used measuring approach
In this work, the linear dimensional accuracy in X, Y, and Z orientation is measured using the mean distance between two linear edges based on the microscope software. An exemplary measurement is visualized in Figure 3. The measuring intervals are marked in Figure 1. Each measured distance is used as an input for the NN approach.

Exemplary measurement of a linear direction in this case X direction.
Observed parameters, value range, and data reduction method
The dimensional accuracy is mainly influenced by the process parameters' layer thickness, air gap, build orientation, raster width, raster orientation, print speed, and extrusion temperature. 1 The investigated parameters and their limits for training are given in Table 2. The prediction model is trained with the parameter sets of all combinations of the minimum and maximum values (Min-Max data reduction). This leads to 32 parameter sets for training (Table 3; ID 1 to 32). In former investigations, targeting a tensile strength prediction, 17 a Min-Max data reduction resulted in an acceptable prediction accuracy by using a heavily reduced data volume. Twenty-four random parameter sets were defined for testing the prediction accuracy (Table 3; ID T_1 to T_24). The parameters ranged randomly between the minimum and maximum values. The print speed was varied randomly between the modes quality (mode 1), middle (mode 2), and speed (mode 3), and the layer height was varied randomly between 0.1, 0.15, 0.2, and 0.3 mm as the printer solely allowed these parameter values.
Overview of the Value Range of Each Parameter
Parameters of the Reduced Training Data Set (ID 1 to 32) and Random Test Data (T_1 to T_24)
Used prediction approaches
In this article, a feedforward NN was used to predict the dimensional accuracy. The NN had an input layer, one up to three hidden layers with built-in dropout and an output layer. A possible resulting NN is visualized in Figure 4. Each variable parameter has an associated neuron in the input layer resulting in five input neurons. Additionally, the direction of the dimension and its length are given as input neurons. Dropout layers are used to randomly switch off neurons in the learning process to prevent overfitting, prevent coadaptation, and achieve better generalization by increasing robustness.18,19 In the output layer, one neuron provides the predicted value.

Exemplary structure of a neural network.
The learning process is described in Figure 5 using standardization of the data sets to obtain a scaled value xs based on the measured value xi, mean value

Used learning process for the neural network.
Hyperparameters and Parameters for Evolutionary Algorithm
As a next step, the best 40% of the individuals remain in the population, determined by the parameter retain. The other had a chance to maintain independent of their fitness, which is influenced by the factor random_select. This is used to maintain diversity within the population. Individuals who are not selected are eliminated. In the next step, the remaining individuals are used for variation to generate new individuals (children) with differing parameter sets to find better solutions. In this article, the approaches crossover and mutation were used sequentially. Crossover is a mix of parameters of existing individuals. Mutation introduces random changes to an existing individual. The parameter mutate_chance determines the probability that an individual will undergo mutation during the variation phase. The new population is than evaluated again ending when the parameter generation_maximum is reached. The fixed parameters influencing the evolutionary algorithm are listed in Table 4.
The MLR function is given in Equation (1). A least squares approach was used. The predicted value P is calculated using a constant b indicating the intersection with the ordinate, the determined regression coefficients β1 to β5, and the parameters x1 to x5 of the observed parameter set.
20
Results
Observed effects of input parameters on the dimensional accuracy
The absolute mean percentage deviation and the standard deviation of measured and target interval length were influenced by the orientation of the printed feature. In X and Y orientation, similar mean dimensional deviations were observed with an absolute difference of 0.1% for 5, 10, and 12 mm. Solely, a 2.5 mm length had a higher deviation of 2.0% (Fig. 6a). On the other hand, the dimensional accuracy in Z orientation exhibited higher fluctuations across all measured areas (Fig. 6b). The standard deviation in X and Y direction remained below 2.3%. However, in Z orientation a higher standard deviation of 4.3% was measured (Fig. 6b).

Measured dimensional deviations of measured and targeted length given in
When examining the printer's performance for distances with the same length, it was observed that the intervals X6 (mean absolute deviation = 2.1%), Y6 (mean absolute deviation = 2.6%), and Z6 (mean absolute deviation = 3.2%) exhibited lower absolute percentage dimensional deviations compared with other areas with the same length (X direction between 3.4% and 3.9%, Y direction between 3.6% and 3.8% and Z direction between 7.4% and 8.1%). This indicates that internal linear distances are more vulnerable to dimensional deviations compared with external ones.
The influence of process parameters on dimensional accuracy also varied depending on the dimension being examined. For instance, at a distance of 10 mm, it was observed that higher layer thickness and lower infill density resulted in improved accuracy (Fig. 7b). However, for a distance of 5 mm, the opposite trend was observed, where lower layer thickness and higher infill density led to an improved accuracy (compare Fig. 7a and 7b). The Z direction was found to be strongly influenced by layer thickness, while the X and Y directions were influenced mostly by layer thickness, number of shells, and infill density (see gradient in Fig. 7). Minimal differences were observed between the X and Y direction.

Main effects plot for
The examined parameters had varying effects depending on the length and orientation of the printed object. Therefore, the orientation and targeted length is considered as input neurons in the NN to enable an accurate prediction.
Achieved prediction accuracy
The prediction accuracy varied across the observed print directions (Fig. 8). The predictions in the X and Y direction achieved higher accuracies, with a MAPE of 1.3% or better (Fig. 8a). The predictions in the Z direction exhibited greater deviations from the predicted to measured values, resulting in a MAPE of 2.5%. Similar trends were observed when examining the MAE, where the X and Y direction predictions achieved a MAE of 67 μm or lower, while the Z direction predictions remained below 140 μm (Fig. 8b).
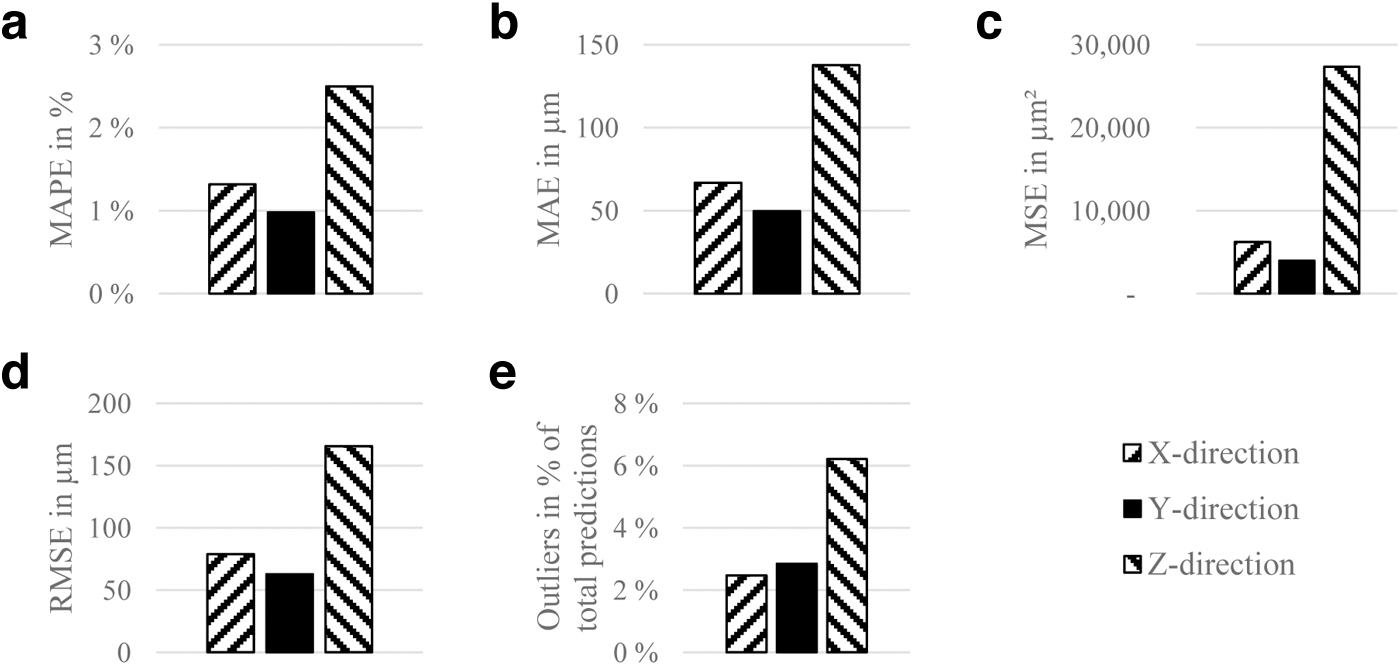
Achieved prediction accuracy of the neural network approach for the X, Y, and Z direction using
The MSE and RMSE values for the Z direction were notably higher compared with those of the X and Y direction, indicating a greater scatter in the predictions (Fig. 8c, d). This indicates that the prediction of the Z direction is associated with higher prediction errors. X and Y direction had similar error values, with a slightly better accuracy observed in the Y direction. Outliers, which represent predictions with significant deviations, were under 3.0% of the total predictions in X and Y direction (Fig. 8e). Considering that the interquartile range for these directions was low, this further demonstrates the high accuracy of the prediction model. Predictions in Z direction resulted in a higher count of outliers reaching 6.2%.
Overall, these findings highlight the varying accuracies of dimensional predictions based on direction in MEX processes. The X and Y direction predictions demonstrated higher accuracy and lower scatter, whereas the Z direction predictions exhibited greater deviations and increased scatter.
Despite the aforementioned advantages of the NN approach, it is necessary to compare its accuracy with commonly used approaches such as MLR. Consistent with the observations of the NN model, the MLR achieved better prediction accuracies in X and Y direction compared with the Z direction (Fig. 9). This indicates that the lower prediction accuracy in Z direction may be independent of the prediction approach and could be mainly influenced by the imprecision of the measured data, that is, by the higher inaccuracies of the MEX printer in Z direction and the influence of the used support material and its removal.

Comparison of the achieved prediction accuracy of the neural network and the multiple linear regression approach for the X, Y, and Z direction using
The NN approach achieved prediction accuracies comparable to those of the MLR model in the X and Y direction, despite the reduced input data volume of 32 parameter sets (Fig. 9). However, in the Z direction, the NN model outperformed the MLR model, achieving lower MAPE, MAE, MSE, and RMSE values (Fig. 9a–d, Z direction). The low count of outliers of the MLR was caused by the larger interquartile range as a result of a higher scatter of the prediction accuracy. The results indicate that the NN model is better equipped to handle the inaccurate and variable data of the Z direction. This suggests that the NN model has a greater capacity to adapt and learn from inaccurate data in the field of quality predictions in MEX. This becomes increasingly important when considering an industrial application where higher data inaccuracies are expected.
Prediction of deviating dimensions
Hitherto, the developed prediction models have been tested with random parameter sets and fixed intervals. Therefore, the reported prediction accuracy is solely verified by these. To increase the applicability of the prediction approach, four samples were developed and tested with random distances between 2.50 and 12.50 mm for the intervals X2 to X9, Y2 to Y9, and Z1 to Z7 (Table 5) and randomly chosen parameter sets T_5, T_8, T_14, and T_18. This procedure resulted in 100 tested intervals. The prediction was performed by the previously developed and trained NN and MLR models.
Target Value and Measured Accuracy in Percent of the Randomly Varied Random Interval Lengths of the Four Test Samples
The NN model achieved a MAPE of 0.6% or lower for the X and Y direction, even when dealing with intervals of varying lengths (Fig. 10a, left bars). Surprisingly, the NN model performed even better compared with the previous investigations of fixed interval lengths. In the Z direction, a MAPE of 3.3% was achieved. These results are also obtained by analyzing the MAE. A similar MAE was obtained in the X and Y directions, but the MAE in the Z direction was significantly higher compared with the fixed intervals (Fig. 10b, left bars). The results indicate that the NN model is capable of an accurate prediction of the linear dimensional accuracy of MEX parts considering varying interval lengths, with better accuracy in the X and Y directions, while still achieving satisfactory performance in the Z direction.

Comparison of the achieved prediction accuracy of the neural network and the multiple linear regression approach for the X, Y, and Z direction considering differing interval lengths using
When comparing the performance of the NN to the MLR model, it is observed that their MAPE and MAE values are relatively similar (Fig. 10a, b). The MLR model achieved lower MSE and RMSE values in the X direction, while the NN model achieved lower values in the Y direction (Fig. 10c, d). In the Z direction, both models exhibit similar performance levels, although in comparison to the other directions, the errors are relatively higher. As a result, these characteristics did not reveal a clear preference for either model.
However, the prediction by the MLR model resulted in a higher count of outliers with 11.1% outliers of the total predicted value in the X direction (Fig. 10e). Despite similar scatter of prediction accuracies, the NN model achieves a maximum of 3.6% outliers for all observed directions.
Overall, the results indicate that both prediction approaches—MLR and NN—are suitable for predicting linear dimensional accuracy, even when dealing with intervals of varying lengths. However, the NN model demonstrates fewer outliers while maintaining comparable prediction accuracy. Therefore, it is recommended to use the NN model for more accurate and robust predictions.
Critical appraisal
The performed investigations relate to the parameters, print speed, number of shells, layer thickness, nozzle temperature, and infill density. Therefore, a prediction using the shown approach is only possible if these parameters influence the observed quality characteristic. The used approach needs to be adapted for printers where other parameters play a predominant role. This could result in an extent of the NN by a neuron in the input layer for each new considered parameter. The investigations are based on PETG. Materials with a deviating printability that cannot be processed repeatably by the printer could worsen the prediction accuracy of the models.
Conclusion
The gap of unknown quality results of MEX in terms of linear dimensional accuracy in X, Y, and Z direction has been closed by a developed reliable prediction model based on a NN approach, aiming to improve the applicability of MEX for use cases with high dimensional accuracy requirements.
The findings of this article demonstrate that the developed NN model has achieved accurate predictions. Despite rigorous testing of random parameter sets, the NN achieved a MAPE of 1.3% or lower for X and Y directions, and 2.3% for the Z direction. Moreover, when dealing with random and untrained interval lengths, the NN achieved a MAPE of 0.6% for X and Y direction and 3.3% for Z direction. The results show that the NN model achieved a more accurate and robust prediction compared with a MLR. In particular, NN outperformed MLR by achieving fewer outliers with similar prediction accuracy for varying interval lengths and better prediction accuracy in the Z direction for fixed interval lengths.
Therefore, it is recommended to use the NN model for a more accurate and robust prediction. The developed NN model and approach showcased its capability for accurate prediction of linear dimensional accuracy even at low data volume, for example, only 32 test samples for training. The chosen procedure, which involved testing the prediction on samples with different directions and intervals, ensured that the prediction accuracy remained relatively unaffected by specific test sample characteristics.
It is expected that the accuracy improves further by increasing the training data volume.
In conclusion, the performed research fills an existing gap by developing a powerful NN model that enables the accurate prediction of linear dimensional accuracy. The implications for practice are significant, as these prediction models can be readily used to improve the parameter settings for MEX and ensure that the desired accuracy levels are met. With further exploration of additional dimensional features and advances in data sharing techniques, the findings pave the way for future research to push the boundaries of accurate dimensional prediction in the field.
Therefore, it is planned to include other dimensional features, such as roundings, circles, or cylinders, in the prediction model and to consider other influencing process parameters, such as air gap, raster width, and raster orientation. In addition, enabling transfer learning is targeted to leverage prediction models for similar use cases with limited available data, which promises to broaden the applicability of the prediction model. Furthermore, an increase of data volume is targeted through federated learning, which could allow companies to share data for training prediction models without compromising the confidentiality of their proprietary information.
Footnotes
Acknowledgments
The authors thank the Institute for Functional Interfaces at the Karlsruhe Institute of Technology and the Laboratory for Materials Testing at the Karlsruhe University of Applied Sciences for access to their measurement equipment.
Authors' Contributions
All authors contributed to the study conception and design. Material preparation, data collection, and analysis were performed by C.S. and J.F. The first draft of the article was written by C.S. and all authors commented on previous versions of the article. All authors read and approved the final article.
Author Disclosure Statement
The authors have no competing interests to declare that are relevant to the content of this article.
Funding Information
This research received no external funding.