
Abstract
With the development of navigation and aerospace engineering, higher requirements have been put forward for the weight reduction of structures, so stiffened plate structures have been more and more widely used. Through laser additive manufacturing technology, it is possible to significantly improve the performance of stiffened plate while achieving low-cost and rapid production of stiffened plate. However, due to the effect of temperature gradient in the forming process, the residual stress of the stiffened plate is inevitable, which directly affects the forming accuracy and performance of the plates. In this article, five thermomechanical coupling models were established based on the finite element method to simulate the residual stress of stiffened plates, and the models have been verified through experiments. The results show that ribs have an “adsorption” effect on the stress on the flat plate. After reinforcement, the maximum stress on the plate increases, but the stress distribution area becomes smaller. The average maximum residual stress on the plate when the rib is perpendicular to the scanning path of the plate is greater than when the rib is parallel to the scanning path of the plate. Adding chamfers can significantly reduce the residual stress in the contact area between the ribs and the flat plate. The research in this article is of great significance for the structure design and residual stress control of titanium alloy stiffened plates made by additive manufacturing.
Introduction
Laser additive manufacturing (LAM) technology is an advanced manufacturing technology that has integrated information technology, new material technology, and manufacturing technology in the past 20 years. As a core technology of the future development of the manufacturing industry, it has received great attention. Products and parts manufactured by laser additive manufacturing are not limited by shape, structural complexity, and size. Its forming principle provides a new opportunity for the development of manufacturing technology from the traditional macro shape manufacturing to the macro-and micro-structure integrated manufacturing.1,2 Because of its excellent comprehensive performance, TC4 alloy is widely used in aerospace, medical equipment, transportation, and other fields, especially in the aerospace field. TC4 alloy has become the main material, which is widely used in the manufacture of aircraft rotors, tail fins, fuselage reinforcement frames, main and auxiliary fuel tanks, and other key structural parts. It has a wide range of application prospects. In the process of additive manufacturing, the molten pool formed by the interaction between the laser beam and the material experiences rapid heating, melting, and rapid cooling and solidification changes, which will inevitably produce nonuniform thermal stress and transformation stress, resulting in nonuniform plastic deformation and the formation of large residual stress. What’s more, the nonuniformity of the material structure after the reinforcement of TC4 alloy makes the issue more complicated. Therefore, in the process of laser additive manufacturing, the analysis and research of temperature field and stress field are more important.
By establishing a finite element model of the stiffened plate, Jiaxue Mei et al. 3 conducted a finite element analysis on the residual stress generated during the formation of the stiffened plate and the welding process. They pointed out that the bearing capacity of the stiffened plate with residual stress was was reduced by about 10% compared with that without residual stress. Zhaohui Wang et al. 4 established finite element models of titanium alloy stiffened plates with three stiffening methods and pointed out that the buckling load and failure load values of T-shaped stiffened plates are the largest. Yu Guo et al. 5 conducted numerical simulation of the stress field of laser additive manufacturing components and pointed out that the residual stress was mainly concentrated at both ends of the formed parts. Zhan et al. 6 measured the residual stress in the laser additive manufacturing of TC4 alloy by laser ultrasound, establishing a prediction model of the residual stress based on the experimental data and pointing out the influence of optimized process parameters on the residual stress distribution. Hongjian Zhao et al. 7 established a finite element model of TC4 alloy to conduct numerical simulation of stress and found that the overall stress should be distributed in an “inverted bowl” shape and pointed out that in the process of laser additive manufacturing, laser power is positively correlated with the residual stress of TC4 alloy. Ruidong Xie et al. 8 summarized the finite element analysis methods of the temperature field of additive manufacturing technology at home and abroad and analyzed the advantages and disadvantages of temperature field detection of existing additive manufacturing technology. The above research shows that the stress field in the manufacturing process of laser additive manufacturing TC4 alloy stiffened plate can be simulated by the finite element analysis method, and its stress distribution and evolution can be clarified, which plays an important role in clarifying the influence of stiffening method on stress chamfering on stress in the process of laser additive manufacturing. This is particularly important for improving the quality of additive manufacturing TC4 alloy stiffened panel members. Xiaodong Li et al.9-11 measured the residual stress of laser additive manufacturing components through digital imaging technology and revealed the formation mechanism of defects in forming parts.
However, most of the studies conducted by the aforementioned individuals have focused on the distribution of residual stress generated during additive manufacturing, while there is currently no research on the effects of residual stress and chamfering on residual stress in stiffened plates. In this article, the residual stress of laser additive manufacturing of a TC4 alloy stiffened plate is analyzed by the finite element method. The model change technology was used to simulate the process of additive manufacturing, the double ellipsoid heat source function was written in Fortran language, the analysis steps and their interactions were set up in a python script, and the thermodynamic coupling finite element analysis of the process of laser additive manufacturing of TC4 alloy reinforced plates was realized. The research in this article is of great significance to the measurement, control, and reasonable suppression of residual stress in the process of additive manufacturing of TC4 alloy stiffened plates.
Theoretical Basic
In order to simulate the process of LAM better, it is necessary to set up a suitable heat source model. The volumetric heat source model, plane heat source model, and concentrated heat source model are the three commonly used heat source models in additive manufacturing modeling. Among them, the double elliptical heat source model
12
is the most classical and representative. The power density is described as follows:
In the manufacturing process of LAM, temperature changes fast and drastically. Because of this is a nonlinear heat conduction problem, the relevant governing equation is:
In this governing equation, c is the specific heat capacity; ρ is the density of the material; T is the temperature; t is the time; and kx, ky, and kz are the heat transfer coefficients in the different directions, respectively. Considering the change in temperature and time of the metal powder in the LAM process, extending equation 2 to a functional gradient material, the thermal conduction equation is:
Set the initial condition and boundary condition:
In this equation, T0 is the normal temperature; n is the size of a normal vector on the model surface; hc is the natural convection heat transfer coefficient; σb is the Stefan-Boltzmann constant; εb is the emissivity of the material; Sn is the model surface.
At first, analyze the temperature field to obtain the thermal strain.
In order to complete the coupling calculation of the temperature field and stress field, before the analysis of stress, it is important to import the result of the temperature field distribution. The total strain equation is:
The Mises yield criterion will be adopted according to the plastic mechanics and the characteristics of residual stress of LAM. The equivalent stress calculation equation is
The material parameters of TC4 alloy are shown in Table 1. 13
The Material Parameters of TC4 Alloy
Finite Element Model
Model building
In our study, we have built thermomechanical coupling models based on the finite element method and have written subroutines for double ellipsoidal heat source functions. The selected process parameters are laser radius 2 mm, laser power 500 W, and scanning rate 10 mm/s. In Figure 1, the substrate was a TC4 titanium alloy plate with dimensions 50 × 50 mm × 2 mm, and the laser deposition was started at the top of the substrate, which was 5 mm from the left boundary and the lower boundary. The plates of the five models are all deposited in a single multi-layer way, with 40 cladding layers in each layer and a total of 80 cladding layers in two layers. The ribs of models (b) and (c) were deposited along the X direction, while the ribs of models (d) and (e) were deposited along the Y direction, and each rib was deposited in 6 layers. A chamfer of r = 0.5 mm was set in the contact part between the rib and the plate of models (c) and (e). At the same time, we set the surface heat transfer coefficient of each melt layer and the heat dissipation coefficient of the film.
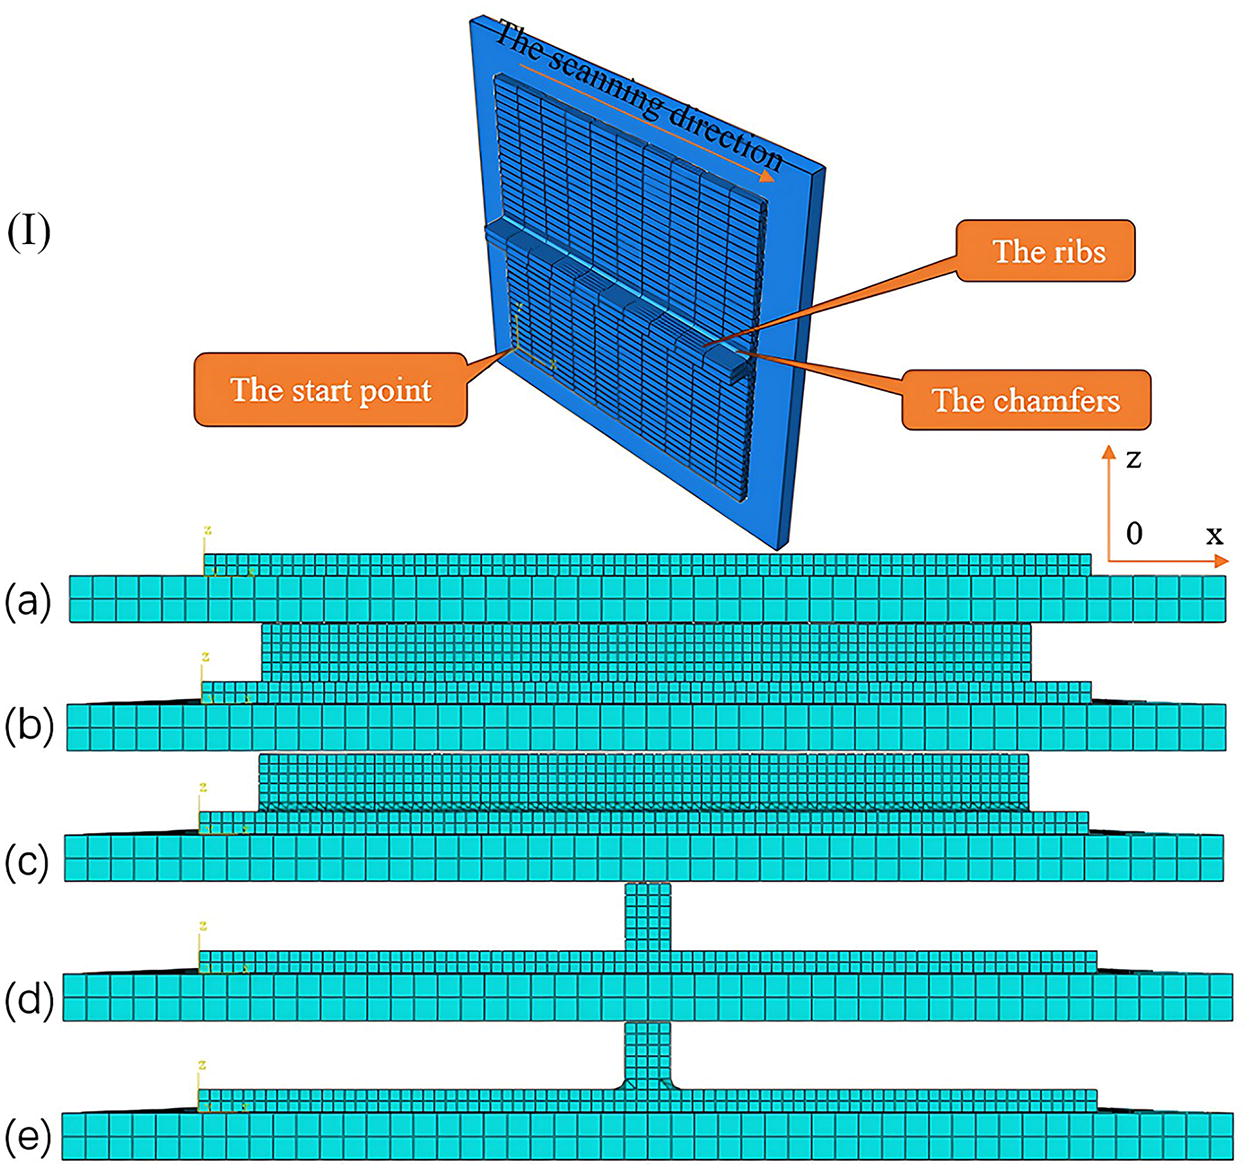
Model diagrams after grid division:
The surface thermal radiation and environmental temperature of the whole LAM treatment process are 20°C. We apply tie constraints between the melt layer and the substrate and set completely fixed boundary conditions at the bottom of the substrate.
The size of the finite element mesh has great influence on the accuracy and stability of numerical simulation. In the finite element analysis of the LAM process, it is generally necessary to ensure that the mesh size is less than the laser radius so that better simulation results can be obtained. Combined with the research content of this article and considering the factors such as model size and computational efficiency, a double-precision mesh division method was selected to select large and finer meshes in the deposition area, while the mesh division was sparse in the substrate.
After a lot of calculation, we get the optimal mesh size of the print is 0.5 × 0.5 × 0.5 mm, and the best mesh size of the substrate is 1 × 1 × 1 mm. Select the four-node thermally coupled tetrahedral element C3D4T at the chamfer for the unit type and select the element C3D8T in the remaining part.
“Model change”
Based on the finite element method, we used the “Model change” technology to realize the killing and activation of the element at any time in the simulation analysis process by modifying the stiffness matrix, and this method could be widely used in the finite element analysis of welding, additive manufacturing, and other processes. In this study, the “Model change” technology was used to make each part of the powder bed appear synchronously when the moving heat source sweeps its location. Namely, in the initial state, the deposited part of the unit should be in a nonactivated state, and the unit at a certain location would be automatically activated before the moving heat source scans it. Considering the size of the model studied in this article, the workload of manually setting analysis steps and interactions would be very large. We have written some Python scripts to implement the settings of analysis steps and interactions. In this article, 800 (a), 920 (b), 930 (c), 920 (d), and 930 (e) steps were set respectively, and 10 steps were set for each cladding layer. Thermodynamic coupling analysis was carried out with standard analysis steps, and the global temperature field was initially set at 20°C. In the process of laser deposition, the increment step size should be set appropriately. Too large an increment step will lead to singularity and non-convergence of the nonlinear equations, while too small an increment step will prolong the operation time. Combined with the material size, the division format of the model changes and the process parameters; the loading analysis step of each heat source is set to 0.4 s, and the incremental step of a single heat source is set to 0.04–0.4 s, which can better meet the requirements of simulation accuracy and calculation efficiency. For the cooling stage, this article considers that the heat dissipation mode of the material is mainly heat convection and considers radiation heat dissipation and cooling temperature to room temperature, 20°C.
Model verification
In this section, the finite element model of thermal coupling for TC4 titanium alloy was built by “model change” technology. It would be compared with experimental results to verify the correctness of the model.
In the LAM, the drastic changes in temperature are the main cause of the residual stress. It is important to observe the variations of temperature at different times to analyze the residual stress. With the process of LAM continuously proceeding, the temperature of the heat source is also increasing, and Figure 2 shows the temperature changes at different times.
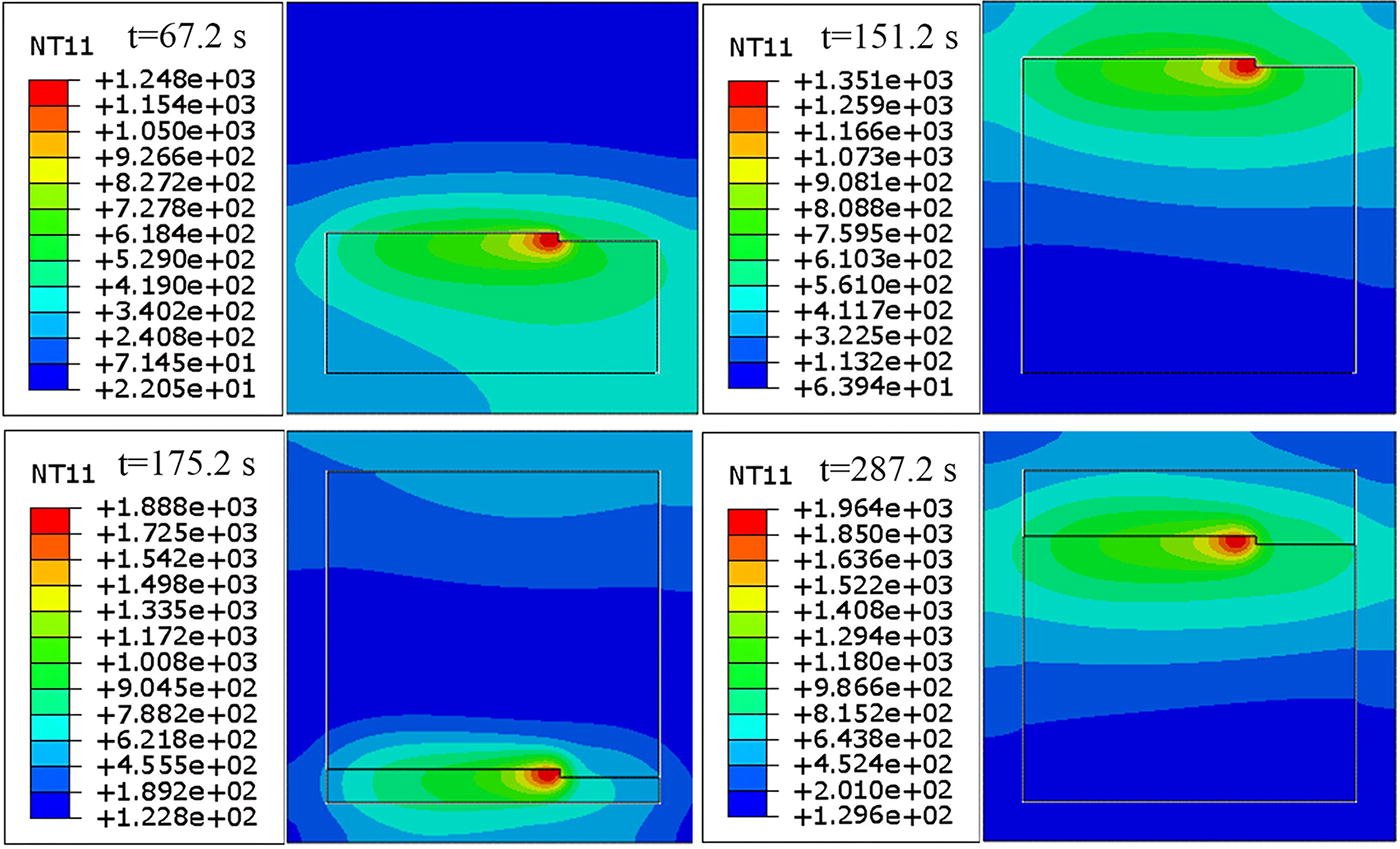
The temperature nephograms of flat plates at different times.
Figure 2 shows the temperature distribution of the flat plate model simulated at 500 W at several different times. As time accumulates, the temperature of the molten pool increases gradually, and the temperature gradient near the action area is large, which can describe the distribution of the melt pool approximately. It can be seen that the entire additive manufacturing process is reproduced as the moving units of the laser source are activated in turn. The temperature at the center of the melt pool is high, and the surrounding temperature gradient is large, and the temperature is small and gently distributed in the region away from the laser source.
After the cooling process of 500 s, the figure of the residual stress of the flat plate is obtained and shown in Figure 3a. Due to the process of laser additive manufacturing, which is rapidly heated and cooled, the large temperature gradient in the LAM is the main cause of the residual stress. The stress distribution on the flat plate is approximately in an “inverted bowl” shape, 7 which indicates that the stress distribution is generally correct.
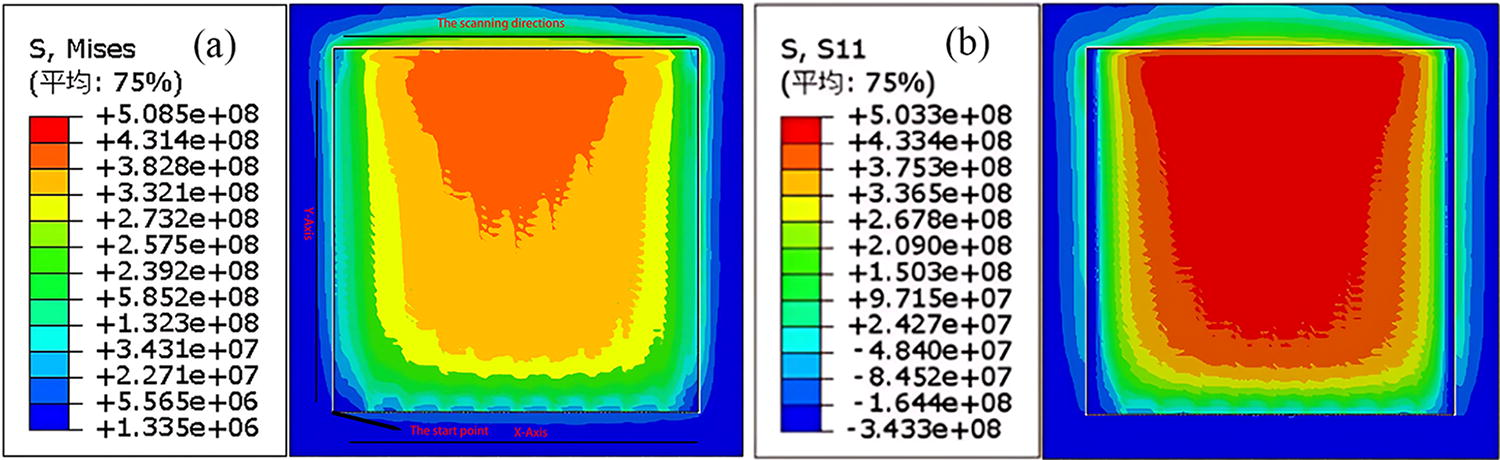
In four stress states (Mises, S11, S22, S33), the stress along the scanning direction (x-direction) is the main stress that causes the structure to bend and crack. Therefore, we will focus on the S11 in the following discussion.
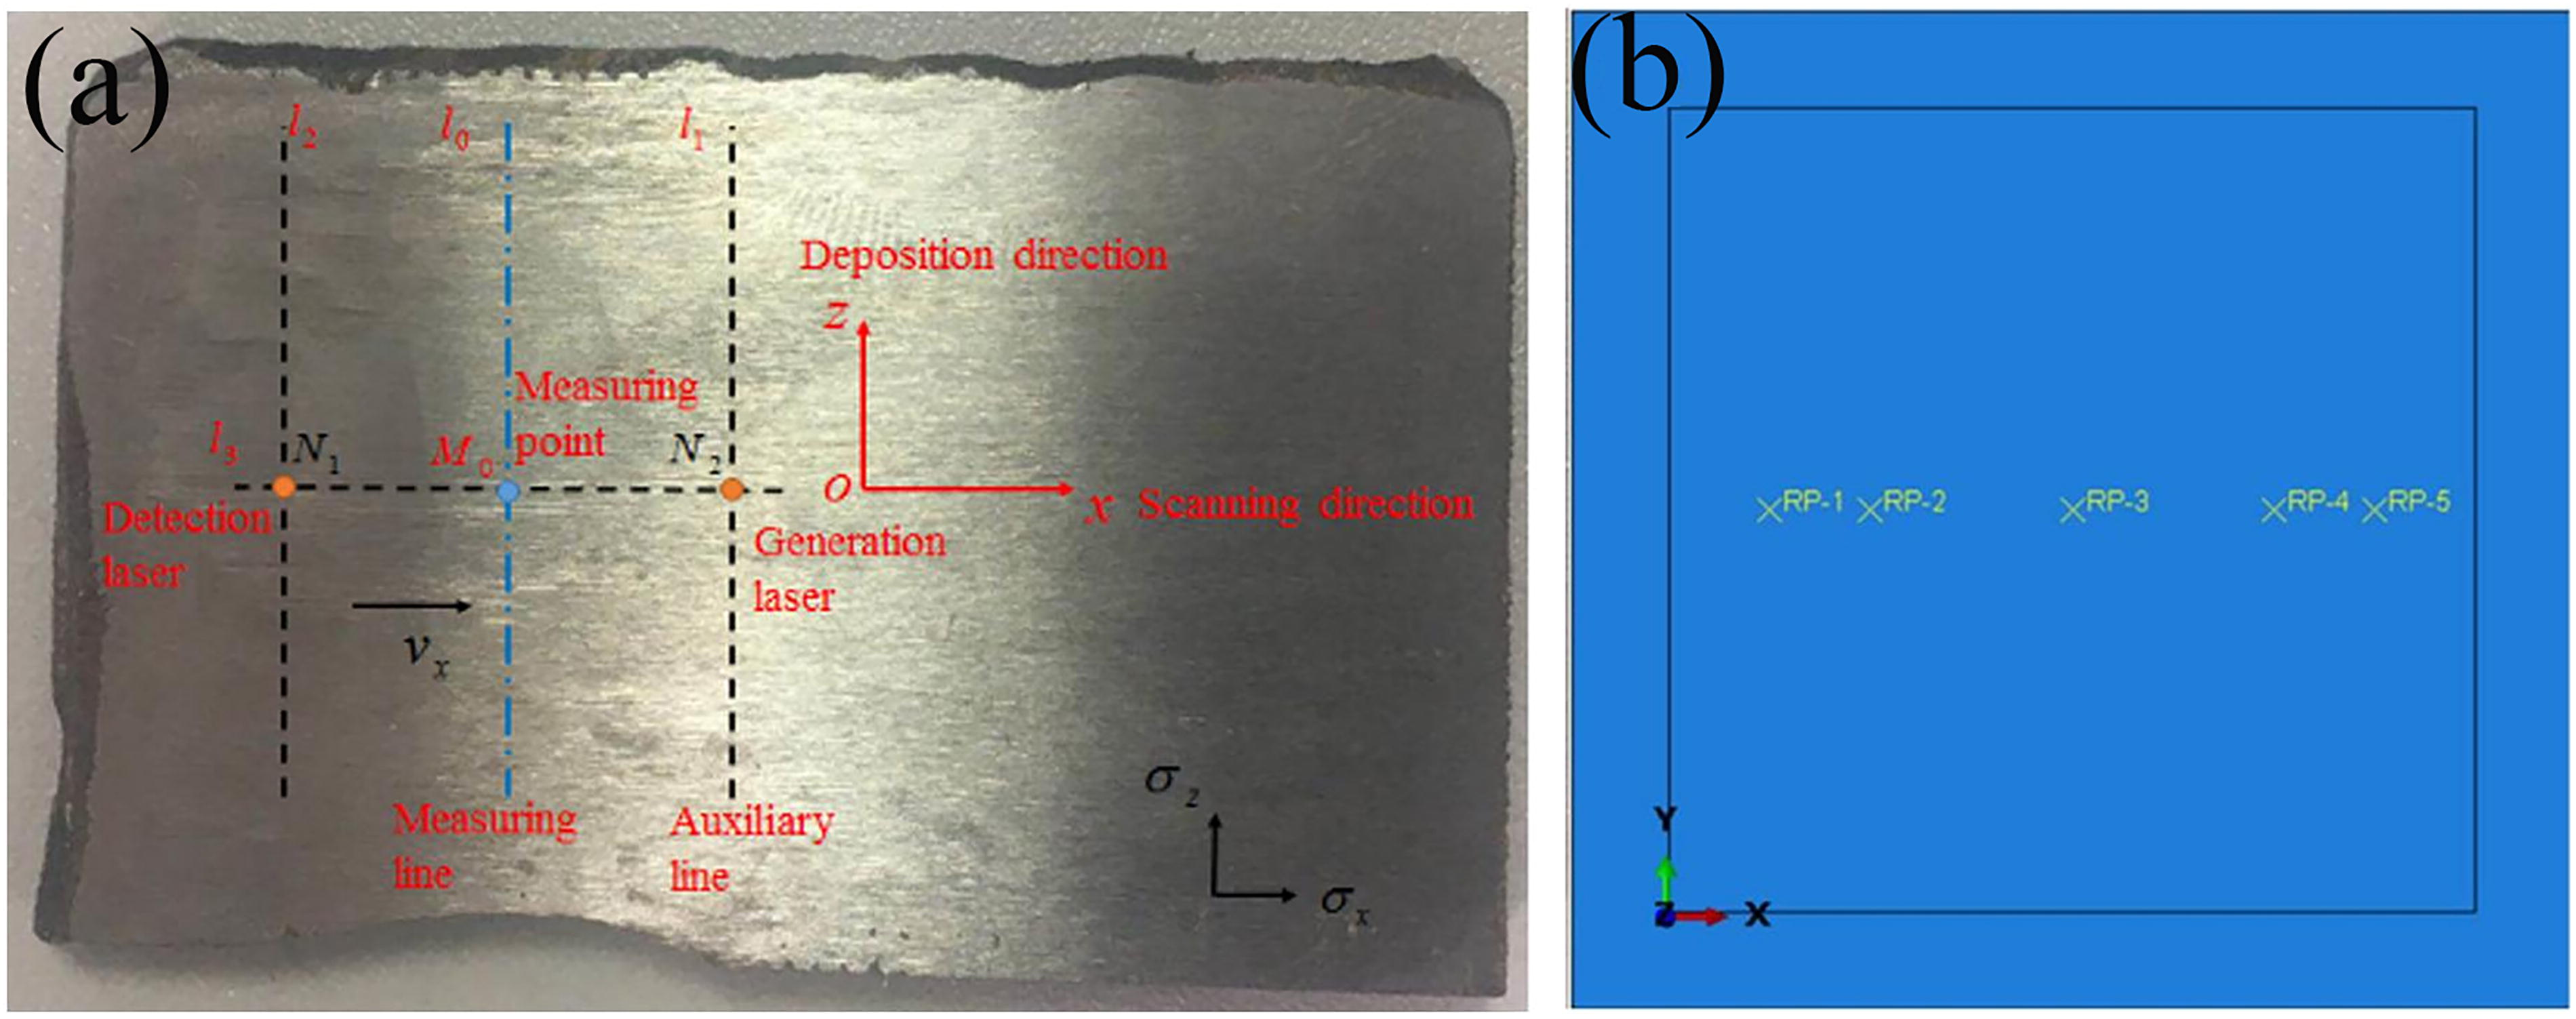
After calculation, the stress nephogram is shown in Figure 3b. In order to verify the correctness of our model, the experiment has been completed. TC4 alloy powder is used for laser melt deposition and is produced by China Aviation Melt Powder Technology Co., LTD. The experimental equipment (laser melt deposition system) produced by YT Process Engineering Co., Ltd. is shown in Figure 4a and b. Set the printing parameters to laser power 1000 W, laser scanning speed 10 mm/s, feeding rate 10.5 g/min, spot diameter 2 mm, and overlap rate 80%.
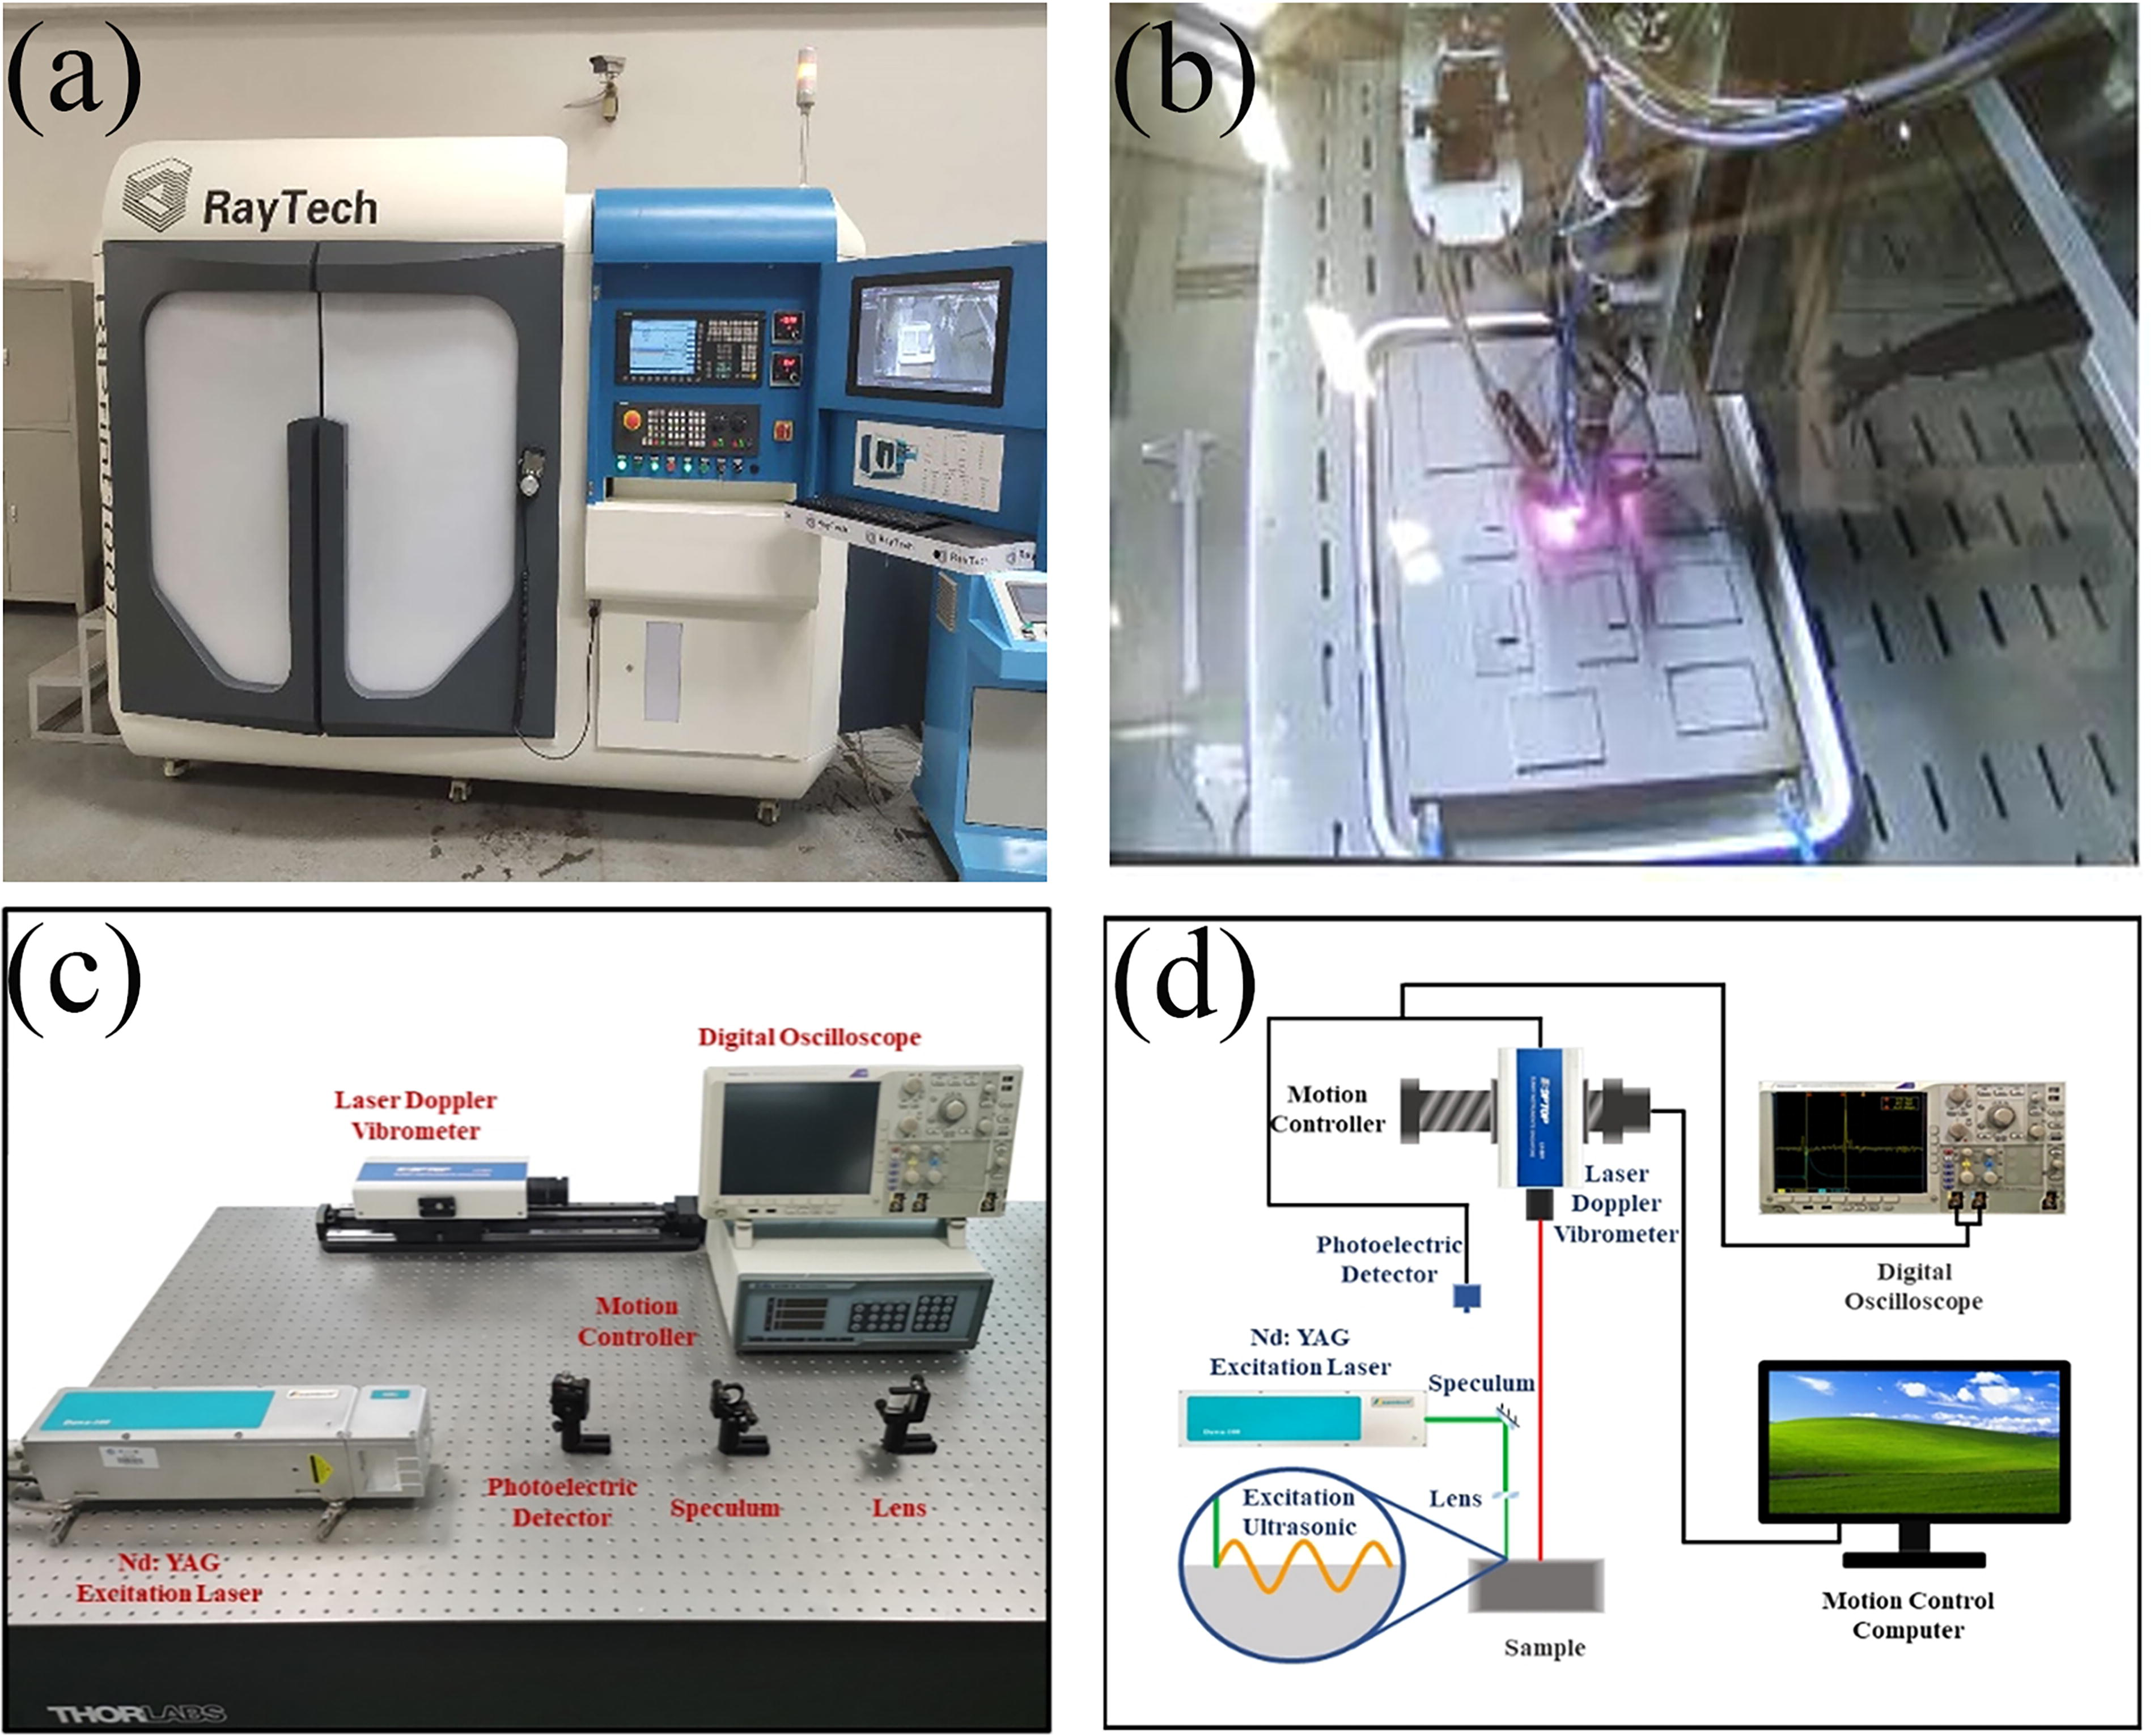
After sample treatment, the residual stress and distribution were detected by laser ultrasound technology, as shown in Figure 4c and d. Laser ultrasonic technology is a new detection technology. The laser ultrasound measurement technology is based on the acoustoelastic effect, which correlates the stress field in a material with changes in the ultrasonic wave velocity. The acoustoelastic coefficients are obtained by pre-stress, loading and the residual stress in the TC4 titanium alloy sheet is considered as plane stress state. After obtaining the acoustic elastic constant, the stress value at the corresponding point can be derived from the ultrasonic velocity. Compared with other residual stress detection methods (such as cutting groove, X-ray and neutron diffraction, drilling, and nanoindentation14-16), laser ultrasound technology has the advantages of being non-contact, high precision, non-destructive, strong anti-interference ability, high efficiency, and portability,6,17 and is especially suitable for residual stress detection of samples produced by LAM. It also has the potential to detect the interior of metals.18,19
Figure 5a shows the sample prepared by LAM. As is well known, in the process of laser additive manufacturing, defects will inevitably occur in the formed parts due to factors such as temperature gradient, as mentioned in the literature.18-20 However, this article focuses on the distribution pattern and magnitude range of residual stress, so it weakens the influence of defects. The selected reference points are shown in Figure 5b. After selecting the same position as the reference point, the comparison between the finite element analysis method and the experimental results is obtained, as shown in Figure 6. By comparing our laser ultrasound experimental data with those in the literature,10,11 our data accords with the magnitude range and distribution of residual stress in these. It can be seen that the residual stress distribution and magnitude measured by laser ultrasound are consistent with the results of finite element analysis. It can be considered that this finite element analysis method is correct.

Comparison of experimental and finite element results.
Results and Discussion
After the cooling process of 500 s, the nephograms of the residual stress of the four different models are obtained and shown in Figure 7. Due to the process of laser additive manufacturing, which is rapidly heated and cooled, the large temperature gradient in the LAM is the main cause of the residual stress. Below, we will compare the models pairwise to draw some conclusions.
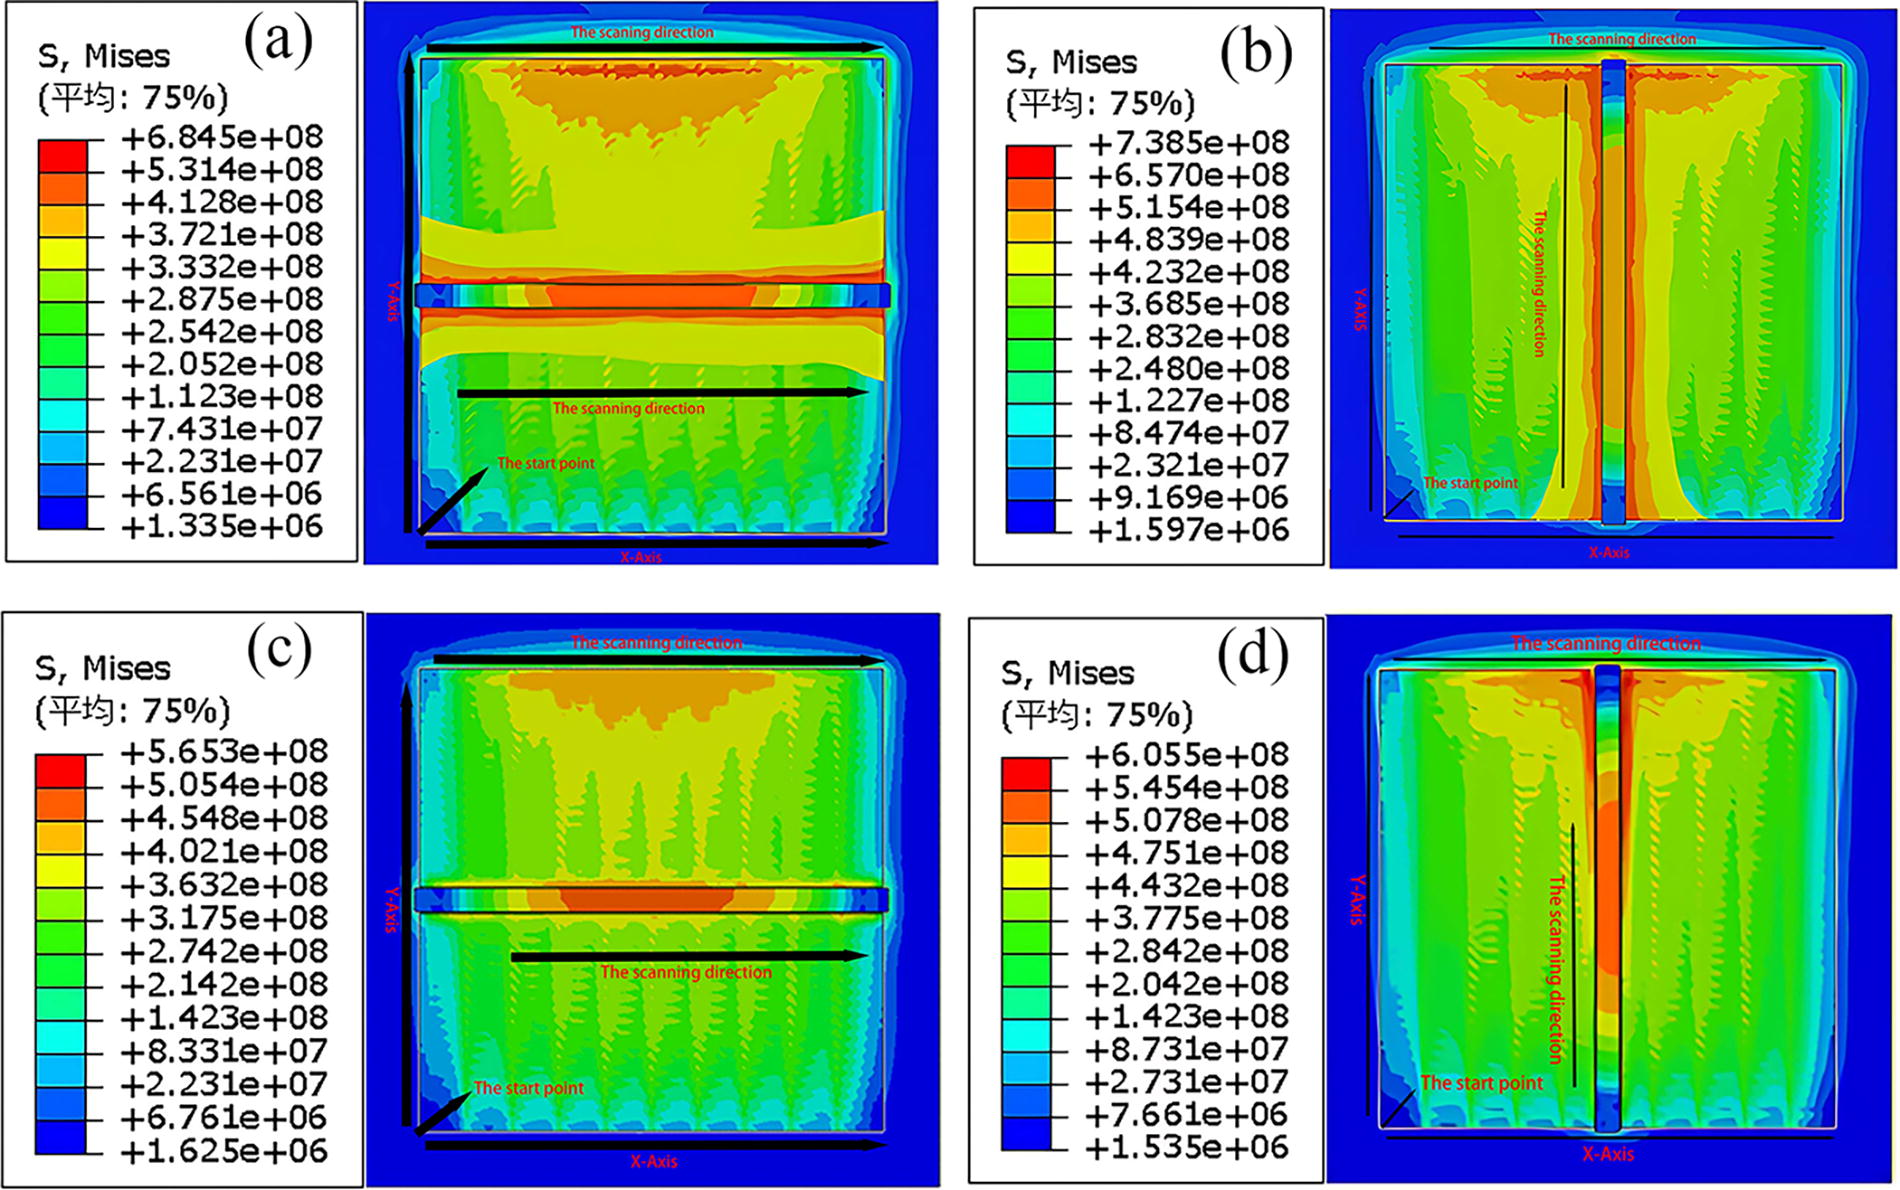
The nephograms of the residual stress of the four different models, model
In Figure 3a is the stress distribution nephogram of the flat plate. In Figure 7a is the stress distribution nephogram obtained by reinforcing parallel to the scanning direction of the flat plate. Comparing the two models, it can be seen that the two models are different in both stress magnitude and stress distribution. Based on the magnitude of stress, the maximum stress of a stiffened plate is larger than that of an ordinary plate. In terms of stress distribution, there is a stress concentration around the reinforcement bars of the stiffened plate, and the stress around the reinforcement bars presents a typical “dumbbell type 5 ” distribution. The stress of the part away from the reinforcement bars on the plate is smaller than that of the common plate. We can compare the ribs to a sponge and the stress on a flat plate to a layer of water. After reinforcement, the maximum stress on the flat plate increases, but the distribution area becomes smaller. And after reinforcement, the maximum stress increases by about 35%.
In Figure 7, the ribs of model (a) are parallel to the scanning direction of the flat plate, and the ribs of model (b) are perpendicular to the scanning direction of the flat plate. It can be seen that there are some differences in stress magnitude and stress distribution of the stiffened plates obtained by the two stiffening methods. In terms of stress distribution, both of them have the phenomenon of stress concentration near the bar, and the distribution is a typical “dumbbell 5 ” around the bar, but they are different in magnitude. When the bar is perpendicular to the scanning direction of the flat plate, the stress near the bar is greater because the stress around the area to be added before reinforcement is greater than that around the area to be added before reinforcement under condition (a). After reinforcement, under the same stress concentration condition, the residual stress generated after stress concentration in model (b) is greater. It can be concluded that the maximum residual stress of reinforcement parallel to the scanning direction of the flat plate is lower than that perpendicular to the scanning path of the flat plate. The maximum stress of model (a) is about 50 MPa lower than that of model (b). So, we can infer that the reinforcement mode (a) corresponding to model (b) is better.
In Figure 7, the reinforcement directions of (a) and (c) are both parallel to the scanning direction of the flat plate. The difference between the two is that model (a) has not added chamfers, while model (c) has added chamfers. In both cases, the ribs can act like sponges. The stress on the flat plate concentrates near the area where the reinforcement bars are located, which results in an increase in the maximum residual stress on the flat plate but a decrease in the stress distribution area. However, the maximum residual stress of model (c) is lower than that of model (a). The possible reason is that chamfering is beneficial for the release of thermal stress during the additive manufacturing process. In this case, adding chamfers can reduce the maximum residual stress by about 20%.
In Figure 7, the reinforcement directions of (b) and (d) are perpendicular to the scanning direction of the flat plate. The difference between the two is that model (b) has not added chamfer, while model (e) has added chamfer. A similar conclusion can be drawn by observation.
In Figure 7, the rib of model (c) is parallel to the scanning direction of the flat plate, and chamfers are added between the rib and the plate. The rib of model (d) is perpendicular to the scanning direction of the flat plate, and chamfers are also added between the rib and the flat plate. The two are different in stress distribution and stress magnitude. When the bar is parallel to the scanning direction of the flat plate, the maximum stress on the plate is less than that when the bar is perpendicular to the scanning direction of the flat plate. The maximum residual stress under condition (c) is about 50 MPa lower than that under condition (d).
We assume that model a is a flat plate, model b is a ribbed plate without chamfer and reinforced parallel to the scanning direction of the flat plate, c is a ribbed plate without chamfer and reinforced perpendicular to the scanning direction of the flat plate, d is a reinforced plate with chamfer and reinforcement parallel to the scanning direction of the flat plate, and e is a reinforced plate with chamfer and reinforcement perpendicular to the scanning direction of the flat plate. Then we take three maximum stress points on each model and calculate the average value, resulting1in Figure 8.
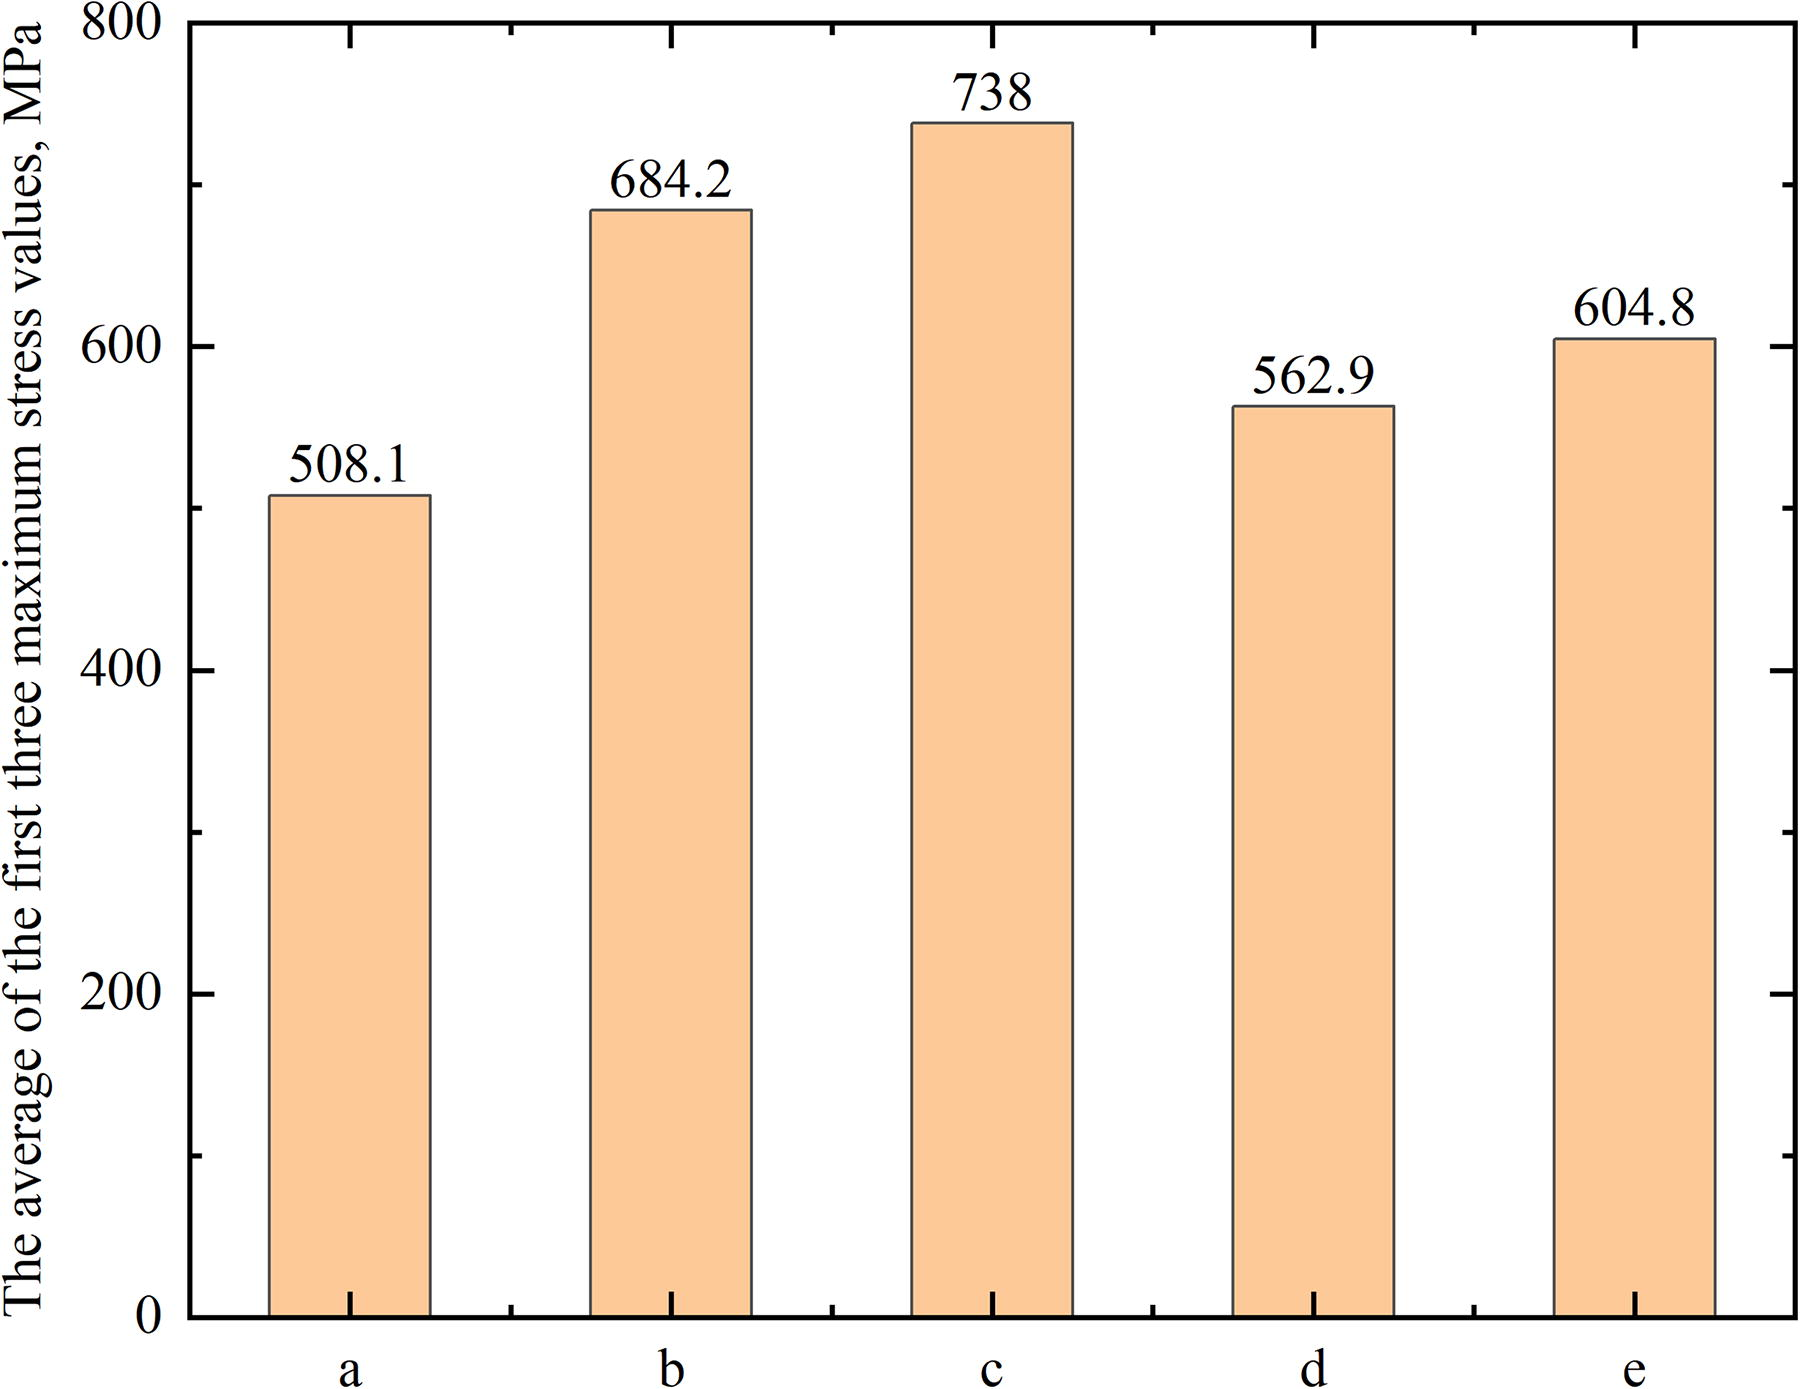
The five models’ average of the three maximum stress values.
From Figure 8, we can see that ribs have an “adsorption” effect on the stress on the reinforced plate. The average maximum residual stress of the stiffened plate obtained by reinforcing parallel to the scanning direction of the plate is about 100 MPa lower than that of the stiffened plate obtained by reinforcing perpendicular to the scanning direction of the plate. After adding chamfers, the maximum residual stress can be reduced by approximately 100 MPa.
Conclusions
Developing a double ellipsoidal heat source function based on Fortran, and writing a subroutine for the heat source function. Based on the finite element method, a subroutine was written in Python language to implement the “Model Change.” Finally, the thermomechanical coupling models were built, and the finite element results were consistent with the experimental results.
Before reinforcement, the maximum stress on the plate is small, but the overall distribution area is large. After reinforcement, the maximum stress on the plate increases, but the overall distribution is smaller.
Adding chamfers can effectively reduce the residual stress caused by reinforcement. Adding a chamfer can reduce the maximum residual stress by about 20%.
Footnotes
Authors’ Contributions
S.Y.: Conceptualization, methodology, software, validation, formal analysis, investigation, writing—original draft. C.Y.: Formal analysis, writing—original draft. R.Z.: Software, formal analysis. T.G.: Resources, supervision, funding acquisition. C.L. and Y.Z.: Visualization, resources, writing—review and editing, funding acquisition.
Author Disclosure Statement
The work presented here was performed in collaboration among all authors. S.Y. designed and analyzed the article. S.Y. and C.Y. wrote the article. C.Y., R.Z., T.G., C.L., and Y.Z. provided and analyzed the experimental data. All authors contributed to and approved the article.
Funding Information
This study is supported by