
Abstract
Objectives:
The characteristics of the right/left radial pressure pulse (RPP) at the six diagnosis positions in Chinese medicine are not well documented. The purpose of this study is to investigate the spectral energy and augmentation index (AI) of bilateral RPP at the six diagnosis positions and heart rate variability (HRV) in the normotensives, hypertensives without heart dysfunction (HTN-N), and hypertensives with mild diastolic dysfunction (HTN-A).
Design:
One hundred and thirty-eight (138) subjects were enrolled in this study. All subjects underwent measurements of brachial arterial blood pressure and RPP of both wrists while seated, and the supine measurement of HRV. AI and spectral energy of RPP as well as HRV were analyzed.
Results:
The low-frequency component, the spectral HRV parameter, was significantly reduced in HTN-A compared with that in the normotensive group. Radial AI of the six diagnosis positions in HTN-N was significantly higher compared with that in the normotensive group or HTN-A. At the six diagnosis positions, the spectral energy of 0–10 Hz (SE0–10Hz) in both hypertensive groups and 10–50 Hz (SE10–50Hz) in the HTN-A group were significantly higher compared with those in the normotensive group. SE10–50Hz at right Chy, left Chun, and left Guan in the HTN-N group were higher than those in the normotensive group. Within each group, there was a significant difference in the energy proportion, 10–50 Hz% (EP10–50Hz%), between the six positions and a significant reduction only at the left Chun position in both hypertensive groups compared to that in the normotensive group.
Conclusions:
It is concluded that the EP10–50Hz% revealed the specific characteristics of RPP and significantly varied at the six positions, and the left Chun position, the position to detect the heart diseases in Chinese medicine, is qualified to discriminate the differences between the normotensive and hypertensive patients.
Introduction
The radial pressure pulse (RPP) derives from the heart's pumping action to the end of the radial artery adjacent to the small arteries and arterioles. The RPP conveys much information about the physiology of the cardiovascular system. 9,10 Dating back 2000 years ago, Chinese doctors placed their fingertips on patients' wrist to palpate the pulse property for diagnosis, and currently, studies have confirmed the quantitative characteristics of pulse signals from RPP at the different diagnosis positions. 11 In Traditional Chinese Medicine (TCM), pulse diagnosis involves palpating the pulse at three sections over the right/left radial artery of the wrist. The Guan is just central to the radial styloid at the wrist where the tip of the physician's middle finger is placed, the Chun is next to it on the distal side where the tip of the physician's index finger rests, and the Chy is on the proximal side where the tip of the physician's ring finger is placed. The relationships between organs and pulses are determined at the Chun, Guan, and Chy positions of both wrists as shown in Fig. 1B. For example, the cardiac system can be detected through the left Chun position, and the Lung is by the right Chun position. Besides time-domain analysis to evaluate the AIr, frequency-domain analysis is mostly used for analyzing periodic waves to represent the dynamics carried in the waves by obtaining the sums of the spectral energy (SE). In normal individuals, the spectral energy within 0–10 Hz (SE0–10Hz) takes more than 99.l% of the total energy of the radial pressure waveforms, with less than 0.9% of energy within 10–50 Hz (SE10–50Hz), and it has large variations above 10 Hz for patients who had acute illness or who were under metabolic stress. 12,13 The authors have demonstrated that the changes of AIr and SE10–50Hz induced by heat and cold stresses were significantly negatively correlated in healthy young humans. 14 Therefore, RPP always exhibits the specific characteristics of blood flow in the higher-frequency components of the waveform.
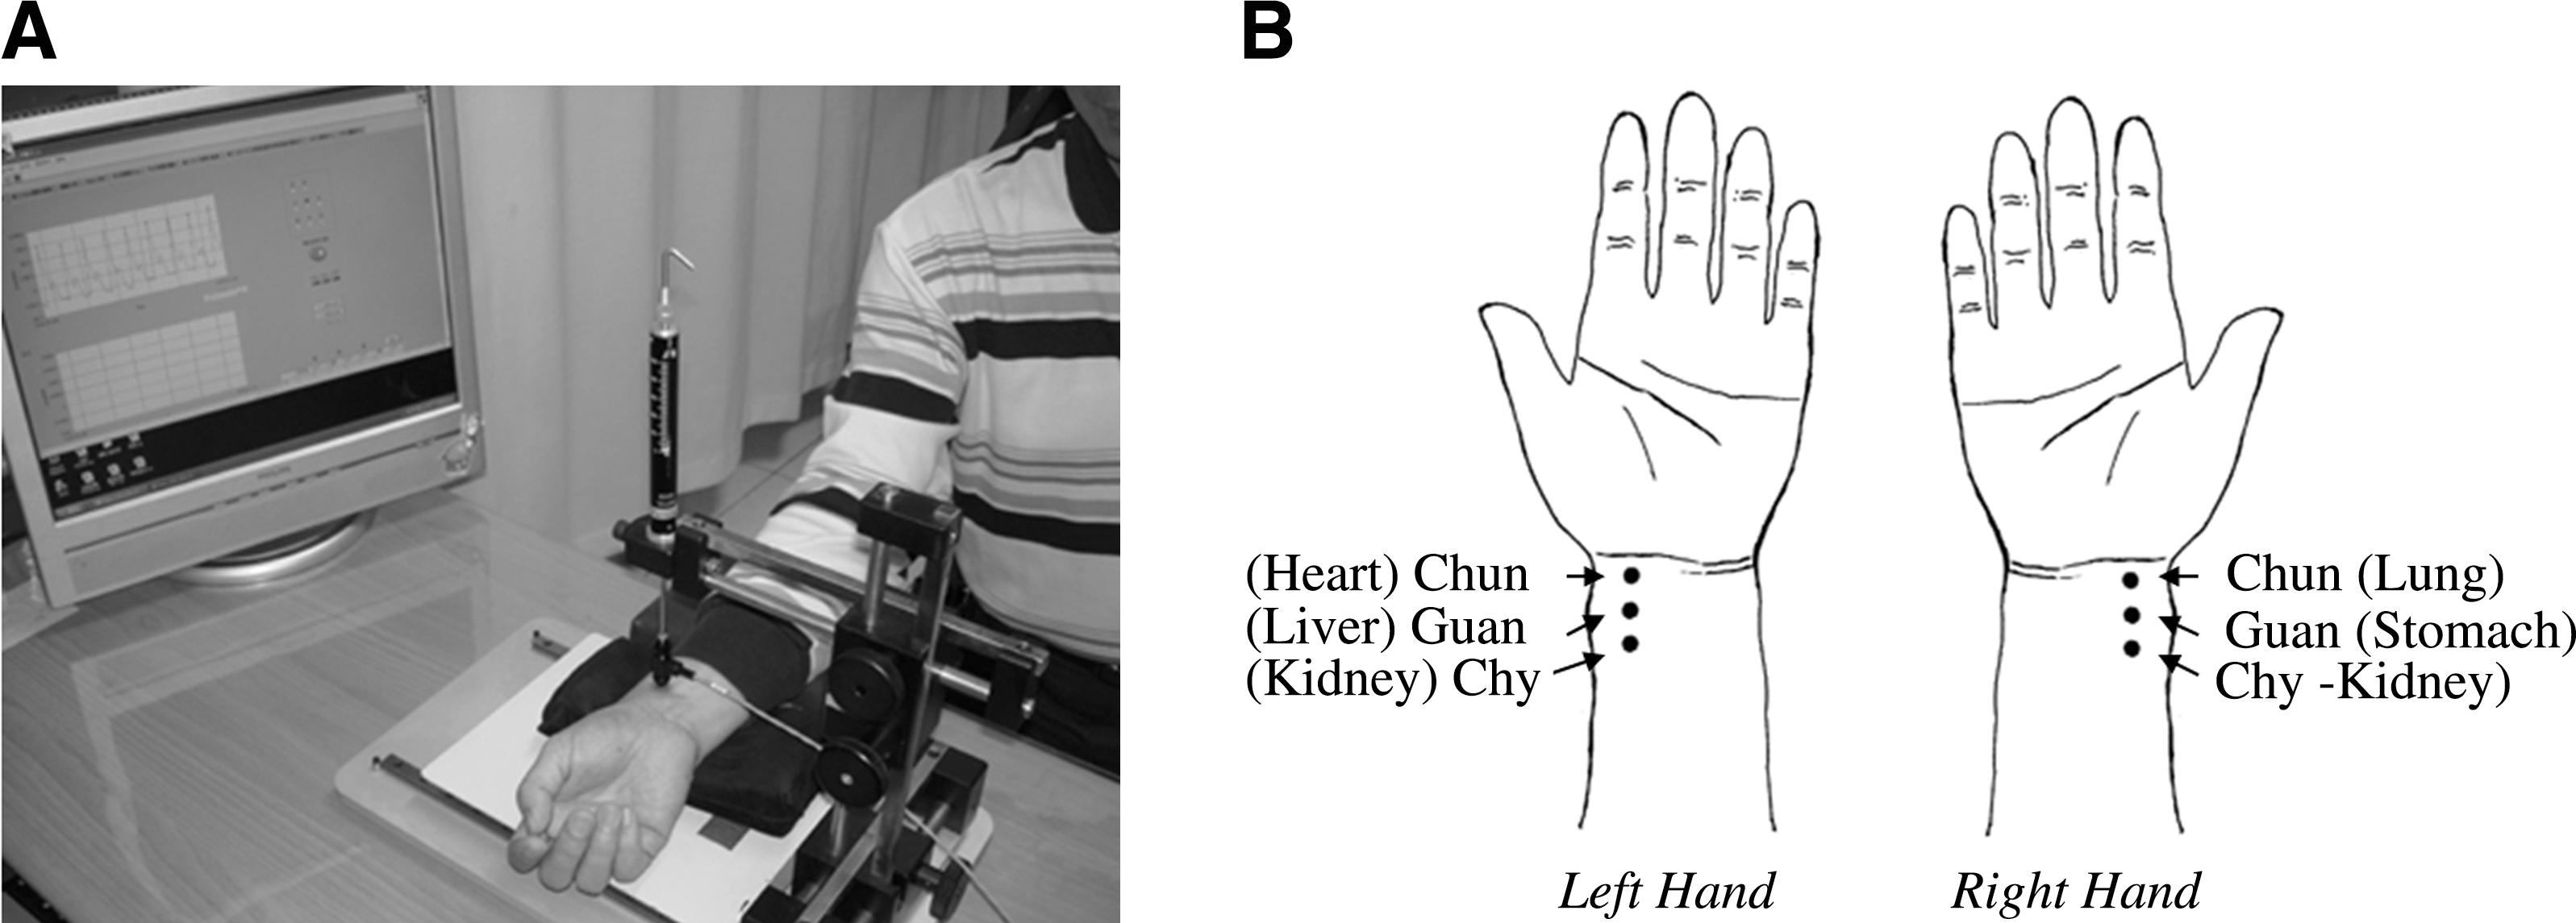
The measurement of radial pulse.
The autonomic nervous activity (ANA) dysregulation has been involved in the development of hypertension. The spectral analysis of heart rate variability (HRV) is often applied to assess the cardiac autonomic dysregulation in hypertension. Decreased HRV in hypertensive patients has been demonstrated. 15 The high-frequency (0.15–0.4 Hz) component (HF) of HRV reflects cardiac vagal nervous activity, and the low-frequency (0.04–0.15 Hz) component (LF) is mediated by both cardiac vagal and sympathetic nervous activity. Therefore, the ratio of the low- to high-frequency component (LF/HF) is an index of cardiac sympathovagal balance, and the HF power normalized to the total spectral power (HF%) is an indicator of parasympathetic activity. 16 The above parameters are used to assess the ANA. 17 –19
The characteristics of lower- and higher-frequency energy of RPP and ANA in the normotensive subjects, hypertensives without heart dysfunction (HTN-N), and hypertensives with mild diastolic dysfunction (HTN-A) have not been well studied. In this study, the RPP at the six diagnosis positions of both wrists and HRV were measured to evaluate the differences between these three groups. To evaluate the variations of RPP, the 10–50-Hz energy of RPP normalized to the total spectral power was defined as EP10-50Hz%, which indicates the higher-frequency proportion in the total energy of RPP.
Methods
Subjects
A hundred and thirty-eight (138) subjects, 46 for each normotensive, HTN-N, and HTN-A group, were enrolled in this study. The hypertensive patients were recruited from the Outpatient Department of the Division of Cardiology of China Medical University Hospital, Taichung, Taiwan. “Normotensives” were defined as having a sitting systolic BP<140 mm Hg and a diastolic pressure<90 mm Hg, and “hypertensives” as a systolic BP ≥140 mm Hg and/or a diastolic BP ≥90 mm Hg. The inclusion criteria of HTN-N were hypertensives with normal ejection fraction and normal ratio of mitral inflow (E/A ratio) by echocardiography, and of HTN-A were hypertensives with E/A ratio<1 by echocardiography. Excluded were subjects with major cardiovascular complications (e.g., nonfatal myocardial infarction, cardiac arrhythmias, heart failure, and so on), renal insufficiency (serum creatinine >1.5mg/dL), and severe underlying diseases. The subjects in the hypertensive groups were diagnosed as having hypertension for more than 3 years and were not requested to stop their medication while participating in the experiment. The mean age of the healthy control subjects matched that of the hypertensive subjects. The protocol and informed consent were approved by the China Medical University Hospital (DMR98-IRB-022-1). In order to exclude any participant with acute illness, all subjects underwent a detailed medical examination including a medical history survey as well as a physical examination. Consumption of caffeinated and alcoholic beverages as well as smoking was forbidden for 24 hours prior to testing.
Testing protocol
During the test, the room temperature was maintained at about 26°C–27°C. The subject was instructed to relax for 20 minutes while being informed of the testing procedure and subsequently underwent measurements of brachial arterial BP, heart rate, and RPP at the six diagnostic positions of both wrists while seated and supine measurement for 5 minutes with an electrocardiogram (ECG).
Measurements
Hemodynamics
BP (systolic, diastolic BP) and heart rate were measured by the Panasonic Diagnostec Upper Arm Blood Pressure Monitor (Matsushita electric Works, Ltd., Osaka Japan) through a cuff wrapped around the left upper arm.
Pulse and analysis
The RPP was recorded by the Pulse analyzer (designed by China Medical University, Taiwan) consisting of a high-fidelity pressure sensor and a stable X-Y-Z axial moveable framework. The pulse examination was done, as in Figure 1A, individually at the Chun, Guan, and Chy positions on the wrists over the radial artery with each subject in a sitting position. The Guan position is located on the ventral portion of the styloid process of the radius. The Chun position is adjacent to the Guan position and distal to it, and the Chy position is proximal to the Guan position, shown in Figure 1B. When the sphygmogram showed the greatest amplitude, the RPP was considered suitable to be recorded. AIr was calculated as (late systolic pressure – diastolic pressure)/(systolic pressure – diastolic pressure)×100%, 4 shown in Figure 2A. The electrical pulse signal from the sensor was digitized and fed into a computer for processing through Fast Fourier Transformation in order to obtain the sums of SE0–10Hz and SE10–50Hz. EP10–50Hz% was calculated as SE10–50Hz/(SE0–10Hz+SE10–50Hz). The corresponding spectrograms of 0–10-Hz and 10–50-Hz bands are shown in Fig. 2B and 2C.

Radial pressure pulse waveform and corresponding spectrograms.
HRV and analysis
The HRV analyzer (designed by China Medical University, Taiwan) with a one-channel electrocardiograph (Lead) was used to record the surface ECG from the subjects in the supine position for five minutes. ECG signals were acquired by the NI PCI-6225 (National Instruments Corp.) from the output terminal of ECG recorders. The analogue ECG signals were immediately converted into digital signals. R–R intervals were measured after the R waves were detected. NI LabVIEW (National Instruments Corp.) was used to perform HRV analysis. The ECG signals containing abnormal complexes or artifacts were discarded. The parameters of HRV spectral analysis were computed from the sequence of normal R–R intervals by means of Fast Fourier Transformation. LF (0.04–0.15 Hz) and HF (0.15–0.5 Hz) were determined by integrating the power spectrum density in the respective frequency range. Then, the normalized units, HF%=100×HF/ (LF+HF) and LF/HF, were calculated.
Statistical methods
Standard statistical methods were applied to the calculation of mean±standard deviation. The difference between the normotensives, HTN-N and HTN-A, was assessed by one-way analysis of variance (ANOVA) and Tukey's post-hoc test to determine which groups differed from each other. Differences in the successive measurements of AIr and EP10–50Hz% of the six positions in three groups were evaluated by repeated-measures one-way ANOVA, and adjusted by Bonferroni's test for post-hoc multiple comparisons to compare mean values between the six positions. All tests were two-sided; p<0.05 was taken as significant. Statistical analysis was performed by the statistical software SPSS 15.0 for Windows (SPSS Inc.).
Results
Baseline characteristics, physiologic data, and HRV parameters of the normotensives, HTN-N, and HTN-A are presented in Table 1. The AIr and spectral energy at the six diagnosis positions are in Table 2. There was no significant difference in age or height between the three groups.
Values are means±standard deviation; n=46.
HRV, heart rate variability; HTN-N, hypertensives without heart dysfunction. HTN-A, hypertensives with mild diastolic dysfunction; M/F: male/female; HR, heart rate; SP, systolic pressure; DP, diastolic pressure; LF, low frequency; HF, high frequency.
p<0.05 vs. the normotensive subjects.
Values are means±standard deviation; n=46.
p<0.05 vs. the normotensive subjects; ** p<0.05 vs. the HTN-N.
HTN-N, hypertensives without heart dysfunction; HTN-A, hypertensives with mild diastolic dysfunction; AIr: radial augmentation index; SE0–10Hz: spectral energy of 0–10 Hz; SE10-50Hz: spectral energy of 10-50 Hz; EP10–50Hz: energy proportion of 10–50 Hz%; RI, right Chun position; RB, right Guan position; RC, right Chy position; LI, left Chun position; LB, left Guan position; LC, left Chy position; E, the ×10, followed by the value of the exponent.
Physiologic parameter differences between three groups
The differences of physiologic parameters are in Figure 3. The body weight, systolic, and diastolic pressures were significantly higher in both hypertensive groups compared with that in the normotensive group (p<0.05), but there was no significant difference in heart rates between the three groups.

The differences of systolic and diastolic pressures, heart rate, and body weight between the normotensives, hypertensives without heart dysfunction (HTN-N), and hypertensives with mild diastolic dysfunction (HTN-A). *p<0.05 versus the normotensive subjects.
Spectral HRV parameter differences between the three groups
The differences of spectral HRV parameters are shown in Figure 4. The HF, LF/HF, or HF% have no significant difference between the three groups. The parameter LF was decreased in both hypertensive groups, reducing significantly in HTN-A, compared with that in the normotensive group (p<0.05), and the decrease of sympathetic modulation was more obvious than that of vagal modulation in HTN-A. The LF/HF was lower in the HTN-A than that in the normotensives or HTN-N.

The differences of spectral heart rate variability parameters, low frequency (LF), high frequency (HF), LF/HF, and total spectral power (HF%) between the normotensives, hypertensives without heart dysfunction (HTN-N), and hypertensives with mild diastolic dysfunction (HTN-A). *p<0.05 versus the normotensive subjects.
Radial pressure pulse differences between three groups
The differences of radial pulse pressure and AIr between three groups are shown in Figure 5A and 5B. There is no significant difference in the pulse pressures of the six positions among the three groups. All the AIr of the six positions were significantly higher in HTN-N compared with that in the other two groups (p<0.05). The difference of spectral energy is shown in Figure 6. At the six positions, the SE0–10Hz in both hypertensive groups and the SE10–50Hz in the HTN-A group were significantly higher compared with those in the normotensive group. Also, SE10–50Hz at right Chy, left Chun, and left Guan in the HTN-N group were higher than those in the normotensive group (Table 2). The EP10–50Hz% significantly decreased only at the LI position in both hypertensive groups compared with that in the normotensive group (p<0.05).
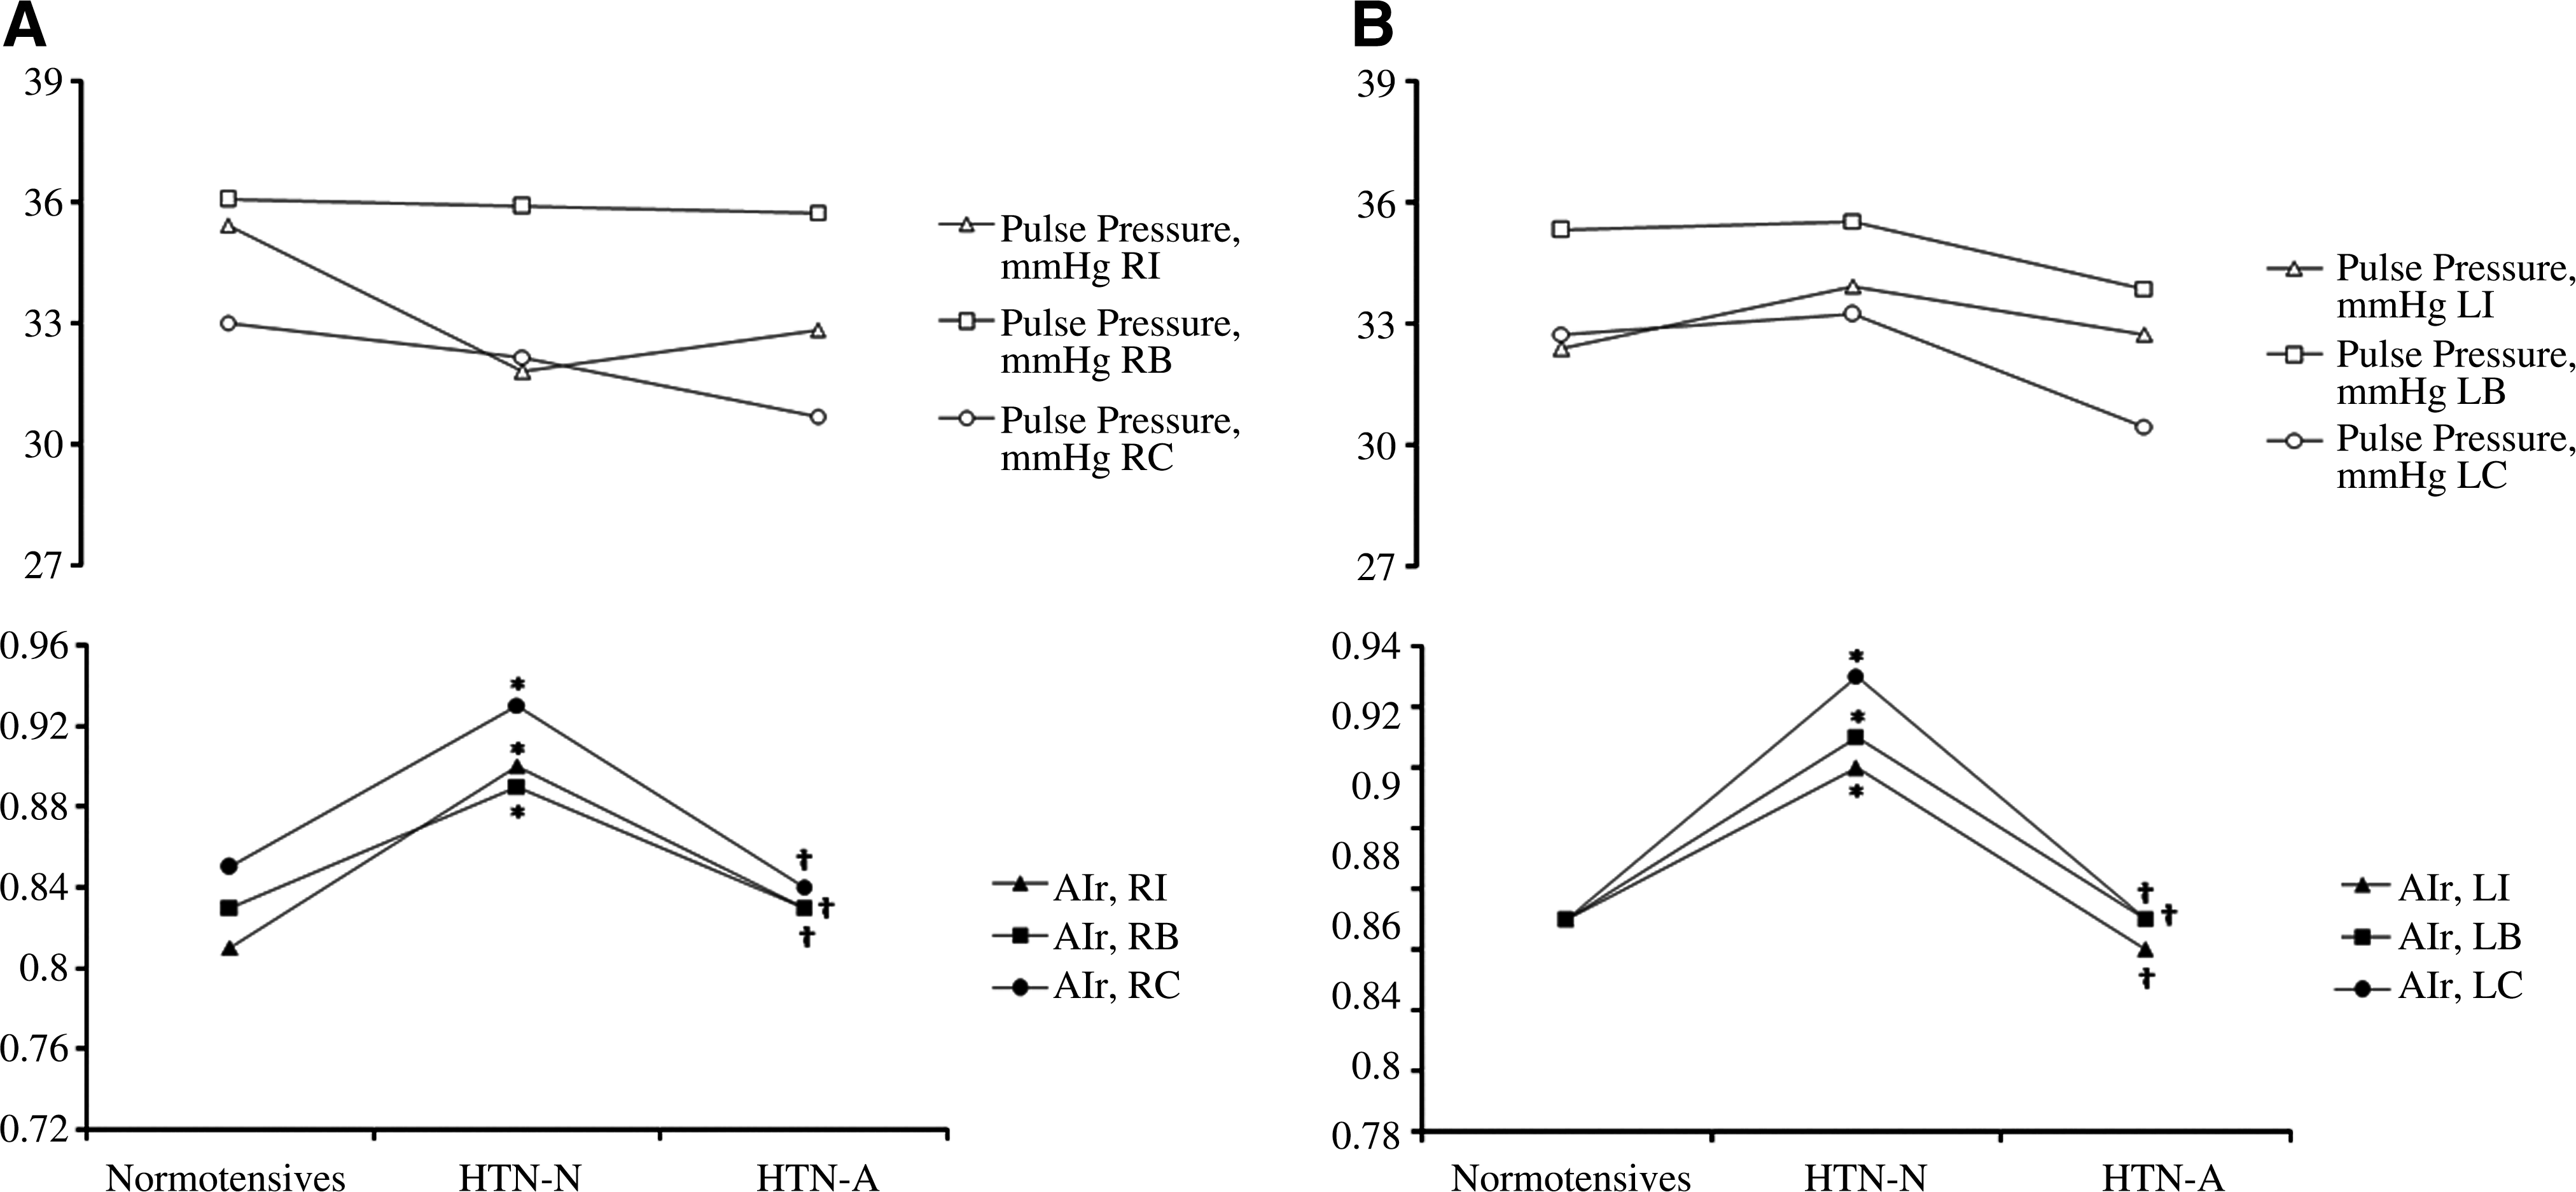
The differences of pulse pressures and radial augmentation index (AIr) at six diagnosis positions between the normotensives, hypertensives without heart dysfunction (HTN-N), and hypertensives with mild diastolic dysfunction (HTN-A).
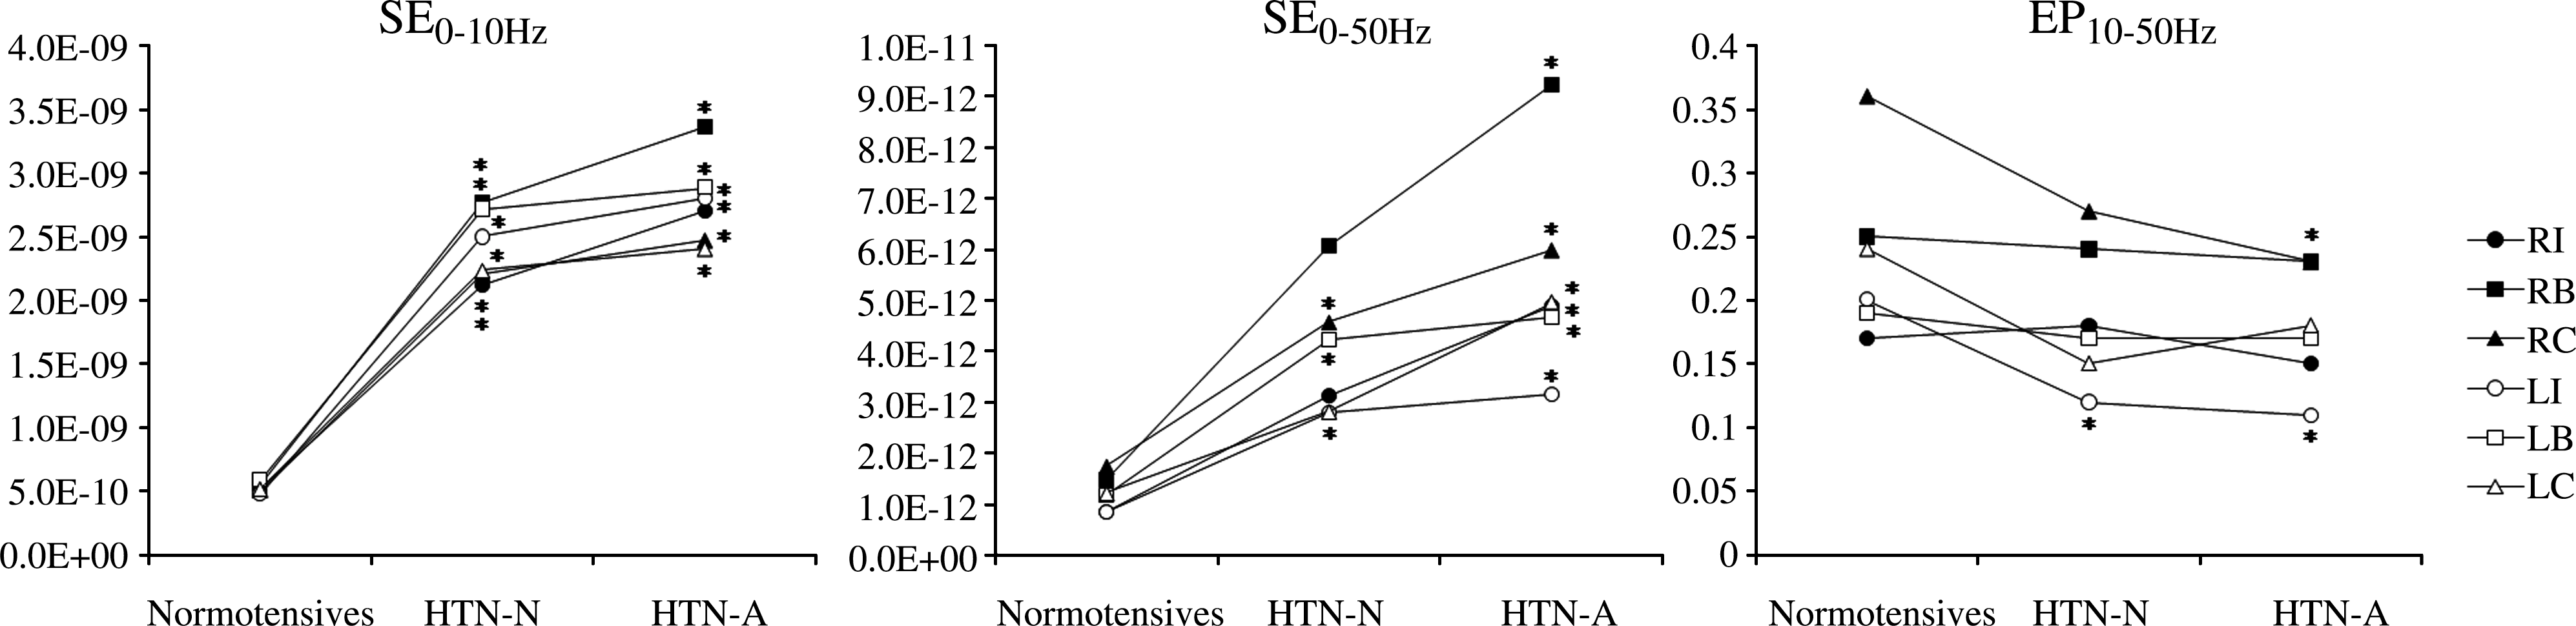
The differences of spectral energy of 0–10 Hz (SE0–10Hz), SE10–50Hz, and energy proportion 10–50 Hz% (EP10–50Hz%) at six diagnosis positions between the normotensives, hypertensives without heart dysfunction (HTN-N), and hypertensives with mild diastolic dysfunction (HTN-A). *p<0.05 versus the normotensive subjects.
Radial pressure pulse differences between the six diagnosis positions
The differences of AIr and EP10–50Hz% between the six positions are shown in Figure 7. The AIr in the normotensives revealed significant differences among the six positions (F5,225=3.835, p=0.00280). Post-hoc Bonferroni's-adjusted analyses showed that the AIr of the right Chun position was significantly lower than that of the other positions (p<0.05). The AIr in both hypertensive groups revealed no significant difference among the six positions (p>0.05). The EP10–50Hz% of the six positions in the normotensives revealed a significant difference (F5,225=14.504, p=2.559E-12). Post-hoc Bonferroni's-adjusted analyses showed that the EP10–50Hz% of right Chy (RC) position was significantly higher than that of the other positions (p<0.05). There were also significant differences of the EP10–50Hz% among the six positions in HTN-N and HTN-A (F5,225=5.724, p=5.483E-05, and F5,225=4.359, p=0.00083, respectively). Post-hoc Bonferroni's-adjusted analyses showed that the EP10–50Hz% of right Guan (RB) position and RC positions in HTN-N were significantly higher than that of left Chun (LI) and left Chy (LC) positions. The EP10–50Hz% of RB and RC positions in HTN-A were significantly higher than that of the LI position.
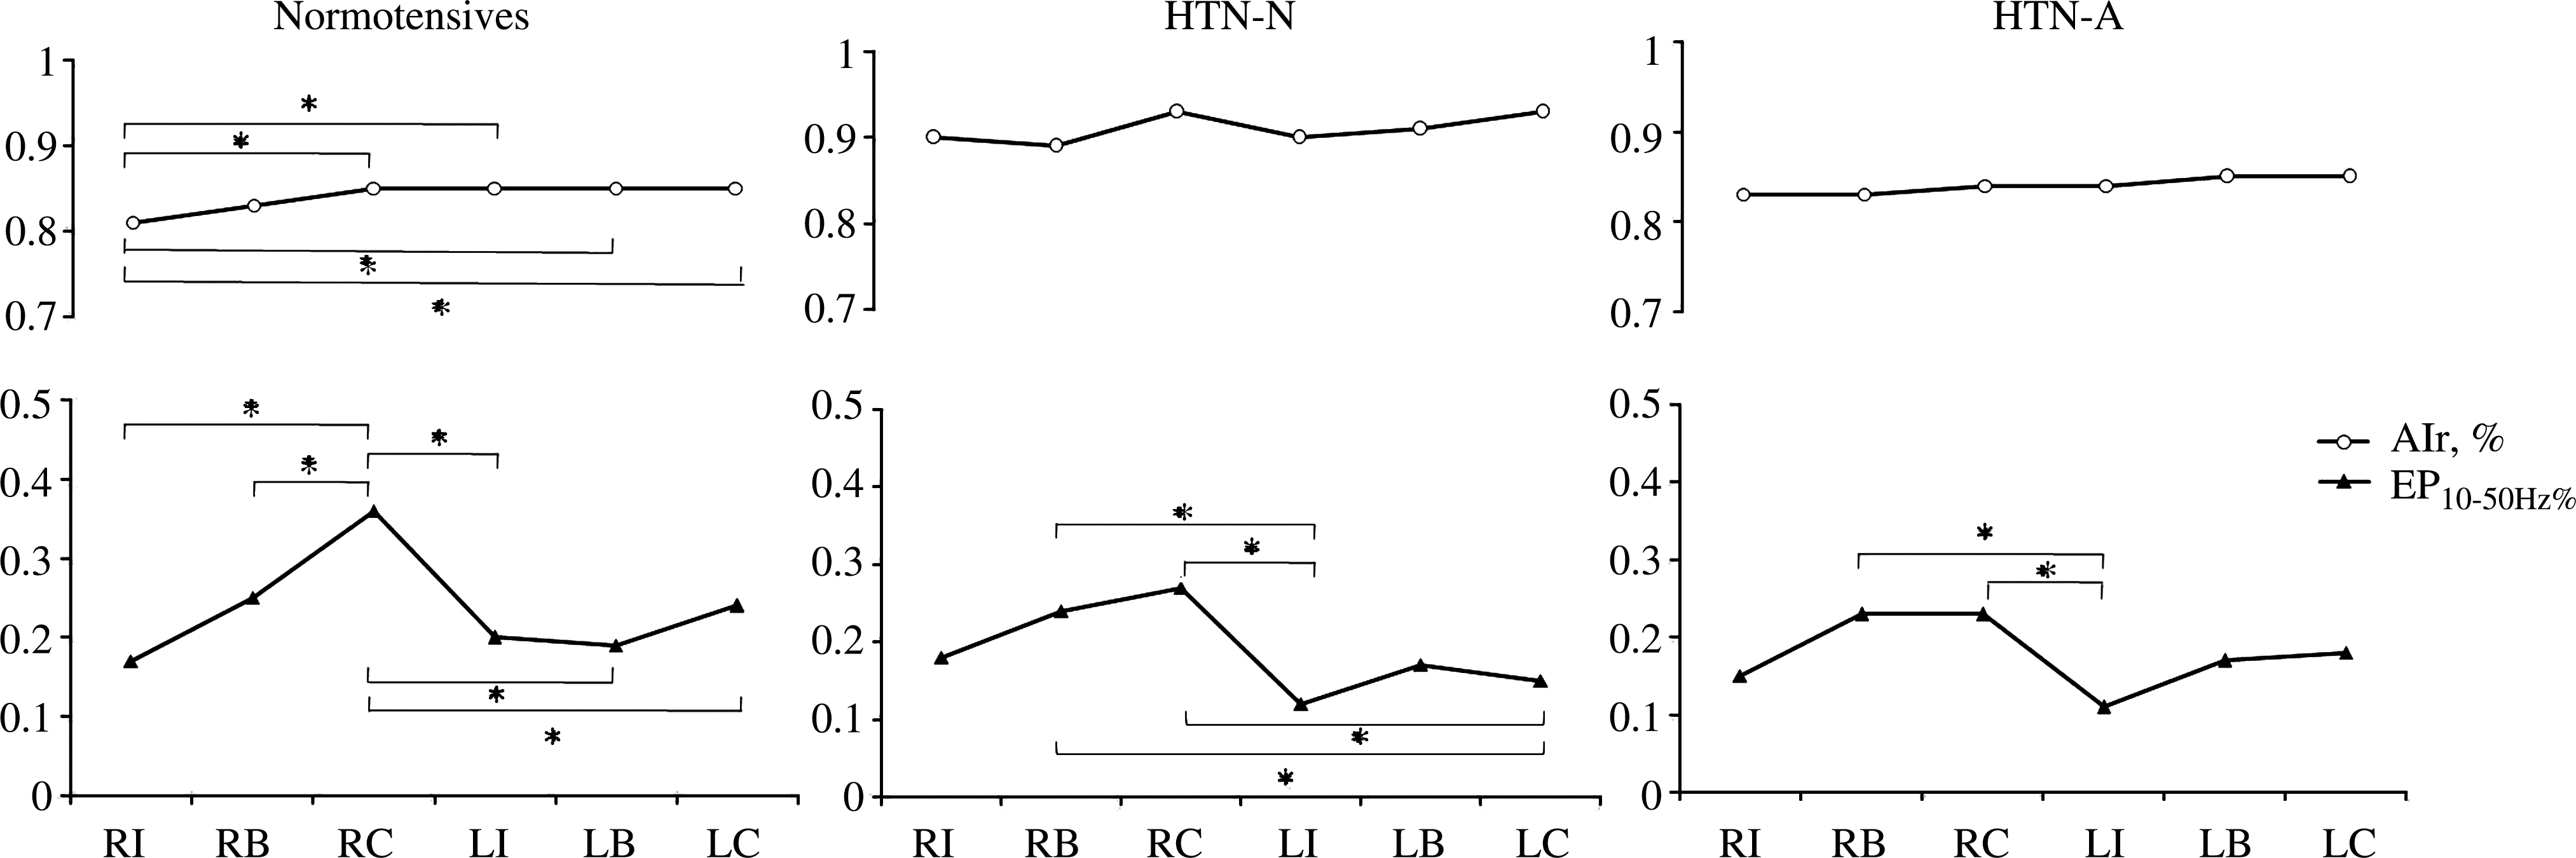
The differences of radial augmentation index (AIr) and energy proportion 10–50 Hz% (EP10–50Hz%) between the six diagnosis positions in the normotensives, hypertensives without heart dysfunction (HTN-N), and hypertensives with mild diastolic dysfunction (HTN-A). *p<0.05 between the six diagnosis positions in each group. RI, right Chun position; RB, right Guan position; RC, right Chy position; LI, left Chun position; LB, left Guan position; LC, left Chy position.
Discussion
This is the first study that analyzed the time- and frequency-domain of RPP at the six diagnosis positions. The significant findings of this study are that there are significant differences among the six diagnosis positions for EP10–50Hz% but not AIr in the three groups, which indicates that EP10–50Hz% possesses more meaningful characteristics than AIr does. The EP10–50Hz% significantly decreased only at the LI position in both hypertensive groups compared with that in the normotensive group, which demonstrates that the LI position is qualified to discriminate the differences between the normotensives and hypertensives. The results lend strong evidence in support of the TCM theory that the cardiac system can be detected through the LI position of the wrist.
As shown in Figure 3, the body weight was significantly higher in both hypertensive groups, which revealed that overweight is implicated in hypertension. 20 Based on the spectral analysis of HRV, the parameter LF was decreased in both hypertensive groups, especially in HTN-A, and the decrease of sympathetic modulation was more obvious than that of vagal modulation (Fig. 4). It denotes a depressed sympathetic modulation and a sympathovagal imbalanced state in HTN-A. Our findings are consistent with prior studies by Singh et al. (1998). 21
All of the AIr at the six positions were significantly higher in HTN-N compared with the normotensive and HTN-A groups (Fig. 5). The results indicated that the increase of peripheral resistance in HTN-N enhances the amplitude of reflection waves. The parameters of AIr in HTN-A and the normotensives were similar and significantly lower than that in HTN-N. These findings are consistent with prior studies by Mitchell et al. (2001) that AI was not a good indicator of central aortic stiffness in heart dysfunction, and the impaired functions of myocyte contractility and electrical activation were speculated. 8 In this study, the significantly reduced LF in HTN-A demonstrates a depressed sympathetic activity in heart dysfunction.
The radial pulse pressure of the six positions among the three groups revealed no significant difference, which indicates that the lower-frequency components of the waveform that influenced the pulse pressure has few specific characteristics in differentiating the normotensives and the hypertensives (Fig. 5). The SE0–10Hz at the six positions and the SE10–50Hz at most positions in both hypertensive groups were significantly higher compared with those in the normotensive group (Table 2, Fig. 6), which denoted that there are higher energies of pressure waves in hypertensive individuals. The higher peripheral vascular resistance and reduced lumen in hypertensive individuals would induce higher natural frequency response 1,22 and enhance the higher-frequency energy dissipation of blood flow. 2 Hence, the reduction of the peripheral vascular lumen in the hypertensive groups decreased not the lower spectral energy of 0–10 Hz but the higher spectral energy of 10–50 Hz, which induced the decreased EP10–50Hz% (Fig. 6).
The AIr in the normotensives, not in the hypertensives, and EP10–50Hz% in three groups revealed significant differences among the six positions. The results revealed that the AIr among the six positions in the hypertensives are not different, but the higher-frequency components are dissimilar, which accord with prior study by Davies et al. (2007) and Lee et al. (2008) that the BP characteristics of the diagnosis positions are different and the wave pressure is influenced more by local arterial resistance and compliance of the arteries. 7,11
In the three groups, the EP10–50Hz% at Chy position is larger than that at Chun and the EP10–50Hz% of LI position is significantly lower in the both hypertensive groups than that in the normotensives (Fig. 7). The result is similar to the prior study by Lee et al. (2008) that blood velocity was the greatest in Chy, and gradually slowed toward Chun. 11 The left radial artery is nearer the heart than the right artery. Also, the Chun position is closer to the hand than Guan and Chy positions, so its pulse receives the reflection waves mainly from the hand. The Chy position is the farthest to the hand that is directly influenced by the reflection waves from the whole body, and the blood flow of the right hand is more predominant than that of the left hand; 23 thus, the EP10–50Hz% at RC position is the largest. From the above viewpoints, the energy in left the Chun position is less influenced than the other positions by reflection waves; as a result, it is the best to reflect the cardiac function. The results accord with the TCM theory that the LI position of wrist can detect the cardiac system.
Conclusions
In conclusion, this study demonstrates the following results: (1) LF, the spectral HRV parameter, was reduced in both hypertensive groups and significantly decreased in HTN-A, which demonstrates a depressed sympathetic activity in heart dysfunction. (2) The EP10–50Hz% is a novel viewpoint that can reveal the specific characteristics of RPP and significantly varied at the six positions. (3) The LI position is qualified to discriminate the difference between the normotensives and the hypertensives.
To the authors' knowledge, this is the first attempt that uses simultaneously time- and frequency-domain analysis to quantitatively study the characteristics of the radial artery at right/left diagnosis positions of Chun, Guan, and Chy in normal subjects and hypertensives. The results explicitly indicated that the difference at the six diagnosis positions and the higher-frequency energy of RPP could provide more meaning than AIr.
Footnotes
Acknowledgments
This study has been supported with a grant (DMR-98-004) from the Chinese Medical University Hospital, Taiwan.
Disclosure Statement
No competing financial interests exist.