




Abstract
Purpose:
The present study examined if pulse waveform parameters (PWPs) are indicative of mood state and chronic fatigue associated with pathologic patterns in East Asian medicine and if cardiovascular autonomic function is associated with relationships among PWPs, mood, and fatigue.
Methods:
A total of 43 healthy college students (men:women=31:12), ages 19–24, were enrolled in the study. Each subject completed the standard Profile of Mood States and the revised Chalder Fatigue Questionnaire. The current authors developed a MATLAB-based software program to calculate time- and amplitude-related photoplethysmography (PTG) and the parameters of the first and second derivatives of PTG (FDPTG and SDPTG, respectively). Based on peak-to-peak intervals detected using PTG, we also calculated pulse rate variability parameters, such as low frequency (LF), high frequency (HF), total power (TP), and the ratio of low frequency to high frequency power (LF/HF).
Results:
In men and women, time-related dicrotic parameters of the FDPTG and SDPTG were indicative of depression and anger related to Liver Qi Stagnancy and Phlegm patterns. In men, time-related dicrotic wave parameters were indicative of mental fatigue associated with the Heart Deficiency pattern, whereas vascular augmentation–related parameters were indicative of physical fatigue associated with the Spleen Deficiency pattern in women. In women, sympathovagal balance–related LF/HF was associated with relationships among vascular augmentation–related parameters, fatigue mood, and chronic fatigue.
Conclusions:
These results suggest that PWPs are indicative of mood state and chronic fatigue associated with pathologic patterns in East Asian medicine. The results also showed significant gender differences.
Introduction
In Western medicine, the clinical applications of PWPs have broadened in terms of diagnosing structural arterial-wall pathologies, and it is generally accepted that arterial compliance estimated using pulse waves correlates with the presence of arteriosclerosis, hypertension, atherosclerosis, diabetes mellitus, premature aortic degeneration, and heart failure. 6 Some studies suggest that PWPs are associated with changes in autonomic function. These studies are categorized into two parts: pulse rate variability (PRV) 7 and emotional monitoring. 8,9
In East Asian medicine, a specific pulse pattern is considered to be indicative of a pathologic pattern. For example, a “taut” pulse is indicative of Liver or Gallbladder conditions such as the Flaming-Up of Liver Fire, Stagnancy of the Liver Qi, Hyperactivity of Liver Yang, and Damp-Heat of the Liver and Gallbladder. 2 A “feeble” pulse is also indicative of a deficiency in the body such as deficiency of Qi, Blood, Yin, and Yang. 2 It is generally accepted that specific emotions or moods are associated with specific pathologic patterns. For example, anger is a clinical feature of the Flaming-Up of Liver Fire pattern, 10 and anxiety or fear is a clinical characteristic of the Phlegm-Fire pattern. 11 Together with emotion or mood, chronic fatigue is often associated with diverse Deficiency patterns such as the Spleen, Lung, and Kidney Deficiency pattern. 10 Shu and Sun theoretically classified indices for pulse diagnosis using RPPW parameters. 3 However, few studies have examined if PWPs are indicative of mood state or chronic fatigue associated with the pathologic patterns in East Asian medicine.
This study estimated mood and chronic fatigue using the standard Profile of Mood States (POMS) 12 and the revised Chalder Fatigue Questionnaire (CFQ). 13 MATLAB-based software programs were developed to calculate time- and amplitude-related PWPs. A pulse wave is composed of three waves: incident; tidal; and dicrotic. 4 When determining a specific point of an original pulse wave, aging or arterial stiffness-related diseases such as hypertension often attenuate this peak or notch of the original pulse wave. 4 To overcome this problem, the second derivative of photopletysmography (SDPTG) has been suggested and has also been clinically validated. 14 Recently, Wu et al. reported that the first derivative of photopletysmography (FDPTG) is beneficial for detection of the dicrotic peak. 15 However, few studies have addressed which of the parameters among overall PTG, FDPTG, and SDPTG parameters are indicative of mood states and chronic fatigue.
Together with the estimation of PWPs, moods, and chronic fatigue, cardiovascular autonomic function using PRV was estimated. PRV parameters refer not only to emotional changes, but also to the mood state in a resting condition. 16 Cardiovascular autonomic function is also related to chronic fatigue. 17 Because vascular tone estimated using PWPs is related to mood, and mood and chronic fatigue are also related to cardiovascular autonomic function, it is plausible that PWPs are related to mood and chronic fatigue associated with pathologic patterns. This relationship may be partially associated with cardiovascular autonomic function.
In sum, the purpose of the present study was to examine (1) which parameters among PTG, SDPTG, and FDPTG are most indicative of mood state and chronic fatigue associated with pathologic patterns in East Asian medicine, and (2) if these relationships are consistent with those between PWPs and cardiovascular autonomic function estimated using PRV parameters.
Subjects and Methods
Subjects
A total of 43 healthy Korean college students (31 men, 12 women) volunteered for the study. Men ranged in age from 19 to 23 (mean=20.2±0.9 years), and women ranged in age from 19 to 24 (mean=20.2±1.3 years). Men ranged in mean BP (MBP) from 66.7 to 103.3 mmHg (mean=87.7±9.0 mmHg), and women ranged in MBP from 56.7 to 93.3 mmHg (mean=81.7±10.2 mmHg). Men ranged in height from 163 to 184 cm (mean=175.0±5.2 cm), and women ranged in height from 156 to 169 cm (mean=163.5±3.8 mmHg). Men ranged in body mass index (BMI) from 18.8 to 28.1 kg/m2 (mean=22.2±2.3 kg/m2), and women ranged in BMI from 17.2 to 24.1 kg/m2 (mean=20.4±1.8 kg/m2). There were no significant differences in age or MBP between genders. However, height and BMI in men were significantly greater than those in women. Based on self-reports, subjects with arrhythmia, hypertension, and diabetes mellitus were excluded. Informed consent was obtained from all subjects prior to enrollment in the study.
Methods
Mood states and fatigue measures. The POMS standard consists of 65 items that are self-rated on a 5-point scale of 0=“not at all,” 1=“a little,” 2=“moderately,” 3=“quite a bit,” and 4=“extremely.” 12 Among the 6 subscales, tension, depression, anger, fatigue, and confusion are negative-affect scales, whereas vigor is a positive-affect scale. The 6 subscales of the POMS were summed and transformed into z-scores. The CFQ is a revised 11-item version assessing physical and mental fatigue using a 4-point scale of 0=“better than usual,” 1=“no more than usual,” 2=“worse than usual,” and 3=“much worse than usual.” 13 Among the 11 items of the CFQ, 7 refer to physical fatigue and 4 refer to mental fatigue. Scores for the physical and mental fatigue subscales were summed and transformed to z-scores. For both the POMS and CFQ subscales, the below-zero group was defined as the low-score group, and the above-zero group as the high-score group. The dichotomous variables for the POMS and fatigue subscales were then used to examine if each pulse waveform parameter showed a significant difference between the low- and high-scoring groups.
PTG detection and analysis
Each subject was seated in a comfortable chair in a quiet room and asked to relax for 15 minutes. After the relaxation period, a PTG transducer, a reflectance-type sensor designed to attach to a finger, was strapped to the subject's left second finger and connected to the PTG amplifier (BIOPAC Systems Inc., Goleta, CA). The MP100, a computer-based data acquisition system with AcqKnowledge 3.7.3 software, was used to acquire PTG data for 7 minutes at a sampling rate of 512 Hz. The data were then cropped for the best stable 2-minute section and saved in text format. In this study, the stand-alone software with a graphic user interface (GUI) was developed using MATLAB 7.1 (MathWorks, Natick, MA) to calculate the parameters of the PTG, FDPTG, and SDPTG curves.
The peak detection algorithm used in this study was based on the algorithm suggested by Billauer. 18 Figure 1 illustrates PTG, FDPTG, and SDPTG samples, and Table 1 lists definitions of the PTG, FDPTG, and SDPTG parameters. In this study, point T of the PTG curve was not detected in some PTG samples. Thus, point T was fixed manually based on the FDPTG curve, because point T of the PTG curve was more prominent in its differential curve. Based on auto-detected or manually fixed points, all the time- and amplitude-related parameters were automatically recalculated.
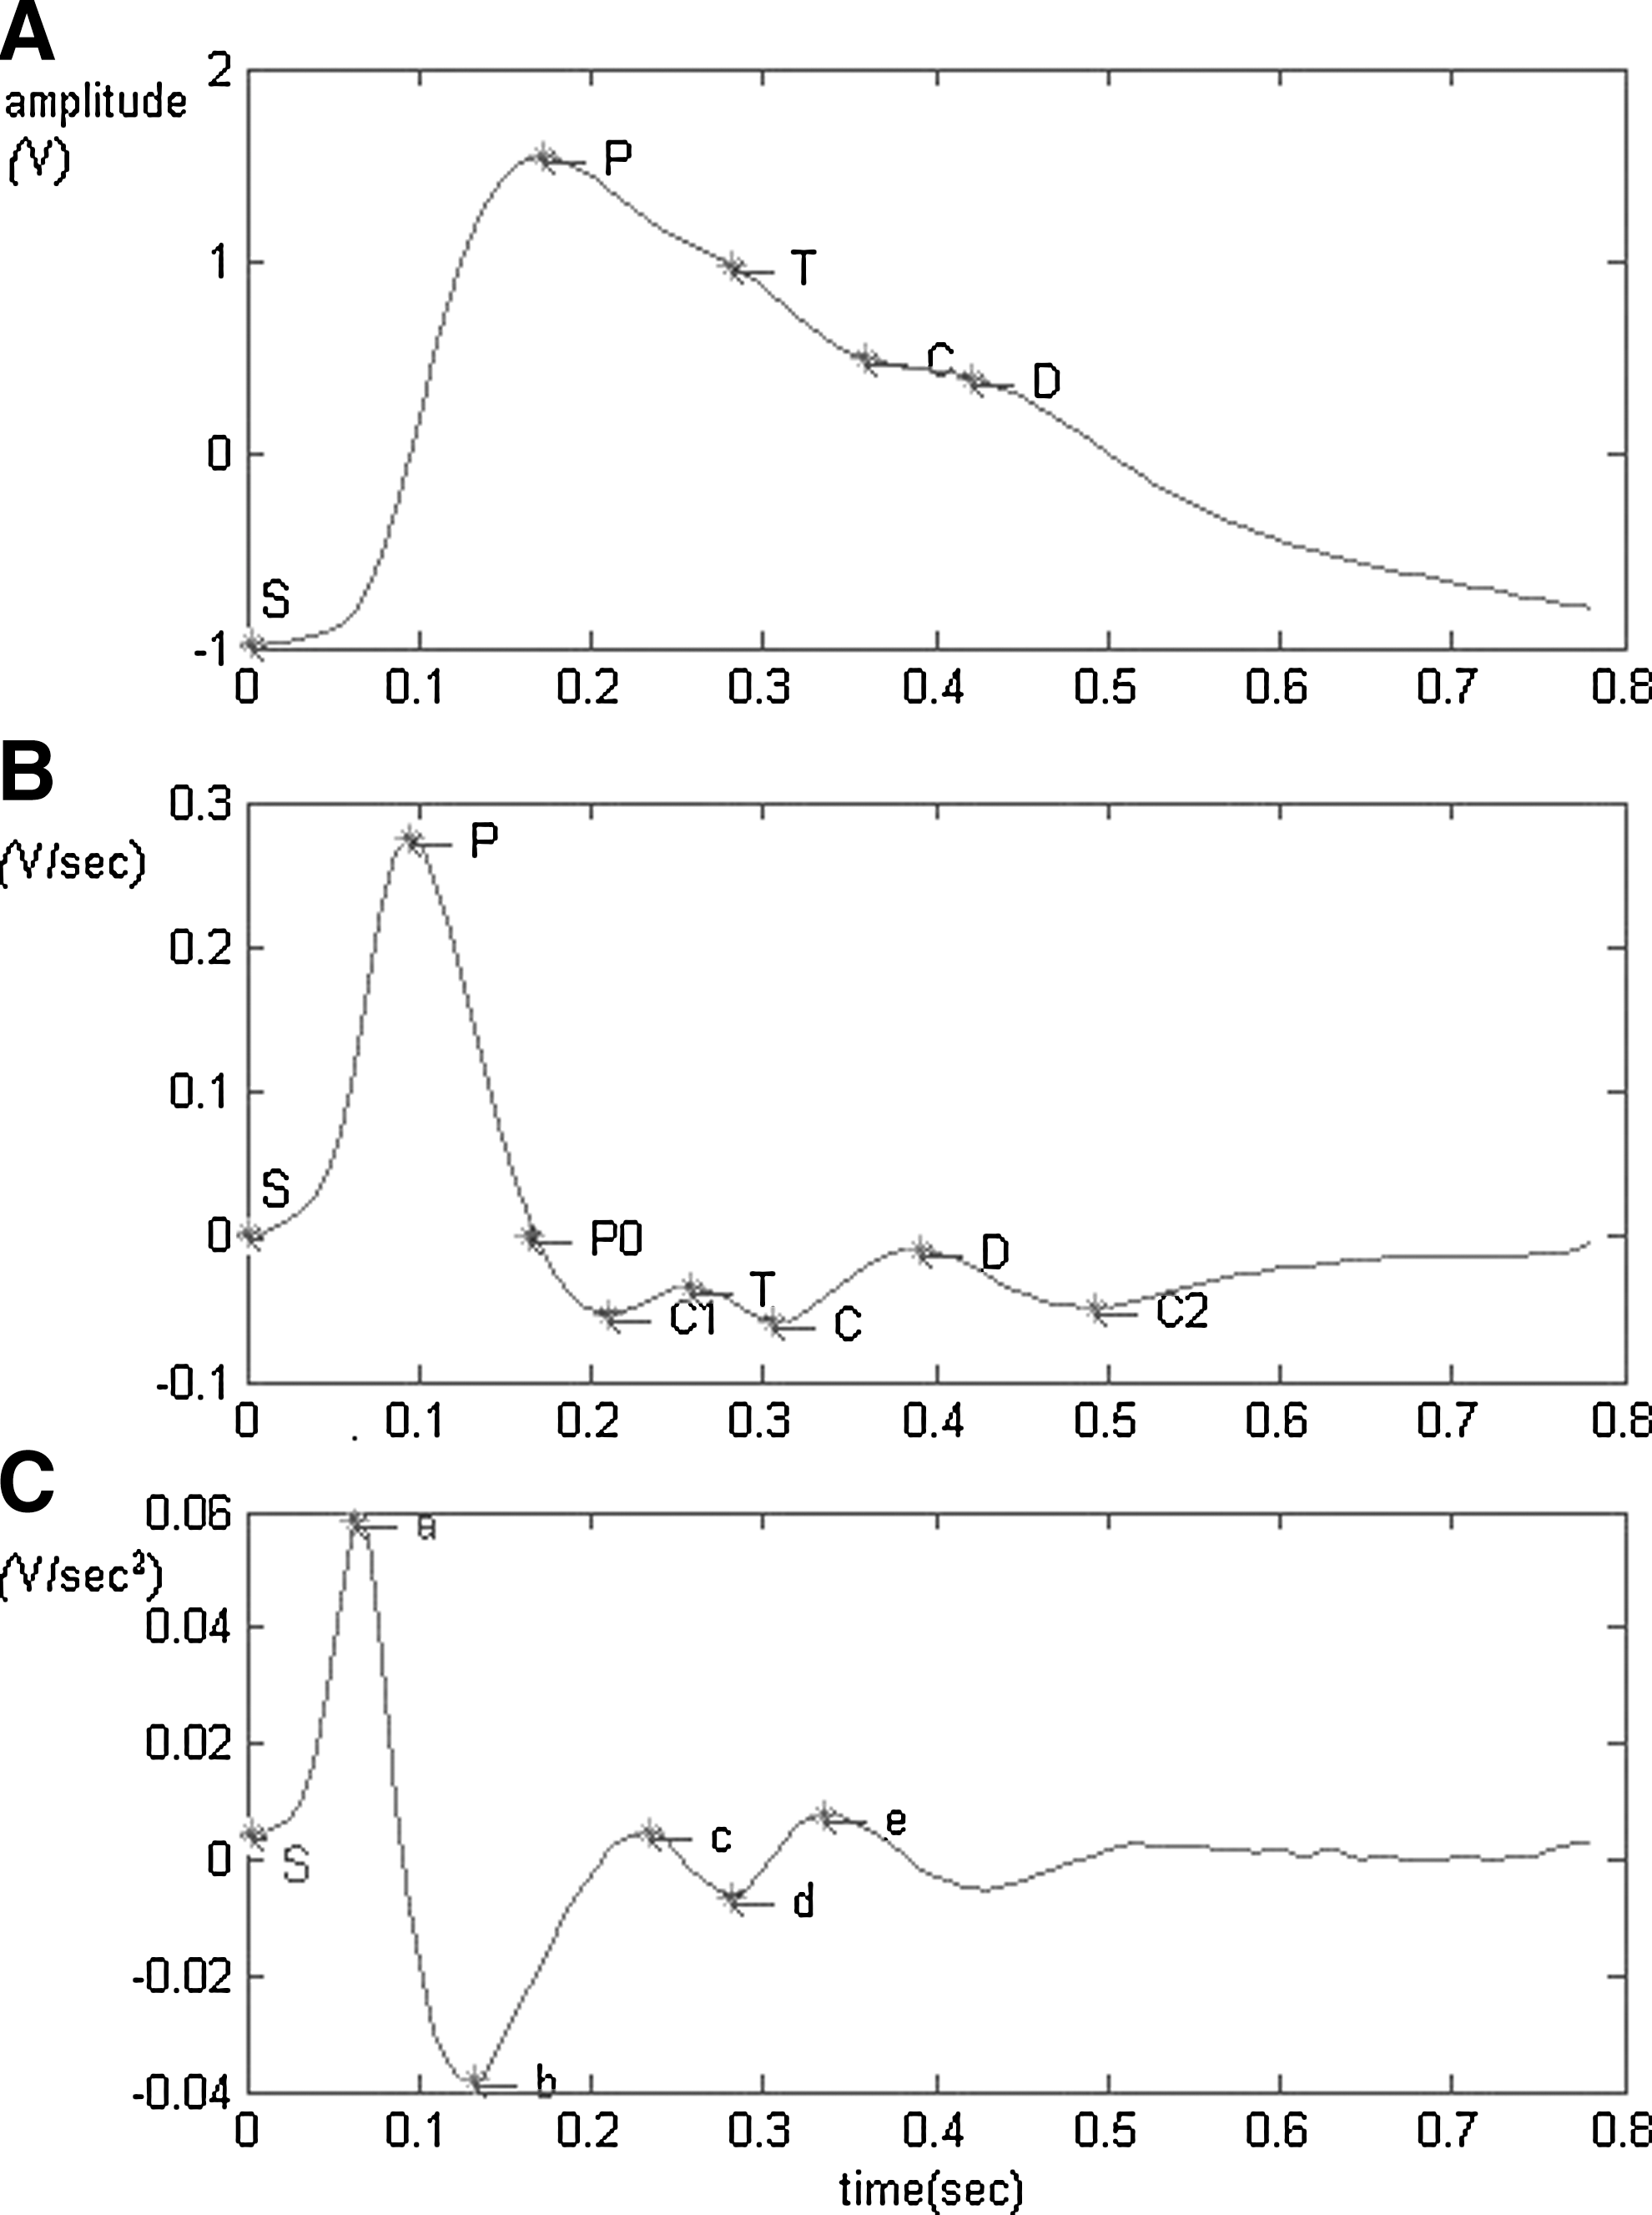
Illustrations of photoplethysmography (PTG), first derivative of photoplethysmography, (FDPTG), and second derivative of photoplethysmography (STPTG) parameters. PTG, FDPTG, and SDPTG are shown as
PTG, photoplethysmography, FDPTG, first derivative of photoplethysmography, STPTG, second derivative of photoplethysmography; AI, augmentation index; CI, coefficient of incidura; DI, dicrotic index.
PRV detection and analysis
In this study, acquired PTG data were cropped for the best stable 5-minute sections and were imported into MATLAB 7.1 to detect the peak point of the PTG and to calculate the interbeat interval (IBI), using cubic interpolation (interp1) at a rate of 4Hz. 16 Peak-detected data were saved in text format and then imported into Complexity 2.0 (Laxtha Co., Daejeon, Korea) to calculate the spectral power of LF (0.04–0.15 Hz), HF (0.15–0.4 Hz), TP, and LF/HF using the fast Fourier-transform algorithm. Each parameter was log-transformed to produce a normal distribution.
Statistical analyses
Because it is generally accepted that arterial stiffness is gender-dependent, 19 and significant gender differences were observed in the POMS subscales and PWPs (Tables 2 and 3), PWPs were analyzed separately by gender. The Mann–Whitney U test was used to determine whether there were significant differences in each PWP between high- and low-score groups on the POMS and the fatigue subscales. Because it is also accepted that BP, height, and obesity affect arterial stiffness, 6,20 the Mann–Whitney U test was used to determine if there were significant differences in each PWP among high and low MBP, height, and BMI groups. Spearman's correlations between PRV and pulse waveform parameters were performed. In all analyses, statistical significance was set at a threshold of p<0.05.
Values are presented as mean±standard deviation. Bolding indicates significant differences between genders.
p<0.05.
POMS, Profile of Mood States; CFQ, Chalder Fatigue Questionnaire.
Bolding indicates significant differences between genders.
p<0.05.
PTG, photoplethysmography; FDPTG, first derivative of photoplethysmography; SDPTG, second derivative of photoplethysmography.
Results
When examining the differences in pulse waveform parameters among low and high MBP, height, and BMI groups in men and women, C1T/SP (–0.02±0.08) in the low–MBP male group was lower than C1T/SP (0.04±0.08) in the high-MBP male group (p<0.05), and PC1/SP (1.18±0.11) and CD/SP (0.19±0.08) in the shorter male group were lower than PC1/SP (1.24±0.09) and CD/SP (0.26±0.08) in the taller male group (p<0.05, respectively). In women, none of PWPs differed between low and high MBP, height, or BMI groups, suggesting that MBP and height should be considered in men when mood states and fatigue are estimated using PC1/SP, C1T/SP, and CD/SP of the FDPTG. Mean values of the POMS and CFQ subscales are listed in Table 2 and the mean values of the PTG, FDPTG, and SDPTG parameters are listed in Table 3. Gender differences were found on the anger and fatigue subscales. In terms of pulse waveform parameters, TD of the PTG, TD and TC2 of the FDPTG and T e of the SDPTG differed between the genders.
Table 4 lists differences in PTG parameters between low and high POMS subscale groups in men and women. In men, TD parameters in the low depression and anger groups were greater than those in the high-depression and -anger groups. In women, ST/SP in the high-fatigue group was higher than that in the low fatigue group, and TC in the high-fatigue group was greater than that in the low fatigue group. This indicates that TD of the PTG was indicative of depression and anger only in men, whereas ST/SP of the PTG was indicative of fatigue only in women.
Bold letters indicate significant differences between low and high POMS subscale groups.
p<0.05, ** p<0.01.
PTG, photoplethysmography; POMS, Profile of Mood States.
Tables 5 and 6 list differences in FDPTG and SDPTG parameters between the low-and high-POMS subscale groups in men and women. In men, DC2/SP in the high-vigor group was higher than that in the low-vigor group. The TD parameters in the high-depression and -anger groups were greater than those in the low-depression and -anger groups. The T e parameters in the high-tension, -depression, and -anger groups were greater than those in the low-tension, -depression, and -anger groups. In women, PC1/SP and TC/SP in the high-fatigue group were higher than those in the low-fatigue group, and TD, T d , and T e in the high- fatigue group were greater than those in the low-fatigue group. As in men, T e parameters in the female high-depression and -anger groups were greater than those in the low-depression and -anger groups. The T a parameters in the high-anger and -confusion groups were greater than those in the low-anger and -confusion groups. This indicates that time-related parameters such as T e are indicative of depression and anger in men and women. Figure 2 shows two examples of the low- and high-depression and -anger groups in men.
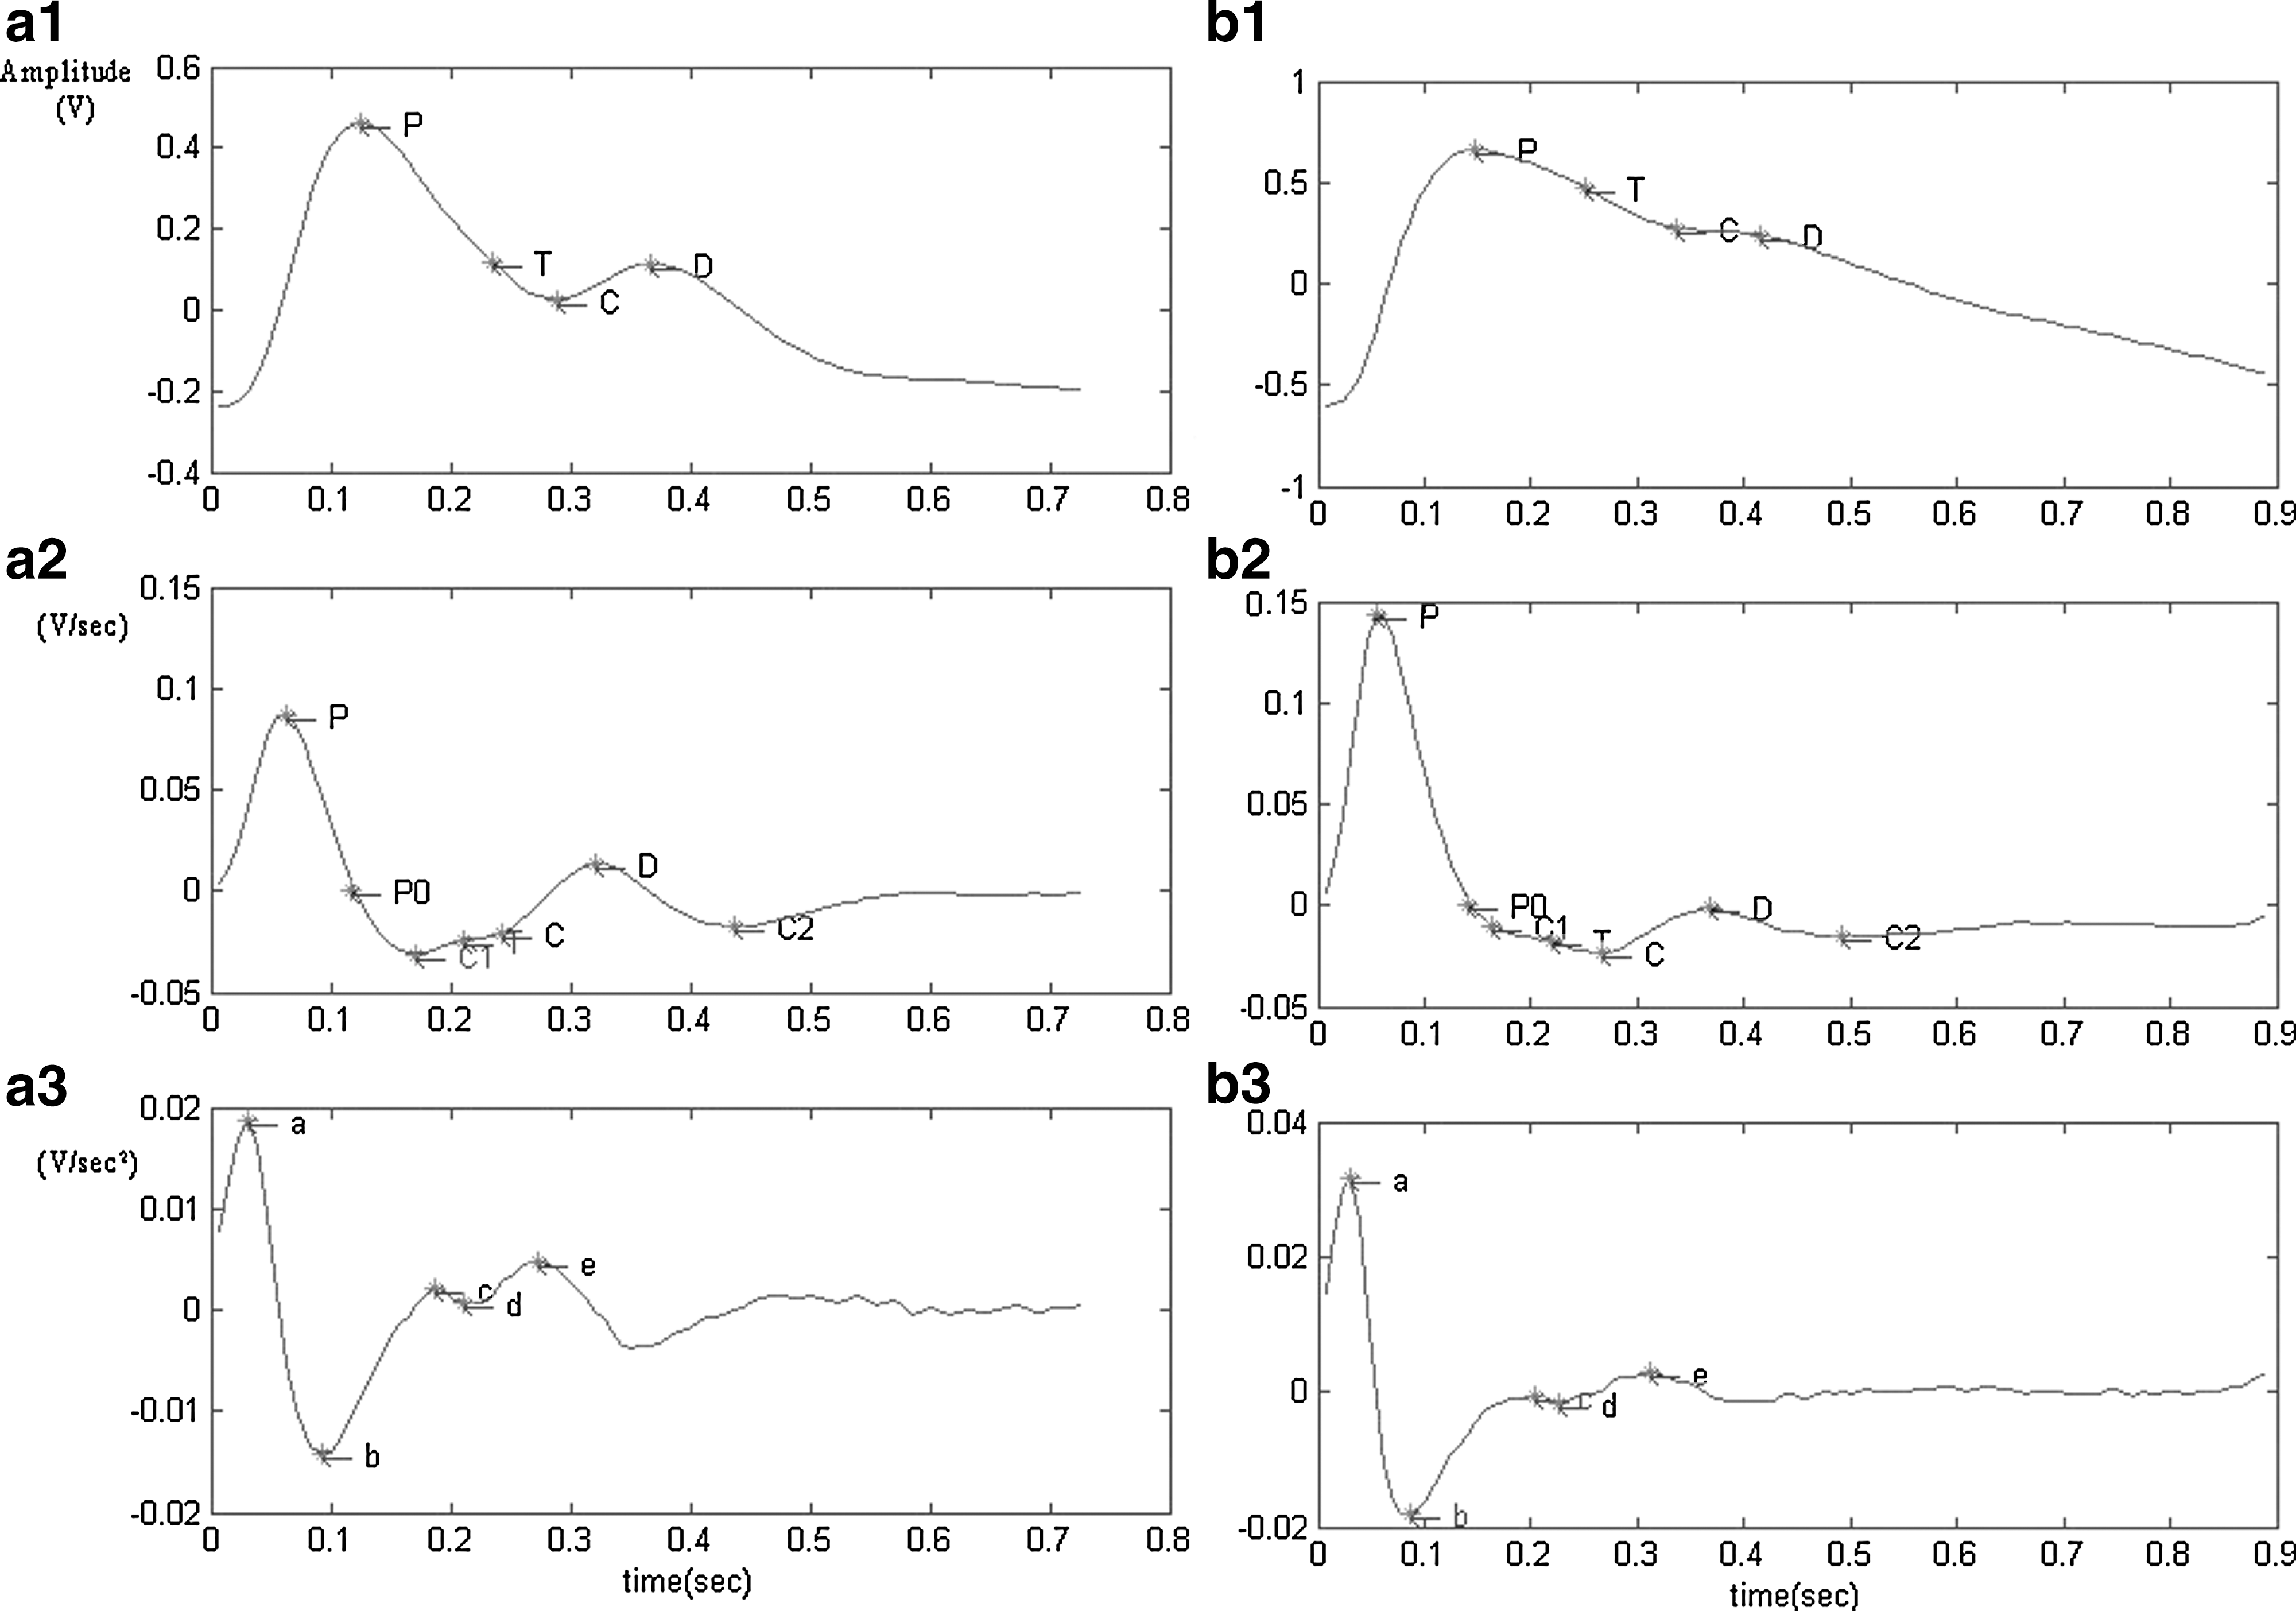
Two examples of photoplethysmography (PTG), first derivative of photoplethysmography, (FDPTG), and second derivative of photoplethysmography (STPTG) in men. The a1 and b1 pulse waveforms represent PTG, the a2 and b2 represent FDPTG, and the a3 and b3 represent SDPTG. The samples are pulse waveforms from 2 subjects; the graphs on the left
Bolding indicates significant differences between low and high POMS subscale groups.
The shaded data refers to FDPTG-related parameters and values. The remaining data are SDPTG-related parameters and values.
p<0.05.
FDPTG, first derivative of photoplethysmography; SDPTG, second derivative of photoplethysmography; POMS, Profile of Mood States.
Bolding indicates significant differences between low and high POMS subscale groups.
The shaded data refers to FDPTG-related parameters and values. The remaining data are SDPTG-related parameters and values.
p<0.05.
FDPTG, first derivative of photoplethysmography; SDPTG, second derivative of photoplethysmography; POMS, Profile of Mood States.
Table 7 lists differences in the PWPs between low- and high-CFQ subscale groups in men and women. In men, PPI and FDPTG-TD in the high–physical fatigue group were greater than those in the low–physical fatigue group. The DC2/SP in the high–physical fatigue group was lower than that in the low–physical fatigue group, while FDPTG TC and TD, and SDPTG T d , T e and the c/a in the high–mental fatigue group were greater than those in the low–mental fatigue group. In women, only TC/SP in the high–physical fatigue group was higher than that in the low–physical fatigue group. This indicates that, unlike fatigue, PWPs were more indicative of physical and mental fatigue in men than they were in women.
Bolding indicates significant differences between low and high CFQ subscale groups.
p<0.05, ** p<0.01.
CFQ, Chalder Fatigue Questionnaire; PTG, photoplethysmography; FDPTG, first derivative of photoplethysmography; SDPTG, second derivative of photoplethysmography.
Table 8 lists the Spearman's correlations between pulse waveform and PRV parameters in men and women. In men, LF/HF was positively correlated with SC/SP and TP of the PTG and TC2 of the FDPTG. LF/HF was correlated negatively with PC1/SP of the FDPTG. LF was positively correlated with SC/SP and SD/SP of the PTG and TC2 of the FDPTG. In women, LF/HF was correlated negatively with ST/SP, SC/SP, TP, TC, and TD of the PTG and TC2 of the FDPTG. LF/HF was correlated positively with PC1/SP of the FDPTG. These data indicate that the sympathovagal balance–related LF/HF ratio was related to the SC/SP ratio and TC in men and women.
Bolding indicates significant correlation coefficients.
p<0.05, ** p<0.01.
PTG, photoplethysmography; FDPTG, first derivative of photoplethysmography; SDPTG, second derivative of photoplethysmography; PRV, pulse rate variability.
Discussion
In the current study, none of the PWPs differed between high and low MBP, height, or BMI groups in women. In men, parameters related to tidal and dicrotic wave amplitude differed between high and low MBP and height groups. However, these parameters were not indicative of mood state or chronic fatigue in men. Thus, these physical factors probably did not affect the correlations among mood, fatigue, and PWPs.
The findings revealed that time-related parameters of the dicrotic wave, such as TD and T e , were indicative of depression and anger in men and women. In men, TD and T e were both indicative of depression and anger, whereas only T e was indicative of depression and anger in women. These results suggest that T e of the SDPTG is a robust indicator of depression and anger in both men and women. The dicrotic wave is composed of the rebounding of large arteries immediately after the closure of the aortic valve and of the later reflective wave from peripheral arteries. 21 Parameters related to the dicrotic wave and the dicrotic notch have been utilized to estimate the effects of drugs on endothelial function or to examine aortic stenosis, 21,22 However, in this study, there was little possibility that large arterial changes may have been related to the dicrotic wave because all of the subjects were young, normotensive, and nonobese. Therefore, these present findings suggest that TD and T e in a resting state are indicative of depression and anger by attenuating the later reflective wave velocity (i.e., TD) or acceleration (i.e., T e ) from peripheral arteries. In East Asian medicine, anger and depression are associated with the Liver Qi Stagnancy pattern. 10 Recently, Park et al. reported that anger and depression scores of the POMS are correlated positively with the total score of the Phlegm Pattern Questionnaire (PPQ). 23 Therefore, the current study results suggest that mood disharmony associated with the Liver Qi Stagnancy and Phlegm patterns may be estimated using T e of the SDPTG in men and women.
LF/HF was correlated with vascular augmentation–related parameters such as SC/SP, Tp, and PC1/SP in men and women. These results are consistent with those of the previous studies in which acute or functional changes in the vascular augmentation–related parameters are related to sympathetic activation during emotional tasks. 8,9 Vascular augmentation–related parameters, such as SC/SP and TC/SP, were indicative of fatigue mood and physical chronic fatigue only in women. O'Rourke et al. reported findings of inappropriately high augmentation in some individuals, suggesting premature arterial aging without conventional risk factors. 6 Therefore, it appears that fatigue and chronic fatigue are related to vascular augmentation mediated by sympathovagal balance (i.e., LF/HF) in women, and these augmentation increases are not necessarily associated with structural changes in arterial stiffness but instead with functional changes in vascular tone. In East Asian medicine, mental fatigue is associated with the Heart Deficiency pattern, whereas physical fatigue is associated with the Spleen Deficiency pattern. 13 Therefore, the current study results suggest that, in men, time-related dicrotic wave parameters are mainly indicative of mental fatigue associated with the Heart Deficiency pattern, whereas in women, vascular augmentation–related parameters are indicative of physical fatigue associated with the Spleen Deficiency pattern.
The current study had several limitations. First, the generalizability of the results was limited because the age distribution of the sample ranged only from 19 to 24. Second, the number of women included in the sample was small. Third, in some samples, tidal wave–related parameters were not auto-detected and were manually adjusted, which may have increased the bias of tidal wave–related parameters of the FDPTG. Further investigations are needed to examine the mechanisms underlying the relationships among PWPs, autonomic function, mood state, and chronic fatigue in larger subject samples.
Conclusions
The results of this study suggest that PWPs are indicative of mood state and chronic fatigue associated with pathologic patterns in East Asian medicine. In men, time-related parameters of the dicrotic wave, such as TD and T e , were indicative of depression and anger related to Liver Qi Stagnancy and Phlegm patterns, as well as to chronic mental fatigue related to the Heart Deficiency pattern. In women, time-related parameters of the dicrotic wave, such as TD and T e , were also indicative of depression and anger related to Liver Qi Stagnancy and Phlegm patterns, while vascular augmentation–related parameters, such as SC/SP and ST/SP, were indicative of chronic physical fatigue related to the Spleen Deficiency pattern. In women, relationships between vascular augmentation–related parameters and sympathovagal balance-related LF/HF were consistent with those among vascular augmentation–related parameters, fatigue mood, and physical chronic fatigue. Further investigations are needed to examine the mechanisms underlying the relationships among PWPs, autonomic function, mood state, and chronic fatigue in larger subject samples.
Footnotes
Disclosure Statement
No competing financial interests exist.