
Abstract
Objective:
To examine the additive effect of t'ai chi (TC) to diet education on the traditional coronary heart disease (CHD) risk factor low-density lipoprotein cholesterol (LDL-C) and on emerging CHD risk factors (apolipoprotein B and LDL particle size) in older obese women.
Design:
Ancillary study of a randomized clinical trial.
Setting:
University of Rhode Island.
Participants:
26 obese women (mean age±standard deviation, 61.5±6.0 years; mean body mass index, 34.3±4.0 kg/m2) were enrolled and randomly assigned to the diet education group (n=13) or the diet education plus TC group (n=13).
Intervention:
All participants received 45 minutes of diet education per week. The diet education plus TC group also received 45 minutes of TC three times per week for 16 weeks.
Outcome Measures:
Anthropometrics (height, weight, BMI, waist circumference, and hip circumference), clinical variables (blood pressure), and biochemical variables (standard lipid profile, apolipoprotein B, LDL particle size) were measured. The primary outcome was LDL-C, and the secondary outcomes were apolipoprotein B and LDL particle size.
Results:
Neither LDL-C nor apolipoprotein B improved in either group. Percentage of large LDL particles after the intervention was increased in the diet education plus TC group compared with the diet education group. Weight, waist circumference, and high-density lipoprotein cholesterol decreased in both groups from baseline to post-intervention. Triacylglycerol and dietary screening tool scores increased in both groups. Additional improvements were seen in the diet education plus TC group, including a significant increase in Dietary Approaches to Stop Hypertension score from baseline to post-intervention.
Conclusion:
The addition of TC to diet education is more effective than diet education alone at improving diet quality and emerging CHD risk factors, such as LDL particle size, in obese older women.
Introduction
Elevated low-density lipoprotein cholesterol (LDL-C) is an independent, traditional CHD risk factor, 5 and the National Cholesterol Education Program Adult Treatment Panel III identifies older adults as beneficiaries of lowering LDL-C. 6 The concentration of LDL-C in the blood, as well as the particle size and density of LDL, contributes to its overall atherogenicty. 7 Two emerging risk factors related to LDL-C are concentration of apolipoprotein B (apo B) and LDL particle size. Apolipoprotein B is positively correlated with risk for a cardiac event, 8 and elevated apo B concentrations can be used to detect underlying dyslipidemia in some individuals whose condition may otherwise go undiagnosed. 4 One apo B particle is found on each very-low-density lipoprotein, intermediate-density lipoprotein (IDL), and LDL 9 and indicates the total number of particles in circulation. 10 The predominance of small, dense LDL particles is characteristic of pattern B phenotype, which indicates increased CHD risk. 11 The pattern A phenotype consists of predominantly large, buoyant, less atherogenic LDL particles. 12,13 Although LDL-C concentrations may appear normal, apo B concentration and LDL particle size may be abnormal and therefore may be superior predictors of CHD risk. 8,9
Overweight and obesity are additional CHD risk factors, 14,15 and their prevalence is increasing. 2 Approximately 64% of all U.S. women 1,15 and 74% of those 60 years of age or older 16 are overweight or obese. Obesity is of particular concern for older adults because it further enhances the natural decline in physical function and mobility, 17 which can impair the ability to participate in physical activity and decreases independence. In addition, because caloric restriction in older adults can cause loss of bone and lean body mass, weight loss achieved by exercise and caloric restriction is preferred. 17 The high prevalence of excess weight and CHD in the aging population creates a critical need for behavior-based diet and exercise interventions that improve both traditional and emerging risk factors.
Diet 18 –21 and exercise 22 –24 modifications can positively affect LDL-C, apo B, and LDL particle size. In particular, the Dietary Approaches to Stop Hypertension (DASH) diet can decrease CHD risk among women 25 and decrease LDL-C. 19 T'ai chi (TC) exercise can improve traditional blood lipids 26 –28 and is ideal for older adults. 28 However, research on the additive effect of TC to DASH diet education on traditional and emerging risk factors, such as apo B and LDL particle size, is limited. The primary aim of this study was to determine the additive effect of TC to a diet education intervention on LDL-C in obese older women, and the secondary aims were to examine changes in apo B and LDL particle size.
Materials and Methods
Study design and participants
This ancillary study was based on a 16-week randomized clinical intervention that was approved by the University of Rhode Island's Institutional Review Board and aimed to examine the additive effect of TC to behavior-based diet education (diet education plus TC) compared with diet education alone on traditional and emerging CHD risk factors in obese older women.
Inclusion criteria were as follows: women age 55–79 years; body mass index (BMI) of 30–49.9 kg/m2; not currently engaged in a regular exercise program; stable weight (within 5%) for the last 3 months; postmenopausal; and, for women receiving lipid-lowering medications, treatment duration 6 months or longer or other medications for 3 weeks or more. Thirty-three participants signed the informed consent form; 32 finished baseline testing and were randomly assigned to one of two groups (diet education or diet education plus TC) by a random-number generator using Random Allocation Software (Isfahan University of Medical Sciences, Isfahan, Iran). Six participants (three from each group) did not complete post-testing. Therefore, 26 participants were included in the final analysis (Fig. 1).
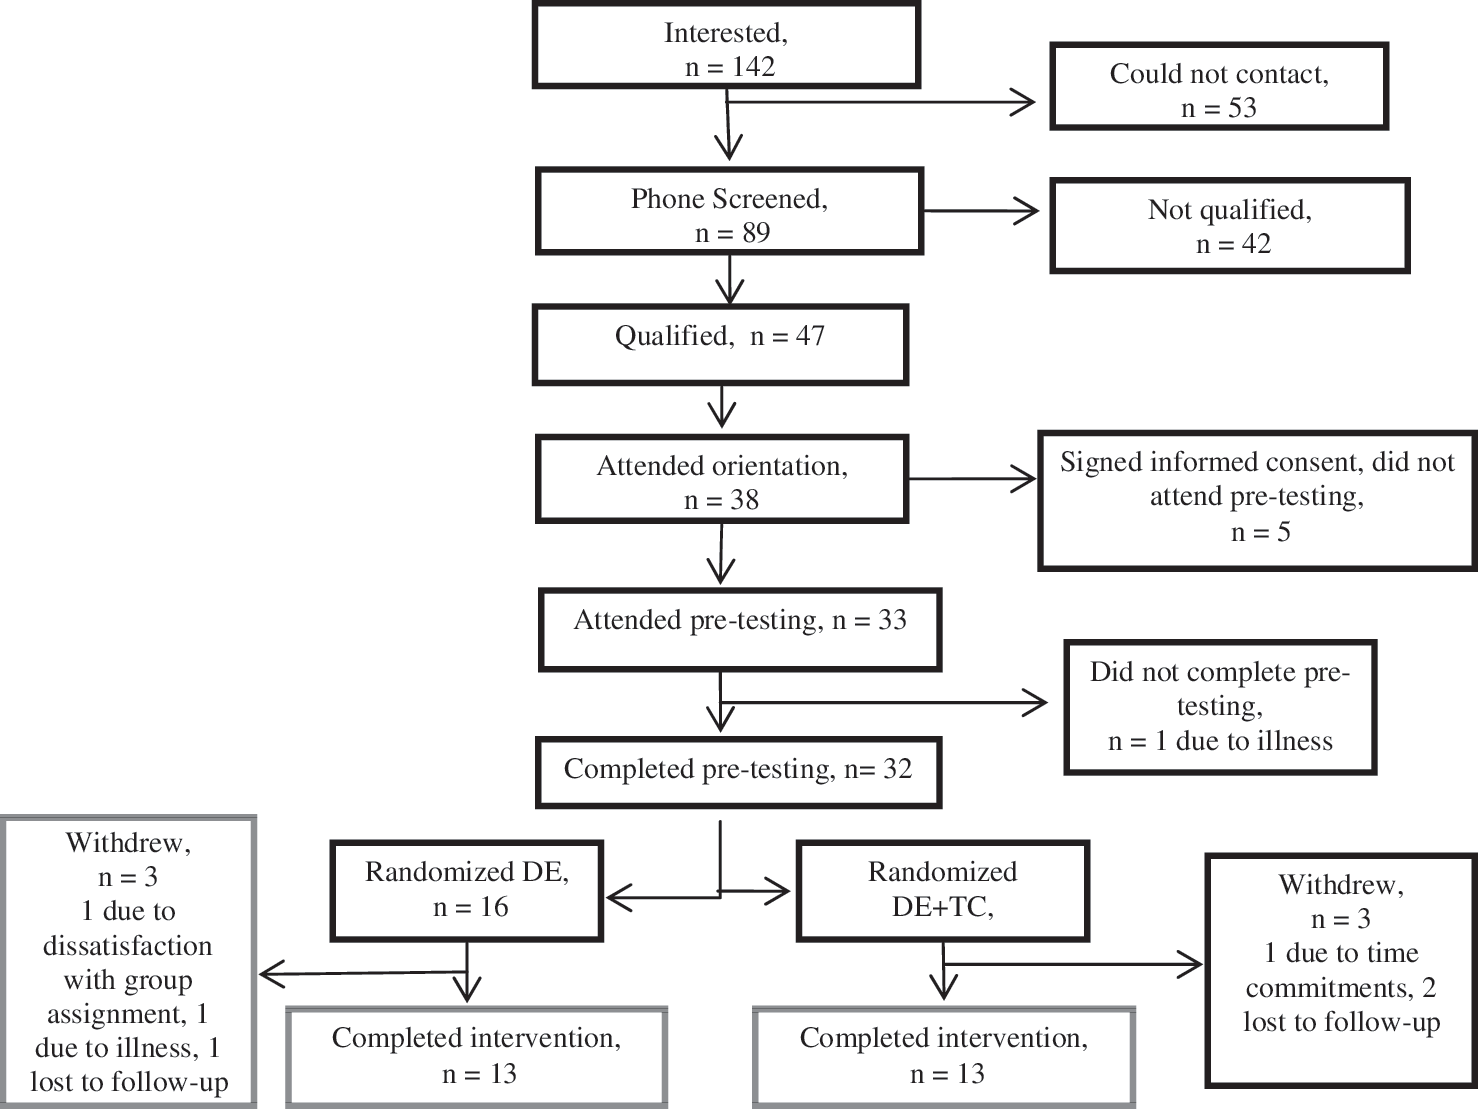
Participant timeline. DE, diet education; TC, t'ai chi.
Anthropometrics
The following measures were completed at baseline and post-intervention. Height was measured in duplicate to the nearest 0.25 cm using a stadiometer (Model 216, SECA North American East, Hanover, Maryland). Weight was measured in duplicate to the nearest 0.25 lb using a balance beam scale (Detecto 3P704, Web City, Missouri) and converted to kilograms; from those measurements, BMI (kg/m2) was calculated. Waist circumference was measured at the top of the iliac crest, and hip circumference was measured at the broadest circumference of the hips using a standard Gulick nonstretch tape measure (Creative Health Products, Ann Arbor, Michigan).
Biochemical
Venous blood draws were taken on two nonconsecutive days in the same week after a 12-hour fast at baseline and post-intervention. Whole blood was centrifuged (Centrifuge 5810R, Eppendorf North America, Westbury, New York) at 1500 g for 20 minutes at 4°C. 29 Samples were divided into aliquots in separate microcentrifuge tubes and stored in a −80°C freezer until analysis.
Total cholesterol and triacylglycerol (TAG) were measured by enzymatic colorimetric assays performed on plasma (Roche, Indianapolis, Indiana). 30 High-density lipoprotein cholesterol (HDL-C) was measured (Roche Diagnostics–USA standards and kits) after precipitation of the apo B–containing lipoproteins using a dextran sulfate and magnesium chloride solution (Across Organics, Morris Plains, New Jersey). LDL-C was calculated (mg/dL) by using the Friedewald equation. 31 Apo B was measured by using the apo B immunoturbidometric assay (Diazyme, Poway, California). The Lipoprint LDL System (Quantimetric, Redondo Beach, California) was used to measure LDL particle size. 32
Blood pressure
Blood pressure was measured by using previously described methods. 33 Briefly, blood pressure was taken after participants were seated for 5 minutes by using a standard sphygmomanometer (American Diagnostic Corporation, Hauppauge, New York). Measurements were obtained on 3 separate days at baseline and post-intervention, and the average was used for analysis.
Questionnaires
All participants completed the dietary screening tool, a 24-item tool that measures nutritional risk and dietary patterns of older adults. 34 The maximum score is 100 and indicates least nutritional risk. 34 In addition, participants completed the food-frequency questionnaire developed by the Nutrition Assessment and Shared Resource of the Fred Hutchinson Cancer Center, Seattle, Washington. Both were completed at baseline and post-intervention.
To assess dietary quality, the food-frequency questionnaire data were converted to the DASH Diet Index by using a protocol previously used by Folsom et al. 20 A value of 0, 0.5, or 1 was given based on not meeting, almost meeting, or meeting the recommended amount of each of the 11 diet variables included in the index. A maximum score of 11 indicates total concordance with the DASH diet. 20 Briefly, foods were divided into the DASH diet food groups, totals were divided by 52 or 365 to retrieve weekly or daily servings, and points were assigned to obtain DASH score. Percentage of kilocalories from saturated fat, total fat, and sodium (mg) were taken directly from food-frequency questionnaire output. Total amounts were assigned points to calculate DASH score.
Dietary education
All participants met for 45 minutes each week to undergo a session of behavior-based diet education based on a modified DASH diet (up to 35% calories from fat compared with the original ≤27%). 35 All diet education sessions included about eight participants and were led by a nutrition graduate student. Diet recommendations were as follows: (1) low intake of saturated fat (≤7% of caloric intake) and total fat intake of <35% of caloric intake; (2) high intake of fresh fruits, vegetables, and whole grains; (3) consumption of low-fat dairy and meat products; and (4) moderate intake of sodium (≤3000 mg/d). Individualized diets using DASH servings were given to each participant based on the Mifflin St. Jeor equation, 36 multiplied by an activity factor of 1.2 for a sedentary lifestyle with a 500-kcal/d reduction to promote 5%–10% weight loss. 37 Nutrition staff reviewed how to estimate portion sizes, read food labels, decrease caloric intake, and maintain total fat but decrease saturated and trans-fat intake. Participants completed food logs that the nutrition staff used to assess adherence and to provide feedback to participants.
T'ai Chi
The diet education plus TC group received three 45-minute weekly sessions of 24-movement Yang-style TC 38 for 16 weeks. Sessions were led by one of the principal investigators and two kinesiology graduate students. Participants learned two to four movements each week for the first 8 weeks, and the complete form was practiced for the remaining 8 weeks. There were a 10-minute warm-up and a 5-minute cool-down phase at each session. Participants received instructional handouts during the first weeks to help familiarize themselves with the movements; they received DVDs of the first 12 movements at week 4 and of the complete set of movements at week 8.
Statistical analysis
All data were analyzed with SPSS software, version 19.0 for Windows (IBM Corp., Summers, NY). Descriptive statistics were performed, and normality was assessed by using skewness and kurtosis. Transformations or nonparametric tests were used for any non-normally distributed data. Continuous variables are expressed as mean±standard deviation, and categorical variables are expressed as numbers. The independent variable was time and the dependent variables were LDL-C, apo B, and LDL particle size. Independent-sample t-tests were used to compare the groups at both baseline and post-intervention. A mixed between–within analysis of variance (ANOVA) was used to determine whether there were significant differences between groups over time, and partial eta-squared values were used to assess effect size (small, 0.01; moderate, 0.06; large, 0.14). 39 Sample size was calculated on expected change in LDL-C from baseline to post-intervention of −19.5 mg/dL, based on results of a previous study. 40 It was determined that a sample of eight participants per group would be adequate to achieve an effect size of 0.41, as interpreted by Cohen. 39 An α level of .05 and a power of 0.80 was used for analysis.
Results
All but one participant were white, four from each group were receiving lipid-lowering medications, and 34% (four from the diet education group and five from the diet education plus TC group) were taking blood pressure medications (Table 1).
Values expressed with a plus/minus sign are the mean±standard deviation.
BMI, body mass index; DST, dietary screening tool; DASH, Dietary Approaches to Stop Hypertension.
The groups did not significantly differ at baseline except for vegetable consumption, which was higher in the diet education group (+1.9 servings per day). Low-density lipoprotein cholesterol did not significantly decrease in the diet education or the diet education plus TC group from baseline to post-intervention (p=0.195 and 0.740, respectively); however, LDL-C did decrease in both groups over time, and moderate effect sizes were seen. Similarly, no significant reductions in apo B were seen in either group (Table 2). Twenty-three (88%) of the participants presented with pattern A phenotype, and only three individuals presented with pattern B at both baseline and post-intervention (data not shown). The diet education plus TC group had a higher percentage of large buoyant LDL particles at post-intervention (Fig. 2).
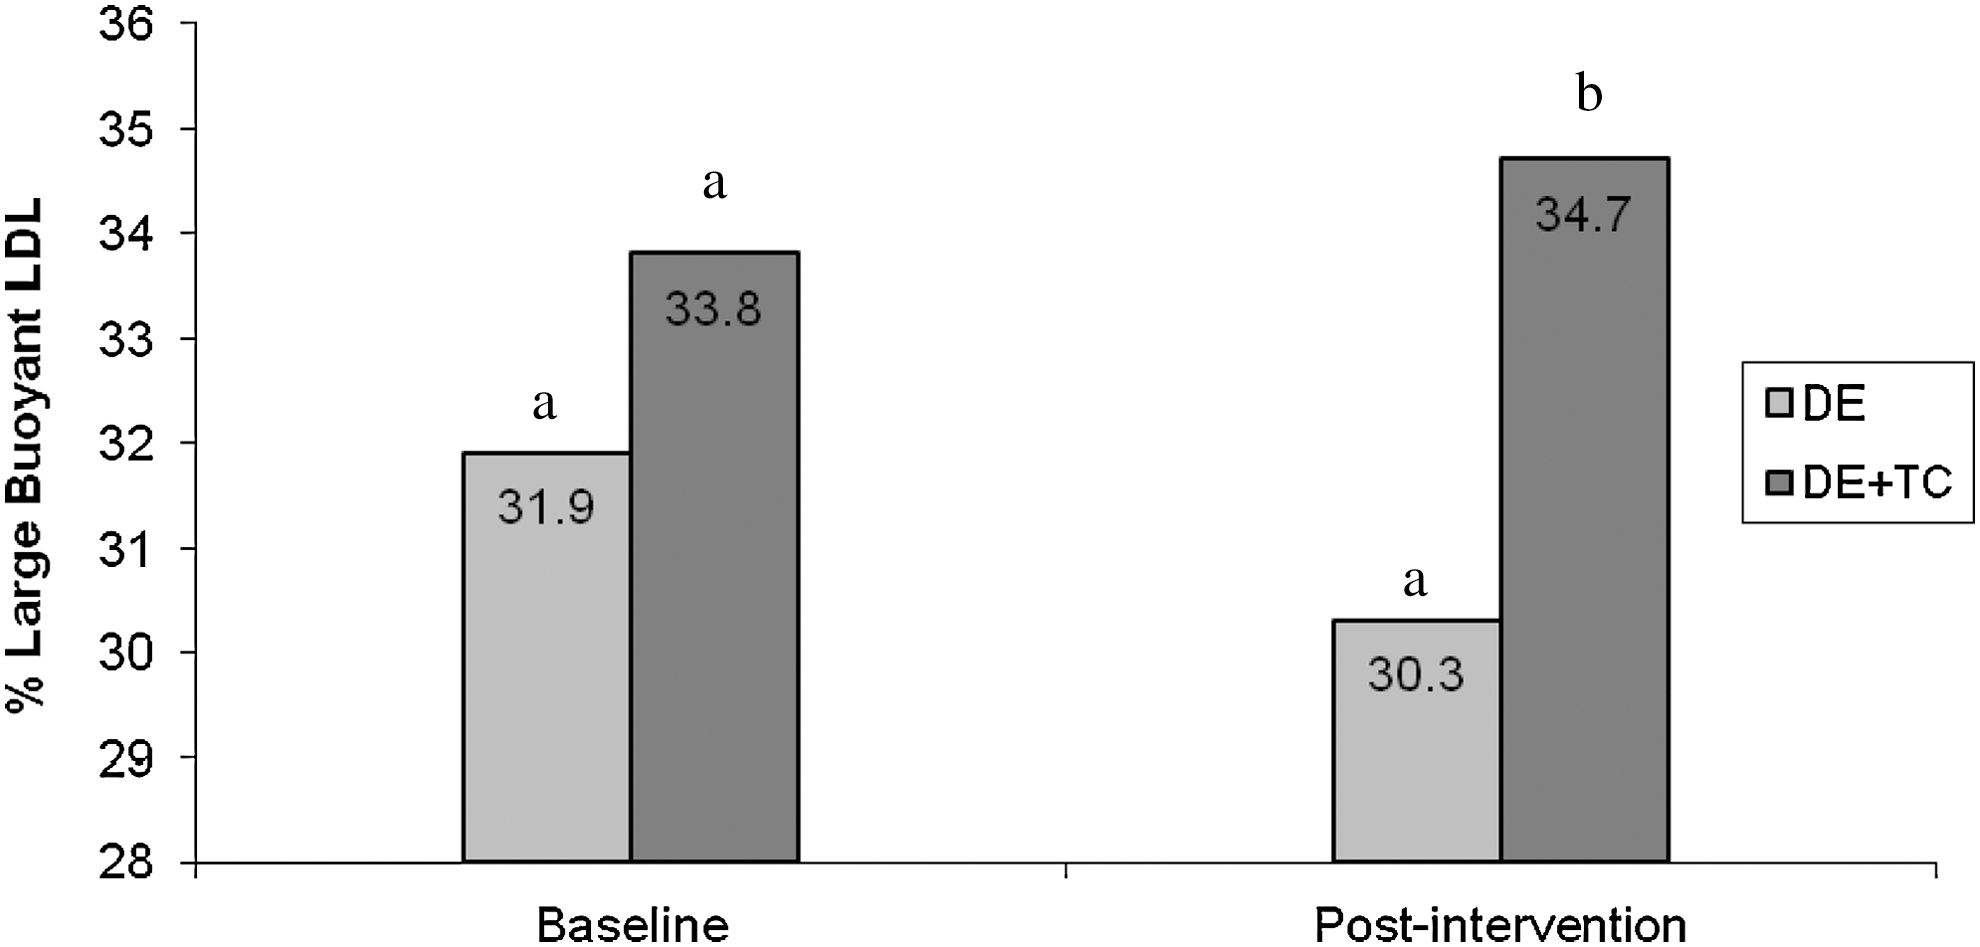
Percentage large buoyant low-density lipoprotein (of total cholesterol) at baseline and post-intervention between groups. Different letters at one time point represent a significant difference between groups (p<.05). DE, diet education; LDL, low-density lipoprotein; TC, t'ai chi.
Baseline and post-intervention values are expressed as mean±standard deviation. Effect size expressed as partial eta.
squared (0.01, small; 0.06, moderate; 0.14, large).
Log-transformed for analysis.
Wilcoxon signed-ranks test/Mann–Whitney test used for analysis.
Difference within groups p<.05.
Difference between groups p<.05.
TC, t'ai chi; LDL-C, low-density lipoprotein; HDL-C, high-density lipoprotein cholesterol; NA, not applicable; TAG, triacylglycerol.
Weight, waist circumference, and HDL-C significantly decreased in both the diet education and the diet education plus TC groups from baseline to post-intervention. Mean BMI and hip circumference decreased in the diet education group only. TAG concentrations increased significantly in both groups.
Dietary screening tool score improved significantly in both the diet education and the diet education plus TC groups from baseline to post-intervention, whereas only the diet education plus TC group had significantly increased mean DASH scores. Dairy servings per day differed between groups at post-intervention. Additionally, percentage calories from carbohydrates significantly increased in the diet education group. Both groups had decreases in percentage kilocalories from saturated fat and total fat from baseline to post-intervention. Only patients in the diet education plus TC group significantly reduced their intake of sodium, kilocalories, sweets, nuts/legumes/seeds, and meats/fish/poultry from baseline to post-intervention (Table 3). The effect of diet education attendance for both groups was considered for those who attended the following: (1) 8, 9, or 10 sessions; (2) 11, 12, or 13 sessions; and (3) 14, 15, or 16 sessions. 41 A significant time-by-group interaction for group and DASH score was discovered (data not shown).
Baseline and post-intervention values are expressed as mean±standard deviations. Effect size expressed as partial eta squared (0.01, small; 0.06, moderate; 0.14, large).
Log-transformed for analysis.
Square root transformation used for analyses.
Difference within group p<.05.
Difference between groups p<.05.
DASH, Dietary Approaches to Stop Hypertension; DE, dietary education; MUFA, monounsaturated fatty acid; PUFA, polyunsaturated fatty acid; TC, t'ai chi.
Discussion
To our knowledge, this study is the first to report on the additive effects of TC to diet education on LDL-C, apo B, and LDL particle size. Results indicate that the addition of TC to diet education produced a more favorable effect on LDL particle size and diet quality than did diet education alone. Although LDL-C or apo B were not significantly reduced, a moderate effect was seen for LDL-C, along with favorable qualitative changes in LDL particle size. These findings suggest diet education plus TC is effective at improving this emerging CHD risk factor in obese older women.
Weight loss is often associated with improvements LDL-C; 42 however, this change was not seen in this study. Similar to another study, 24 mean LDL-C decreased from baseline to post-intervention in both groups; however, reductions were not significant (p=.195 and p=.740). This could be partially explained by the increase in LDL particle size, which can increase total LDL-C concentration. Large buoyant LDL can offset a decrease or even increase total LDL-C concentration because of their larger mass. 43 It should not be overlooked that 61.5% (n=16) of participants had at least a 1% reduction in LDL-C, translating into an at least 1% decreased CHD risk. 6
Unexpectedly, no reductions in apo B were seen. No other studies examined the effect of TC and the DASH diet on apo B, but these results are in contrast to those of previous studies in which apo B decreased after resistance training and the DASH diet. 24 Lower intake of carbohydrates is associated with apo B reductions; 44 therefore, the lack of improvement in apo B could be partially explained by increases in carbohydrate consumption because carbohydrate intake is positively associated with increases in TAG as a result of increased synthesis of very-low-density lipoprotein particles. 45,46
Despite minimal changes in LDL particle quantity, there were favorable qualitative changes: The percentage large LDL in total cholesterol concentrations was significantly higher in the diet education plus TC group than in the diet education group at post-intervention. Diet and exercise play a role in changing LDL particle size. 47,48 Varady et al. 49 showed that 12-week kilocalorie restriction can significantly increase percentage large LDL (increase, 5%) in obese adults. The present results are in contrast to past research that found that decreases in percentage dietary fat and increases in percentage carbohydrate led to decreased LDL size. 50 The TC exercise may be responsible for improvements in LDL particle size; Kawano et al. 43 saw increases in LDL particle size after participation in various forms of aerobic exercise, including cycling and aquatics. Exercise increases production and activity of lipoprotein lipase, which is responsible for hydrolyzing TAG into fatty acids used for fuel. 51 This decrease in very-low-density lipoprotein TAG results in the availability of less TAG for exchange and is one of the main mechanisms responsible for increases in LDL particle size. 52
This favorable qualitative change in LDL suggests a transition toward a less atherogenic phenotype. Because measurement of LDL-C alone would have overlooked this improvement, this highlights the need to measure emerging risk factors, such as LDL particle size, when CHD risk is being assessed.
Both the diet education group and the diet education plus TC group saw reductions in weight and waist circumference, which is consistent with past DASH diet studies. 53 These changes probably occurred because, independent of macronutrient content, caloric restriction promotes weight loss. 54 Only the diet education plus TC group showed improvements in DASH score at post-intervention, suggesting that the addition of exercise increased adherence to the DASH diet and produced more favorable outcomes. These findings are consistent with those of previous studies in older adults reporting that group-based exercise interventions may result in better attendance, 55 adherence, 56 and psychosocial adjustments to change 57 (including dietary change) because of additional social support, peer support, and group cohesion. In the current study, participants the diet education plus TC group spent approximately 2–3 additional hours together compared with those in the diet education group, allowing for more peer support and group cohesion. In addition, combined interventions, such as diet and exercise, have better outcomes than single interventions. 58,59
Triacylglycerol significantly increased as HDL-C decreased in both groups, an outcome seen previously with the DASH diet. 19 In addition, percentage calories from carbohydrate significantly increased from baseline to post-intervention in the diet education group and increased nonsignificantly in the diet education plus TC group. As previously discussed, it has been well established that increases in percentage carbohydrate can increase TAG concentrations and decrease HDL-C. 45,46
In addition, decreases in total fat intake also commonly result in decreased HDL-C. 18,19 Although a modified DASH diet was taught, emphasizing healthy fat consumption, percentage monounsaturated fatty acids (MUFA) and percentage polyunsaturated fatty acids (PUFA) intake significantly decreased in the diet education group. Previous research on caloric restriction in obese adults saw similar decreases in percentage MUFA and percentage PUFA. 40 Park et al. 28 saw a decrease in HDL-C (change, −8.22 mg/dL) after 6 months of diet education plus TC, and Obarzanek et al. 19 saw a decrease in HDL-C (change, −3.8 mg/dL) and a nonsignificant increase in TAG (change, 3.2 mg/dL) after 8 weeks of DASH diet education.
This study had several strengths, including the use of randomization and relatively good attendance (78.1% for the diet education plus TC group and 86.5% for the diet education group). Reasons for dropouts included change in time commitments, group assignment dissatisfaction, unrelated illness, and loss to follow-up. Another strength is adherence to the DASH diet, as evidenced by a significant time-by-group interaction for attendance group and DASH score, suggesting that better attendance leads to increased adherence to the DASH diet.
This study is not without limitations. The sample was small, but the study was adequately powered to detect differences in LDL-C in response to exercise and diet based on results from a similar study. 40 In addition, the sample was relatively homogenous because it was made up of mostly white, generally healthy older women; therefore, the results may not be generalizable to older adults with severe health problems and physical limitations.
Conclusion
The results of this study indicate that the addition of TC to a diet education intervention improves percentage large LDL and diet quality in obese older women. The addition of TC to diet education has the ability to positively affect LDL particle quality, independent of quantity. Although diet quality improved over time, increases in percentage carbohydrate and decreases in fat consumption could have offset significant improvements in other risk factors, such as TAG and HDL-C. Future research should explore the effect of diet education plus TC and other emerging risk factors, such as apolipoprotein A-I. In addition, to determine the separate effects of diet education and TC, future research could directly measure lipoprotein lipase activity to ensure the mechanisms most responsible for favorable changes seen in LDL particles.
Footnotes
Acknowledgments
The authors thank the U.S. Department of Agriculture, Dr. Wood of Springfield College, and the University of Rhode Island Lipid Metabolism Lab and Kinesiology Department.
Disclosure Statement
No competing financial interests exist.