
Abstract
Objectives:
Abdominal examination (AE) is the evaluation of the status of illness by examining the abdominal region in traditional Korean medicine (TKM). Although AE is currently considered an important diagnostic method in TKM, owing to its clinical usage, no studies have been conducted to objectively assess its accuracy and develop standards.
Design:
Twelve healthy subjects and 21 patients with functional dyspepsia have participated in this study. The patients were classified into epigastric discomfort group (n=11) and epigastric discomfort with tenderness group (n=10) according to the clinical diagnosis by AE. After evaluating the subjective epigastric discomfort in all subjects, two independent clinicians measured the pressure pain threshold (PPT) two times at an acupoint (CV 14) using an algometer. We then assessed the interrater and intrarater reliability of the PPT measurements and evaluated the validity (sensitivity and specificity) via a receiver operating characteristic plot and optimal cutoff value.
Results:
The results of the interrater reliability test showed a very strong correlation (correlation coefficient range: 0.82–0.91). The results of intrarater reliability test also showed a higher than average correlation (intraclass correlation coefficient: 0.58–0.70). The optimal cutoff value of PPT in the epigastric area was 1.8 kg/cm2 with 100% sensitivity and 54.54% specificity.
Conclusions:
PPT measurements in the epigastric area with an algometer demonstrated high reliability and validity for AE, which makes this approach potentially useful in clinical applications as a new quantitative measurement in TKM.
Introduction
A
Algometer has been recognized as a valid and reliable tool for measuring local pressure pain in subcutaneous and underlying tissues. 9 –11 This device consists of a spring-loaded pressure gauge attached to a rubber plunger. The assessor holds the algometer vertically against the skin of the patient and applies pressure until the subject reports the beginning of unpleasant or uncomfortable sensation defined as pressure pain threshold (PPT). Algometers are commercially available, handy, as well as quick and safe to utilize, which make them practical for clinical implementation. The application of algometer has extended to other areas, such as upper and lower abdomen. 12,13
As the first step toward quantifying AE, we selected quantification of “Simhabi” (SH,  ) and “Simhabikyung” (SHK,
  ), as SH and SHK are representative diagnoses of AE that are common in individuals with functional dyspepsia (FD). SH is characterized by subjective epigastric discomfort without tenderness. SHK is very similar to SH in terms of subjective epigastric discomfort, but it is discriminated from SH based on tenderness.
3
Differential diagnosis between SH and SHK is very important in Korean medicine because the treatment (e.g., herbal medicine) may vary according to the results of AE. However, the pressure intensity in AE has not been determined with a standardized diagnostic tool, which makes it difficult for TKM practitioners to discriminate consistently between SH and SHK.
), as SH and SHK are representative diagnoses of AE that are common in individuals with functional dyspepsia (FD). SH is characterized by subjective epigastric discomfort without tenderness. SHK is very similar to SH in terms of subjective epigastric discomfort, but it is discriminated from SH based on tenderness.
3
Differential diagnosis between SH and SHK is very important in Korean medicine because the treatment (e.g., herbal medicine) may vary according to the results of AE. However, the pressure intensity in AE has not been determined with a standardized diagnostic tool, which makes it difficult for TKM practitioners to discriminate consistently between SH and SHK.
Therefore, we applied a conventional algometer as a new diagnostic tool for AE, and attempted to find the cutoff value of PPT in the epigastric region between SH and SHK. For this, we recruited subjects with FD complaining of epigastic discomfort or pain and healthy controls. The reliability and validity of algometer as an appropriate tool for assessing PPT in the epigastric site were evaluated. We compared PPT values among the three groups and tried to quantitatively verify a TKM theory that SH and SHK can be differentiated based on the presence of tenderness.
Materials and Methods
Hypotheses
1. PPT evaluation by algometer is a reliable and valid diagnostic tool for standardization and quantification of AE.
2. SH and SHK can be quantitatively differentiated by the presence of tenderness, which can be detected by PPT assessment.
3. There is an optimal cutoff value of PPT that allows distinguishing between SH and SHK.
Subjects and study design
Twenty-four subjects between 19 and 80 years of age with FD and complaints of epigastric discomfort or pain and 12 healthy subjects without any digestive problems were recruited at Kyung Hee University Korean Hospital at Gangdong from October to November 2012. The subjects with FD met the Rome III criteria for FD. 14 In order to exclude organic diseases, patients with medical histories of peptic ulcers, reflux diseases, previous abdominal surgeries, mental diseases such as major depression, predominant irritable bowel syndrome, severe organ diseases, or continuous administration of analgesic agents were excluded. In addition, patients who were using antibiotics, proton pump inhibitors, bismuth salts, prokinetic agents, and herbal medicine were also excluded. The present study was approved by Institutional Review Boards at Kyung Hee University Hospital at Gangdong (KHNMC-OH-IRB 2012-010). Informed consent was obtained, which included the elements of information, decisional capacity, and voluntarism. All subjects signed a written informed consent form and went through the screening stage. In this trial, FD patients were classified into one of two groups, SH or SHK, on the basis of AE performed by Korean medicine doctors. In total, 36 subjects were screened, and 3 did not pass the screening stage because of extreme obesity, inflammation, and extreme hypersensitivity to pain. Thirty-three subjects consisting of 12 healthy controls, 11 in the SH group, and 10 in the SHK group completed the trial.
Abdominal examination by Korean medicine doctors
The diagnosis of SH or SHK was established by the consensus of Korean medicine doctors based on the previous study. 15 Three Korean medicine doctors with more than 3 years of experience in TKM diagnosis independently examined the subjects in a separate room with no information about the subjects available before the examination. Each participant underwent examination by the doctors in a random order. Upon application of pressure of certain intensity on the epigastric region by the doctor, subjects who complained of only discomfort were diagnosed with SH, whereas those who reported discomfort with tenderness were diagnosed with SHK. The FD subjects were placed in the SH or SHK groups based on the consensus of at least two Korean Medicine doctors, and the diagnosis of SH or SHK was accepted as the gold standard in this trial. The examination was performed in a room with the temperature of 18°C and humidity of 40–50%. The subject was placed in the supine decubitus position and was given at least 5 minutes of rest before examination. Korean medicine doctors examined the subjects' abdomen with their right index, middle, and ring fingers while evaluating the pressure pain and resistance.
Evaluation of epigastric discomfort using the visual analog scale
A 100-mm-long linear scale was positioned horizontally, with the extremes on the left and right ends representing the absence of epigastric discomfort and the worst possible discomfort, respectively. The subjects were asked to mark the severity of their epigastric discomfort on the scale.
Evaluation of pressure pain threshold with algometer
A pressure algometer (Wagner Instruments, Greenwich, CT; Fig. 1) capable of measuring pressure in the range from 0 to 10 kg/cm2 and equipped with a graduated scale with 0.1 kg divisions was utilized. Pressure was applied on the epigastric area using a 1 cm2 rubber disc fixed to a metal rod and recorded by a needle on the manometer scale. The operator held the algometer vertically against the skin of the subject. Pressure was applied at a rate of 1 kg/cm2/s. The subject was asked to communicate verbally the perception of the beginning of pain by saying “stop” as soon as the sensation of pressure changes to pain. The operator then immediately stopped applying pressure and read the PPT value on the gauge. To prevent measurement distortions, the maximum PPT value was set to 8 kg/cm2. Two examiners with more than 3 years of clinical experience independently measured PPT, and they were unaware of each other's results throughout the session. PPT was measured two times by each examiner with a resting interval of 1 minute. 10 The mean of two consecutive measurements was calculated as the output value. The whole measurement process followed the description of Fischer. 16 CV 14 was selected as the epigastric regional site based on a previous study. 3 CV 14 is one of the representative acupoints where SH and SHK can be differentiated by AE. 3
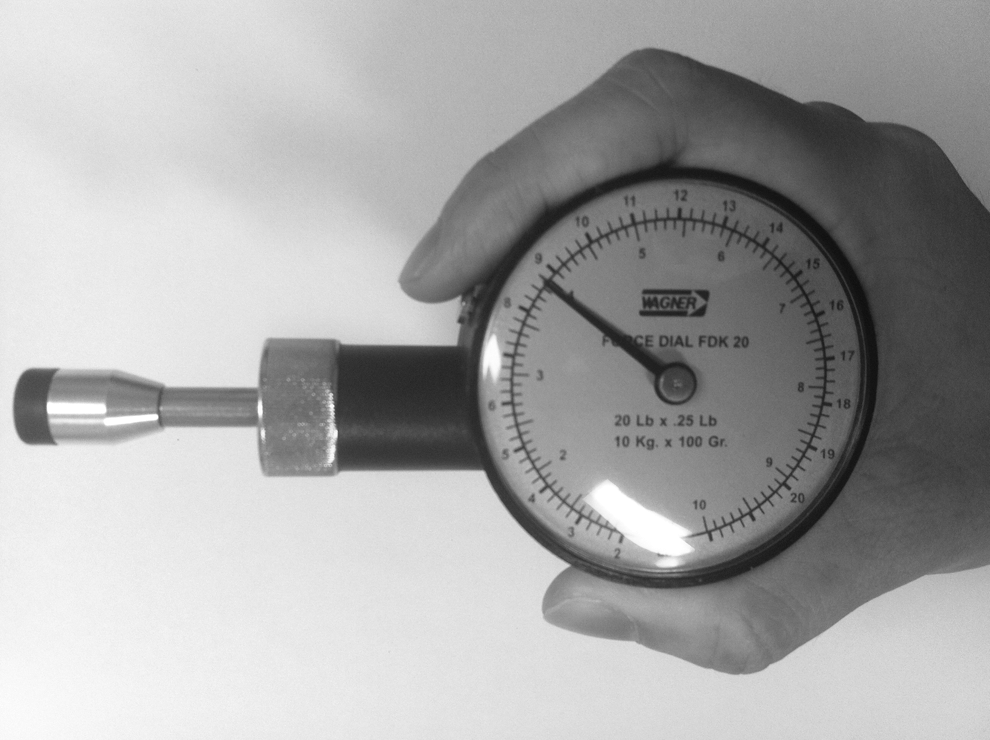
A pressure algometer.
Evaluation of reliability
Intraclass correlational analysis (ICC) was used to estimate test–retest and interrater reliability. Test–retest reliability was estimated by correlating the PPT values of the first and second trials separated by a 1-minute interval. Each examiner calculated each subject's mean score of two consecutive trials, and each subject's mean scores were paired for comparison to evaluate interrater reliability.
Evaluation of validity
Sensitivity, specificity, and the optimum cutoff score for PPT were calculated using receiver operating characteristics (ROC) curve analysis. In the ROC curve analysis, consensus of at least two clinicians out of three served as the gold standard, and the PPT value from algometer evaluation served as a test variable. We determined the cutoff value between SH and SHK at the maximum Youden index (J=sensitivity+specificity). 17 Together with the Youden index, we examined the area under the curve (AUC), which is known to quantitatively show the accuracy of a test variable with respect to the gold standard. It is generally accepted that an AUC value greater than 0.9 indicates high accuracy, 0.7–0.9 indicates moderate accuracy, and 0.5–0.6 indicates low accuracy. 17 The ROC curve is designed to have a “perfect” test with the largest possible AUC. Sensitivity and specificity were calculated from a 2×2 table. To find differences in PPT among the three groups, mean PPT values in HC, SH, and SHK groups were compared.
Statistical analyses
Continuous variables such as age, PPT, and visual analog scale (VAS) scores were represented as mean±SD, and categorical variables such as smoking and sex were represented as percentages. Comparisons among the three groups were performed with the Kruskal–Wallis test or one-way ANOVA followed by the Dunnett's test. Two-group comparisons were analyzed using the independent t-test or Mann–Whitney U-test for continuous variables and the Fisher's exact test for categorical variables. Test–retest and interrater reliabilities were investigated by using coefficients of correlation and ICC, respectively. The optimal cutoff value was calculated from the ROC curve and AUC area. The ROC curve and cutoff value were analyzed using MedCalc 12.3.0 (MedCalc Software bvba, Ostend, Belgium), and other analyses were carried out with SPSS version 16.0 (SPSS Inc., Chicago, IL). All data were analyzed by an independent statistician, and p<0.05 was considered statistically significant.
Results
Baseline characteristics of subjects
The baseline characteristics of 33 participants who completed the trial were assessed by the physicians (Table 1). All the baseline characteristics, excluding sex, were well balanced among the groups.
Age, body weight, and BMI were analyzed with Kruskal–Wallis test. Sex, P/H, PD, NPD, drinking, smoking, and coffee usage were analyzed with Fisher's exact test. p<0.05 was considered statistically significant. The age, weight, and BMI data are presented as mean±SD.
BMI, body mass index; HC, healthy controls; NPD, nonprescription drug; P/H, physical history; PD, prescription drug; SD, standard deviation; SH, epigastric discomfort group; SHK, epigastric discomfort with tenderness group.
Analysis of visual analog scale and pressure pain threshold among the groups
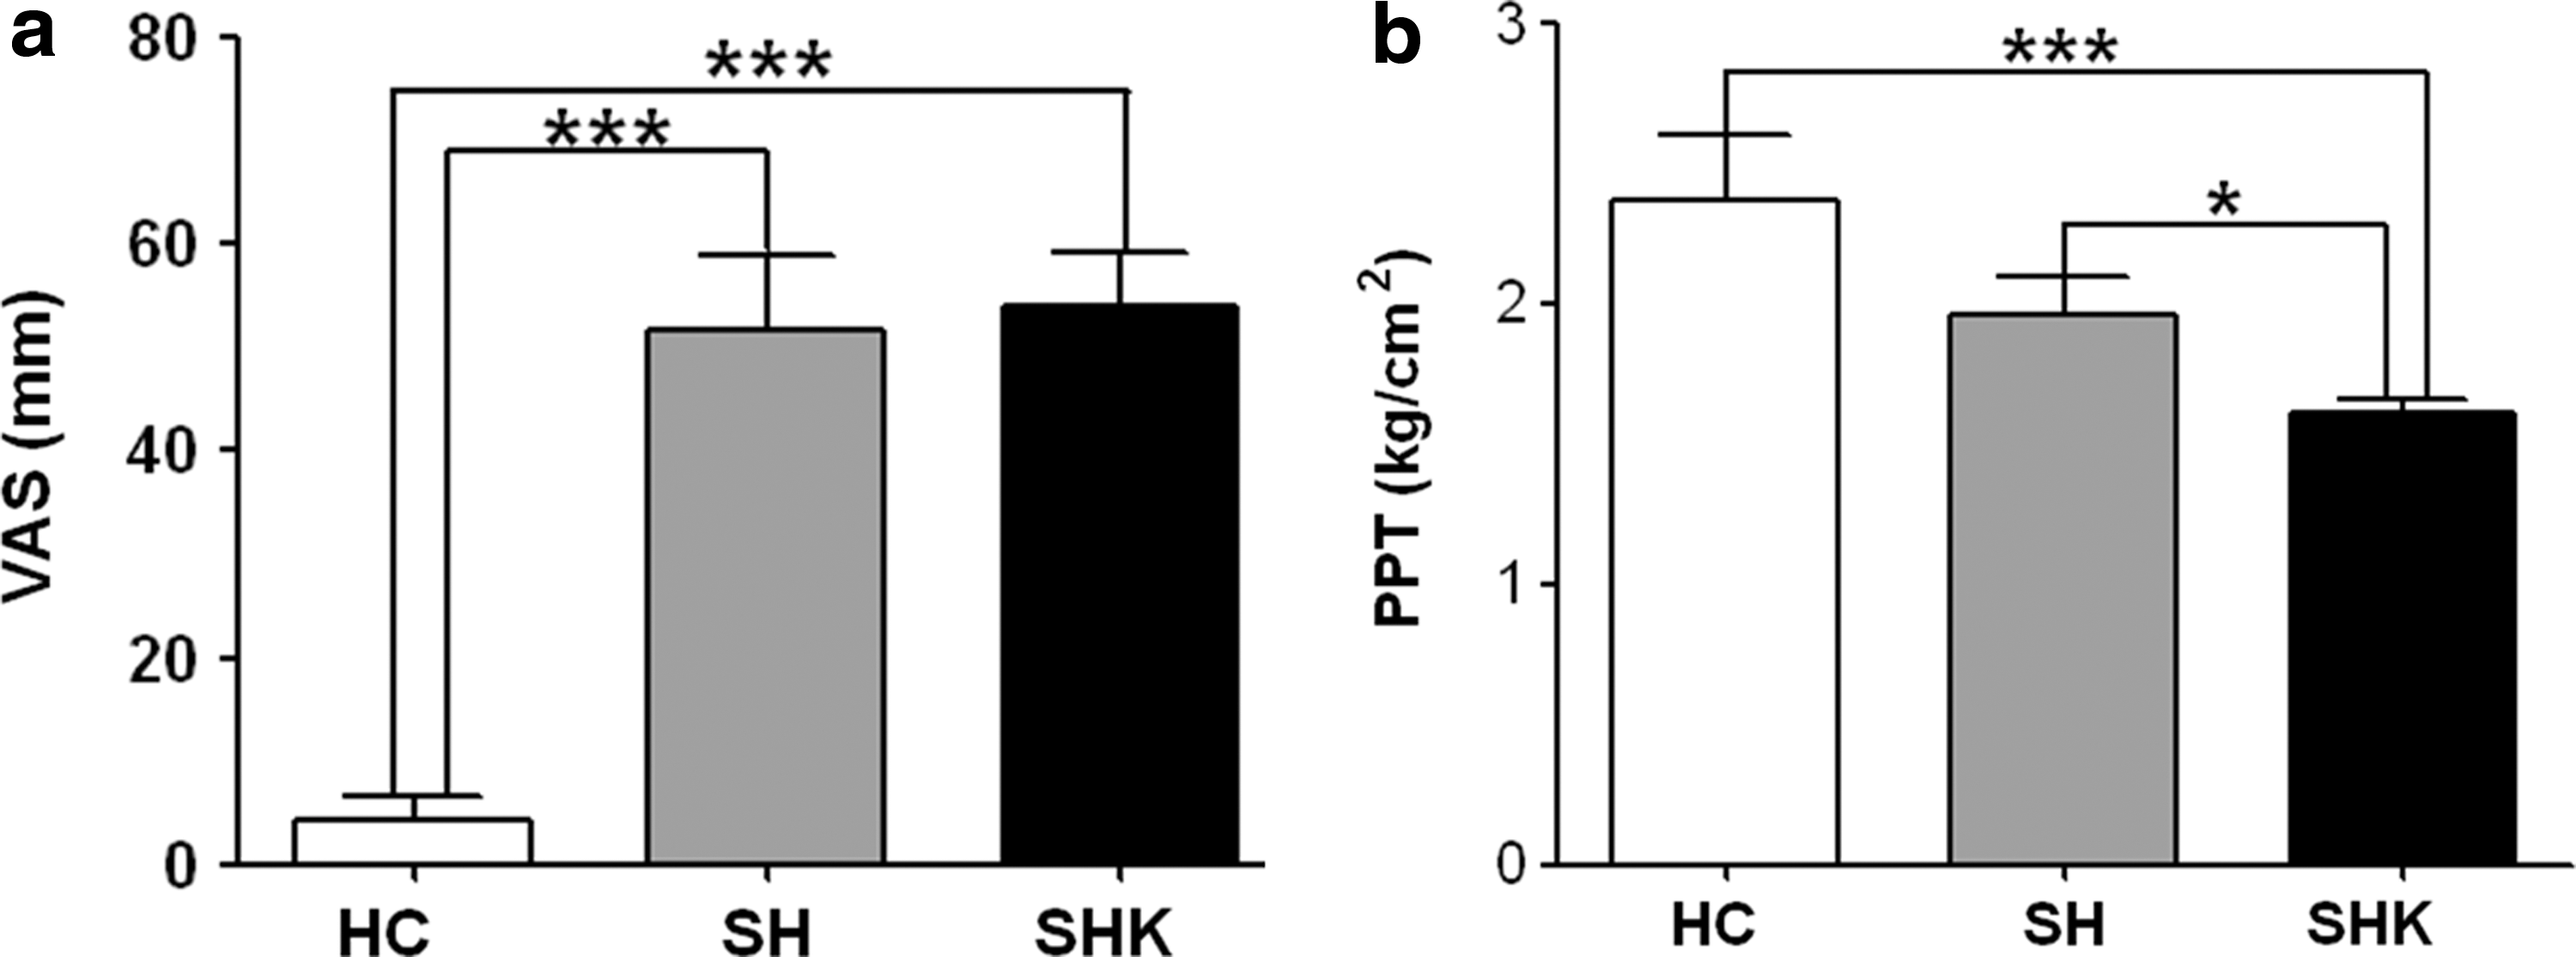
The VAS scores of the HC, SH, and SHK groups were 4.17±8.11, 51.67±25.42, and 54.00±18.40, respectively. The difference in VAS scores between the HC and SH groups and the HC and SHK groups were statistically significant (p<0.001 in both cases; Fig. 2a). The mean PPT values at CV 14 of the HC, SH, and SHK groups were 2.37±0.81, 1.96±0.45, and 1.61±0.17, respectively. The differences in PPT between the HC and SHK groups and the SH and SHK groups were statistically significant (p<0.001 and p<0.05, respectively; Fig. 2b).
Comparison of VAS scores for epigastric discomfort
Evaluation of reliability and validity
In test–retest reliability assessment, both raters showed very strong correlations between the two trials (p<0.001; Table 2). In interrater reliability test, a statistically significant correlation was detected by ICC analysis (ICC=0.58, p<0.001; Table 2).
Data were evaluated by correlation analysis. Coefficients of correlation were obtained with Spearman's correlation test.
ICC, intraclass correlation coefficient; PPT, pressure pain threshold.
The AUC value calculated from the analysis of the ROC curve for the SH and SHK groups was 0.741 (p=0.030). Based on the maximum value of the Youden index, the optimum cutoff PPT point between SH and SHK was defined as 1.8 kg/cm2, and the sensitivity and specificity at that level were 100% (95% CI: 69.2–100.0) and 54.55% (95% CI: 23.4–83.3), respectively (Fig. 3).
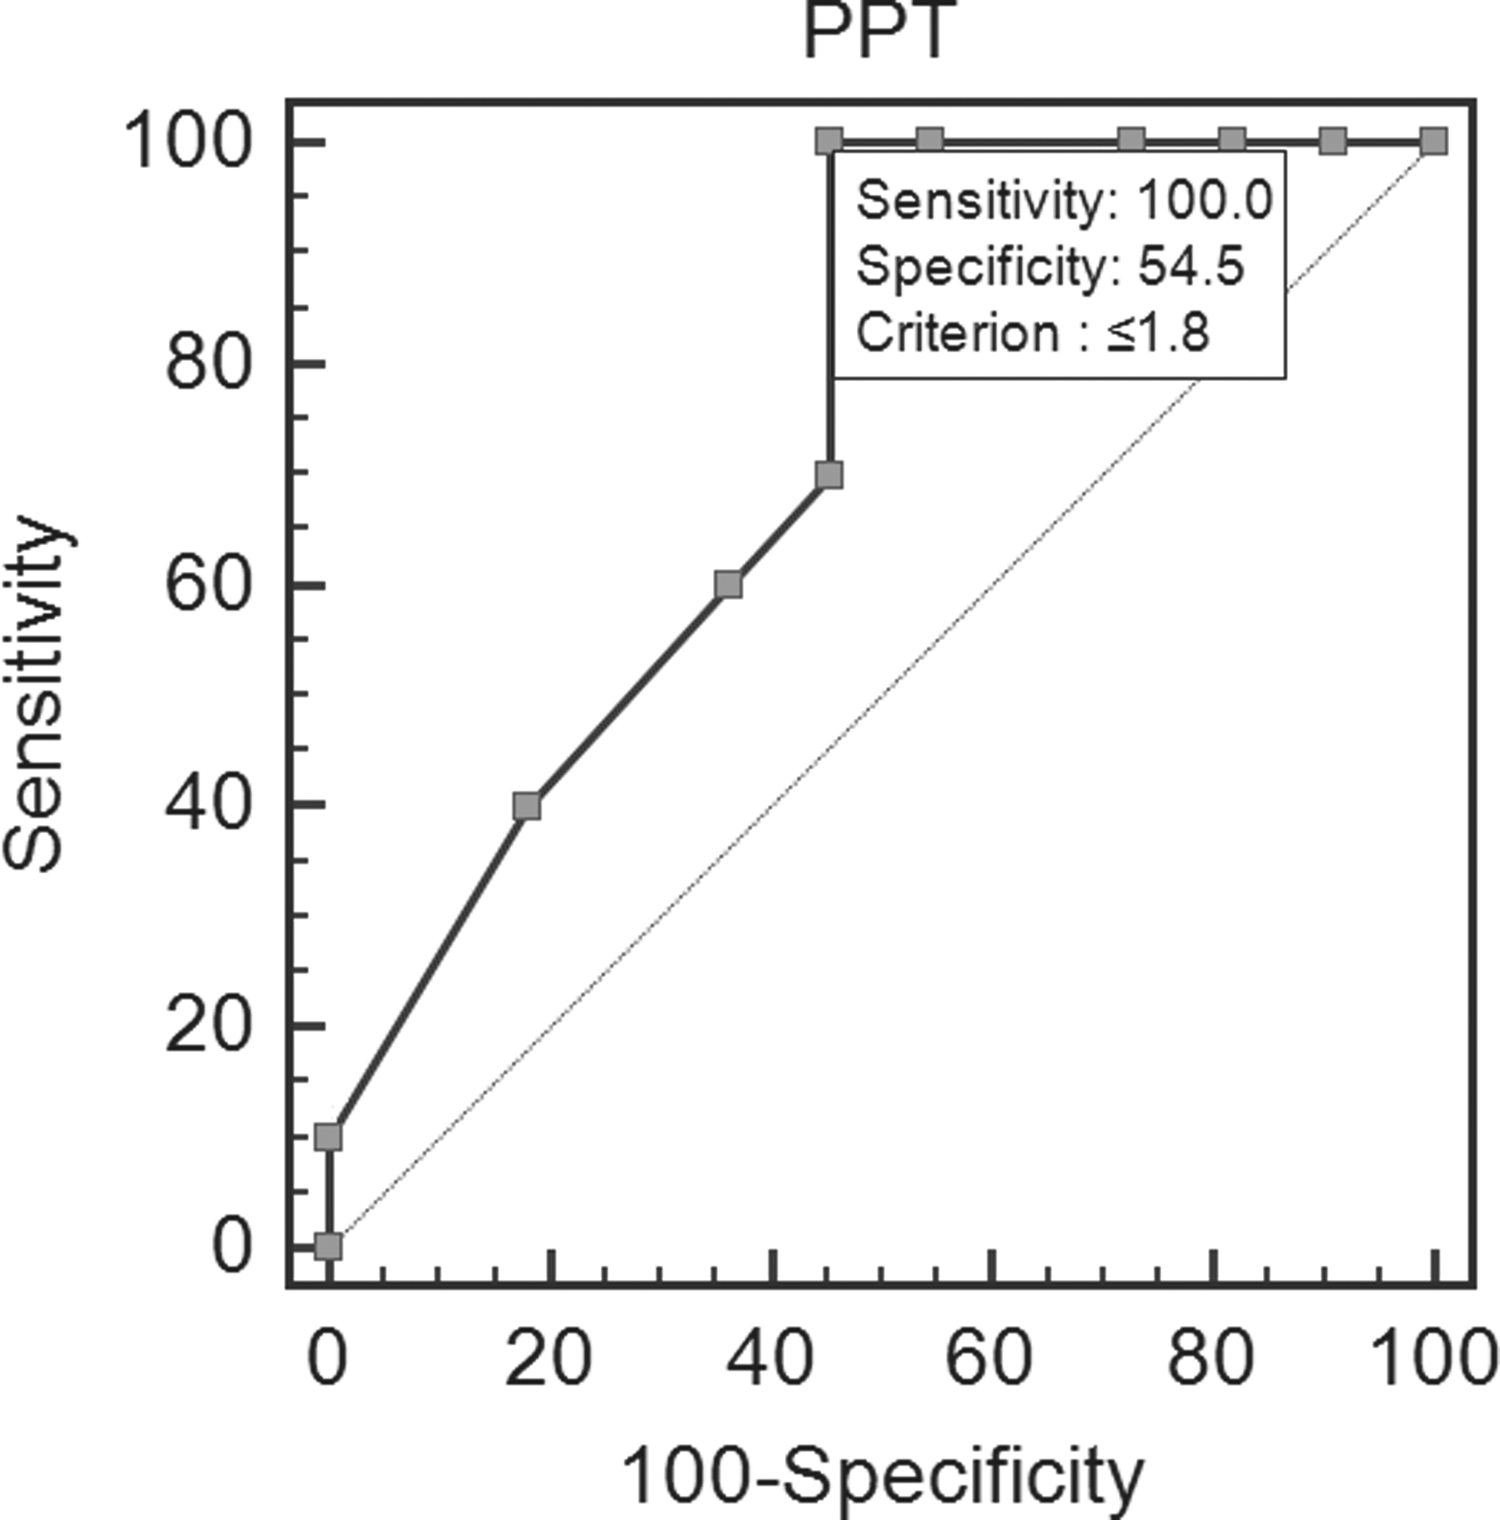
ROC curve of the PPT values of the subjects in the SH and SHK groups. The area under the curve was 0.741, and the cutoff value differentiating SHK from SH was 1.8 kg/cm2. Sensitivity and specificity of the scoring were 100% and 54.55%, respectively. ROC, receiver operating characteristics.
Discussion
In the present study, we attempted to develop an approach to standardization and quantification of AE for specific diagnoses (SH and SHK) based on TKM. We were able to prove that it is possible to differentiate between the AE diagnoses of SH and SHK using an algometer. Moreover, it was found that algometer has high reliability and validity as a tool for AE.
In test–retest analysis, algometer exhibited a satisfactory reliability (coefficients of correlation were 0.87 and 0.82 for two raters). In intrarater analysis, the ICC value was 0.58 (p<0.001), which is considered a “moderate” level of correlation according to the categories of Landis and Koch. 18 From the ROC analysis, the AUC area was 0.741, and the discriminative abilities of the algometer for AE were considered “moderate.” 19 The optimum cutoff value to distinguish between SH and SHK was found to be 1.8 kg/cm2, and the sensitivity and specificity at that level were 100% and 54.55%, respectively. The evaluation of PPT showed a significant difference between the SH and SHK groups.
Compared with other TKM diagnostic methods, such as examination of patient's face color or the tongue, AE has been considered a relatively objective technique owing to its sign-based approach for detecting pain, mass, and so forth, and mainly utilized by physicians. 20 Even though many parameters are determined with AE, such as distention, guarding, lumps, mass, pressure pain, and fluid sound, pressure pain is considered one of the most objective continuous variables for quantification. 20 Therefore, we selected AE among the TKM diagnostic tools and pressure pain among the AE parameters as the subjects for standardization and quantification.
SH and SHK are commonly observed in the clinical field in TKM. SH and SHK can be differentiated by the presence of tenderness, whereas other features are similar. This indicates a possibility of objective differentiation between SH and SHK and constitutes the reason why among all the AE diagnostic tools SH and SHK were targeted in this study.
We chose FD as the target disease in order to clarify the subject without the involvement of organic diseases. Most FD patients complain of SH or SHK, 21 and the main symptoms of FD overlap with those of SH or SHK. There are no definite causes and standardized treatment for FD known thus far, 22 and FD accounts for a vast proportion of patients in the TKM area. 23 TKM can play a leading role with regard to the treatment of diseases without organic causes, such as FD. Therefore, we have limited the list of target diseases to FD in this study.
Algometer has been widely studied and established as a reliable and valid tool for measuring PPT in both subcutaneous and underlying tissues. 9,10 Its application has widened significantly, and recent research showed its applicability in cases of nonorganic recurrent abdominal pain in children. 13 The above study assessed the severity of pain and its sites in children objectively, which demonstrated the possibility of quantification of subjective and unclear variables and of application of diagnostic tools in TKM. Algometer was also used to measure the efficacy of intervention by monitoring the progress of abdomen treatment. 12 Based on these considerations, we selected algometer as an appropriate tool for quantifying pain in AE.
In the VAS analysis of epigastric discomfort, there were significant differences between the HC and SH or SHK groups, whereas such a difference was absent between the SH and SHK groups. The results showed no significant difference in PPT values between the HC and SH groups. Since SH is characterized by subjective epigastric discomfort without tenderness but SHK manifest itself with subjective epigastric discomfort and tenderness, the severities of the discomfort between SH and SHK are very similar, unless there is an external stimulus causing tenderness. Our results suggesting a statistically significant difference in PPT values and only insignificant differences in VAS scores between SH and SHK supported the above theory. Therefore, SH and SHK can be clearly differentiated from each other based on the presence of tenderness, and PPT evaluation can be a useful and reliable tool for detecting abdominal tenderness objectively and quantifying the severity of pain.
The analysis of reliability and validity confirmed the high reliability and validity of algometer for AE. The reliability of an algometer has been demonstrated in different studies for several patterns of PPT measurements with time intervals between 45 minutes, 1 hour, and 1 week. 24 –26 Generally, the difference in PPT values decreased with shorter intervals between the assessments and increased when these intervals became longer. 27 We decided 1-minute measurement interval considering participants' compliance and referring to previous studies that used 1–5 minutes of measurement interval. 28,29 Though the second measurement of algometer tended to show low value of PPT compared to the first one, our study showed very strong correlations between the 1-minute-apart trials (p<0.001; Table 2) enough to display that 1-minute interval was sufficient to acquire reliability. Additional studies to determine the interval that gives the best estimate of PPT are necessary in the future. Fischer 16 recommended the application rate of 1 kg/cm2/s, and the importance of applying pressure at a standardized rate has been emphasized. 24 It was noted that higher rates tended to produce higher PPT values, possibly because of the long reaction time of the examiner. 24 As the subject cannot directly control the algometer, there might be a gap between the subject's response and the examiner's reaction, which might lead to an overestimation of PPT. Based on the results of the above studies, the interval of 1 minute between measurements and the rate of 1 kg/cm2/s were considered appropriate, with little possibility of affecting the PPT values.
The sex distribution among the three groups was unbalanced in this study. Factors that might influence the outcome of PPT measurements should be controlled in the future research. A future study with more similar pressure areas and sites of AE is also needed. In our experiments, the area of the footplate of the algometer was fixed as 1 cm2, whereas the TKM physicians used three fingertips for AE diagnosis. Thus, the total contact area between patients' abdomen and TKM physicians' fingertips was likely different from that of the algometer. Standardization of how TKM physicians apply algometer in AE is also necessary. On the other hand, the clinical application of our PPT cutoff value can be limited in the environment where temperature or humidity varies easily. Therefore, the measuring environment including room temperature and humidity should be addressed exactly and other factors affecting PPT value such as existence of functional disorders, pressure speed and intervals between measurements, measurement sites, stress, and noise can be considered during study.
In this study, we revealed the possibility of quantifying AE and established a foundation for such a quantification. However, there is a need for further research that will use a larger sample size, include additional measurement sites, and evaluate other components of AE.
Conclusions
SH and SHK, two subjective AE diagnoses in TKM, can be differentiated by evaluating PPT and quantified with algometer using the results of this study. For successful clinical application, additional large-scale studies of measurement standardization and quantification of other AE components are needed.
Footnotes
Author Disclosure Statement
No competing financial interests exist.