
Abstract
Background/Objectives:
ThetaHealing® (Vianna Stibal, Kalispell, MT) is a spiritual healing method in which the practitioner and client engage in joint meditations during several healing sessions. It is claimed that these meditation periods are characterized by a “theta state” in which the presence of theta-waves in the electroencephalograph (EEG) frequency spectrum of both the healer and the client is supposed. This study sought to test this hypothesis as well as the presence of synchronicities in the two EEGs.
Methods:
Measurements were obtained with a dual EEG system with 2 × 32 channels, allowing for simultaneous EEG measurements of healer and client. Ten healers and 10 clients performed 10 ThetaHealing sessions while the EEG was measured.
Results:
Theta frequency band did not increase in healers or in clients. Rather, the contrary was found, with a significant decrease in theta-2 band during healing in healers. Small correlations were seen between the Fourier amplitudes of healer and client in the theta-2 band, as well as small phase synchronicities in theta frequencies.
Conclusion:
The hypothesis that ThetaHealing is associated with an enhanced generation of theta frequencies in the brain could not be confirmed. This finding makes no claim about whether ThetaHealing is beneficial from a clinical perspective.
Introduction
A
The theta rhythm is an oscillating EEG pattern in the frequency range of 4–7 Hz. This theta band is often additionally split into theta-1 (4–5 Hz) and theta-2 (5–7 Hz). On human EEGs, theta is shown during resting state, 2 drowsiness, and early slow-wave sleep. 3 In the waking state, theta has been associated with both long-term and working memory tasks. 4,5 Theta power has also been found during meditation. 6,7
ThetaHealing is a healing procedure developed in the United States by Vianna Stibal. According to descriptions on various websites (see, for example,
ThetaHealing claims to heal, more or less instantaneously, many conditions for which conventional medicine has no cure or needs much more time. There are several reports, for example, of the disappearance of bone fractures, but also claims of success in hepatitis C, Epstein-Barr virus infection, HIV infection, herpes, tumors, various types of cancers, and genetic defects. 8
To practice this method, the healer instructed by this method enters into a unique state by means of a special meditation. This state, called the theta state, is assumed to be physiologically indicated by the presence of strong theta EEG activity. The healer then aims to mentally connect to a client, who, it is supposed, will also enter into this associated theta rhythmic brain activity state. According to the theory of ThetaHealing, a kind of “reprogramming” takes place by means of energy coming from an external “source”: The roles of theta healer and client are intended only to command and witness the change, which may take place on several levels: physical, mental, emotional, or spiritual. 1
The present study sought to investigate the claim of induction of theta frequency on the EEG of the healer as well as the client. A growing set of studies have investigated coherence patterns between the neurophysiologic activity of two related persons by the means of parallel and synchronized EEG recordings (dual EEG). These studies have been carried out in relation to interpersonal interaction paradigms with both persons being in the same room 9,10 and also in regard to anomalous information transfer between separated participants. 11 –13,* In a recent dual EEG study, Ventura and Persinger 14 assessed spontaneous EEG patterns of Reiki practitioners and clients and found an increase in coherence in the theta band between the two persons that was not present in control participants.
The current study used dual EEG assessment in which the EEG from experienced ThetaHealers and their clients was simultaneously recorded in parallel. The study hypotheses were that (1) the healers taught in this method would be able to elicit voluntary theta rhythmic activity in their EEG, (2) theta rhythm in the brain activity of the client would increase once the ThetaHealers attempted to connect their state to that of the client, and (3) there would be significantly greater correlations in spectral EEG changes regarding the theta bands between the healer's and the client's EEG once healer and client had entered into the so-called theta state compared to a control condition.
Materials and Methods
Design
This experimental study included pairs of healthy participants—the experienced healer and the naive participant (client)—in whom the EEG was recorded simultaneously. The experimental session was broken down into several epochs with different instructions. The hypotheses were assessed by comparing different phases in an intraindividual design as detailed below.
Participants
Ten experienced healers trained in ThetaHealing were recruited: nine from Germany and one from Canada. Recruitment of healers took place through the informal network of German ThetaHealers. One of the healers brought his own client with him. For the remaining nine healers, the investigators recruited clients naive to ThetaHealing. All participants were required to abstain from caffeine on the day of the session. Participants who took medication known to interfere with the EEG spectrum were excluded.
Set-up and materials
The experiment took place in the Neuroscience Laboratory at the Institute for Environmental Health Sciences at the University Medical Center Freiburg, Germany. The laboratory is equipped with a sound-attenuating chamber with electromagnetic shielding, providing a suitable environment for conducting EEG studies.
Apparatus
The laboratory was equipped with a 72-channel QuickAmp amplifier (bandpass, 0.01–100 Hz; sampling rate, 512 samples/s; MES, Munich, Germany) and two 64-channel electrode caps with active electrodes and active shielding (ActiCap, MES, Munich). This 64-channel system was redesigned to record a spontaneous EEG from 32 scalp positions (10–20 system) with a common reference from two persons simultaneously. Each of the two electrode sets had its own ground and reference electrode and its own independent active shielding mechanism, but both were connected to the same amplifier (QuickAmp 72). By this procedure, the EEG of both participants was recorded identically and simultaneously. This procedure was tested thoroughly in several pilot studies to guarantee that the recordings were completely independent of each other and that no cross-talk between the two EEG units was taking place. In addition to the EEG, an electrooculogram and electrocardiogram were recorded. Electrode impedances for EEG were kept to less than 5 kΩ.
Procedures
Participants arrived in pairs at the laboratory, and both participants signed informed consent forms. Participants completed a questionnaire on sociodemographic data, experiences with ThetaHealing and meditation, and a mood scale (Basler Befindlichkeitsskala 15 ). While the client was being connected to the respective EEG system, the experimenter explained the specific tasks of the different epochs to the healer. The healer was then also connected to the EEG system. Healer and client were seated next to each other, face to face. Communication with the experimenter took place via an intercom. Once it was confirmed that all the equipment was working correctly, data recording started. The experimental session was broken down into 10 phases as shown below.
Phases 1 and 2: first baseline measurement
Both participants sat quietly in the closed chamber of the laboratory. Two minutes of resting-state EEG was recorded from both participants with eyes open and another 2 minutes with eyes closed.
Phase 3: theta induction in the healer
The healer was asked to enter the theta state as usually done in a ThetaHealing procedure.
Phases 4–8: theta elicitation in naive participant
In these phases, the healer was asked to connect to the client and to conduct four successive tasks from the ThetaHealing procedures. The start and end of the various phases were communicated with the experimenter via the intercom, but they were not named in order so that the client remained blinded. At the end of phase 8, both healer and client left the healing state and returned to their normal resting state.
Phases 9 and 10: second baseline measurement
Finally, a second baseline measurement with eyes closed (2 minutes) and eyes opened (2 minutes) was conducted.
Post-recording
At the end of the EEG recording, the participants again completed the questionnaire on their mood state (Basler Befindlichkeitsskala). All sessions were scheduled in the morning in order to avoid tiredness as a confounder (tiredness is known to be correlated with theta activity).
On the basis of the study hypotheses, predictions for the different experimental phases were made as outlined in Table 1. Here, an 11th phase was defined as the composite of phases 5–8, all healing phases in which theta was supposed to be increased. For statistical analysis, phases 3–8 were compared to the baseline phases 2 and 9 as described below.
This phase was defined for the analysis as a composite of phases 5–8.
Data preprocessing
EEG data were subjected to a quantitative analysis performed using Matlab software, version 7.2 (MathWorks, Natick, MA) and self-written scripts. Initially, the EEG was scanned for high-amplitude artifacts, and eye-movement artifacts were corrected on the EEG using a linear correction algorithm, similar to that suggested by Gratton et al. 16 For spectral decomposition, a fast Fourier transformation was calculated each second with a moving window of 2 seconds, resulting in 0.5-Hz resolution. Spectral amplitudes were merged into eight frequency bands as follows: delta (0–3.5 Hz), theta-1 (4.0–5.5 Hz), theta-2 (6–7.5 Hz), alpha-1 (8.0–10.0 Hz), alpha-2 (10.5–12.0 Hz), beta-1 (12.5–15.0 Hz), beta-2 (15.5–25 Hz), and gamma (25.5–45.0 Hz).
For further statistical analysis, log-transformed band power (logBP) was used. The data streams were separated into 10 epochs according to the previously defined phases. Epochs of phases 5–8 were added, forming the 11th phase. An epoch of 2 minutes would thus contain 120 time samples. The phases were averaged over time by calculating the median rather than the mean of the logBP because the median is known to be more robust with respect to outliers. For the same reason, the standard deviation was calculated through the interquartile range. This resulted in a data matrix of 32 channels × 8 frequency bands × 11 phases for each of the 10 healers and 10 clients.
Statistical analysis
Band power comparisons
For the statistical comparison of the changes in EEG band power during healing phases compared with the nonhealing baseline phases, nonparametric Wilcoxon rank-sum tests were carried out. Table 2 lists five different comparisons of interest together with the hypotheses. The first comparison (3 versus 2) compared phase 3 (healer entering into ThetaHealing) with phase 2 (baseline, eyes closed). Here, according to our hypothesis, an increase in theta activity would be expected for the data of the healer but not for the client. The second comparison (4 versus 2) compared phase 4 (the client also entered theta state) with phase 2 (baseline, eyes closed). According to Tables 1 and 2, an increase in theta activity would be expected in both client and healer. The same applies to the comparison (11 versus 2) comparing all healing epochs (i.e., phases 5–8) with baseline. The last two comparisons compare the two baselines at the beginning and the end of the session (eyes closed: 9 versus 2; eyes open: 10 versus 1). Here, a potential overall trend in the power spectrum over the entire session may be seen.
BL, baseline.
Intersubject correlations
EEG correlations were also calculated between healer and client. Therefore, the Fourier spectral amplitudes calculated for each second, each electrode, each frequency band, and each participant served as the basis for cross-correlating the time series of the healing period (phase 11) of the healer data with the client data. Zero-lag correlations were calculated for each electrode separately to find area-specific correlations. Global correlations calculated from averaged electrodes were analyzed as well. To test whether such correlations occurred with a time delay in the clients, a lag/lead analysis was performed. Therefore, the band-pass filtered time series signals were correlated after shifting of the client data samplewise up to a delay of 250 samples. This corresponds to nonzero lag cross-correlations from 0 to 1 second.
Intersubject phase synchronicity
The phase coherence of band-pass filtered signals between healers and clients in various theta frequency bands was calculated to examine whether brain oscillations at corresponding EEG locations had significant phase synchronicity. Therefore, the signal was filtered in four bands from 4 to 7 Hz, and each time series was wavelet transformed using a Morlet wavelet with the same frequency and a length of six cycles that was shifted sample by sample through the time series. This resulted in a time series of amplitudes and phase angles for each electrode. Using the phase angle time series data of healers and corresponding clients, correlation coefficients (r) and their p-values between healer and client were calculated. The calculation was done for the series of all healing conditions and all baseline conditions. This resulted in a set of r-values and p-values of the dimension 10 participants × 32 electrodes × 4 theta bands × 2 conditions. The set of p-values was then corrected for multiple testing to account for random significances using the false discovery rate (FDR) adjustment method. 17,18
Ethical considerations
The University Medical Center's ethic committee approved the study. All participants gave written informed consent before the start of the data collection.
Results
The study comprised 20 participants: 10 healers (7 women and 3 men) and 10 clients (7 women and 3 men). Participants had an average age of 38.7 years (range 27–54 years). Healers had a mean of 3 years of experience in ThetaHealing, with an average of 253 healing sessions.
Individual global theta band power contrasts
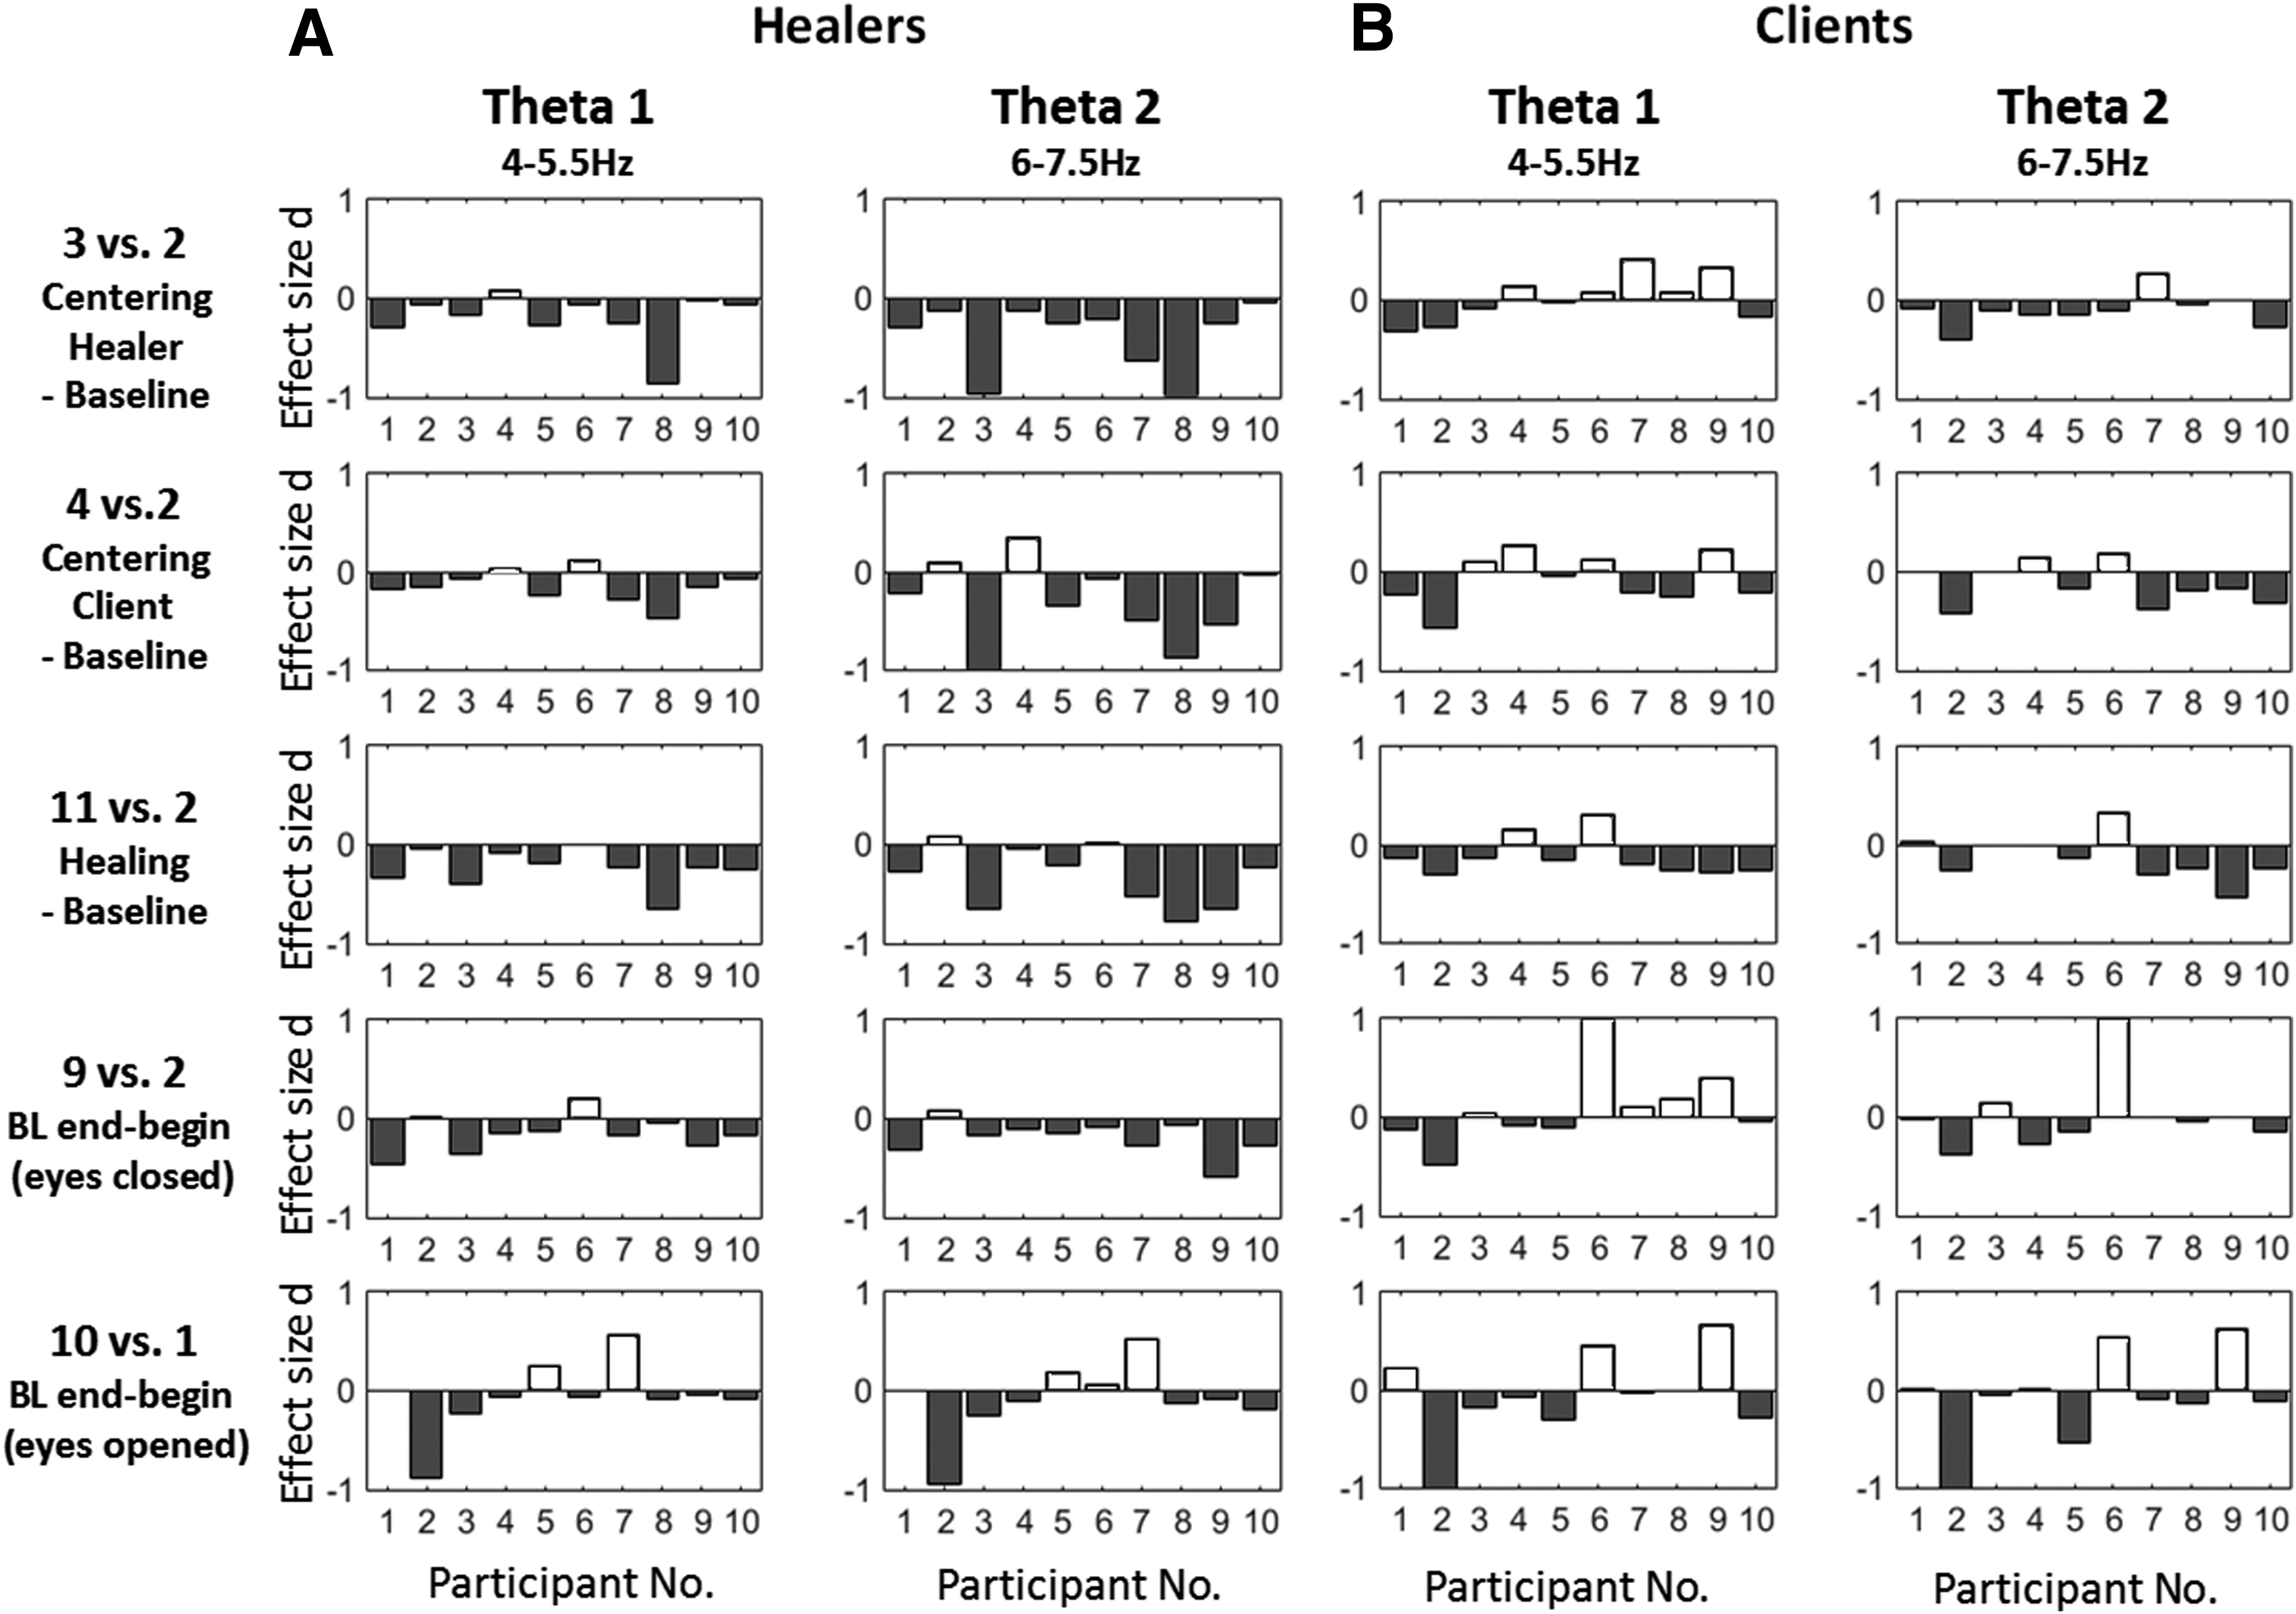
An overall result was first calculated to average the spectral values of all electrodes. This global band power was calculated for all five comparisons and all eight frequency bands. Before showing statistical results, the analysis remained on the level of single subjects and shows the standardized differences (Cohen d) of the theta band activities between the phases of interest. Figure 1A and B illustrate the individual effects for healers and clients of the five contrasts according to the comparisons of Table 2. Figure 1A demonstrates that most healers showed reduced theta-1 and theta-2 activities during healing. Similarly, most clients also showed reduced theta activities during healing, as shown in Figure 1B. Regarding the trend in comparing baselines at the end (phases 9 and 10) with those at the beginning (phases 1 and 2), most healers showed decreases in theta power over the course of the whole session.
Individual theta band power differences between healing and baseline tasks in healers
Global contrasts for all spectral bands
For statistical comparison of the phases, nonparametric Wilcoxon rank-sum tests were calculated (n = 10). To account for false-positive results in the statistical significance test due to multiple electrodes, the surface maps were corrected using the FDR adjustment. 17,18 Tables 3 and 4 provide the z-values; the significant values after FDR adjustment are noted with a superscript “a.” There was no significant increase in any comparison among clients or healers. However, there were significant decreases in healers in a broad spectrum, including theta-1 and theta-2, for the comparison of the healing phases with the initial baseline. Most comparisons contrasting healing phases with baseline result in significant decreases in or tendencies toward decreasing spectral power in healers and clients. The most significant effects could be observed in the alpha-1 and the beta-1 or beta-2 band in healers and clients.
p-values less than α = 0.05 after false discovery rate adjustment across all 5 × 8 values.
p-values less than α = 0.05 after false discovery rate adjustment across all 5 × 8 values.
Topographical contrasts for all spectral bands
Figures 2 and 3 also show topographical differences in band power between different phases of the experiment for all 10 sessions. Generally, most comparisons showed negative trends, and negative significance was predominantly seen in theta-2, alpha-1, and beta bands, indicating a decrease in power during healing. The two graphs clearly indicate that hypotheses 1 and 2 (that theta activity would increase in the healer and, later, accordingly in the client) could not be confirmed by the empirical data. None of the comparisons significantly increased for the clients. The healers showed a significant decrease in the theta-2 band (phase 3) when entering into the so-called theta state. They furthermore showed a significant decrease in theta-1 and theta-2 when connecting with the client (phase 4).
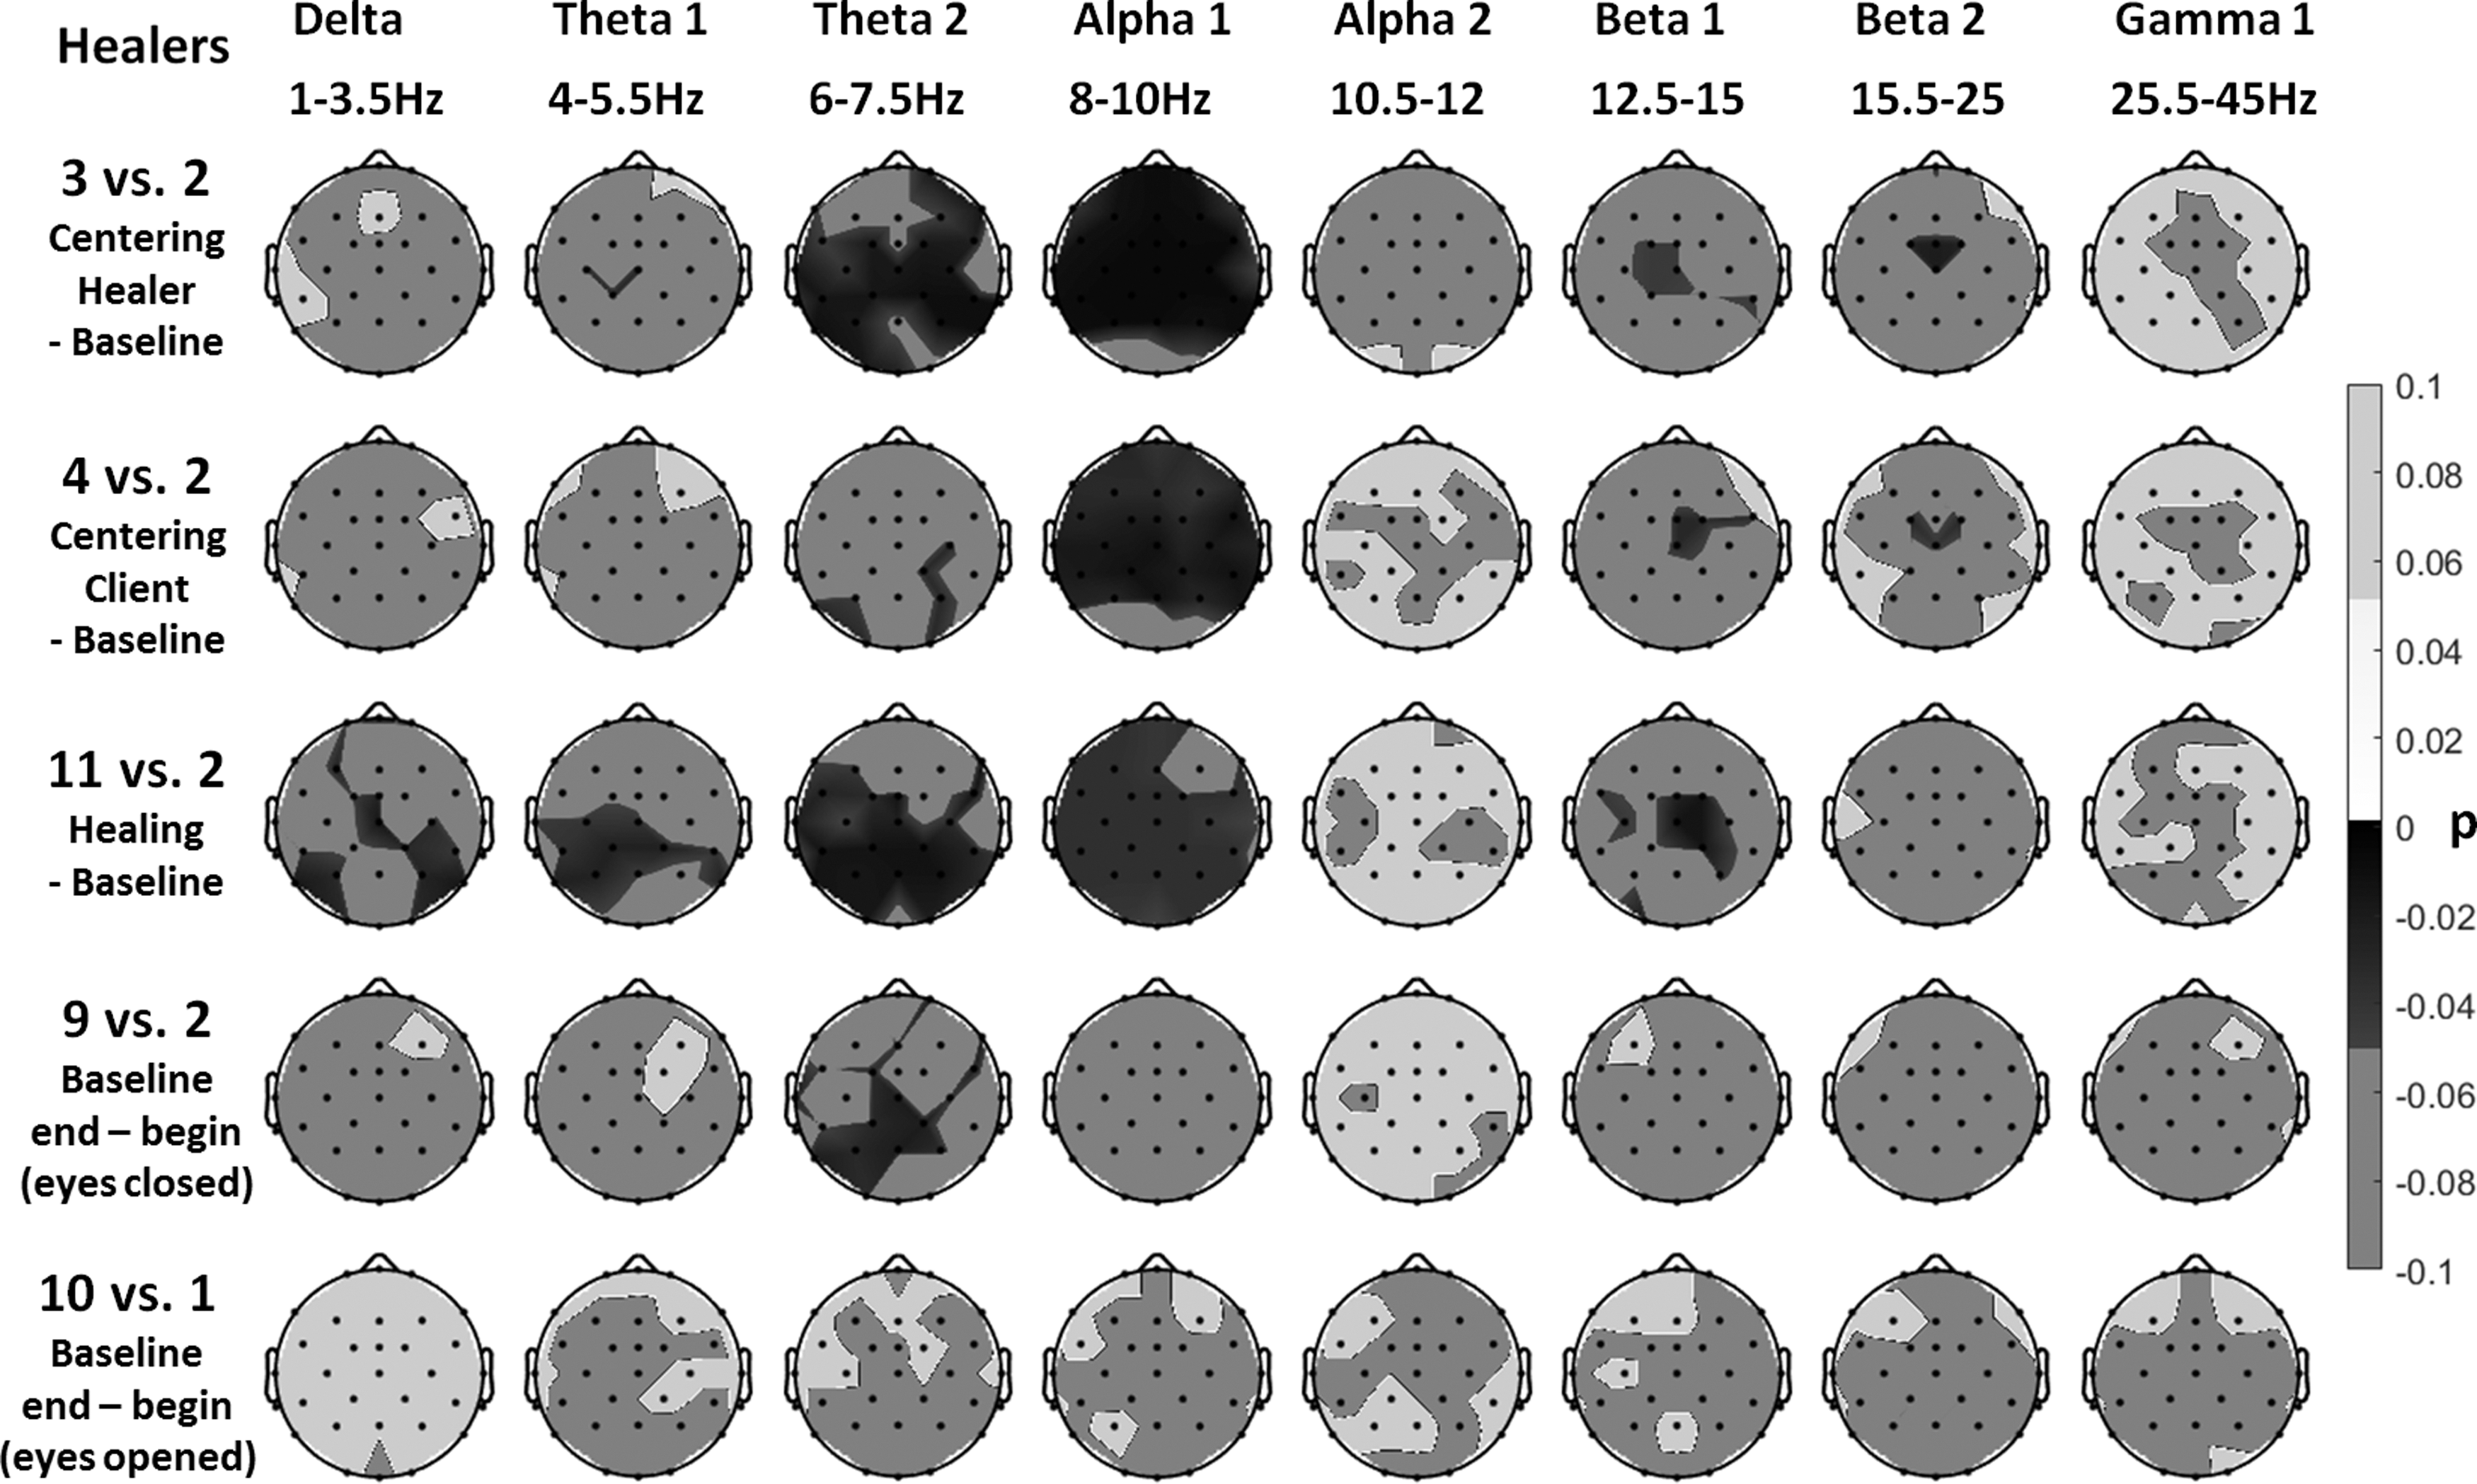
Healers: topographical views of the comparisons of band power values between healing and baseline phases (rows 1–3) for all frequency bands and the changes in the baseline with eyes closed and opened (rows 4 and 5). Data from all healers were used. False discovery rate–adjusted p-values are shown resulting from Wilcoxon rank-sum tests. The p-values from positive z-scores are shown in light gray and when significant in white, while negative z-scores are shown in dark gray and when significant in black.
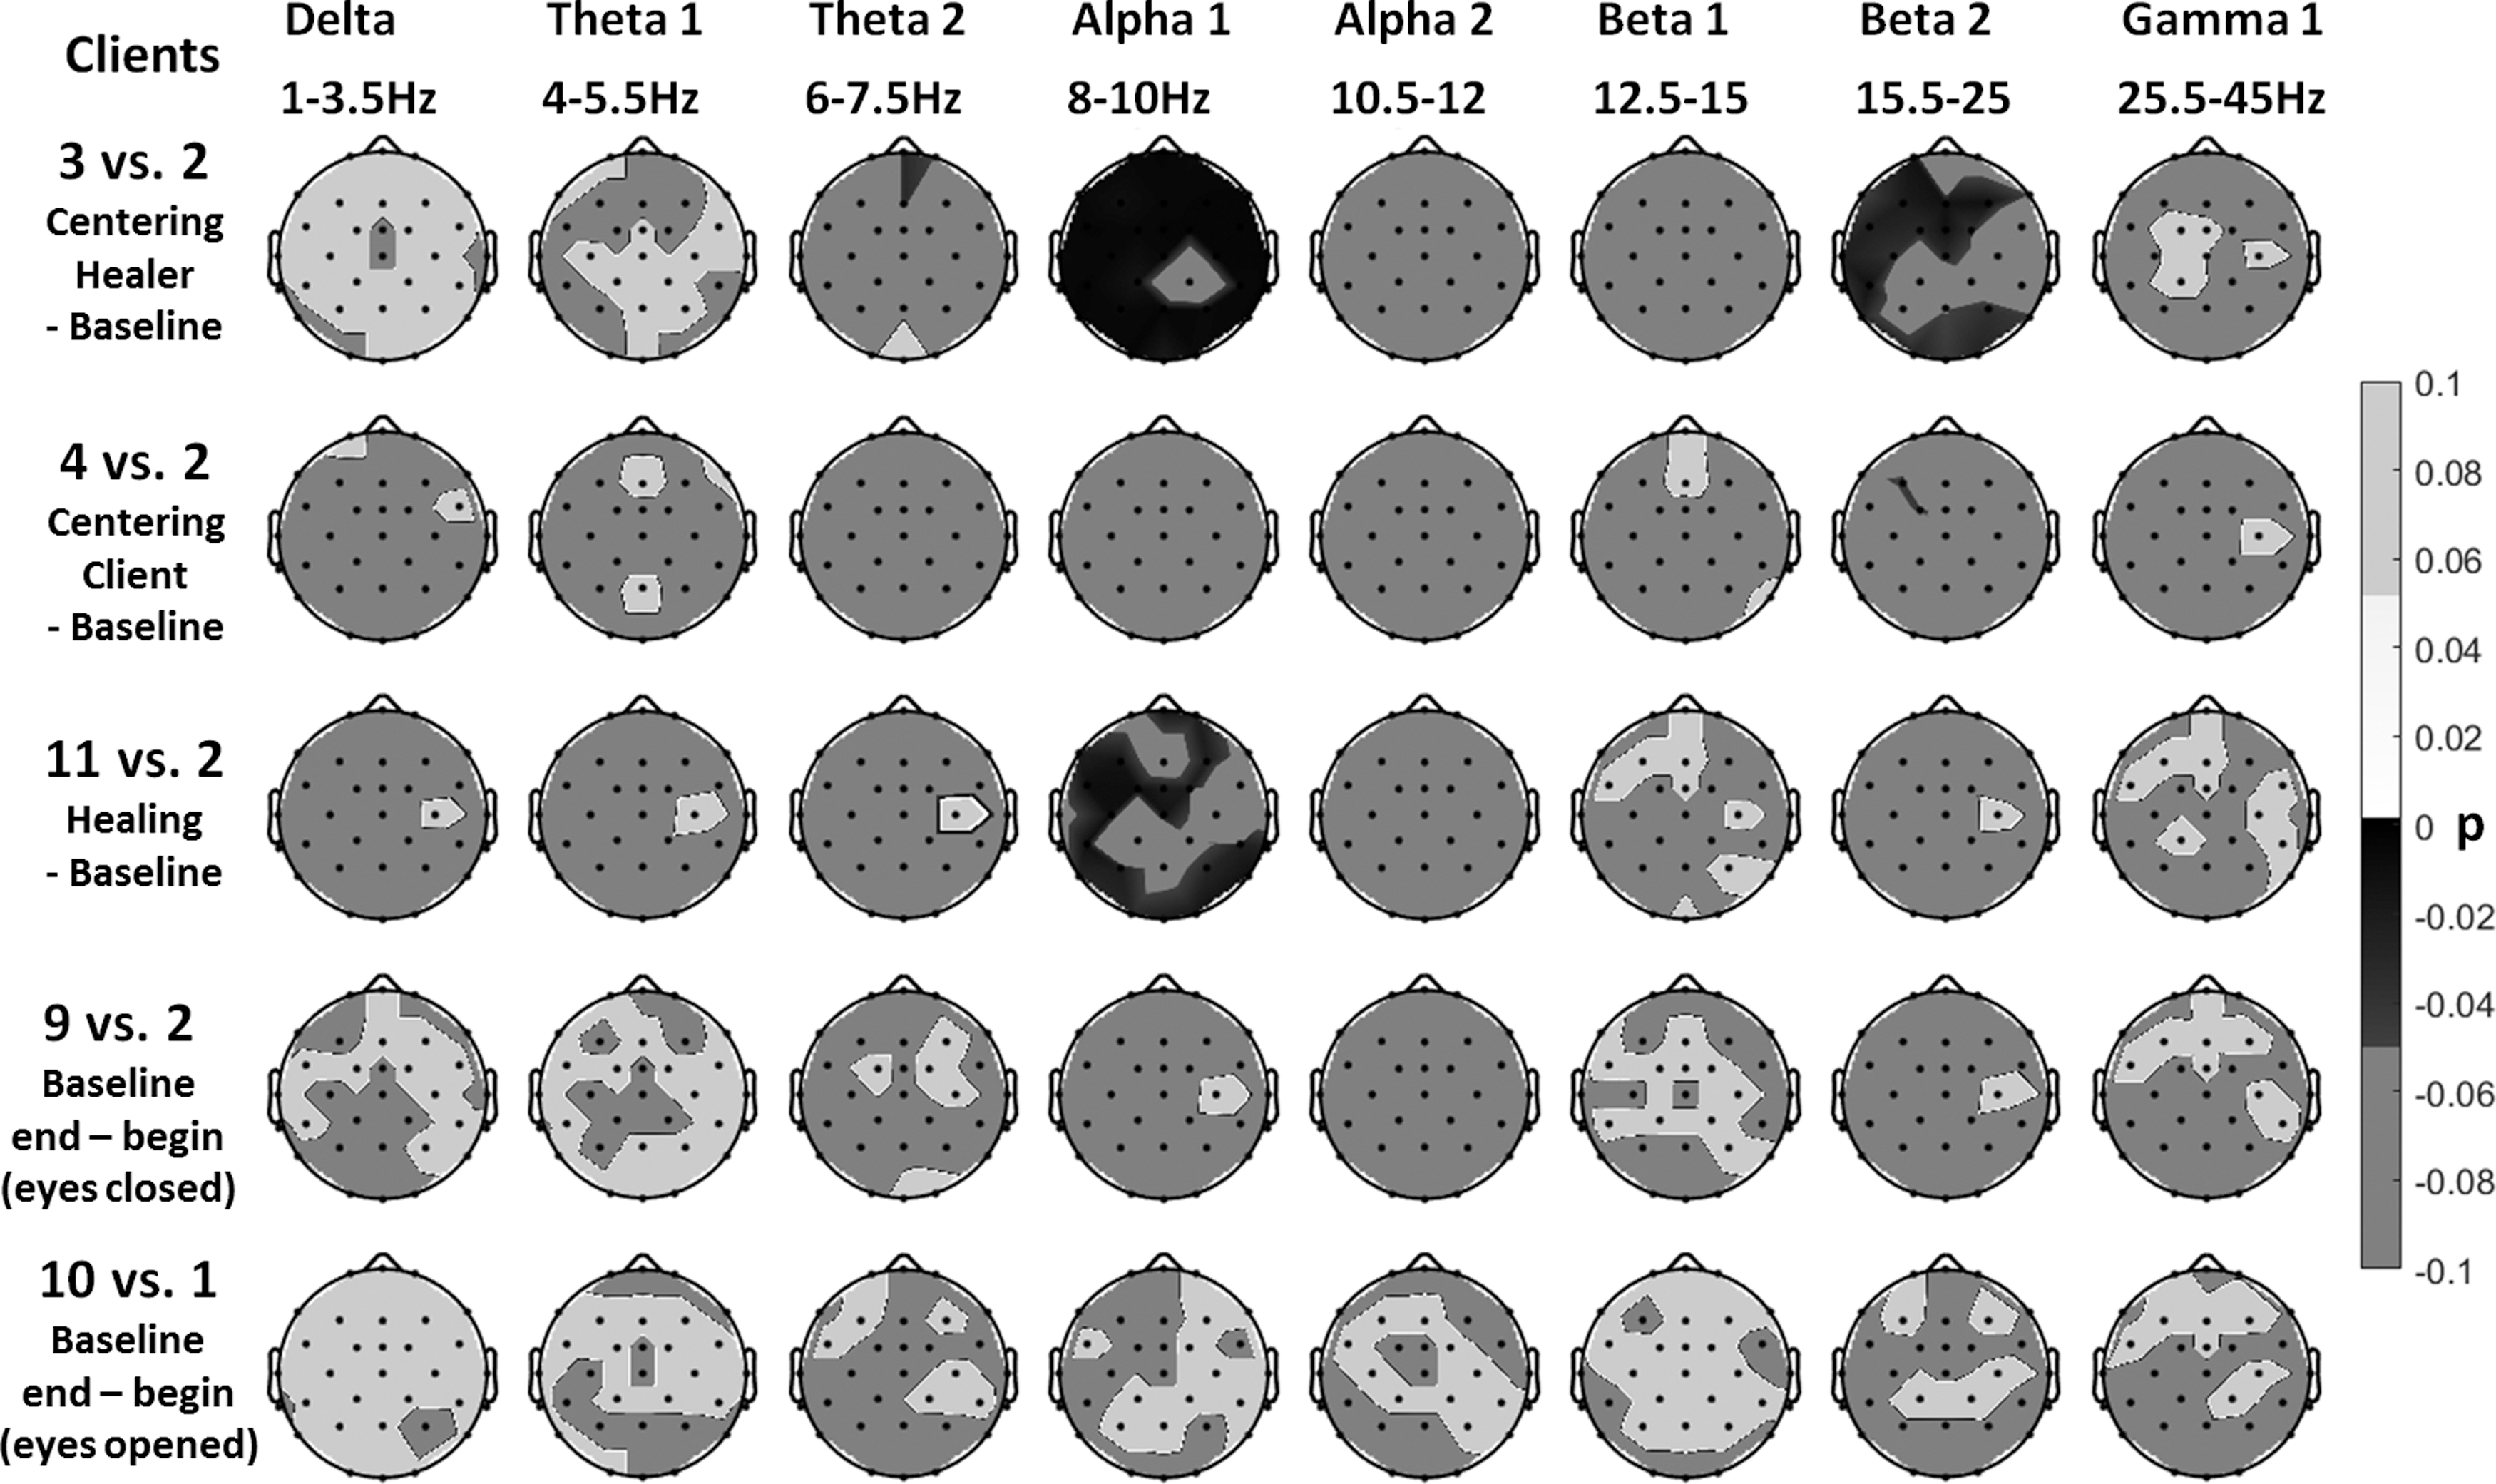
Clients: topographical views of the comparisons of band power values between healing and baseline phases (rows 1–3) for all frequency bands and the changes in the baseline with eyes closed and opened (rows 4 and 5). Data from all clients were used. False discovery rate–adjusted p-values are shown resulting from Wilcoxon rank-sum tests. The p-values from positive z-scores are shown in light gray and when significant in white, while negative z-scores are shown in dark gray and when significant in black.
In the comparison of all healing epochs (phases 5–8) with the baseline phase 2, there was also a significant decrease in theta activity in both bands. Regarding the overall trend, which can be seen by comparing the initial and the final baseline of the 30-minute session, a significant decrease in theta-2 activity was seen in healers in the eyes-closed conditions. The baselines, however (with open eyes), did not lead to significant trends in the power spectral densities.
Zero-lag correlation patterns between healer and client
For all participants and in all frequency bands, correlations of Fourier amplitudes (averaged across all electrodes) between healers and clients remained below r = 0.1. Highest correlations could be observed in the gamma band. For the two theta bands, correlations remained in a range of −0.015 < r < 0.013, which is very small. Individual values for each healer-client pair are displayed in Figure 4A.
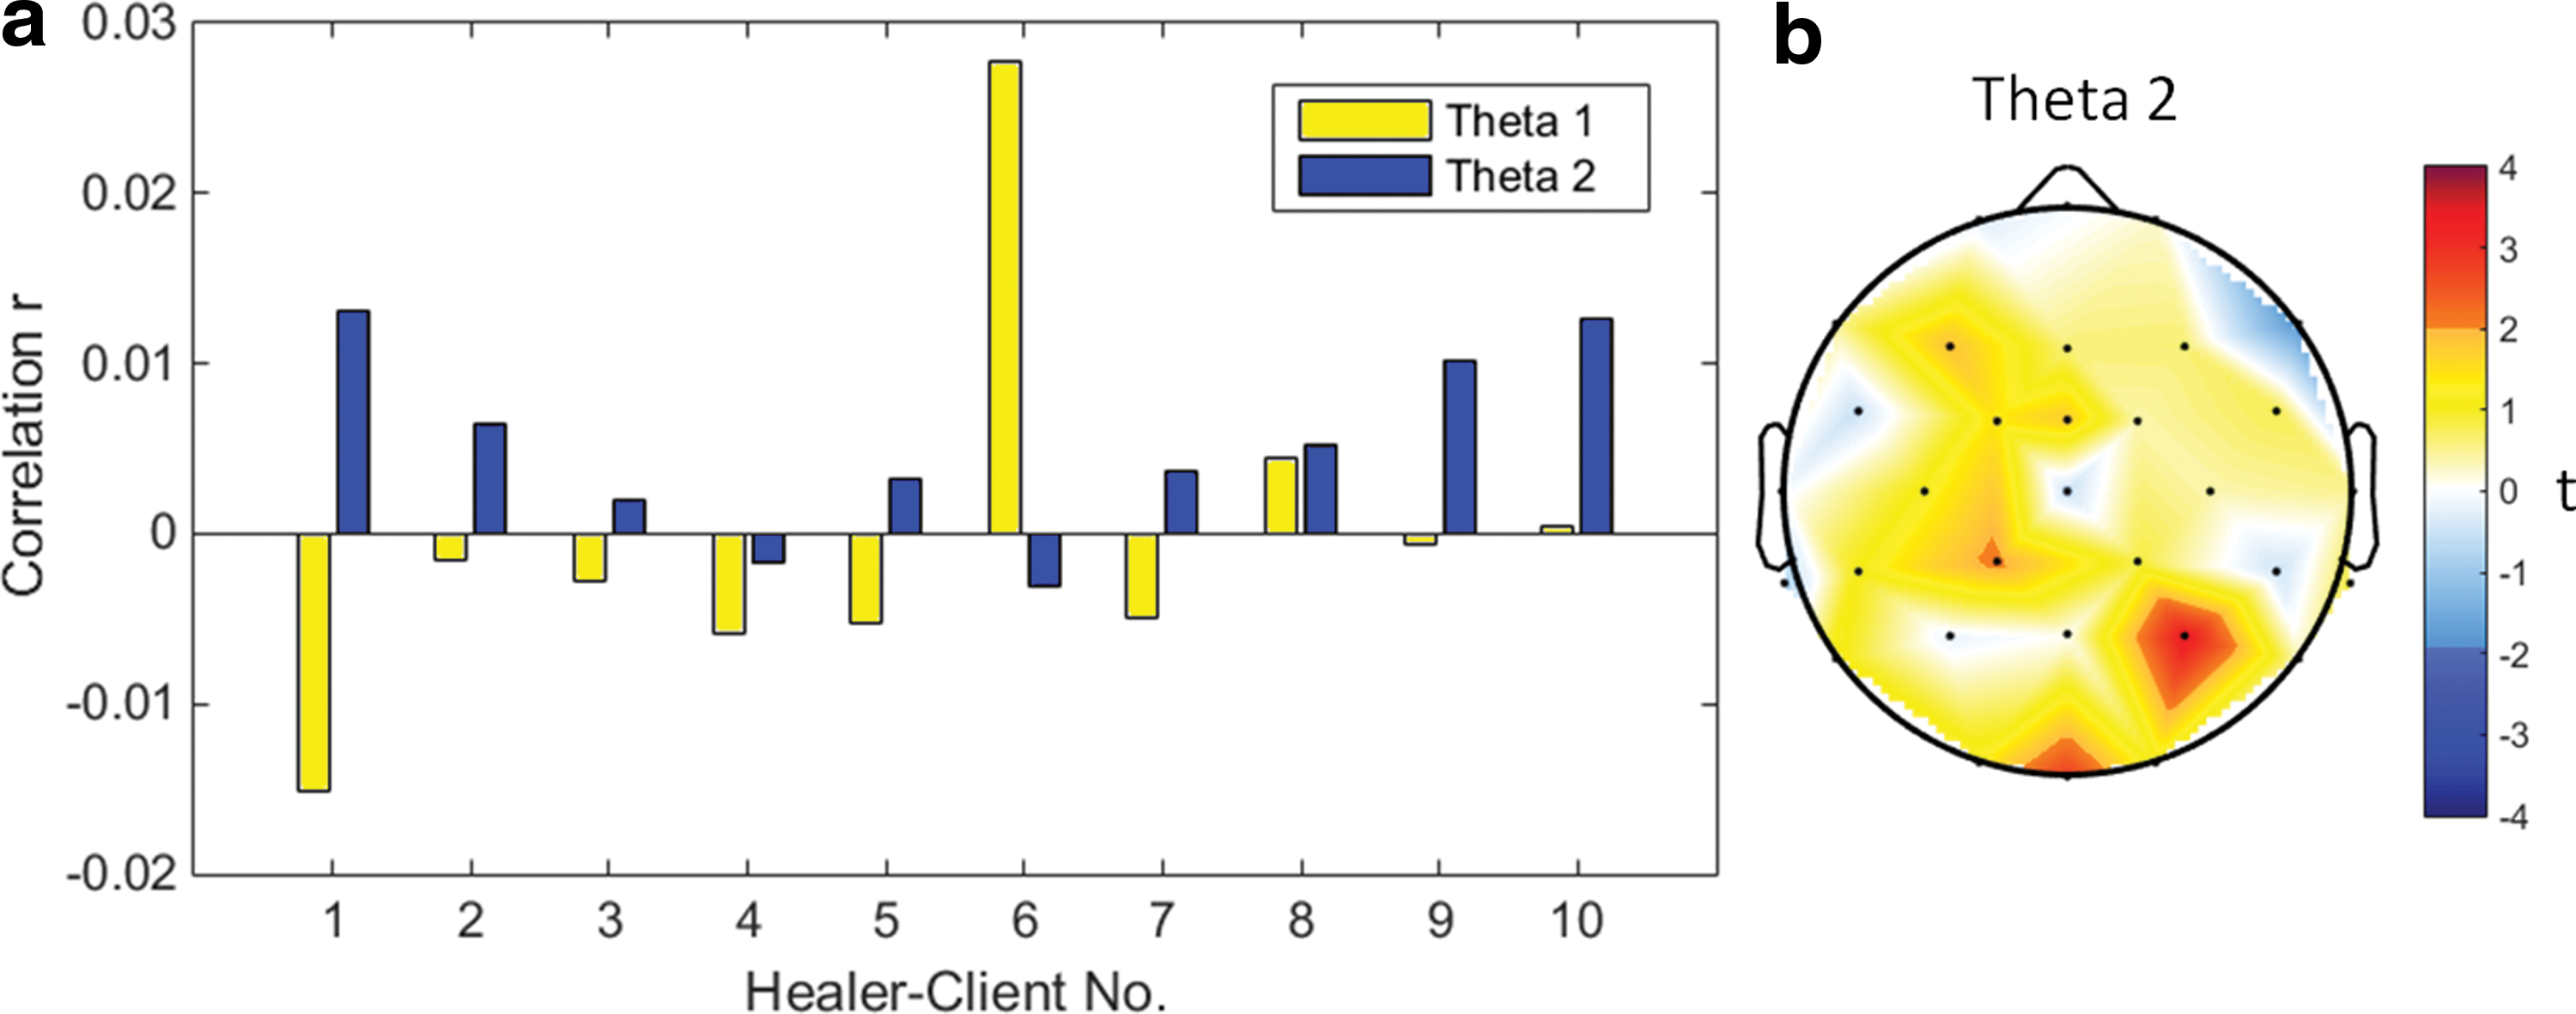
The results from one-sample t tests across n = 10 are depicted in Table 5. Significant positive correlations could be observed in the theta-2 band (t[n = 10] = 2.94; p = 0.017) as well as in the beta-2 band (t[n = 10] = 2.33; p = 0.045). Regarding the theta band only, theta-2 yields a significant correlation. An FDR adjustment of the p-values across all eight bands leads to only nonsignificant results. Figure 4B and C shows the t-test results of the theta-1 and theta-2 correlations topographically. Red or dark blue areas would be significant without correction for multiple testing. After FDR adjustment across 32 electrodes, no significant locations were visible. Therefore, it is concluded that hypothesis 3 was not confirmed when the whole spectrum was considered.
Significant (p < .05) values without correction for multiple testing.
False discovery rate adjustment yields no significant values.
As shown in Table 6, all absolute correlation values (r) at any lag-time are less than r = 0.03 for theta-1 and less than r = 0.02 for theta-2, which are both very small correlations. The localized lag/lead analysis for all 32 electrode sites revealed correlations less than r = 0.07 for theta-1 and less than r = 0.06 for theta-2.
Mean and maximum correlation values are reported.
Analysis of intersubject theta-phase synchronicities
A further question was whether theta waves were phase locked between healer and client. Therefore, a calculation of phase angle correlation using wavelet transformed time series for each pair of participants, each condition (healing or baseline), each electrode, and each frequency between 4 and 7 Hz was performed, resulting in a set of 10 × 2 × 32 × 4 = 2560 values. The FDR-adjusted p-values are displayed in Figure 5. The corresponding set of correlation coefficients was subject to a four-way analysis of variance. Significant main effects were found for the factor participants with F(df = 9) = 8.92 (p < 0.001), as well as for the factor tasks with F(df = 1) = 4.18 (p = 0.04), and the factor electrodes with F(df = 31) = 2.64 (p < 0.001). No significant main effect could be observed in the factor frequency. The mean surface map over all sessions revealed only nonsignificant results. The mean absolute theta phase coherence [abs(R)] over all sessions and electrodes was 0.0048 in the healing phases and 0.0042 in the baseline phases.
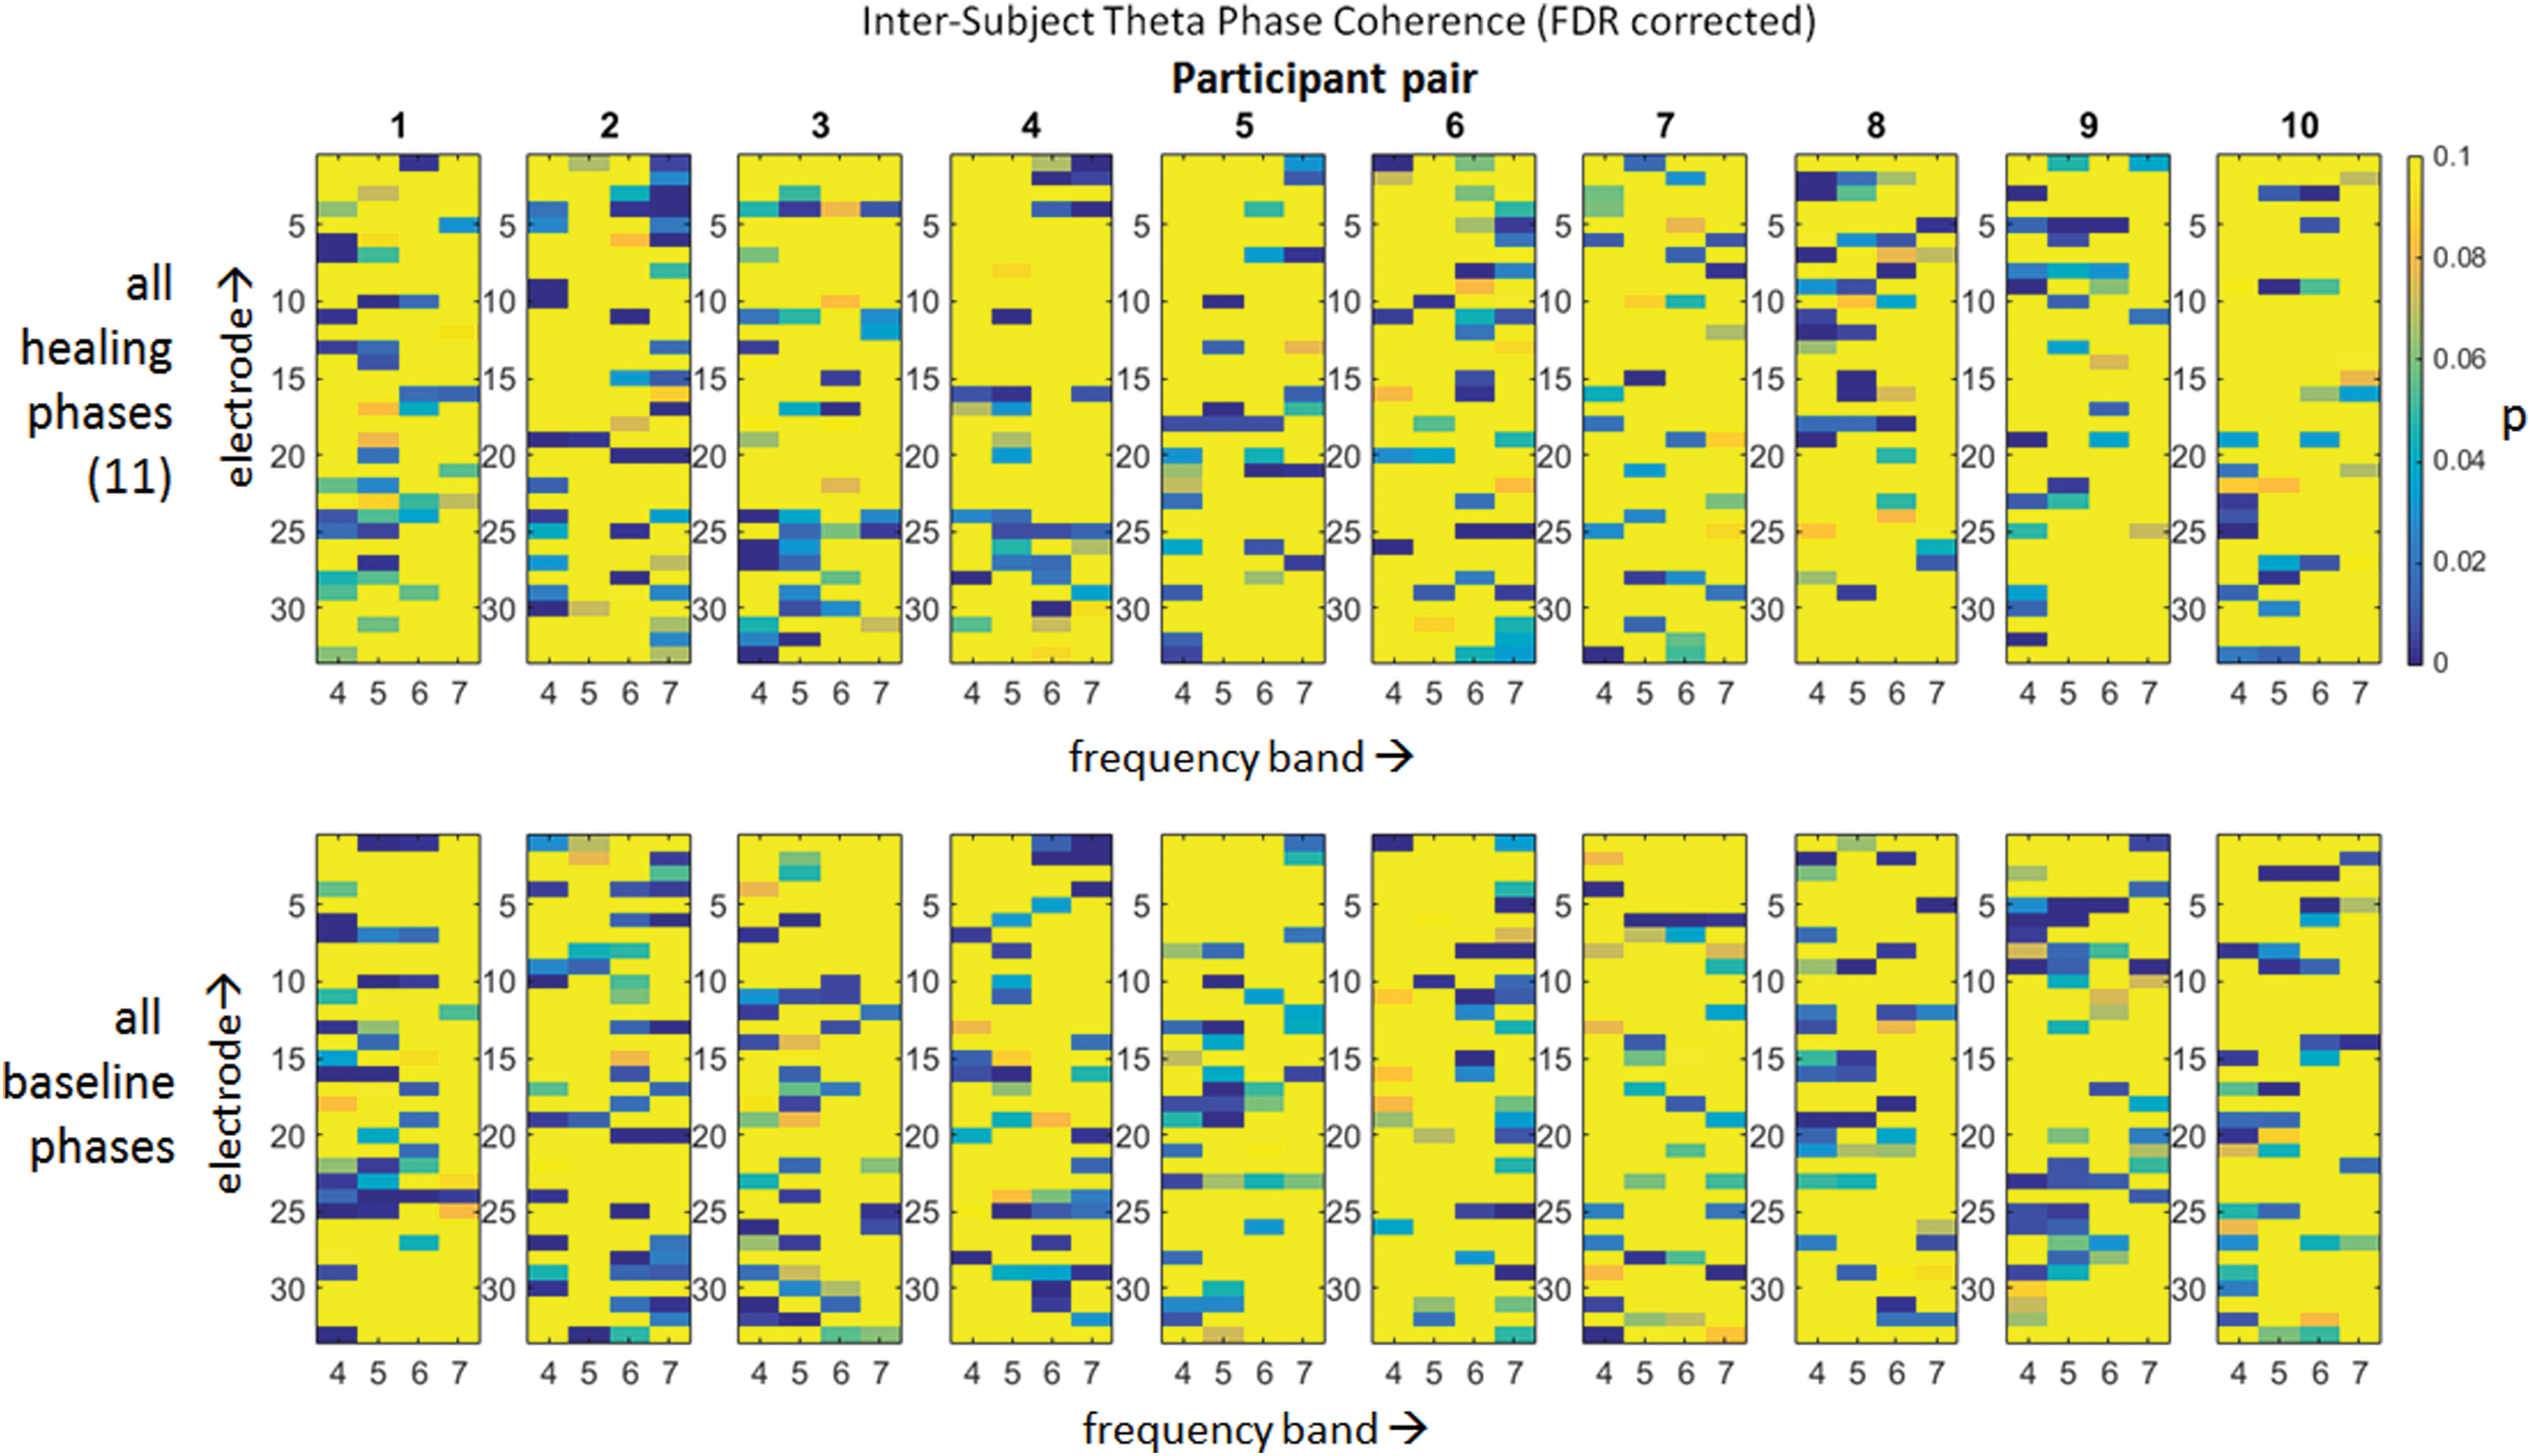
False discovery rate (FDR)–adjusted p-values of the intersubject phase coherence for each participant pair and condition (healing and baseline) in separate images. Each image contains p-values of 32 electrodes and 4 frequencies from 4 to 7 Hz. Blue p-values represent significant differences at a 0.05 level after correction for false discoveries. Color images available online at
Discussion
This dual EEG study was performed to investigate one of the basic claims of a new healing technique called ThetaHealing. These claims were evaluated by three objectives hypothesizing (1) a theta increase in the healer, (2) a theta increase in the client, and (3) an increase in correlations of EEG patterns between healer and client during healing phases. The data did not support the hypotheses in any case. No increase in theta activity occurred during the theta procedure. Theta activity remained more or less unchanged in clients and even decreased in the healers. All these findings conflict with the proposed hypotheses, and the claims for this method, which are also responsible for the specific name of “Theta”-Healing, could not be supported.
The decrease of global alpha power, especially in phases 3 and 4 compared with phase 2, can be explained by a frequently observed alpha behavior in which shortly after the eyes are closed, alpha power increases more than in the subsequent time of continuously closed eyes. A global decrease in theta and delta power during healing compared with baseline accompanied by a decrease in central beta power matches the authors' findings in meditation research. A similar pattern was found in comparing idiosyncratic meditation practices to a baseline recording or in comparing the intention for reaching a state of thoughtless emptiness to a baseline condition similar to that in this study. 19 This pattern was present only in the healers and not the clients, suggesting that the healers entered such a meditative state during their practice. To the authors' knowledge, ThetaHealing asks for a state of thoughtless emptiness in the healer so that he or she is open for receiving relevant information from the client. This would support the findings of this study.
A limitation of the current study may be the statistical power. Ten participants is a rather small sample. However, because the study found no tendency in the hypothesized direction, the assumption that the study may have lacked the statistical power to detect some effect of increased theta activity power is unlikely. A positive outcome with respect to the hypotheses in a larger sample would be possible only if the additional participants provided data completely different from those found in this study. On the other hand, in other similar studies, a sample of 10 pairs was sufficient to detect relevant effects (e.g., Ventura and Persinger 14 ).
Although positive correlations for the Fourier amplitudes were found between healers and clients in the theta-2 band in 8 of 10 sessions, those correlations were very small (r < 0.015) and therefore may be regarded as irrelevant from a functional perspective. Furthermore, the result of the topographically resolved correlation map was nonsignificant after FDR adjustment. In the non-zero lag correlation, small but sometimes significant correlations were again found for single sessions. In a third approach, these intersubject correlations were investigated by calculating the intersubject phase coherence for four theta frequencies. Again, very small but, after FDR adjustment, still significant phase synchronicities were found. However, averaging those data across sessions (i.e., across participant pairs) resulted in nonsignificant coherences. This shows that even if pairs of participants had nonrandom phase synchronicities during a session, the topography and frequency structure of these synchronicities had no similarities between sessions.
The correlations found are not mysterious but can most likely be explained by the fact that both subjects were sitting close to each other in the same measurement chamber during the sessions. Thus, they were exposed to the same acoustic surrounding and also shared some visual stimuli caused by each other. Because it is well known that any stimulation causes evoked brain responses, which are phase-locked to the event, it can be assumed that this environmental connectedness causes intersubject correlations. A closer analysis of this hypothesis would require the time-series of the acoustic events and perhaps visual perceptions (if participants did not have their eyes entirely closed). Since these data were not recorded, such an analysis is not possible. Another option would have been a sensory separation of the participants. However, the interconnectedness of brains beyond a common sensory environment was not the research question of the present study.
Another limitation might be that the somewhat artificial setting, which was used to record simultaneous EEGs from client and healer. Several constraints had to be introduced; for example, client and healer were not allowed to talk to each other during several phases of the experiment. Furthermore, both the laboratory situation and the time-consuming preparation of the EEG introduced crucial differences compared to a normal healing session. Before the start of the healing session, several tests had to be conducted. Moreover, stimulated by the more technical research context, healer and client may have felt some pressure to “prove” their abilities. These atypical circumstances may have resulted in some tension or relaxation problems in the healer and the client. However, none of the healers complained about the circumstances.
Overall, the findings indicate that ThetaHealing most likely does not generate an increase in theta band power activity. This does not mean that ThetaHealing is not effective as a healing method. This study did not investigate any clinical aspect of this approach. Thus, even in light of the preceding findings, further studies should evaluate ThetaHealing.
Footnotes
Acknowledgments
The authors thank the BIAL Foundation for the support of this project within grant no. 42/10. They also thank Michaela Peternell, Claudia Orellana Rios, José Raul Naranjo, and Dennis Centeno for their valuable help in data recording and Majella Horan for assistance in manuscript preparation.
Author Disclosure Statement
No competing financial interests exist.