
Abstract
Objectives:
The aim of this study is to analyze the data obtained from a randomized trial on the prevention of influenza by gargling with green tea, which gave nonsignificant results based on frequentist approaches, by using Bayesian approaches.
Methods:
The posterior proportion, with 95% credible interval (CrI), of influenza in each group was calculated. The Bayesian index θ is the probability that a hypothesis is true. In this case, θ is the probability that the hypothesis that green tea gargling reduced influenza compared with water gargling is true. Univariate and multivariate logistic regression analyses were also performed by using the Markov chain Monte Carlo method.
Results:
The full analysis set included 747 participants. During the study period, influenza occurred in 44 participants (5.9%). The difference between the two independent binominal proportions was −0.019 (95% CrI, −0.054 to 0.015; θ = 0.87). The partial regression coefficients in the univariate analysis were −0.35 (95% CrI, −1.00 to 0.24) with use of a uniform prior and −0.34 (95% CrI, −0.96 to 0.27) with use of a Jeffreys prior. In the multivariate analysis, the values were −0.37 (95% CrI, −0.96 to 0.30) and −0.36 (95% CrI, −1.03 to 0.21), respectively.
Conclusions:
The difference between the two independent binominal proportions was less than 0, and θ was greater than 0.85. Therefore, green tea gargling may slightly reduce influenza compared with water gargling. This analysis suggests that green tea gargling can be an additional preventive measure for use with other pharmaceutical and nonpharmaceutical measures and indicates the need for additional studies to confirm the effect of green tea gargling.
Introduction
T
The authors previously conducted a study on the effects of green tea gargling for prevention of influenza compared with gargling with water. 4 Although the results were not significant according to the p < 0.05 cutoff based on the frequentist approaches, determining the probability that the hypothesis is true and the direct results of the difference in efficacy between green tea and water gargling is needed to inform the design of future studies.
Therefore, the present study reanalyzed the data obtained from the randomized controlled study on the effects of green tea gargling by using Bayesian approaches.
The current study calculated the difference of the posterior proportion of influenza between green tea and water gargling with the index θ. Furthermore, in multivariate logistic regression analysis, a uniform prior and a Jeffreys prior were used as noninformative prior distributions and the results compared.
Materials and Methods
Study design and data description
The data obtained from a randomized controlled trial on the prevention of influenza
4
were reanalyzed by using Bayesian approaches. Briefly, the randomized, open-label, two-group parallel study compared the effect of green tea gargling with water gargling for 90 days during the 2011–2012 influenza season. All participants gave written informed consent before entering the study. The study protocol was approved by the ethics committee of the University of Shizuoka and was conducted in accordance with the Declaration of Helsinki (trial registration:
Infection was the primary outcome measure of this study, and it was diagnosed with an immunochromatographic assay. 5 Two study populations were defined for analysis. The full analysis set (FAS) was determined after exclusion of participants from the total population according to the following criteria: (1) no gargling carried out and/or (2) no gargling data collected and/or (3) withdrawal from the study and refusal to have data used in the study. The per-protocol set (PPS) was defined as a subset of the FAS, and participants who met the following criteria were included: (1) adherence rate of gargling 75% or greater and (2) absence of green tea gargling when in the water gargling group.
Six high schools participated in the study, and 2838 high school students were recruited. Among them, 757 students were enrolled and randomly assigned to a study group: 387 to the green tea group and 370 to the water group. Ten participants withdrew before starting the intervention because of refusal to consent, and 747 participants completed the study. During the study period, influenza occurred in 44 participants (5.9%) in the FAS and 36 (6.8%) in the PPS.
A univariate analysis, such as the Fisher exact test, of influenza was not performed in the original study, and a multivariate logistic regression analysis showed no significant difference between the green tea and water groups in the incidence of influenza (FAS, p = 0.24; PPS, p = 0.66). In the multivariate analysis, vaccination and type of school club (sport- or culture-related) were selected as confounding variables. The same confounding variables were included in the multivariate Bayesian analysis here.
Statistical analysis
Continuous variables are expressed as mean ± standard deviation, and categorical variables are expressed as number and percentage.
The incidence of influenza in each group was calculated as the posterior proportion with 95% CrI, as previously described by Kawasaki and Miyaoka. 6 After calculation of the difference between two independent binominal proportions (π2, post − π1, post ), the 95% CrI was calculated by using the posterior variance of πi and expectation of differences.
The index θ = P (π1, post > π2, post ) was then calculated by using the posterior variance of πi and expectation of differences with the cumulative distribution function of the standard normal distribution. 3,7 The method for calculating θ was previously described by Kawasaki and Miyaoka. 3
In the logistic regression analysis, a uniform prior 8 and a Jeffreys prior 9,10 were used as noninformative prior distributions. The univariate and multivariate analyses were performed and used to calculate the partial regression coefficient with the 95% CrI. Consistent with the previous report, vaccination and type of school club (sport- or culture-related) were selected as confounding variables in the multivariate analysis. 4 The regression models were estimated with the Markov chain Monte Carlo method. 11 –13 The quality of the model fit was assessed by using the deviance information criterion (DIC) and compared between the models; a smaller DIC indicates better model fit. 14
All statistical analyses were performed by using SAS software, version 9.4 for Windows (SAS Institute Inc., Cary, NC).
Results
Baseline characteristics
The flow chart for this study is shown in Figure 1. The baseline characteristics of the participants in the full analysis set (n = 747: water group, n = 363; green tea group, n = 384) are shown in Table 1. The mean age of the participants was 16.1 years (water group, 16.2 years; green tea group, 16.1 years) and ranged from 15 to 17 years in both groups. Men made up 54.8% (n = 199) and 58.3% (n = 224) of the water and green tea groups, respectively; 36.1% and 38.5% of participants in these two groups, respectively, had been vaccinated against influenza. These characteristics were consistent with the previous report. 4
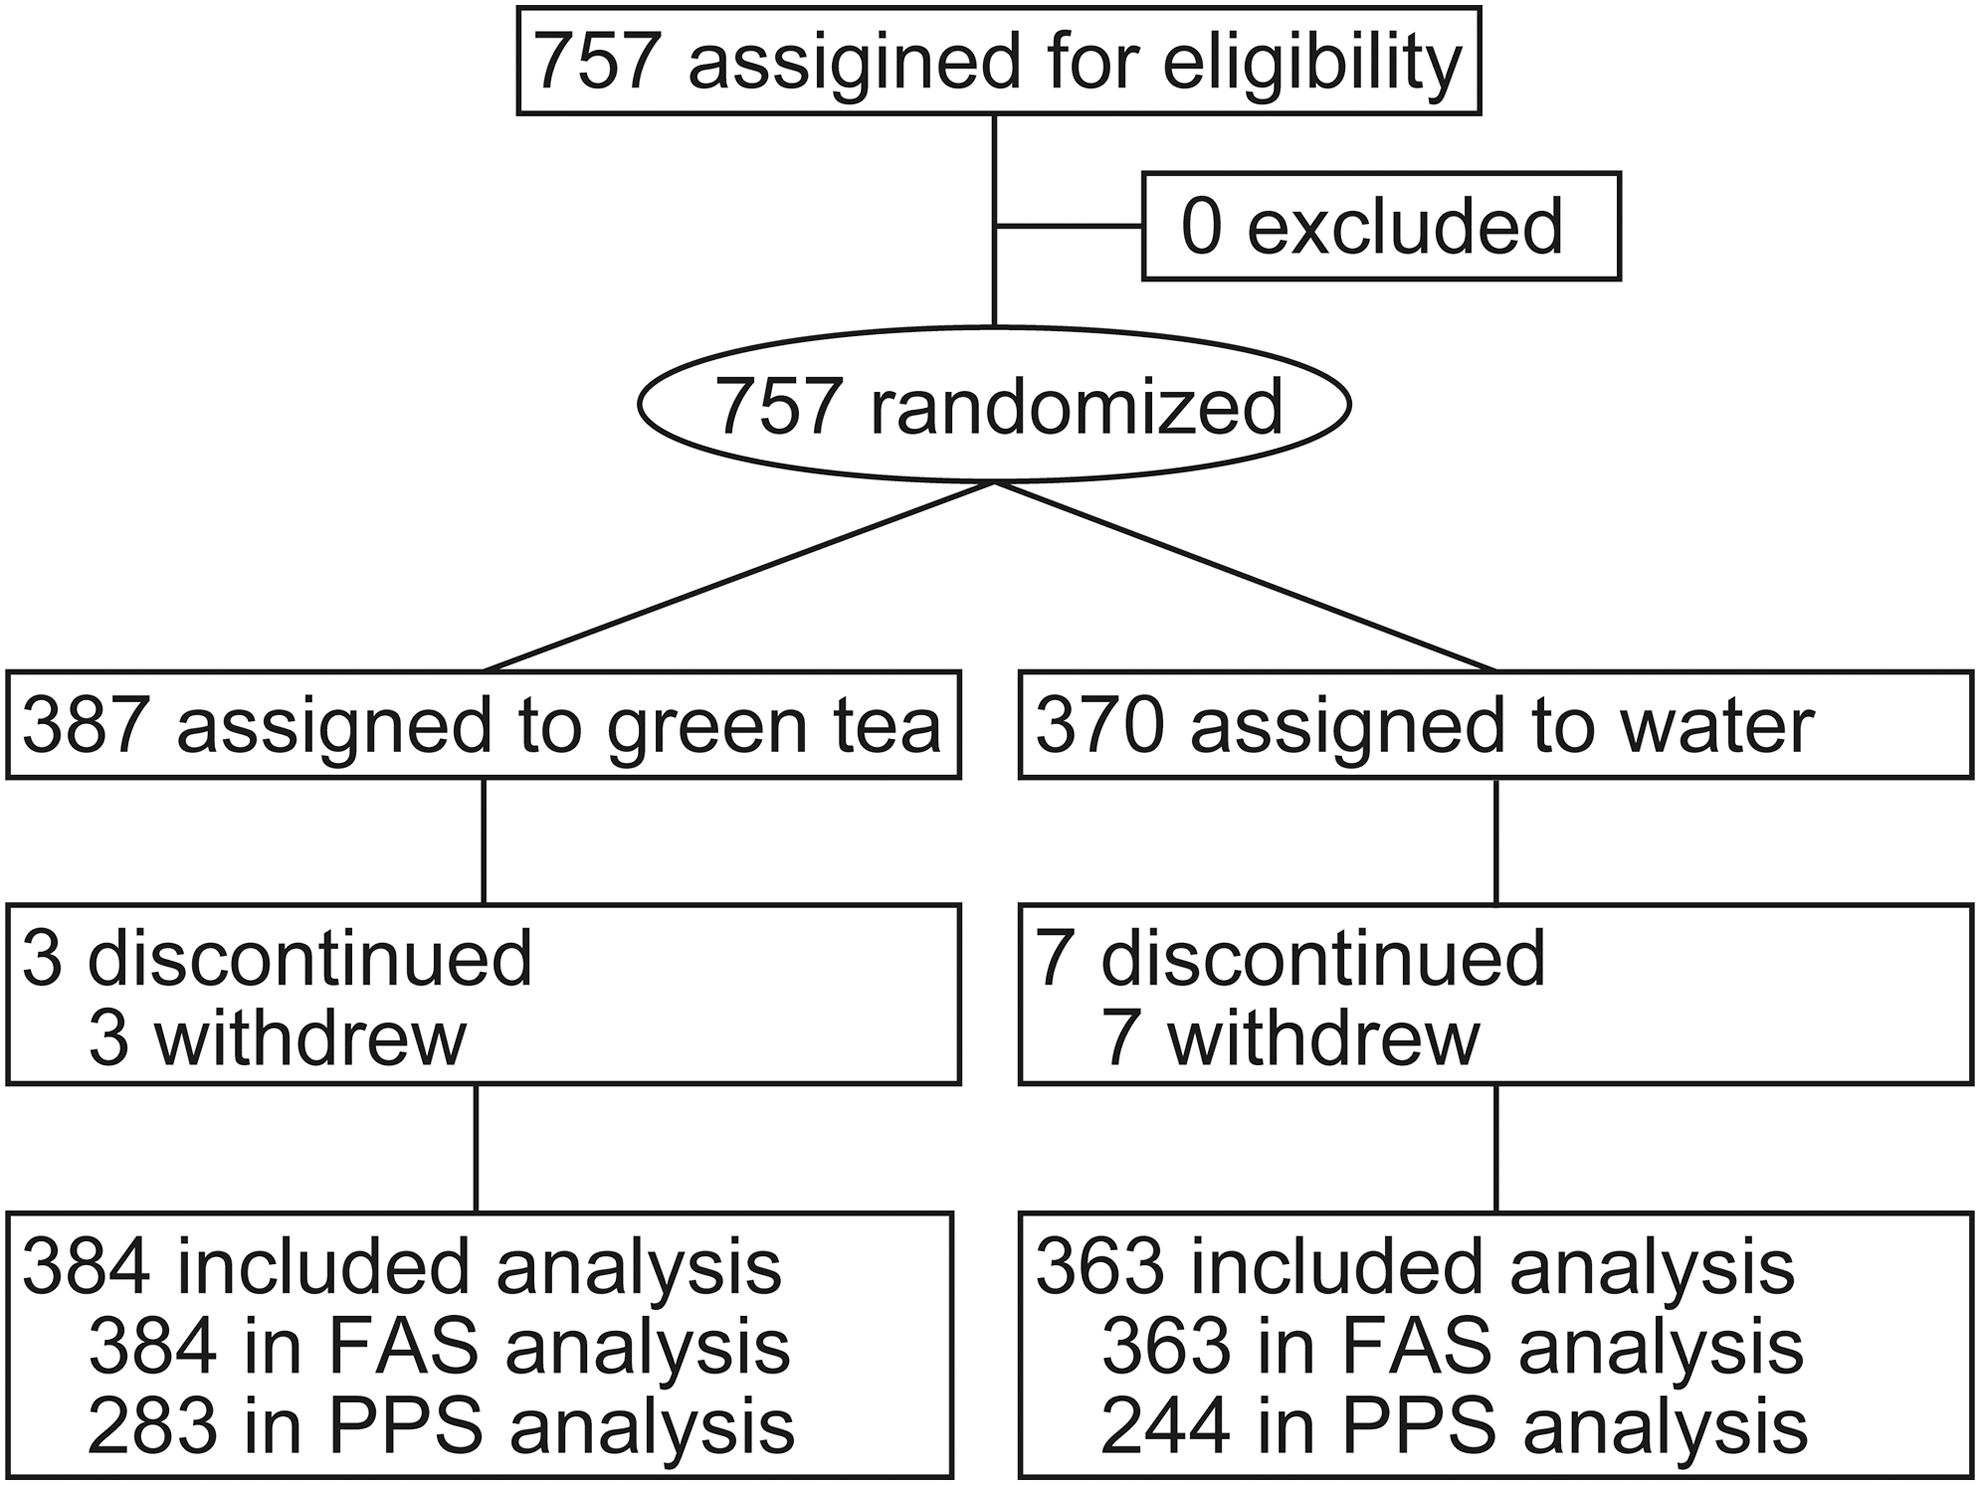
Study flowchart. FAS, full analysis set; PPS, per-protocol set.
Unless otherwise noted, values are the number (percentage).
≥4 d/wk.
>200 mL/d.
FAS, full analysis set; SD, standard deviation; BMI, body mass index; PPS, per-protocol set.
Posterior proportion with 95% CrI
The difference between the two independent binominal proportions with 95% CrI was −0.019 (−0.054 to 0.015) in the FAS and −0.011 (−0.055 to 0.034) in the PPS. The index θ = P (π1, post > π2, post ) was 0.87 in the FAS and 0.67 in the PPS (Table 2).
Univariate and multivariate logistic regression analysis
The partial regression coefficients with 95% CrI in the univariate analysis are shown in Table 3. In the analysis, the partial regression coefficient with the 95% CrI was −0.35 (−1.00 to 0.24) by using a uniform prior in the FAS, −0.34 (−0.96 to 0.27) by using a Jeffreys prior in the FAS, −0.15 (−0.84 to 0.58) by using a uniform prior in the PPS, and −0.38 (−1.10 to 0.29) by using a Jeffreys prior in the PPS.
β = partial regression coefficient.
DIC, deviance information criterion.
The partial regression coefficients with the 95% CrI in the multivariate analysis are shown in Table 4. In the multivariate analysis, the partial regression coefficients with the 95% CrI for the allocation using a uniform prior were −0.37 (−0.96 to 0.30) in the FAS and −0.16 (−0.83 to 0.52) in the PPS; those obtained by using a Jeffreys prior were −0.36 (−1.03 to 0.21) in the FAS and −0.42 (−1.13 to 0.27) in the PPS.
Reference categories are as follows: for allocation—water gargling; for vaccination—nonvaccinated; for club—sports-related club.
β = partial regression coefficient.
The DIC values of the models in the FAS and the PPS were 337.43 and 266.70, respectively, in the univariate model with a uniform prior; 337.34 and 265.64, respectively, in the univariate model with a Jeffreys prior; 340.51 and 269.73, respectively, in the multivariate model with a uniform prior; and 340.23 and 268.5, respectively, in the multivariate model with a Jeffreys prior PPS (Tables 3 and 4).
Discussion
This study used Bayesian approaches to reanalyze the data obtained from the randomized controlled study on the effects of green tea gargling. The difference between two independent binominal proportions and the index θ, which is the probability of the truth of a hypothesis, were calculated. The difference between the two independent binominal proportions was less than 0, and the θ in the FAS was greater than 0.85; therefore, green tea gargling might slightly reduce influenza infection compared with water gargling. However, the efficacy should be relatively low given the value and the CrIs of the difference between the two groups.
Baseline characteristics of the participants were consistent with the previous report. 4 The reproducibility of the descriptive measures means the data used in the study are reliable. The rate of influenza vaccination among participants was similar to those in a previous report focusing on the Japanese population by Nobuhara et al. 15 ; thus, the study population herein would be adequate to evaluate the effect of green tea gargling as a preventive measure for use with standard pharmaceutical and nonpharmaceutical preventive measures.
The difference between the two independent binominal proportions was between −0.011 and −0.019. The negative values indicate that the intervention relatively reduced influenza by 1.1%–1.9% compared with water gargling. The values of θ were 0.67 to 0.87, indicating a 67.4%–87.4% probability that green tea gargling truly reduces influenza compared with water gargling. The univariate and multivariate logistic regression analyses also showed a negative association between green tea gargling and influenza. The point estimates of the partial regression coefficients in the univariate and multivariate logistic regression analysis were less than 0, but the 95% CrIs included 0. Although the efficacy should be relatively low considering the results of these analyses, the greater than 65% probability that the hypothesis was true, especially the 87.4% probability in the FAS, suggests that green tea gargling can be an additional preventive measure for use with other pharmaceutical and nonpharmaceutical measures. Therefore, additional studies to confirm the effect of green tea gargling would be reasonable.
From the viewpoint of statistical approach, there is a meaningful difference between the results produced by the frequentist approach used in the previous study and the Bayesian approach used in the present one. Through use of a frequentist approach, it is possible to calculate only the probability of obtaining the observed data given a certain hypothesis, and it is not possible to know the probability that the hypothesis is true. 2 The results of this kind of frequentist statistical analysis are interpreted according to p-values. The previous study was conducted by using this approach; its conclusion was that there was a nonsignificant difference between the groups. However, the present study, by using the Bayesian approach, could calculate the probability of the truth of the hypothesis through use of the parameter θ. For this reason, the two approaches (frequentist and Bayesian) gave different results. In this respect, the method used in the present study has produced the clinical insight that the treatment resulted in a 1.1%–1.9% reduction in the infection rate, as well as the probability of the truth of the hypothesis.
However, to estimate results more accurately with both the frequentist and Bayesian approaches, it is important to carry out additional studies. The empirical Bayesian method, which estimates the hyperparameter from the results of previous studies, 16 –20 enables calculation of θ, 3 which indicates the probability of the truth of a hypothesis, and it will be improved by considering previous studies.
The values of DIC were similar among groups in each population, which indicated that the uniform prior and the Jeffreys prior gave similar results for a large enough sample size. Future related studies with large populations may be able to apply both of the priors for Bayesian analysis.
When large-scale clinical studies are conducted in the future, care should be taken in relation to study conditions on two points. First, double-blind study design is preferable. In the present study, the adherence rate of both groups was lower than 75%, and the percentage was lower in the water group than in the green tea group. 4 This may be due to the open-label study design and its possible influence on participants' perception of the effectiveness of the interventions. Similar future studies should use a double-blind design. Second, living environment can also be a confounding variable. If an empirical statistical analysis is to be applied to future studies, the environment of the groups being studied should be as similar as possible. For example, the estimated influenza rates reported by the World Health Organization show differences between adults and children; therefore, groups with similar age distribution will give more accurate results. 21
In summary, green tea gargling might slightly reduce influenza compared with water gargling, with a greater than 65% probability that this is true, especially in the FAS, where the probability was 87.4%. Additional studies to confirm the effect of green tea gargling would therefore be reasonable. In addition, this study suggested that the combination of the frequentist and Bayesian approaches is useful for interpreting the results of clinical studies.
Footnotes
Acknowledgments
This work was supported by a grant from the Japan Society for the Promotion of Science through the Grant-in-Aid for JSPS Fellows (no.15J10190 to K.I.). The funders had no role in study design, data collection and analysis, decision to publish, or preparation of the manuscript.
K.I. and Y.K. had full access to all of the data in the study and take responsibility for the integrity of the data and the accuracy of the data analysis. Study concept and design: Y.K., K.I. Acquisition of data: K.I., H.Y. Statistical analysis and interpretation of data: K.I., Y.K., and M.A. Writing and revising of the manuscript: K.I. All authors read and approved the final manuscript.
Author Disclosure Statement
No competing financial interests exist.