
Abstract
Objective:
To study the effect of homeopathic medicines (in higher potencies) in normal subjects, Peripheral Pulse Analyzer (PPA) has been used to record physiologic variability parameters before and after administration of the medicine/placebo in 210 normal subjects.
Methods:
Data have been acquired in seven rounds; placebo was administered in rounds 1 and 2 and medicine in potencies 6, 30, 200, 1 M, and 10 M was administered in rounds 3 to 7, respectively. Five different medicines in the said potencies were given to a group of around 40 subjects each. Although processing of data required human intervention, a software application has been developed to analyze the processed data and detect the response to eliminate the undue delay as well as human bias in subjective analysis. This utility named Automatic Analysis of Intervention in the Field of Homeopathy is run on the processed PPA data and the outcome has been compared with the manual analysis. The application software uses adaptive threshold based on statistics for detecting responses in contrast to fixed threshold used in manual analysis.
Results:
The automatic analysis has detected 12.96% higher responses than subjective analysis. Higher response rates have been manually verified to be true positive. This indicates robustness of the application software. The automatic analysis software was run on another set of pulse harmonic parameters derived from the same data set to study cardiovascular susceptibility and 385 responses were detected in contrast to 272 of variability parameters. It was observed that 65% of the subjects, eliciting response, were common.
Conclusion:
This not only validates the software utility for giving consistent yield but also reveals the certainty of the response. This development may lead to electronic proving of homeopathic medicines (e-proving).
Introduction
H
Experiments performed by several researchers in the field during the past 50 years have failed to give any conclusive explanation. Although clinical evidence exists about the disease cure in patients in the past 200 years, practitioners have started documenting the efficacy of this system of medicine with the help of noninvasive techniques such as ultrasonography and impedance plethysmography (IPG) during the past 50 years. 2 A breakthrough research was published in 1988 3 describing observations of basophil degranulation in the absence of any anti-IgE molecule in antigen–antibody reaction. This suggested the necessity of a hydroxyl group in the solvent for carrying forward the medicinal properties. However, results of these experiments could not be reproduced for unknown reasons. 4
In 2010, researchers detected nanoparticles in homeopathic preparations, 5 but its elemental analysis has shown peaks of other impurity elements also. This hypothesis has the advantage of explaining the presence of a medicinal substance in higher potencies (since nanoparticles reside on the surface and do not obey Avogadro's law). Scientific acceptance of this hypothesis depends upon multicentric trials and compliance with test of reproducibility.
Bhabha Atomic Research Centre (BARC) developed a medical analyzer for recording variability in heart rate, blood flow, or stroke volume from a single data acquisition in a subject. 6 This instrument, also known as Peripheral Pulse Analyzer (PPA) (Fig. 1), is based on the principle of IPG and records instantaneous electrical impedance (Z) of a body segment and derives change in impedance (ΔZ[t]) and rate of change of impedance (dZ/dt) as a function of time. Since blood is a good conductor of electricity, these impedance signals can be used to derive blood flow in real time and estimate physiologic parameters such as heart rate, blood flow index, stroke volume, and morphology index (of the peripheral pulse). 7 The beat-to-beat parameters, thus obtained, can be used to find variability spectrum of heart rate, blood flow, and morphology index as follows.

Schematic diagram of Peripheral Pulse Analyzer system. After initial rest of 15 min, with the patient in supine, sine wave current (of 50 kHz frequency and 2 mA magnitude), produced by sine wave generator, band pass filter and V to I converter, is passed through the upper extremity with the help of electrodes I1 and I2 applied around elbow and palm. Voltage signal developed at the wrist, along the current path, is sensed with the help of electrodes V1 and V2. The sensed signal is electronically processed (amplified, filtered, rectified, etc.) to yield instantaneous electrical impedance (Z), change in impedance as a function of time (ΔZ[t]), and rate of change of impedance dZ/dt. These signals are acquired by laptop at a sampling rate of 500 samples per second through single board computer for further processing. Although this instrument can similarly be used for recording peripheral pulse from the lower extremity, upper extremity is preferred for recording peripheral pulse due to its easy access.
Array of these parameters is interpolated to obtain their periodic values (in place of the existing rhythmic values) for a span of 256 sec. The interpolated array of data is subjected to Fourier transform to obtain power spectral density (PSD) of the variations, commonly known as Variability Spectrum. PSD depicts the contribution of various rhythms causing variability in the said physiologic parameters. Due to large span of total variations in a parameter, PSD generally displays normalized values (absolute value of component power multiplied by 100 and divided by the total spectral power) of spectral components. 8,9
PSD thus obtained reveals the input contribution of different body systems to autonomic nervous system (ANS). 10 Typical heart rate variability (HRV) spectrum is divided into three important parts, referred to as very low frequency (VLF), low frequency (LF), and high frequency (HF) regions. Physiologic experiments have shown that HF represents activity of vagus nerve synchronizing with respiration, LF is caused by sympathetic and parasympathetic stimulation, and VLF represents partly sympathetic activity and renin–angiotensin system. 11,12 Several studies 6,12 –15 have shown the manifestation of several diseases on the variability spectra as summarized in Table 1. As a natural extension of these observations, authors recorded HRV and blood flow variability (BFV) in normal subjects before and after administration of sulfur 1 M (typical response shown in Fig. 2), Gelsemium 10 M, and phosphorus 30. 16
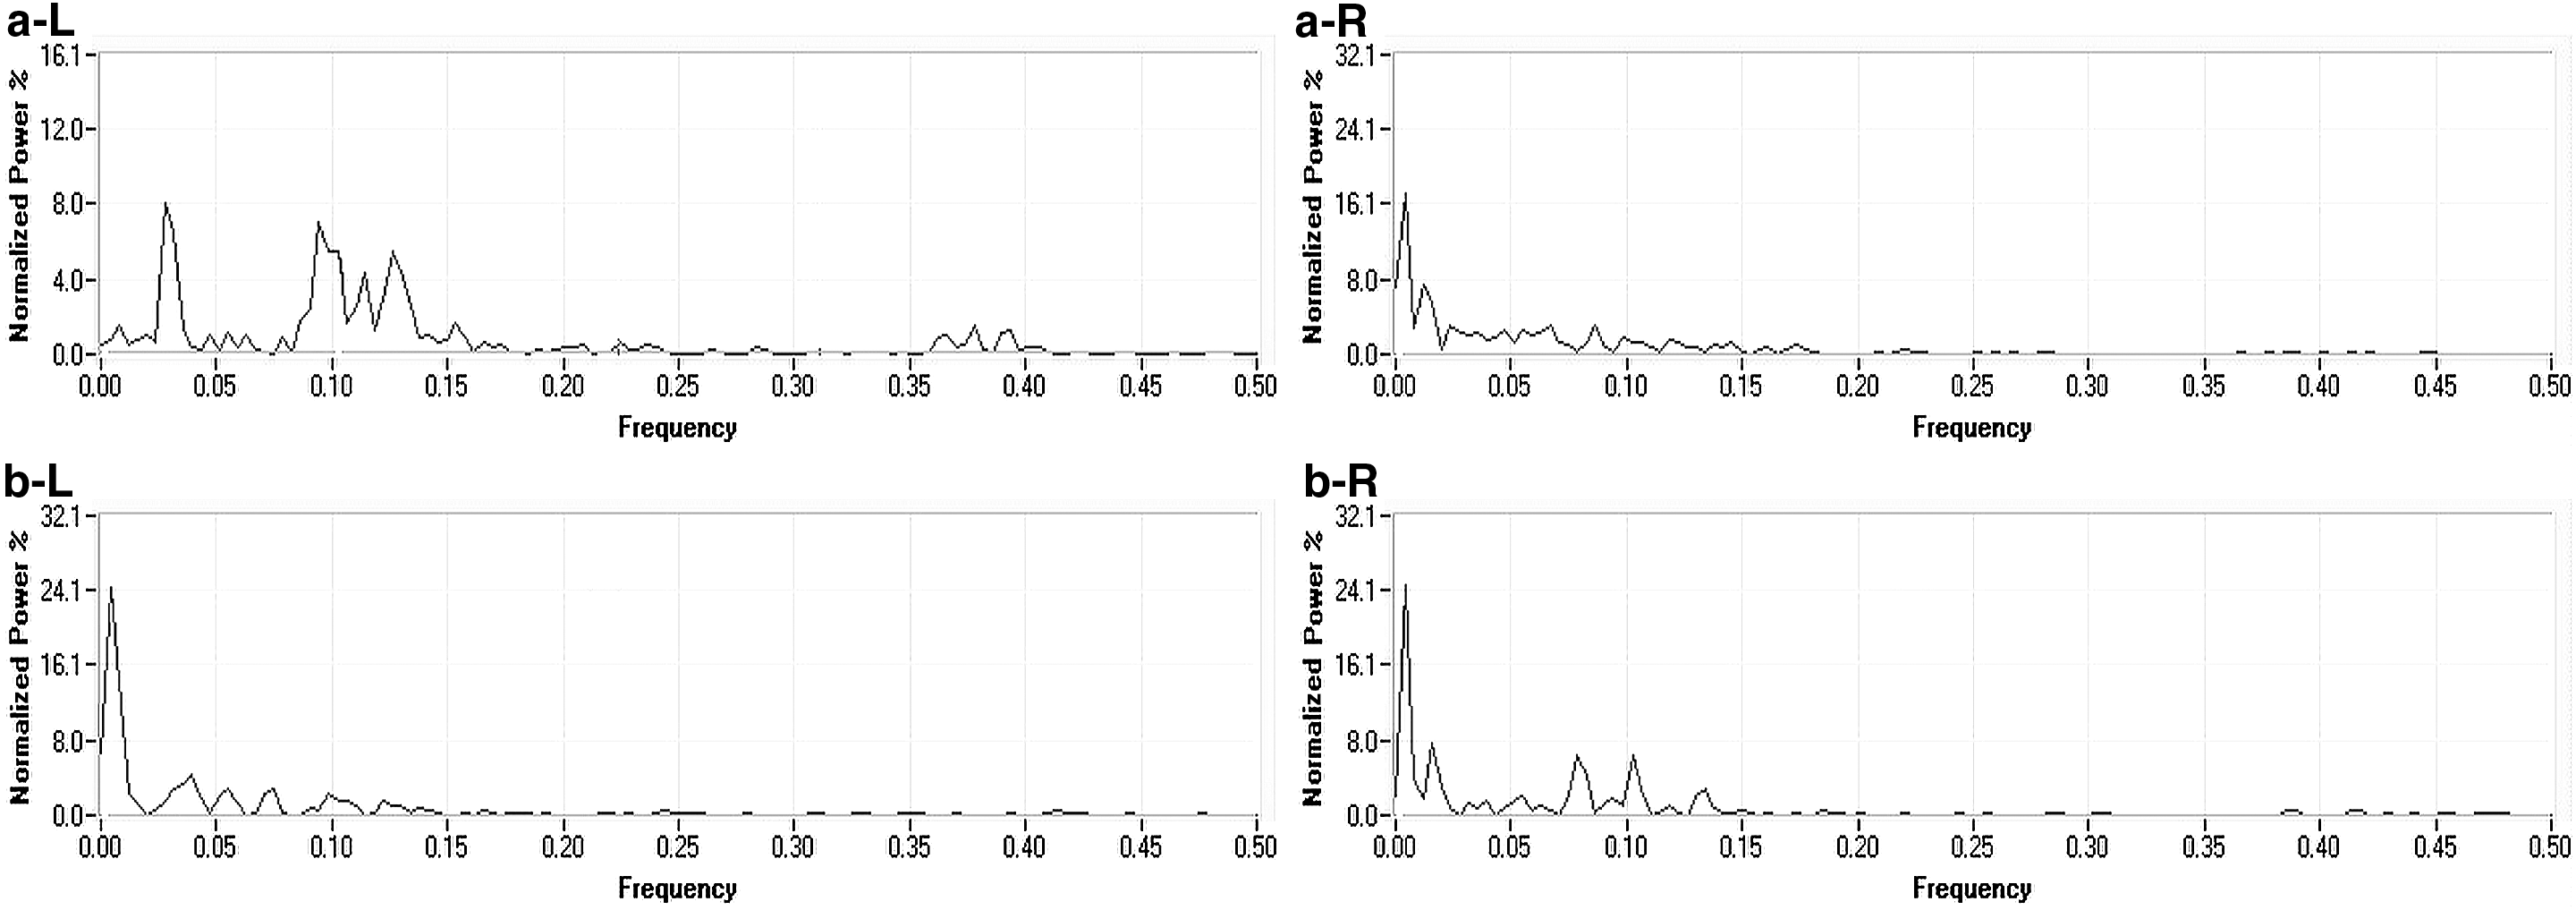
The figure shows effect of administration of sulfur in 1 M potency on HRV in two asymptomatic subjects. In first case (left side), all the three peaks were present before administration
ANS, autonomic nervous system; HF, high frequency; HRV, heart rate variability; LF, low frequency; REM, rapid eye movement; VLF, very low frequency.
The Central Council for Research in Homoeopathy (CCRH), Department of Ayush, Government of India, and Father Muller Homeopathic Medical College (FMHMC), Mangalore, took cognizance of these studies and initiated their research program in this direction with active collaboration of Electronics Division (ED), BARC. 1,17 Their studies were carried out on a larger sample size with a predefined protocol and meticulous methodology at Regional Research Institute of CCRH, Mumbai and Bhubaneswar, and Research Department, FMHMC, Mangalore. Significant deviation in their protocol from that of ED, BARC, study was three or five readings in each setting in place of one and coherent averaging 9 of PSD for analysis of pre- and postintervention data to take care of statistical fluctuations. Table 2 gives the outcome of these studies in terms of spontaneous response, which is ranging from 11% to 29% in CCRH and FMHMC studies.
BARC, Bhabha Atomic Research Centre; CCRH, Central Council for Research in Homoeopathy; ED, Electronics Division; FMHMC, Father Muller Homeopathic Medical College; PA, peak amplitude; RRI, Regional Research Institute.
While analyzing CCRH data, it was observed that some of the obvious responses were deleted during the process of coherent averaging of PSD. It indicated that the averaging not only minimized noise but also the detection efficiency. Hence graphical analysis (Fig. 3) was brought in to retain the detection efficiency. Since the detection had been manual, the response detection criterion was kept simple, that is, postintervention value >50% of the highest or less than half of the lowest preintervention value.
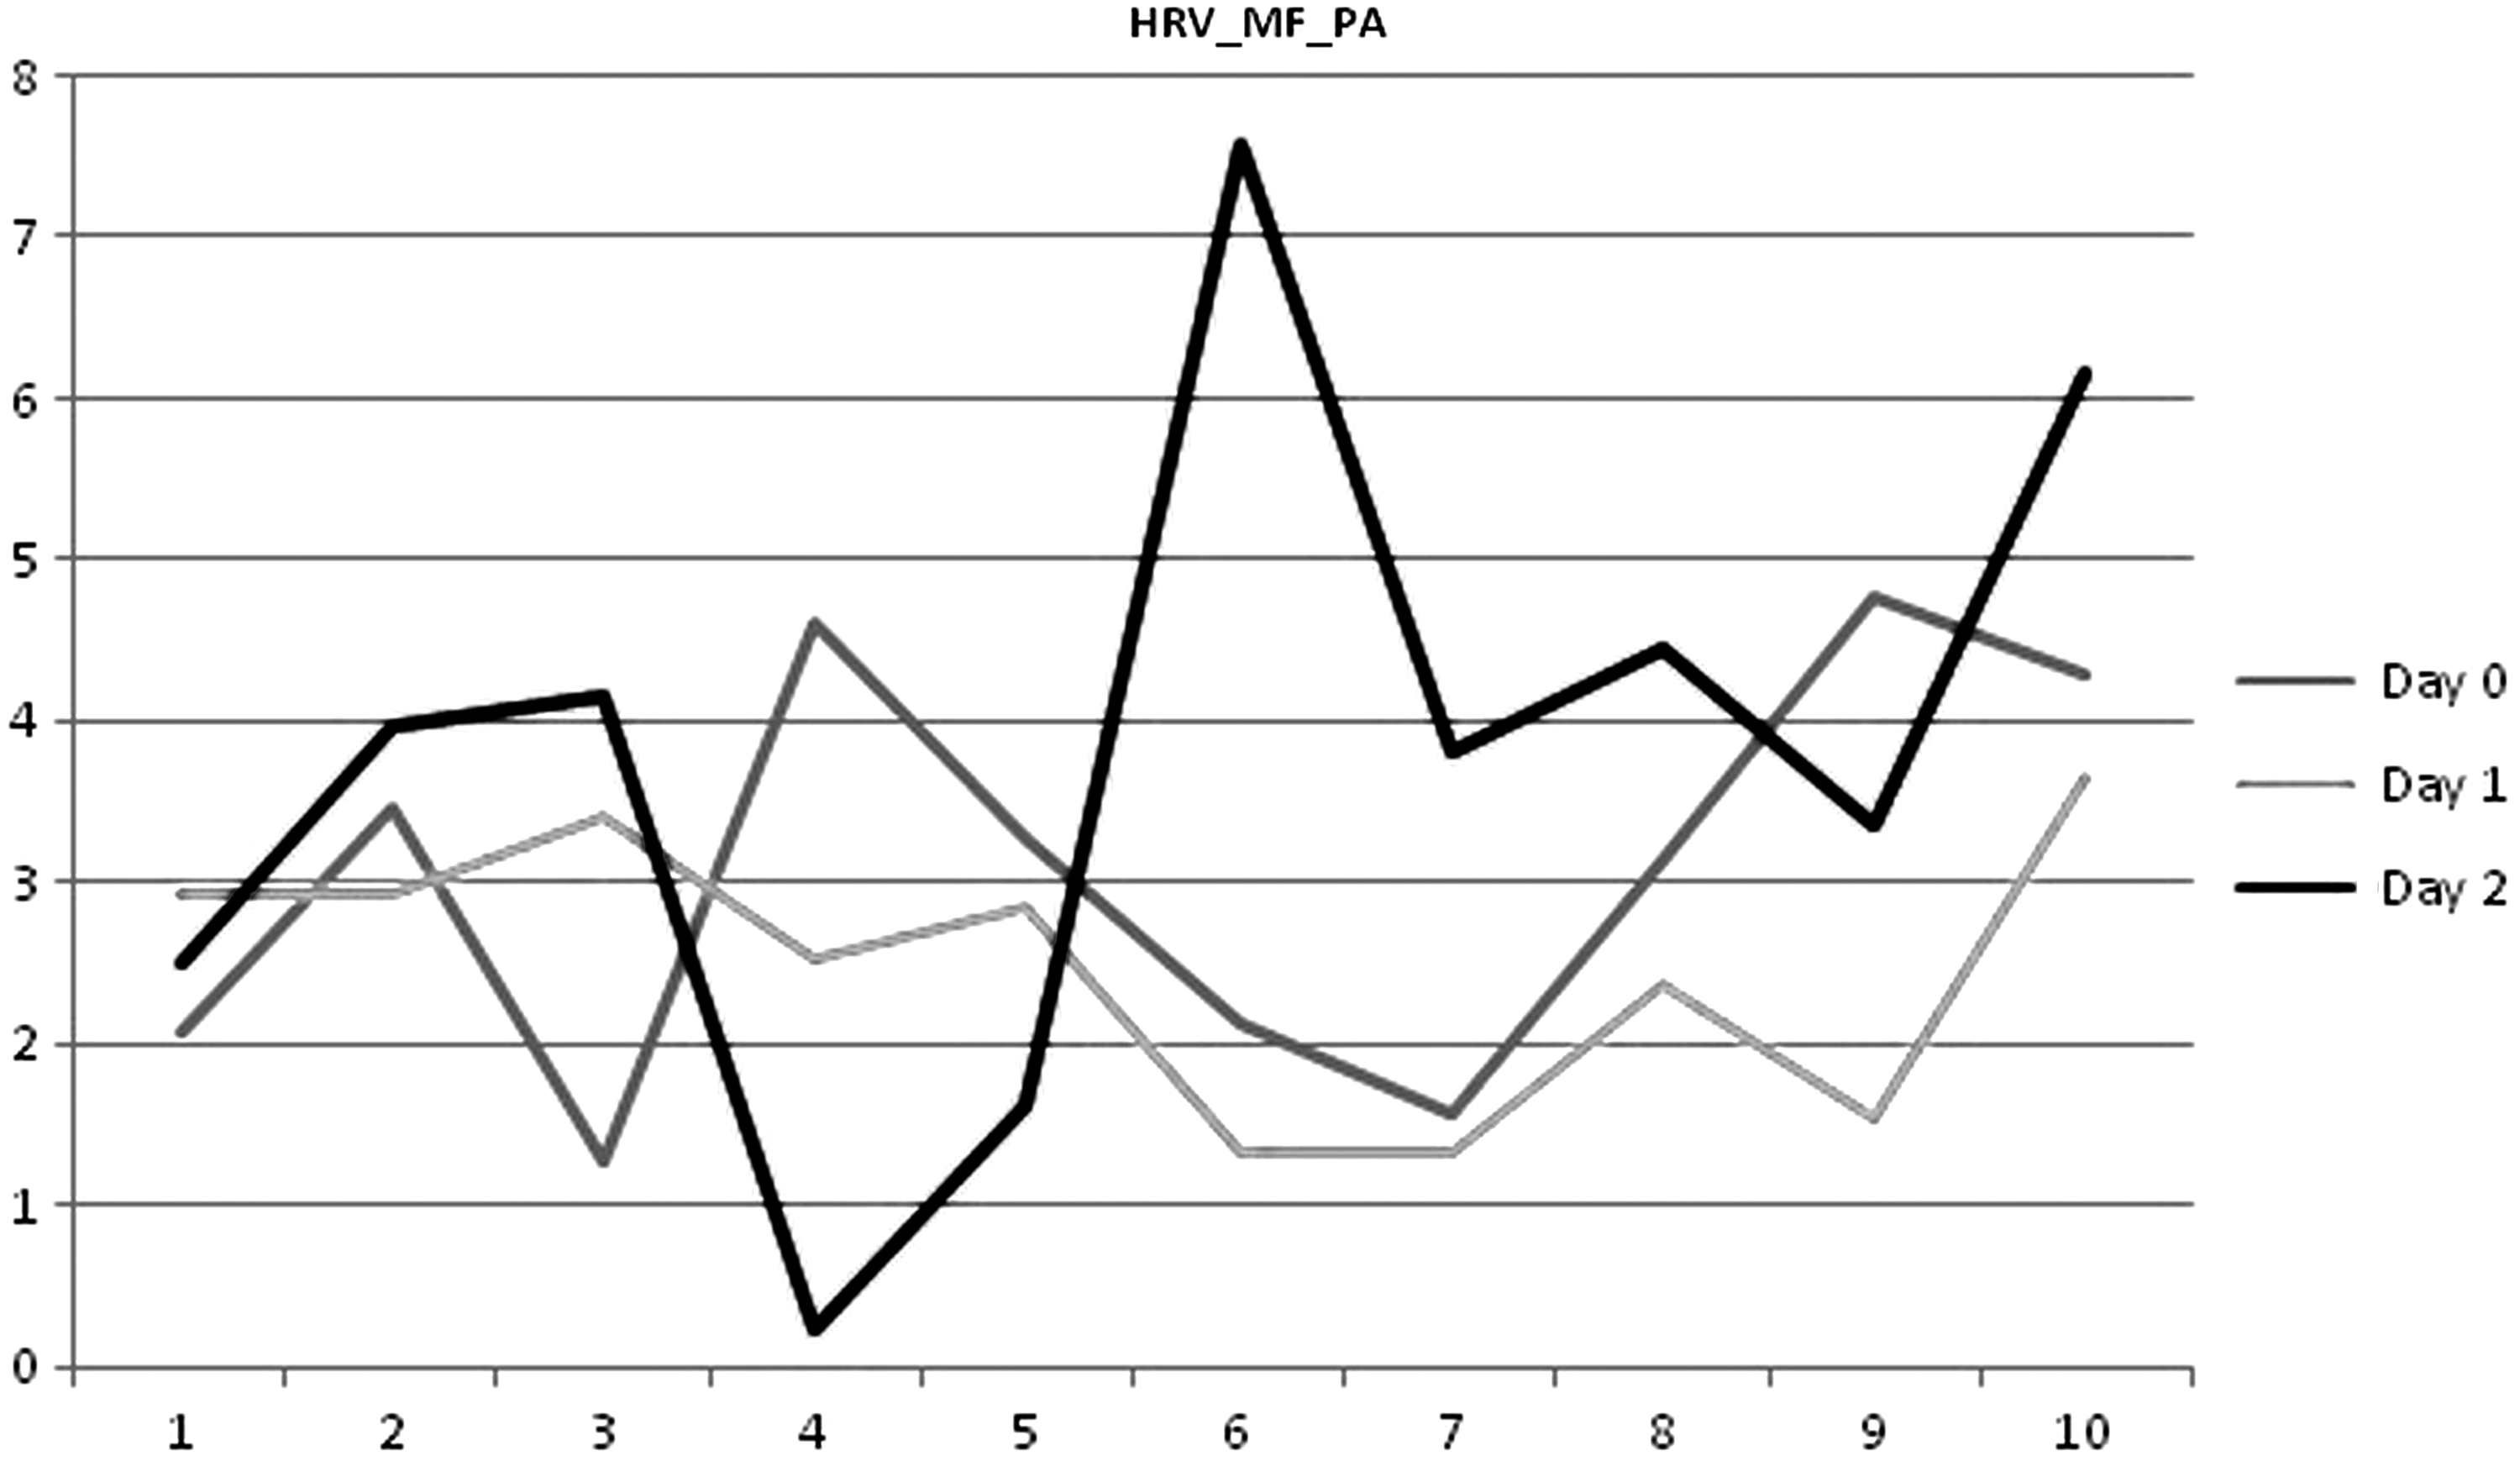
The figure shows detection of a spontaneous response using dynamic graphical analysis. On Y-axis, numerical value of a parameter (HRV_MF_PA: pulse amplitude of midfrequency peak in heart rate variability spectrum) is plotted against the observation number (X-axis) on a particular day. As shown in the figure, gray, light gray, and black lines represent data on anxiety day, placebo day, and intervention day, respectively. Response is said to exist, if the black line is significantly higher or lower (>50%) from sixth observations onward than rest of the data including gray and light gray lines. HRV, heart rate variability; MF, medium frequency, same as low frequency; PA, peak amplitude.
In all the mentioned studies, nearly 40,000 data files were generated. Recording and processing of one data file required about 35 min. On 24 × 7 h basis, this meant 1000 man-days. Outcome of data acquired and processed with such great human effort became dependent on subjective analysis by an expert. Necessity to efficiently strengthen the analysis of data files paved the idea to develop application software to perform automatic analysis and test the same on actual data. The development of the application software and its validation are briefly described in this article.
Materials and Methods
Interventional data on physiologic variability (PV) have been acquired from 210 control subjects using PPA at FMHMC, Mangalore, under sponsored research project from BRNS, namely “Evaluation of action of homeopathic medicines in various potencies using medical analyzer.” The study protocol was approved by the Institution's Ethics Committee. Subjects for the study were recruited from among the staff members of the institution and under-graduate and post-graduate students with their prior informed and written consent. Those suffered in the recent past (past 6 months) and needed hospitalizations were excluded from the study. In every control subject, data have been recorded on 7 different days, each recording separated by roughly 30 days, hereafter referred to as round 1 till round 7. On test days, post-15 min of initial rest, with the subject in supine position, five readings each for a duration of 5 min have been recorded before and after the administration of placebo/medicine without any significant break. Placebo was administered in round 1 and round 2 and termed as anxiety and placebo intervention, respectively. Medicine was administered in round 3 to round 7 in potencies 6C, 30C, 200C, 1000C (1 M), and 10,000C (10 M), respectively. However, in round 3 to round 7, placebo was administered in place of medicine to 10–12 subjects for every medicine to isolate unstable parameters. Five different medicines (M1: Apis Mel., M2: Calcarea Carb., M3: Cocculus Indica, M4: Lycopodium, and M5: sulfur) were administered, in the mentioned potencies, to each subgroup of 40–44 subjects as given in Table 3.
R1, round 1; R7, round 7.
Raw data acquired using PPA were then processed for obtaining HRV, peripheral BFV (PBFV), and morphology index variability (MIV) parameters in an Excel sheet. These data are represented graphically as shown in Figure 3 for each parameter and round in every subject and manually analyzed for detecting the responses using the following criteria. If the value of a parameter increased after intake of medicine to >1.5 times of the highest value or less than half of the lowest value during anxiety, placebo, and premedicine round, the response was said to be present.
The application software, Automatic Analysis of Intervention in the Field of Homeopathy (AAIFH) was developed at ED, BARC, and Bio-Medical Engineering (BME) Department, MGM's College of Engineering and Technology (MGMCET), Kamothe, Navi Mumbai. The software is capable of analyzing the processed data for 33 PPA parameters. A user can input fields such as number of trial days, number of parameters, number of subjects, number of readings per subject, and number of reference readings in the graphic user interface.
Data file to be processed can be selected by clicking on “Load” button on the front screen or from the menu bar. The application processes only “csv” format files. The software application reads the file and displays the graphs for anxiety, placebo, and medicine day for the first subject data in the file. For viewing graphs of other subjects, one can select the subject name from the drop down menu on the top of the graphs tab.
Figure 4 shows the algorithm used for identifying the presence of a response in the given number of subjects (n) and number of parameters (p). The program reads the number of reference readings (r) and number of postmedicine readings (m) from the graphic user interface (GUI) (source codes are listed in the Supplementary Appendix; Supplementary Data can be found at
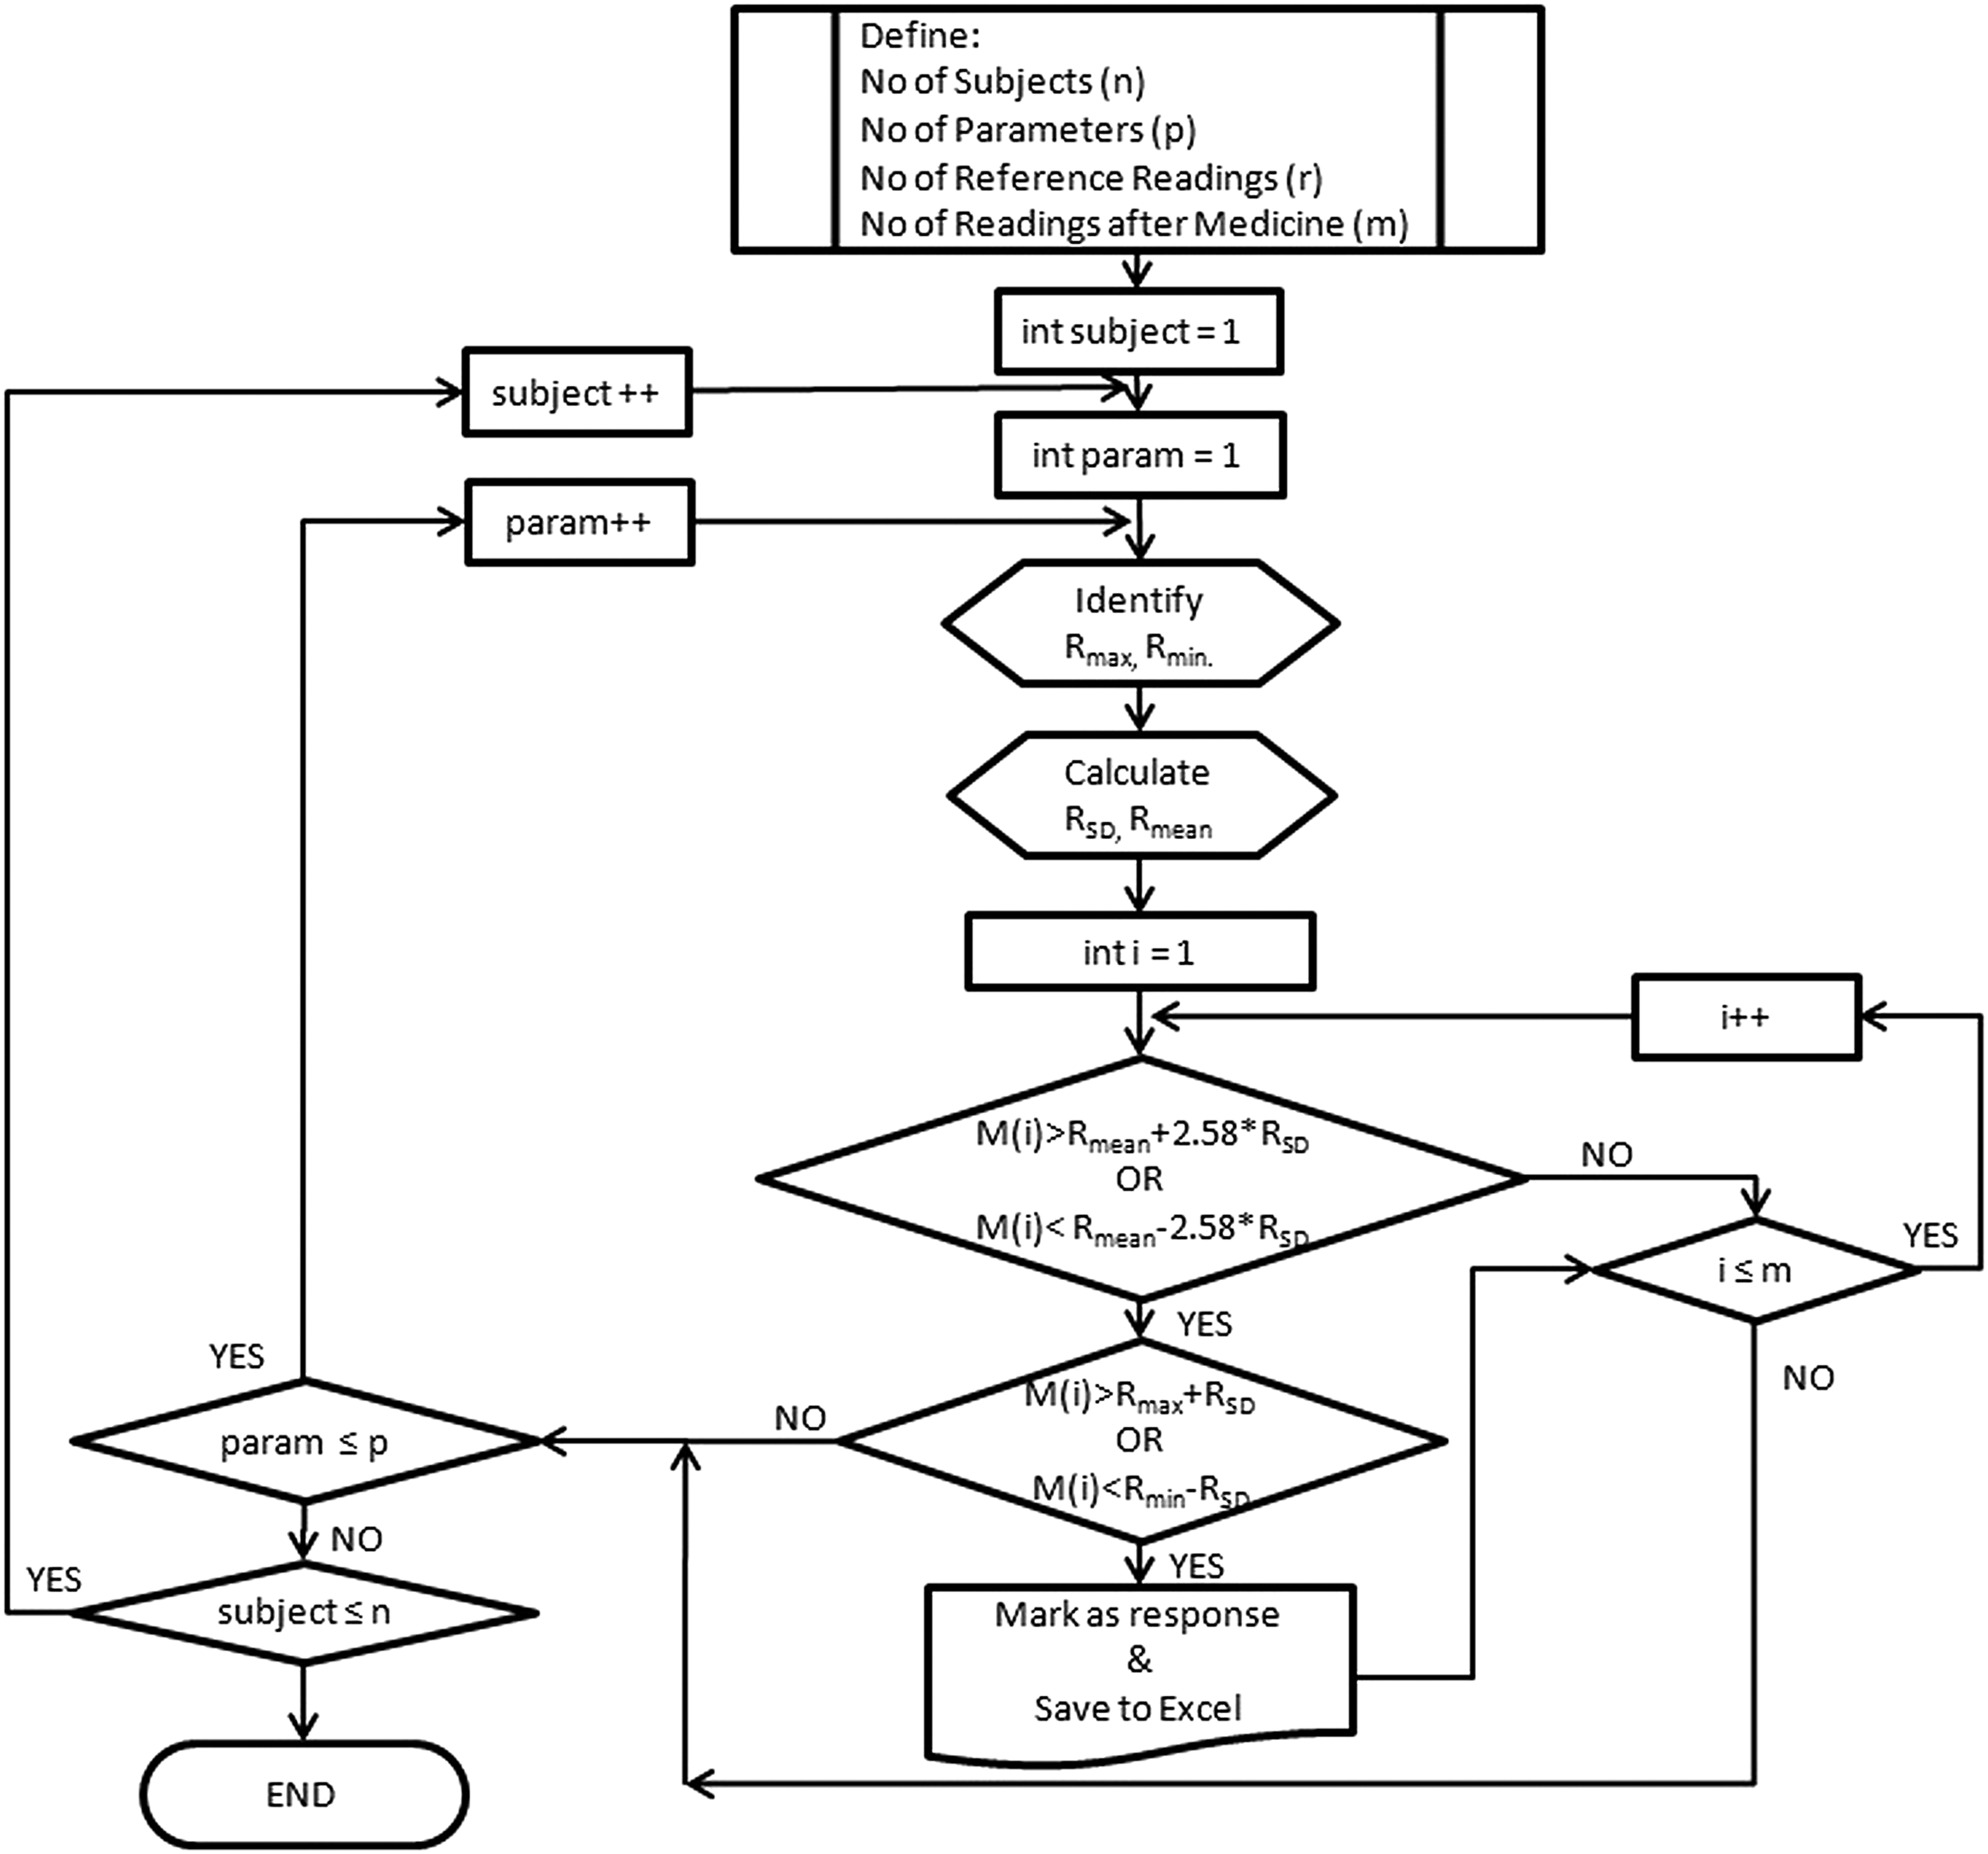
Flow chart of the algorithm.
The program begins with the subject number and parameter number set to 1. From the reference readings, the program identifies Rmax and Rmin value and also computes the values of Rmean and RSD of all the reference readings. It then takes the first postmedicine value [M(1)] and compares as follows:
If yes, the program goes on to check further as follows:
If yes, a response is detected and program goes to the next parameter of the same subject. When all parameters of a subject are investigated, the program investigates the next subject and so on.
If case 1 or 2 is not satisfied, the program automatically checks the next reading of the same parameter (M(i); i ≤ m) till all the “m” readings are examined. If no response is detected, the program goes for investigating the next parameter and the steps already explained are repeated. Response is marked as “1” if present and as “0” when absent. When all the parameters for a subject are examined, the program repeats the process for the next subject till all subjects are examined. A consolidated table is saved in Excel sheet. The response tables thus generated are then compared with the results of manual analysis.
Results
Table 4 gives the result of manual analysis of Apis group. It shows only 11 parameters in place of 33 as the remaining 22 parameters recorded artifacts after administration of placebo. Table 5 gives results of AAIFH for the same group in the same manner as in Table 4. Similar responses for other medicines are included in Table 6. It summarizes the response detected for all five medicines. As can be seen from Table 6, the efficiency of response detection while using AAIFH improves by 12.96% in comparison with that of responses of manual detection. The 12.96% of improved results can be perceived as false positives (detection of an event when it is actually absent) by AAIFH, if not for the careful manual inspection, which revealed that these additional responses were detected due to criterion given in Equation (2) in place of empirical threshold of 50% used in manual analysis. Also AAIFH detected all the cases found in manual analysis; there was no case of false negative (omission in detection of an event when it is actually present). Hence results of automated analysis are 12.96% better than those of manual process.
BF_ALF, area under LF peak in PBFV; BF_AVLF, area under VLF peak in PBFV; BF_FcHF, center frequency of HF peak in PBFV; BF_FcVLF, center frequency of VLF peak in PBFV; HF, high frequency; HRV, heart rate variability; HRV_AVLF, area under VLF peak in HRV; HRV_FcLF, center frequency of LF peak in HRV; HRV_FcLF, center frequency of LF peak in HRV; LF, low frequency; MI_A (abs) LF, absolute power of LF peak in MIV; MI_ALF, area under LF peak in MIV; MI_Avg, average value of morphology index; MI_AVLF, area under VLF peak in MIV; MI_FcHF, center frequency of HF peak in MIV; MIV, morphology index variability; PBFV, peripheral BFV; VLF, very low frequency.
BF_ALF, area under LF peak in PBFV; BF_AVLF, area under VLF peak in PBFV; BF_FcHF, center frequency of HF peak in PBFV; BF_FcVLF, center frequency of VLF peak in PBFV; HF, high frequency; HRV, heart rate variability; HRV_AVLF, area under VLF peak in HRV; HRV_FcLF, center frequency of LF peak in HRV; LF, low frequency; MI_A (abs) LF, absolute power of LF peak in MIV; MI_ALF, area under LF peak in MIV; MI_Avg, average value of morphology index; MI_AVLF, area under VLF peak in MIV; MI_FcHF, center frequency of HF peak in MIV; MIV, morphology index variability; PBFV, peripheral BFV; VLF, very low frequency.
PHA, pulse harmonic analysis; PPA, Peripheral Pulse Analyzer.
Table 6 also shows automatic analysis of another process, namely pulse harmonic analysis (PHA), on the same data set. It is significant to note that 28 subjects out of 43 of these responsive subjects (65%) are common to both PPA and PHA methods and thus indicate the certainty of response.
In the past years, as the analysis was manual, it highly depended on the dexterity of the person analyzing the results. This also led to delay in analysis due to nonavailability of the analysis experts. The outcome was certainly not free from subjective bias of the analyzing expert. This is the first time a complete analysis process has been automated explicitly for this purpose. However, processing of data files still requires manual edits as per the task force recommendation 10 and automation efforts are deemed necessary in this direction for wider acceptance of this modality.
It is interesting to observe that the same data have been processed for PHA introduced by Jindal et al., 18 yielding 52 parameters and analyzed using AAIFH. Responses in PHA parameters detected using this utility, as given in Table 6, are of the same order as those of PPA. PHA has detected 385 responses in contrast to 272 responses of PPA. Since PHA expresses cardiovascular indices in contrast to autonomic indices of PPA, difference in response can be attributed to affinity of the medicine to these systems and also individual susceptibility of the subject. Also 65% of the responsive subjects were common to PPA and PHA. This indicates that the AAIFH application software is versatile and can work with input data acquired and processed by any system, if the numbers required by the software application are clearly specified. Since processing time for PHA is negligibly small and without human error, it can be a method of choice for complete automation in future investigations.
Discussion
In the past, some scientific studies have conclusively indicated that homeopathic medicines have only placebo effects. 19 This aspect is negated by this study since 65% of the subjects showing response are common to PPA and PHA analyses. Since both the systems are detecting response, it demonstrates the susceptibility of these responsive subjects to the homeopathic medicines. It is also important to mention that homeopathic medicines were administered to normal subjects and, therefore, responses observed by PPA or PHA exhibit proving aspect of homeopathic medicines.
It is necessary to explain why only 43 out of 210 control subjects have responded to administration of homeopathic medicine. Except feasibility experiments, in ED BARC (Table 2), this number has not gone beyond 29% in any of the previous studies. On one hand, consistency in the percentage of responses in all the studies conducted till date demonstrates the robustness of modalities as well as methodology; on the other hand, the results indicate a need for a better protocol to improve response yield of the studies. A retrospective analysis of all studies suggests that the hypothesis of detecting response within 30 min of administration of the medicine is empirical and needs serious review. What is the ideal time? Homeopathy, being a system more dependent on individual sensitivity and susceptibility, it is very difficult to define an ideal time to observe a response. It may be few seconds in one case or a few days in another. Since protocol needs strict definition, it is difficult to specify variable elapsed time. In view of the mentioned, it is reasonable to consider the instant of appearance of symptoms, to be proving in a subject as the correct time for observing e-response. In such cases, changes observed in PPA or PHA parameters can be classified in specific templates for different medicines. As an illustration, depressed activity in LF and HF regions shown in Figure 2 can be considered as electronic proving (e-proving) of sulfur. Any such template observed in a patient will indicate corresponding medicine for treatment, provided it is prospectively confirmed in an appropriate treatment population.
Modern medicine presently uses variability parameters during intensive care monitoring to see the therapeutic response and prognosis in patients. In this article, response to homeopathic medicine has been detected with same modality using software application AAIFH. It is noteworthy that the application of variability study and automatic analysis is not only limited to the field of homeopathy but can also be used as an objective assessment tool for a variety of treatments and mind–body practices (controlled breathing, relaxation methods, etc.) that can influence ANS activity. To be more specific, changes observed during mind–body practices might be used as baseline for understanding the magnitude of effect of homeopathy.
Conclusions
Pre- and postintervention variability/harmonic study is able to detect and objectively demonstrate action of homeopathic medicines in higher potencies wherein medicinal material does not exist as per Avogadro's law, thus paving the way for e-proving of homeopathic medicines. PHA, being fully automatic, has potential to become a method of choice for such studies. PV is important from the view point that it reflects functioning of ANS. It is likely that some medicines have decided affinity for vegetative sphere and they can be better studied with the help of PPA parameters. Therefore, automatic processing of PPA data should be undertaken at priority. For improving the response yield of e-proving, the study protocol may include recording of objective data on appearance of symptoms during proving.
Footnotes
Acknowledgments
The authors are grateful to the Board of Research in Nuclear Sciences, Department of Atomic Energy, Government of India, for financially sponsoring research projects at Father Muller Homeopathic Medical College, and to Mrs. Anita Behere, Head Electronics Division, Bhabha Atomic Research Centre and Dr. Santosh K. Narayankhedkar, Principal, MGM's College of Engineering and Technology, for facilitating smooth progress of this research work. Shri Vineet Sinha, Scientific Officer (F), Electronics Division, BARC, for making the PPA instruments available for the projects; Dr. B. Mullai for helping in data acquisition; Smt. Gouri Sawant for processing of the volumes of data; Kum. Manasi Sawant and Smt. Jyoti V Jethe for their support during analysis of the data; Dr. T.S. Ananthakrishnan and Mrs. Vidya S. Murthy for useful inputs in revising the article are gratefully thanked.
Author Disclosure Statement
No potential conflict of interest exists among authors.
References
Supplementary Material
Please find the following supplemental material available below.
For Open Access articles published under a Creative Commons License, all supplemental material carries the same license as the article it is associated with.
For non-Open Access articles published, all supplemental material carries a non-exclusive license, and permission requests for re-use of supplemental material or any part of supplemental material shall be sent directly to the copyright owner as specified in the copyright notice associated with the article.